1. Introduction
Transportation is one of the major sectors that emit greenhouse gas (GHG). World GHG emissions from transportation sector accounted for one quarter of total emissions in 2016, a 71% increase compared to 1990. The highest absolute increase was in road transportation with an overall 74% increase in the share of road transport emissions. Most of the transportation sector’s GHG emissions result from fossil-fuel combustion. In 2013, Korea’s GHG emissions from the transportation sector accounted for 12.6% of total emissions—below the world average. However, their growth rate is higher than those from the industrial or power sectors. This high growth rate is due to an increase in vehicle use due to economic growth.
According to the Intended Nationally Determined Contributions (INDC) which was submitted to the United Nations Framework Convention on Climate Change (UNFCCC) in 2015, Korea plans to reduce its GHG emissions by 37% from the business as usual (BAU) level by 2030. According to the 2018 GHG reduction roadmap from the Korean government, the targets for reducing GHG emissions by sector have been set. The target for GHG reduction in the industrial and transportation sectors are 20.5% and 29.3% compared to BAU, respectively. The transportation sector has a higher potential for GHG reduction than the industrial sector. In particular, the shift to eco-friendly vehicles, such as electric, hydrogen, and hybrid vehicles, can lead to rapid reductions in GHG emissions. To meet GHG emissions reduction goals in the transportation sector, the Korean government has introduced various reduction regulations such as average fuel efficiency standard, average GHG emissions standard, and the promotion of electric vehicles. However, for more efficient reduction in GHG emissions in the transportation sector, it is necessary to identify the factors that contribute to the increase in GHG emissions from this sector.
Generally, factor decomposition analysis is widely used to analyze the factors that increase GHG emissions. Despite vast research into this area, the factors involved have varied depending on the objects of analysis. The main decomposition methods can be divided into two groups: The Laspeyres and Divisia Indexes. The Logarithmic Mean Divisia Index (LMDI) method—a Divisia Index—is overwhelmingly preferred due to its advantages in meeting the factor-reversal test, and that it leaves no unexplained residual during decomposition. LMDI methods can be divided into either additive or multiplicative decompositions. The former, introduced by Ang et al. [
1], decomposes the difference in the amount yielded at two points in time, while the latter, suggested by Ang and Liu [
2], decomposes the ratio of change with respect to the base year. Both additive and multiplicative methods were applied to the decomposition analysis in this study.
Multiple studies have investigated factors influencing carbon emissions in the transportation sector including those by Mazzarino [
3], Kwon [
4], Lu et al. [
5], Timilsina and Shrestha [
6], Wang et al. [
7], Zhang et al. [
8], Mishalani et al. [
9], Wang and Liu [
10], Fan and Lei [
11], and Liang et al. [
12].
Studies using the LMDI methodology include those by Timilsina and Shrestha [
6], Wang et al. [
7], Zhang et al. [
8], and Liang et al. [
12], which analyze different countries and periods. Timilsina and Shrestha [
6] analyzed GHG emissions in selected Asian countries including Korea from 1980 to 2005. Whereas Wang et al. [
7], Zhang et al. [
8], and Liang et al. [
12] all analyzed different factors affecting GHG emissions in China, from 1985 to 2009, 1980 to 2006, and 2001 to 2014, respectively. Timilsina and Shrestha [
6] decomposed their analysis into six factors representing changes in fuel mix, modal shift, gross domestic product, population, emission coefficients, and energy intensity. Wang et al. [
7] decomposed their analysis into six effects: Population, per capita economic activity, transportation intensity, transportation modal shifting, transportation services share, and emission coefficient effects. Zhang et al. [
8] decomposed their analysis into four effects: The transportation mode effect, the passenger-freight share effect, the energy intensity effect, and the transportation activity effect. Liang et al. [
12] decomposed their analysis into six influencing factors: Energy structure, energy efficiency, transport form, transportation development, economic development, and population size. Except for Zhang et al. [
8], GHG emissions were decomposed into six factors, however, the decomposition methods differed slightly for each study based on data availability and the differences in Kaya identity.
So far, Timilsina and Shrestha [
6] performed the only study analyzing LMDI factor decomposition for GHG emissions from Korea’s transportation sector. The above studies mainly focused on GHG emissions from China’s transportation sector. The LMDI factor analysis relating to Korea’s GHG emissions, including the work by Oh et al. [
13], Kim and Kim [
14], Kim and Jeong [
15], Kim and Park [
16], Lim and Kim [
17], and Park and Kim [
18] focused on the GHG emissions from industry or electricity generation sector. Timilsina and Shrestha [
6], in part, analyzed GHG emissions from Korea’s transportation sector, but their study period was only extended to 2005. However, Korea’s transportation sector has changed drastically since 2005, thus an extended analysis is necessary. In addition, Timilsina and Shrestha’s [
6] study is based on data from the International Energy Agency (IEA) calculated according to the International Panel on Climate Change (IPCC) guidelines. However, the current paper is based on the Korean national GHG inventory for further detailed analysis. To date, LMDI decomposition analysis for GHG emissions of the transportation sector has mostly remained in the form of additive methodology. However, the multiplicative methodology was also performed in this study.
Therefore, this study decomposes GHG emissions in Korea’s transportation sector from 1990 to 2013 using the LMDI decomposition methodology. In particular, GHG emissions in Korea’s transportation sector were decomposed into six factors: The population effect, the economic growth effect (due to the changes in the gross domestic product per capita), the energy intensity effect (due to the changes in energy consumption of transportation sector per gross domestic product), the transportation mode effect, the energy mix effect, and the emission factor effect. These results will provide a baseline for establishing policies to achieve the GHG emission reduction target.
The remainder of this paper is organized as follows.
Section 2 contains the applied LMDI method and data.
Section 3 diagnoses the current state of national GHG emissions in the transportation sector and discusses the related factors influencing GHG emissions. Current GHG mitigation policies in the transportation sector are also discussed.
Section 4 includes the results of the decomposition analysis of GHG emission impact factors on Korea’s transportation sector, and finally,
Section 5 presents the conclusions.
2. Materials and Methods
In the present study, characteristics of GHG emissions from Korea’s transportation sector were analyzed using data corresponding to a time frame of 23 years (1990–2013). This is the first attempt at conducting a decomposition analysis of the transportation-related GHG emission characteristics in Korea. GHG emissions were decomposed into six factors: The population effect, the economic growth effect (due to the changes in the gross domestic product per capita), the energy intensity effect (due to the changes in energy consumption per gross domestic product), the transportation mode effect, the energy mix effect, and the emission factor effect. Both additive and multiplicative LMDI decomposition methods were used to analyze factors involved in the following equation:
where the subscript
i represents the transportation mode and
represents fuel type;
denotes population;
denotes the gross domestic product per capita, where
is gross domestic product;
I is the energy intensity, where
is the total energy consumption from the transportation sector;
denotes the share of the energy consumption of the
i transportation mode in the total transportation energy consumption;
is the share of the
j fuel type in the energy consumption of the
transportation mode; and
denotes the GHG emission coefficient of
j fuel type in the
transportation mode.
Here, the six factors explaining changes in GHG emissions within the transportation sector are explore in more detail. The first factor, the “population effect”, denotes the increase in GHG emissions in proportion to the population, P. The second factor, the “economic growth effect,” reflects the change in GHG emissions in the transportation sector, according to the change in the gross domestic product per capita (). This effect implies that the energy consumption in the transportation sector can change according to an increase in the gross domestic product (GDP) per capita. The third factor, the “energy intensity effect,” reflects the change in energy consumption of transportation sector, in accordance with the change in the energy intensity (I). This effect implies that the energy consumption in the transportation sector can change according to the energy intensity.
The fourth factor, the “transportation mode effect,” indicates changes in the proportion of energy consumption used in the i transportation mode relative to the total transportation energy consumption (. In this case, the higher the proportion of the transportation mode with high-carbon-containing fuel, the more marked the increase in GHG emissions is as a result of this effect. The fifth factor, the “energy mix effect”, means the effect of an increase or decrease in the proportion of the i fuel type energy consumption relative to the total transportation energy consumption (, where the higher the proportion of high-carbon-containing fuel, the greater the increase in GHG emissions becomes as a result.
The sixth factor is the effect caused by the emission coefficients (). That is, the GHG emissions of the i fuel type divided by i fuel type input in the transportation type. Therefore, as this effect increases, GHG emissions increase.
In the multiplicative decomposition method, these factors can be decomposed using Equation (2):
where
denotes the rate of increase in GHG emissions from time point 0 (
) to time point
t (
) that can be decomposed into six effects (
–
).
denotes the rate of increase in GHG emissions incurred by
which is the
kth factor (
Here,
,
,
,
,
, and
represent the rates of increase in GHG emissions due to the population, economic, energy intensity, transportation mode, energy mix, and carbon emission factor effects, respectively. According to the LMDI method given by Ang [
19], the general formulae for the effect of the
kth factor on the right-hand side of Equation (2) are:
where
. Each effect in the right-hand side of Equation (2) can be computed as
Table 1.
In the additive decomposition method, the same factors can be decomposed using Equation (3):
where
denotes the amount of increase in GHG emissions from time point 0 (
) to time point t (
), which can be decomposed into six effects (
–
).
denotes the amount of increase in GHG emissions incurred by
. Here,
,
,
,
,
, and
represent the amounts of increase in GHG emissions due to the population, economic growth, energy intensity, transportation mode, energy mix, and carbon emission factor effects, respectively. According to the LMDI method given by Ang [
19], the general formulae for the effect of the
kth factor on the right-hand side of Equation (3) are:
Each effect in the right-hand side of Equation (3) can be computed as
Table 1.
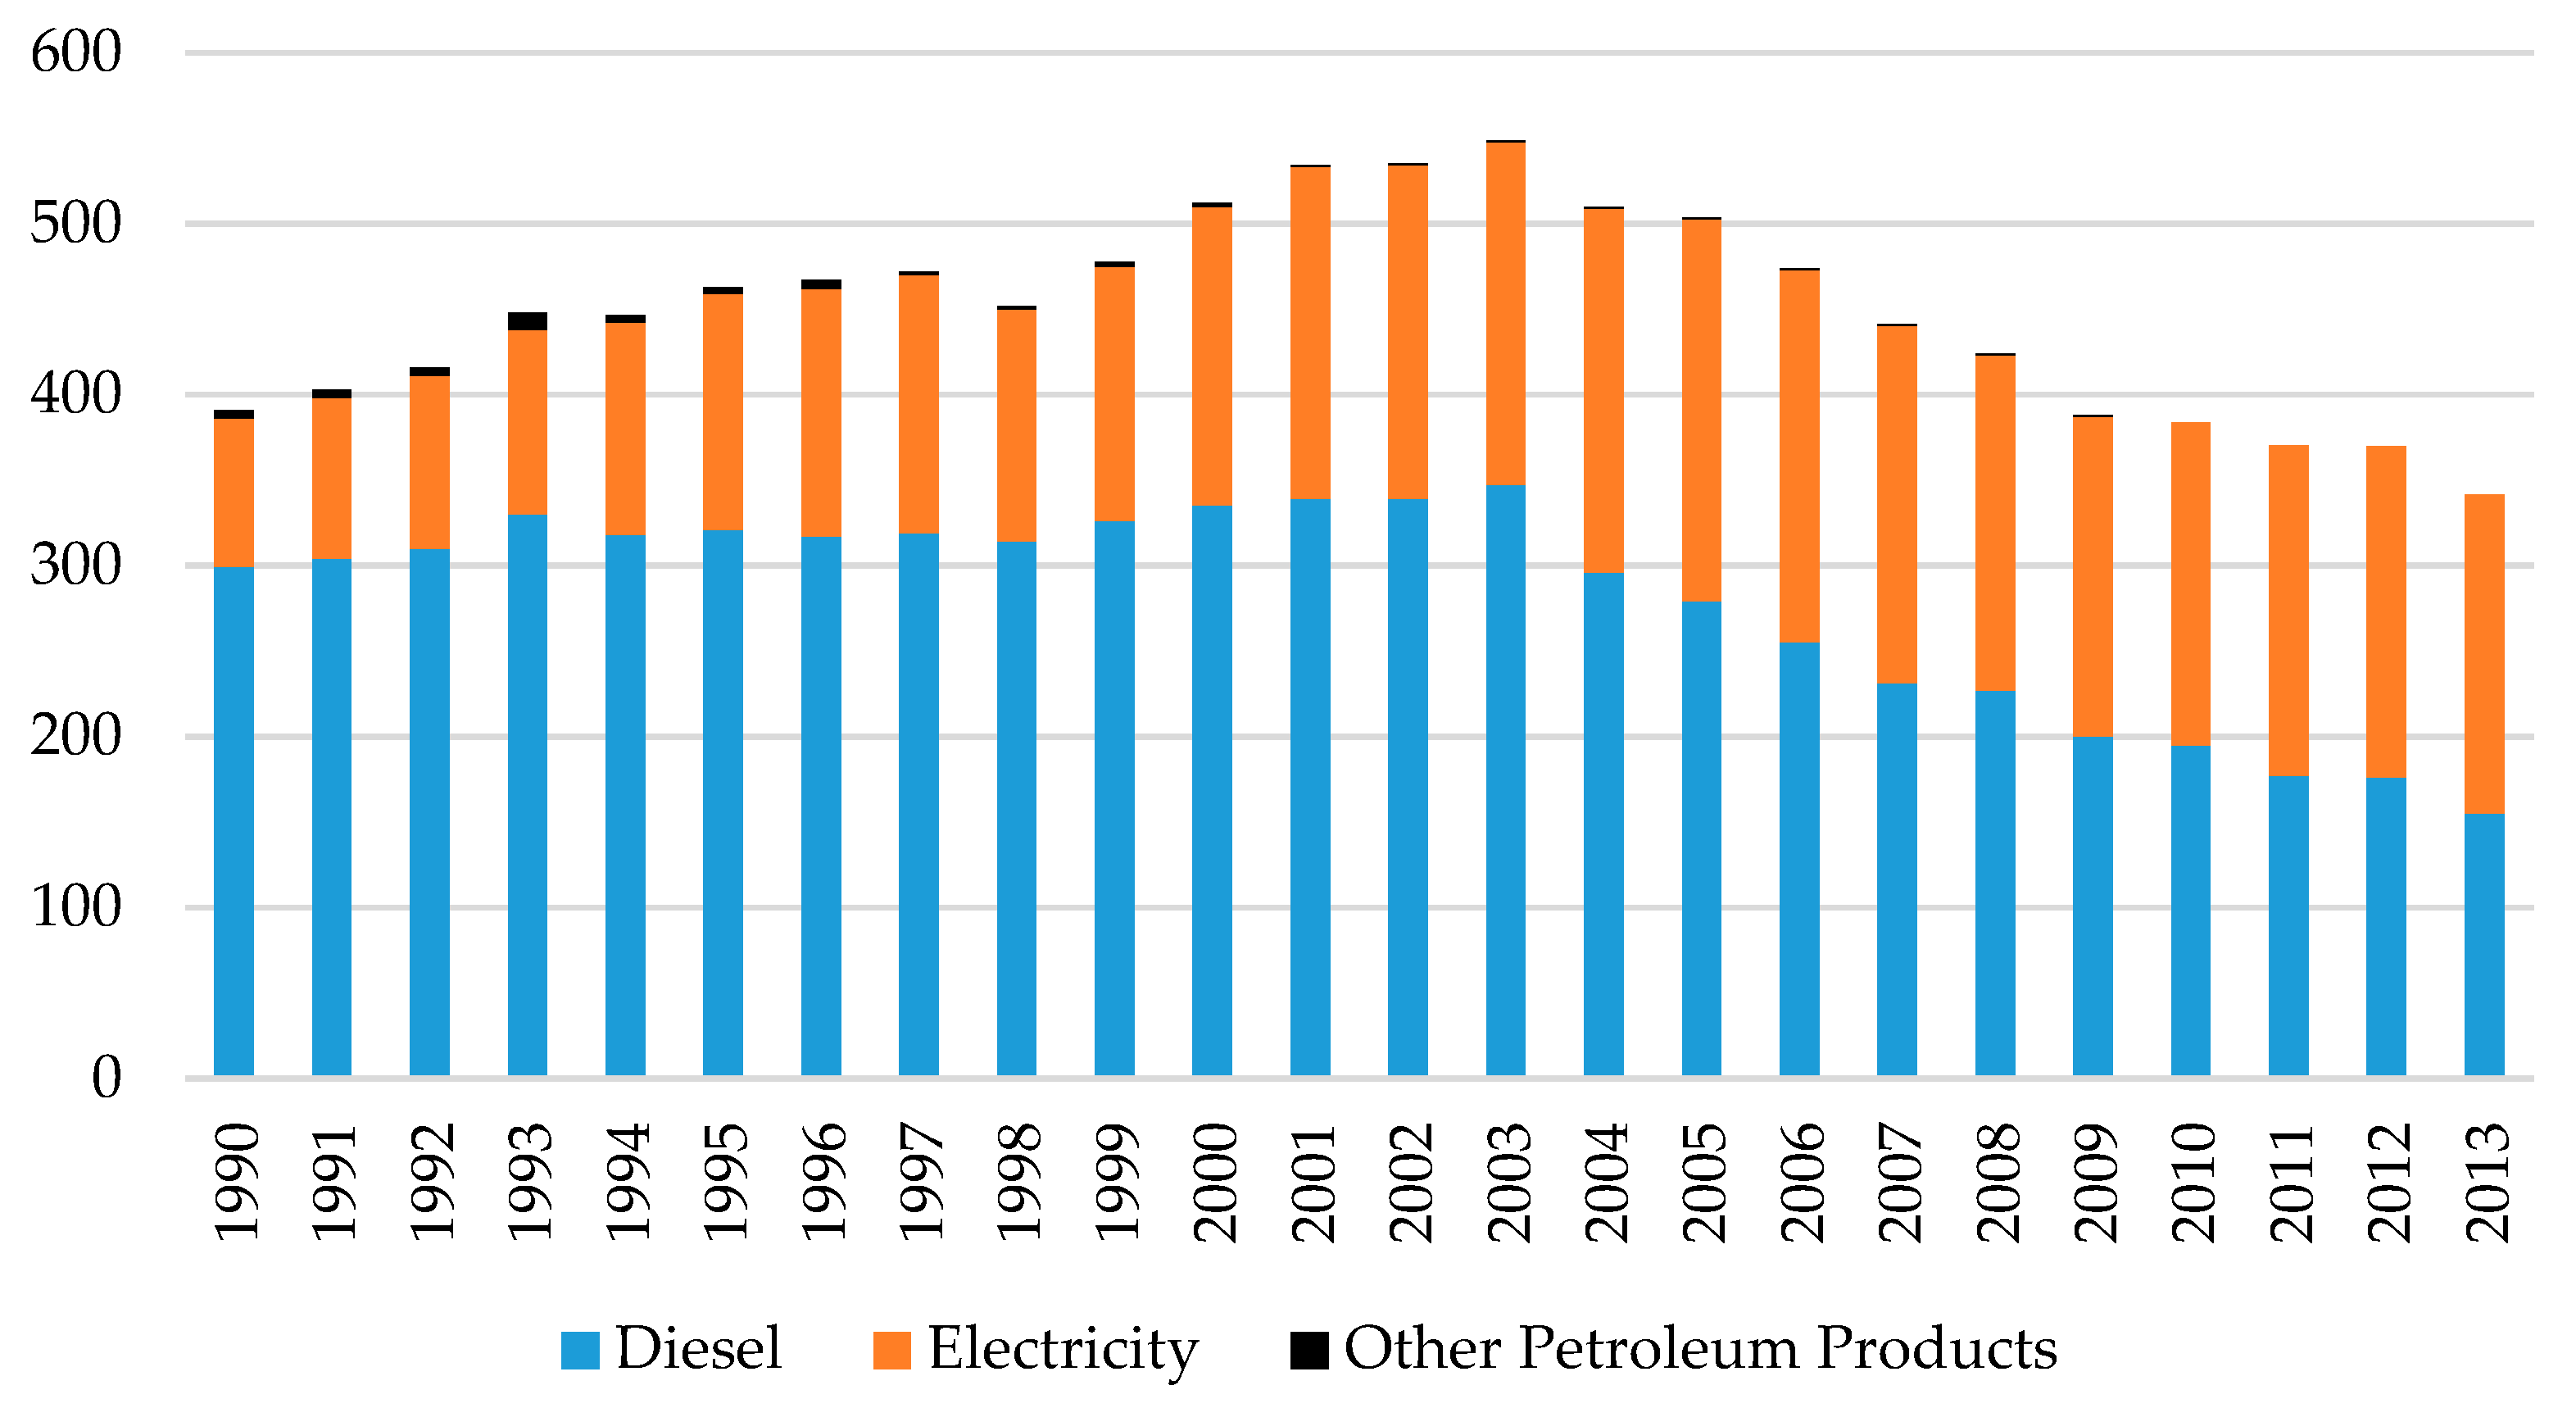
The scope of this study is limited to the transportation sector. The data analyzed relate to the total emissions in the transportation sector, energy consumption by the fuel type of each transportation mode, GHG emissions by the fuel type of each transportation mode, energy consumption of each transportation mode, gross domestic product, and population. The fuels considered include gasoline, diesel, airplane diesel (JA-1, JP-4, AVI-G), liquefied petroleum gas (LPG), other petroleum products (propane, butane, other products), city gas, bio diesel, and electricity. The electricity emissions were also included in this decomposition analysis even though they were not included in national inventory data because electricity is an indirect energy, mostly resulting from rail transportation. The electricity data used in the transportation sector were obtained from the Yearbook of Energy Statistics [
20] published by Korea Energy Economics Institute and converted to the emissions data using a conversion factor (GHG emissions from the generation sector divided by the amount of electricity generation).
All energy-related data used in this study stem from respective annuls of the Yearbook of Energy Statistics published by the Korea Energy Economics Institute. Furthermore, GHG emissions data by fuel type were extracted from the National Greenhouse Gas Inventory Report of Korea [
21] published by the Greenhouse Gas Inventory and Research Center of Korea. Population and gross domestic product (GDP) were obtained from the Korean Statistical Information Service [
22] (KOSIS,
www.kosis.kr).
4. Results
This decomposition analysis is limited to GHG emissions from road, rail, marine, and air transport sectors. GHG emissions from other sectors were excluded from this analysis. This was done to examine the mutual structural changes in these sectors.
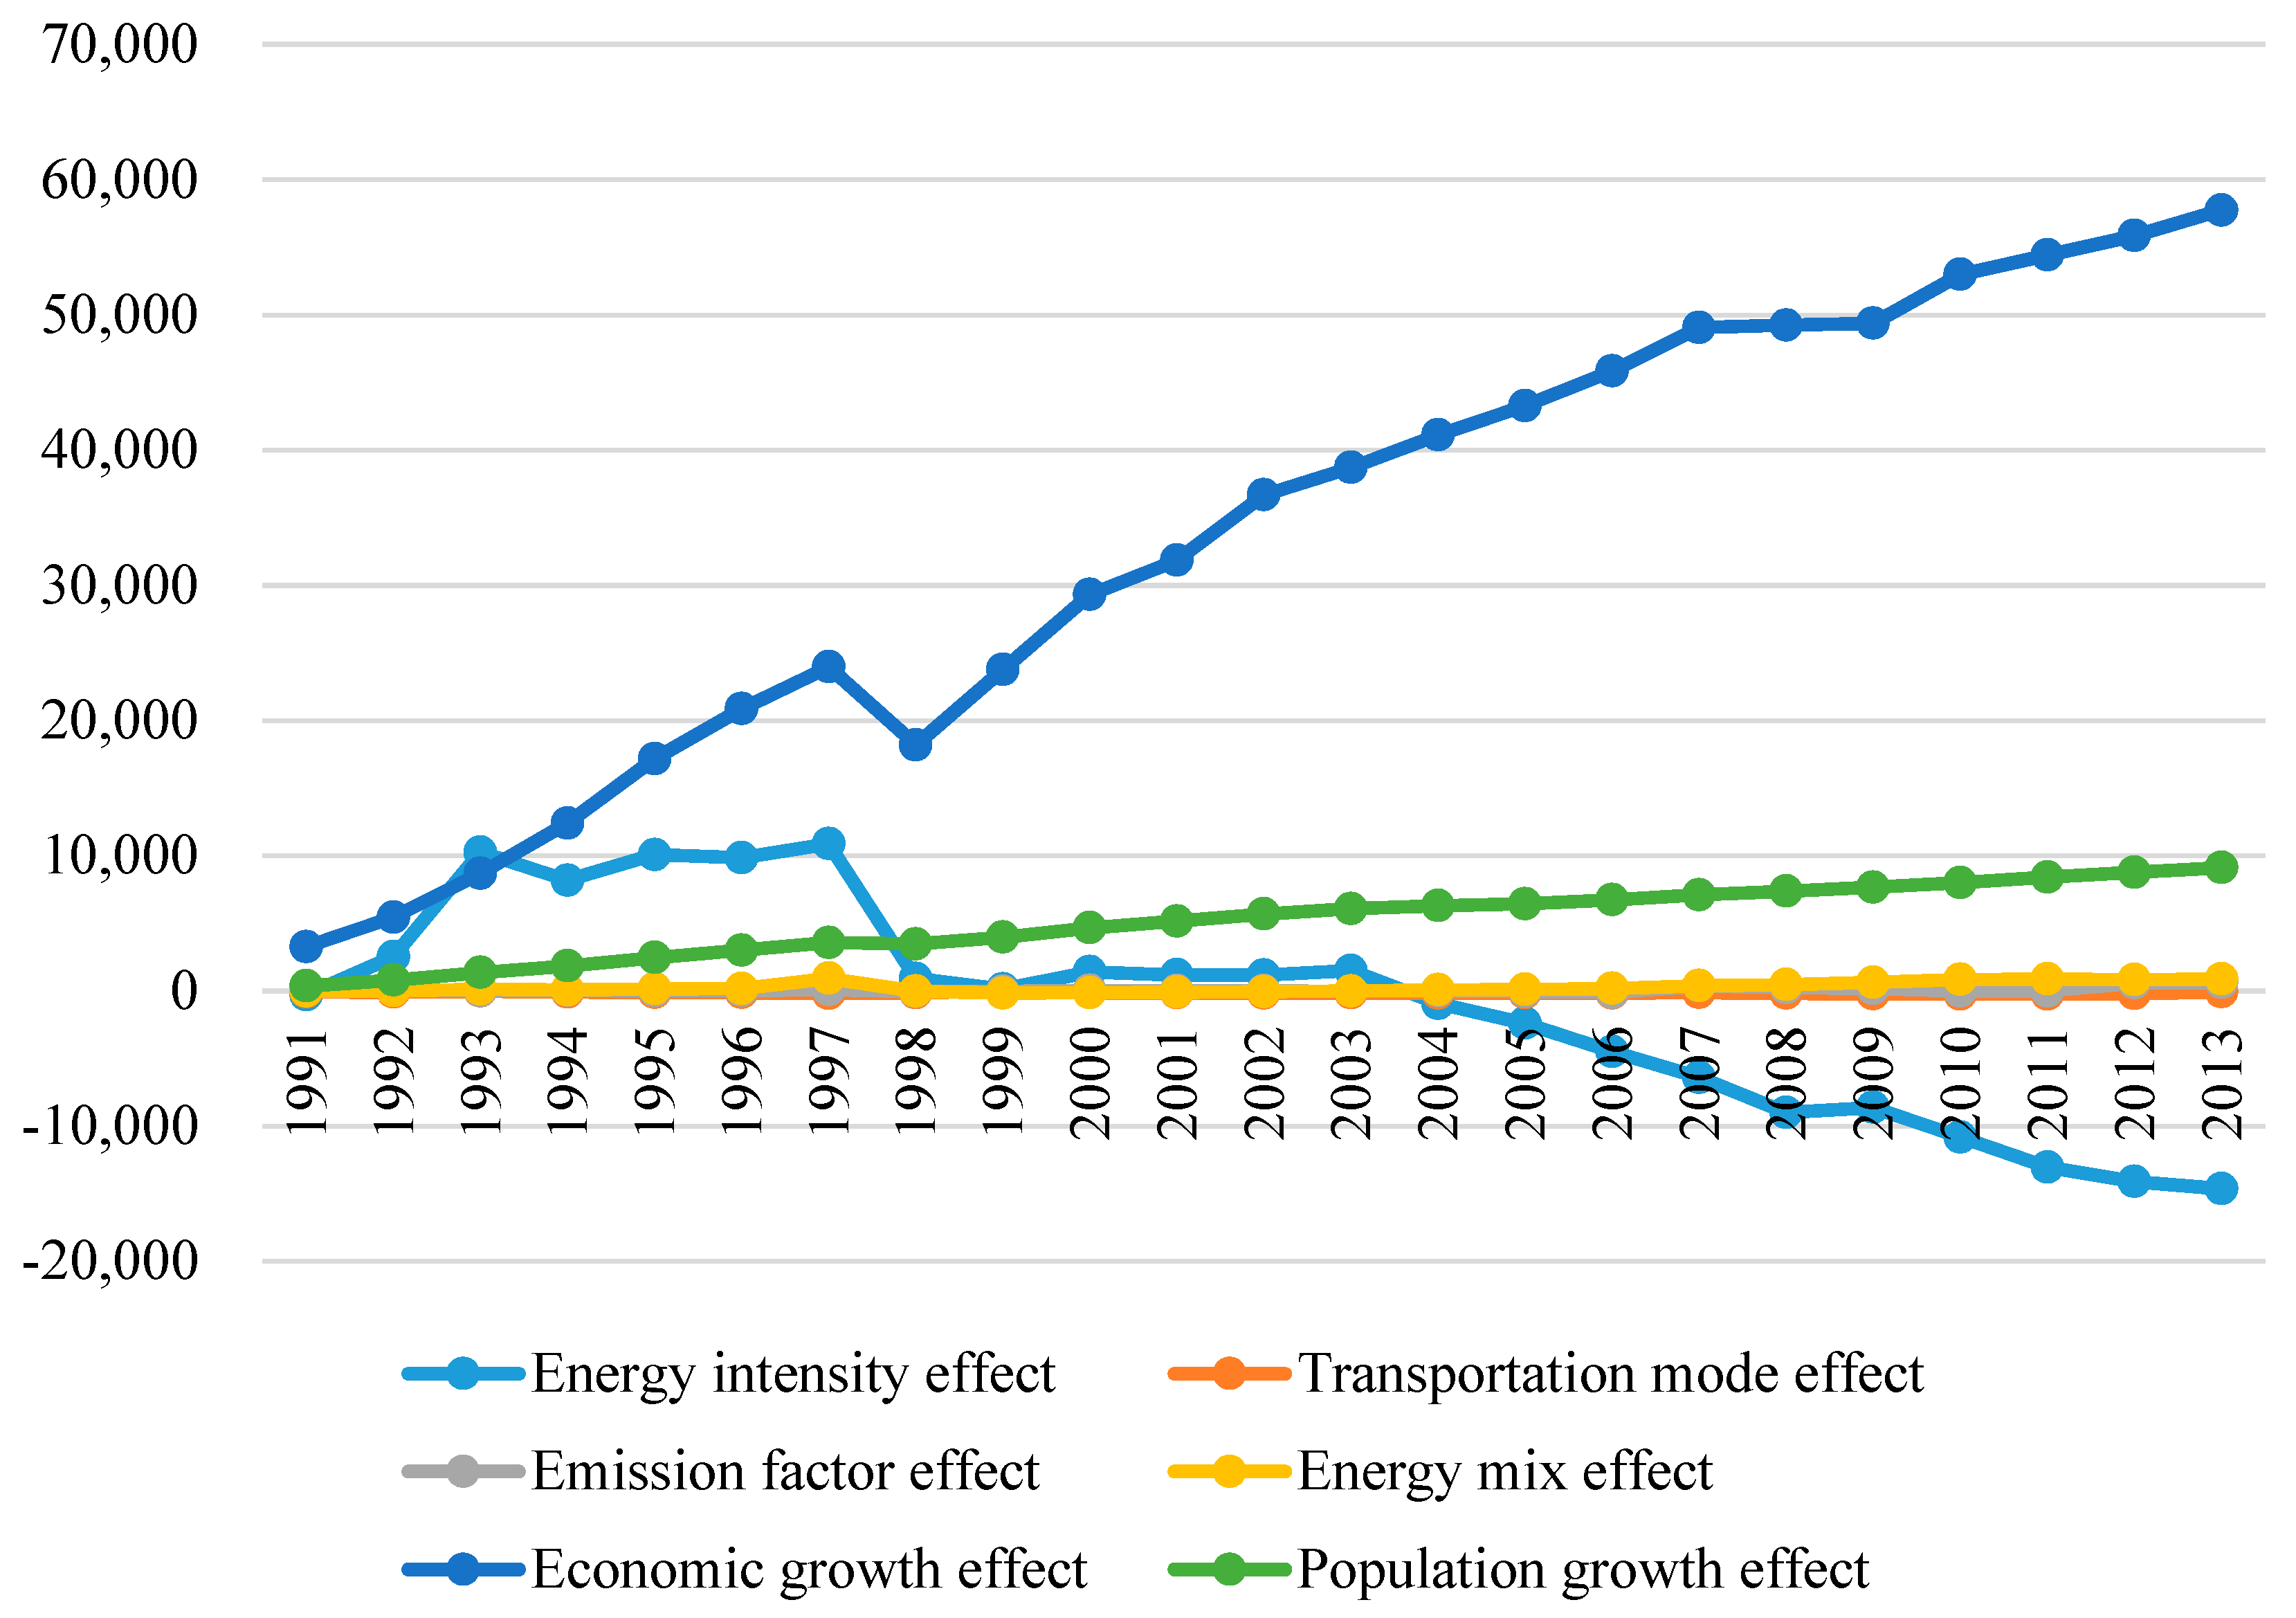
Table 4 presents the results of the additive decomposition analysis of GHG emissions for the Korean transportation sector from 1991 to 2013. The results yielded for each year represent the values of the individual effects of the impact factors used for the decomposition analysis of the increase in GHG emissions from 1990 to that year. For example, the year 2000 results showed that GHG emissions during 1990–2000 increased by 29,306 Gg due to the economic growth effect, 4665 Gg due to the population effect, 1412 Gg due to the energy intensity effect, and 32 Gg due to the emission factor effect, and reduced 145 Gg due to the transportation mode effect and 139 Gg due to the energy mix effect. This time-series analysis provides annual changes and reduces discontinuity-related analysis errors.
The time-series results for the factor decomposition analysis are shown in
Table 4 and
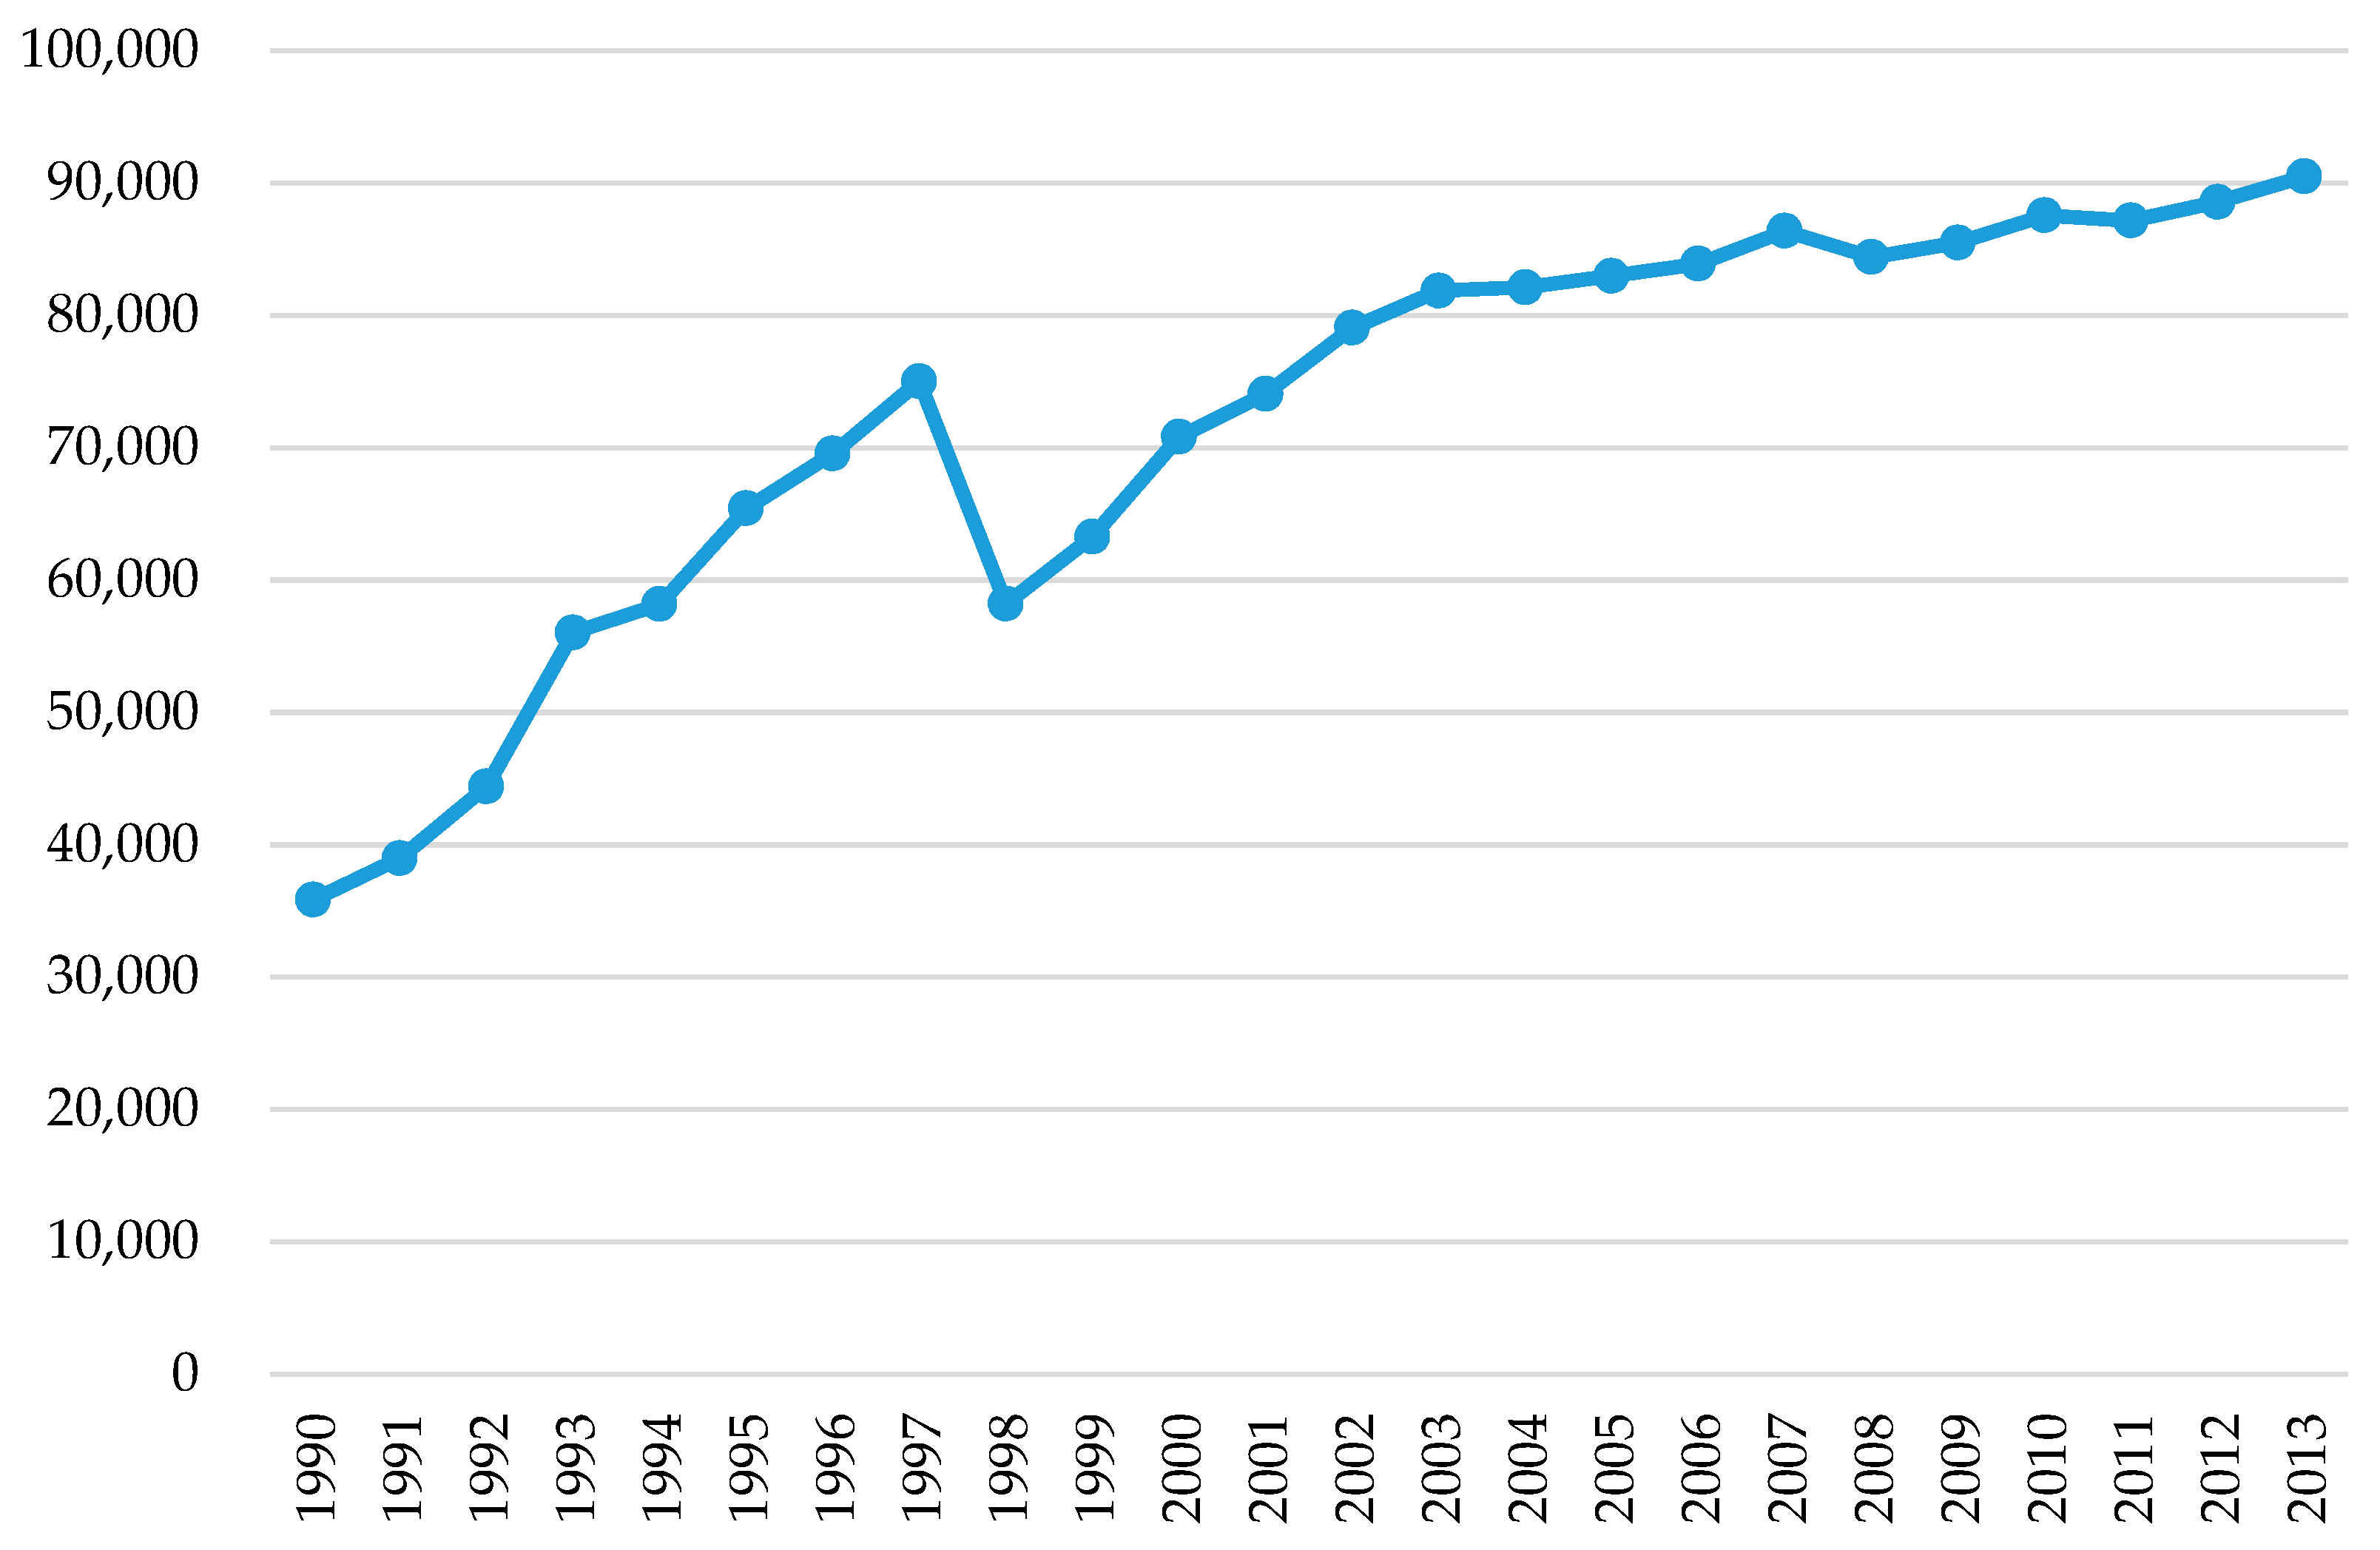
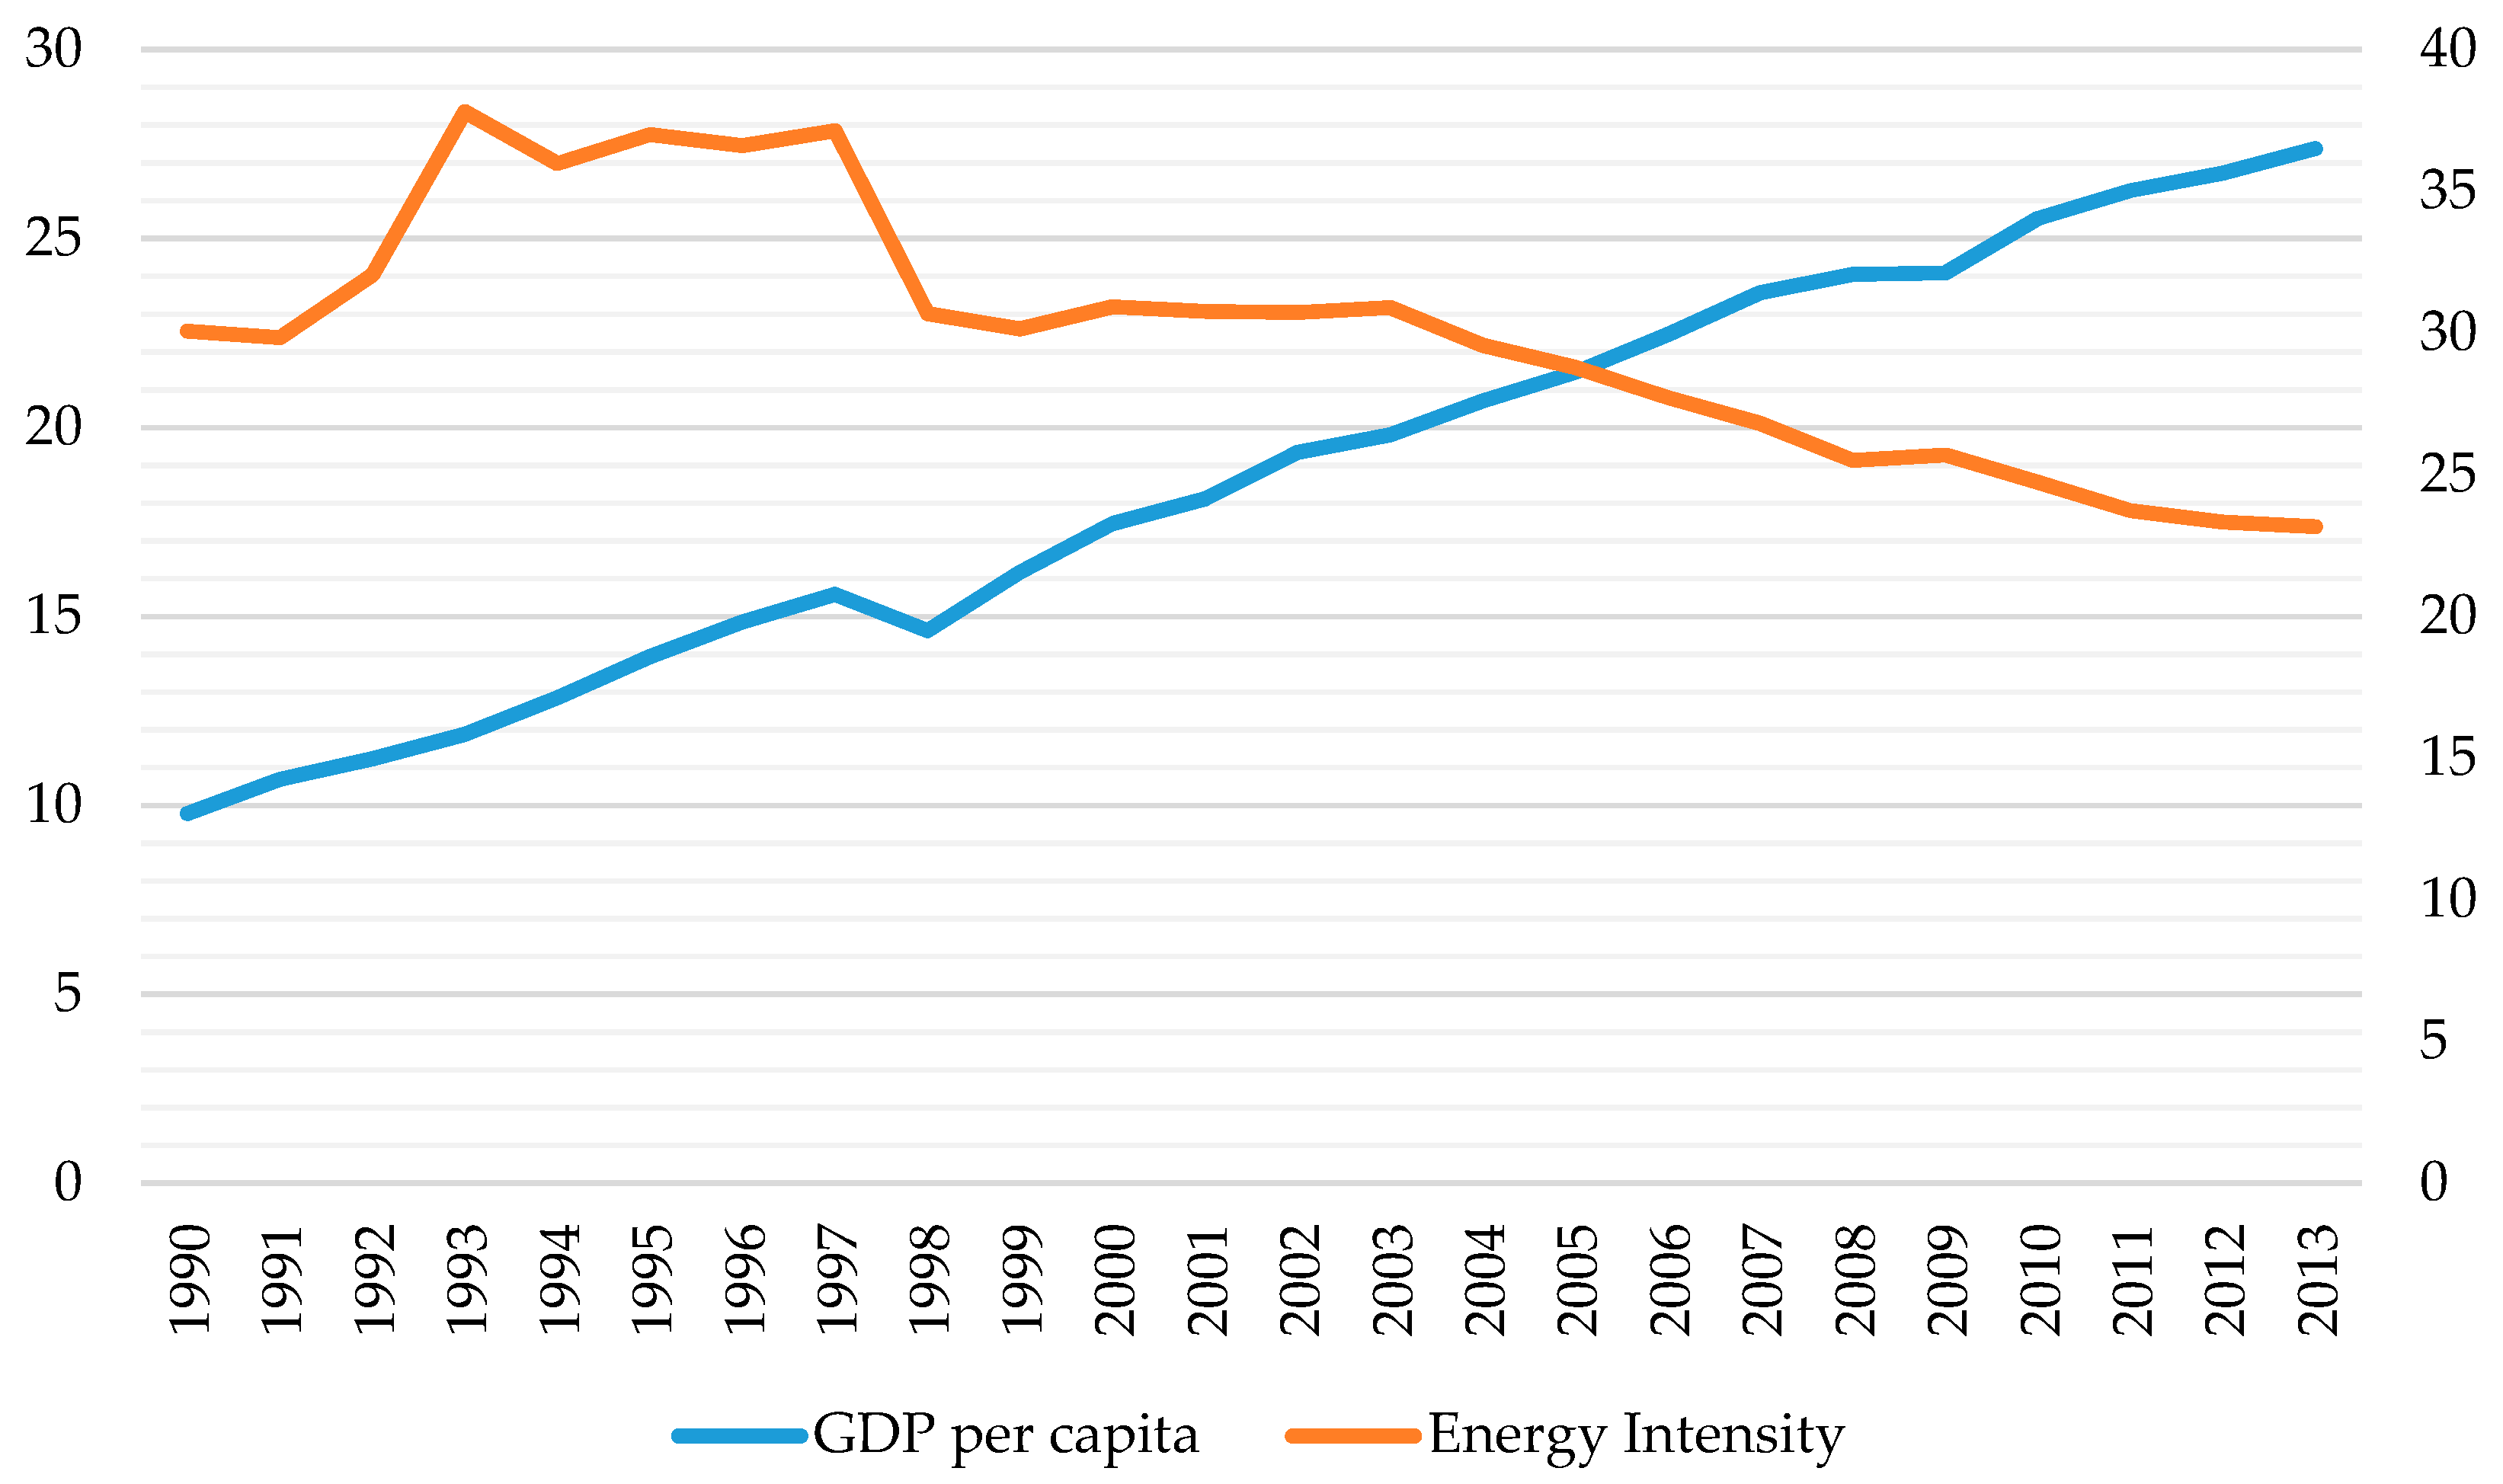
Figure 6. GHG emissions’ growth in the transportation sector was predominantly influenced by the economic growth effect which is mostly due to the increase in transport demand. This factor caused a continuous increase in GHG emissions over the period 1990–2013 except for 1998. Due to the Asian economic crisis that began in 1997, the transportation sector’s GHGs declined for one year due to this effect. GHG emissions were increased by 57,744 Gg from 1990 to 2013, representing 107.7% of the total GHG emissions change. Thus, the GHG emissions change by this effect exceeds the total GHG emissions change. This is due to the fact that GDP per capita growth rate exceeds GHG emissions’ growth rate. The annual growth rate of GDP per capita was 4.6% while the rate of GHG emissions was 4.1%. The population growth effect is another important contributor to GHG emissions’ growth rate in the transportation sector increased by 9115 Gg from 1990 to 2013, representing 5.9% of the total GHG emissions change during the same periods.
Reduction in GHG emissions is mainly influenced by the energy intensity effect which has accelerated GHG reductions since the mid-2000s. Compared to 1990, GHG emissions in 2013 reduced by 14,635 Gg due to this effect. This reduction by intensity effect is 27.3% of the total GHG emissions change for the same corresponding period.
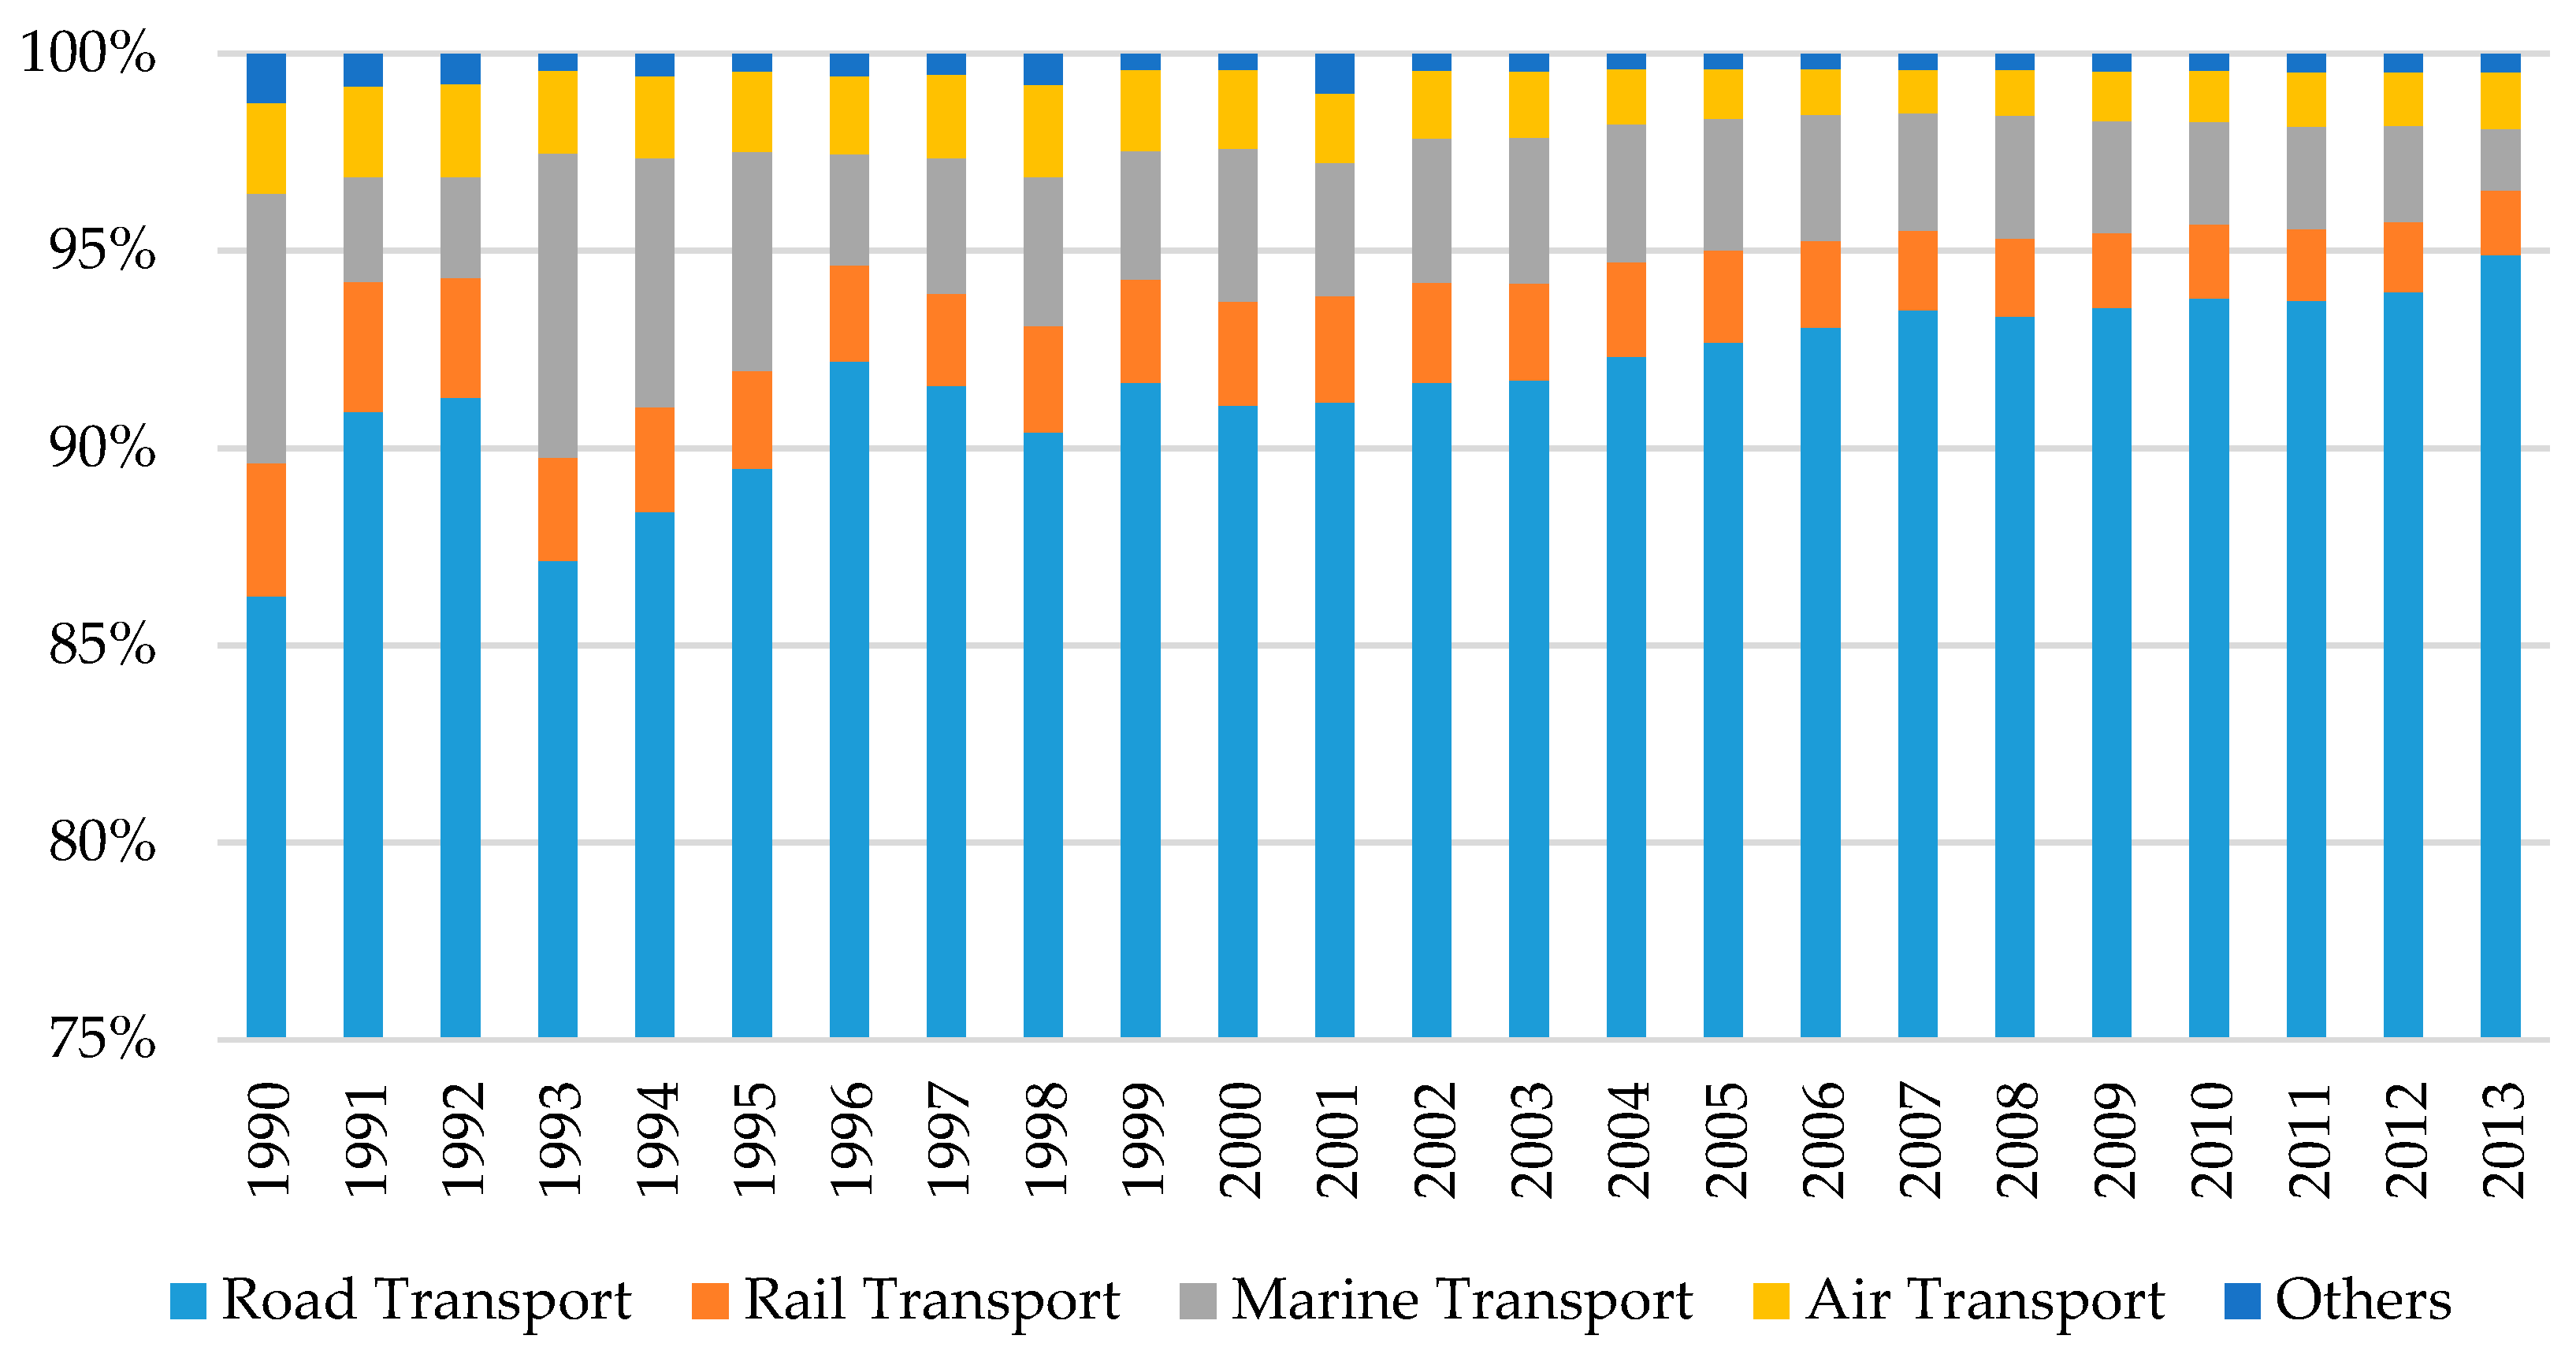
GHG emissions were also reduced by the transportation mode effect. However, the amount of reduction was very small compared to the energy intensity effect. During the period from 1990 to 2013, the reduction by the transportation mode effect was only 0.5% of the reduction by energy intensity.
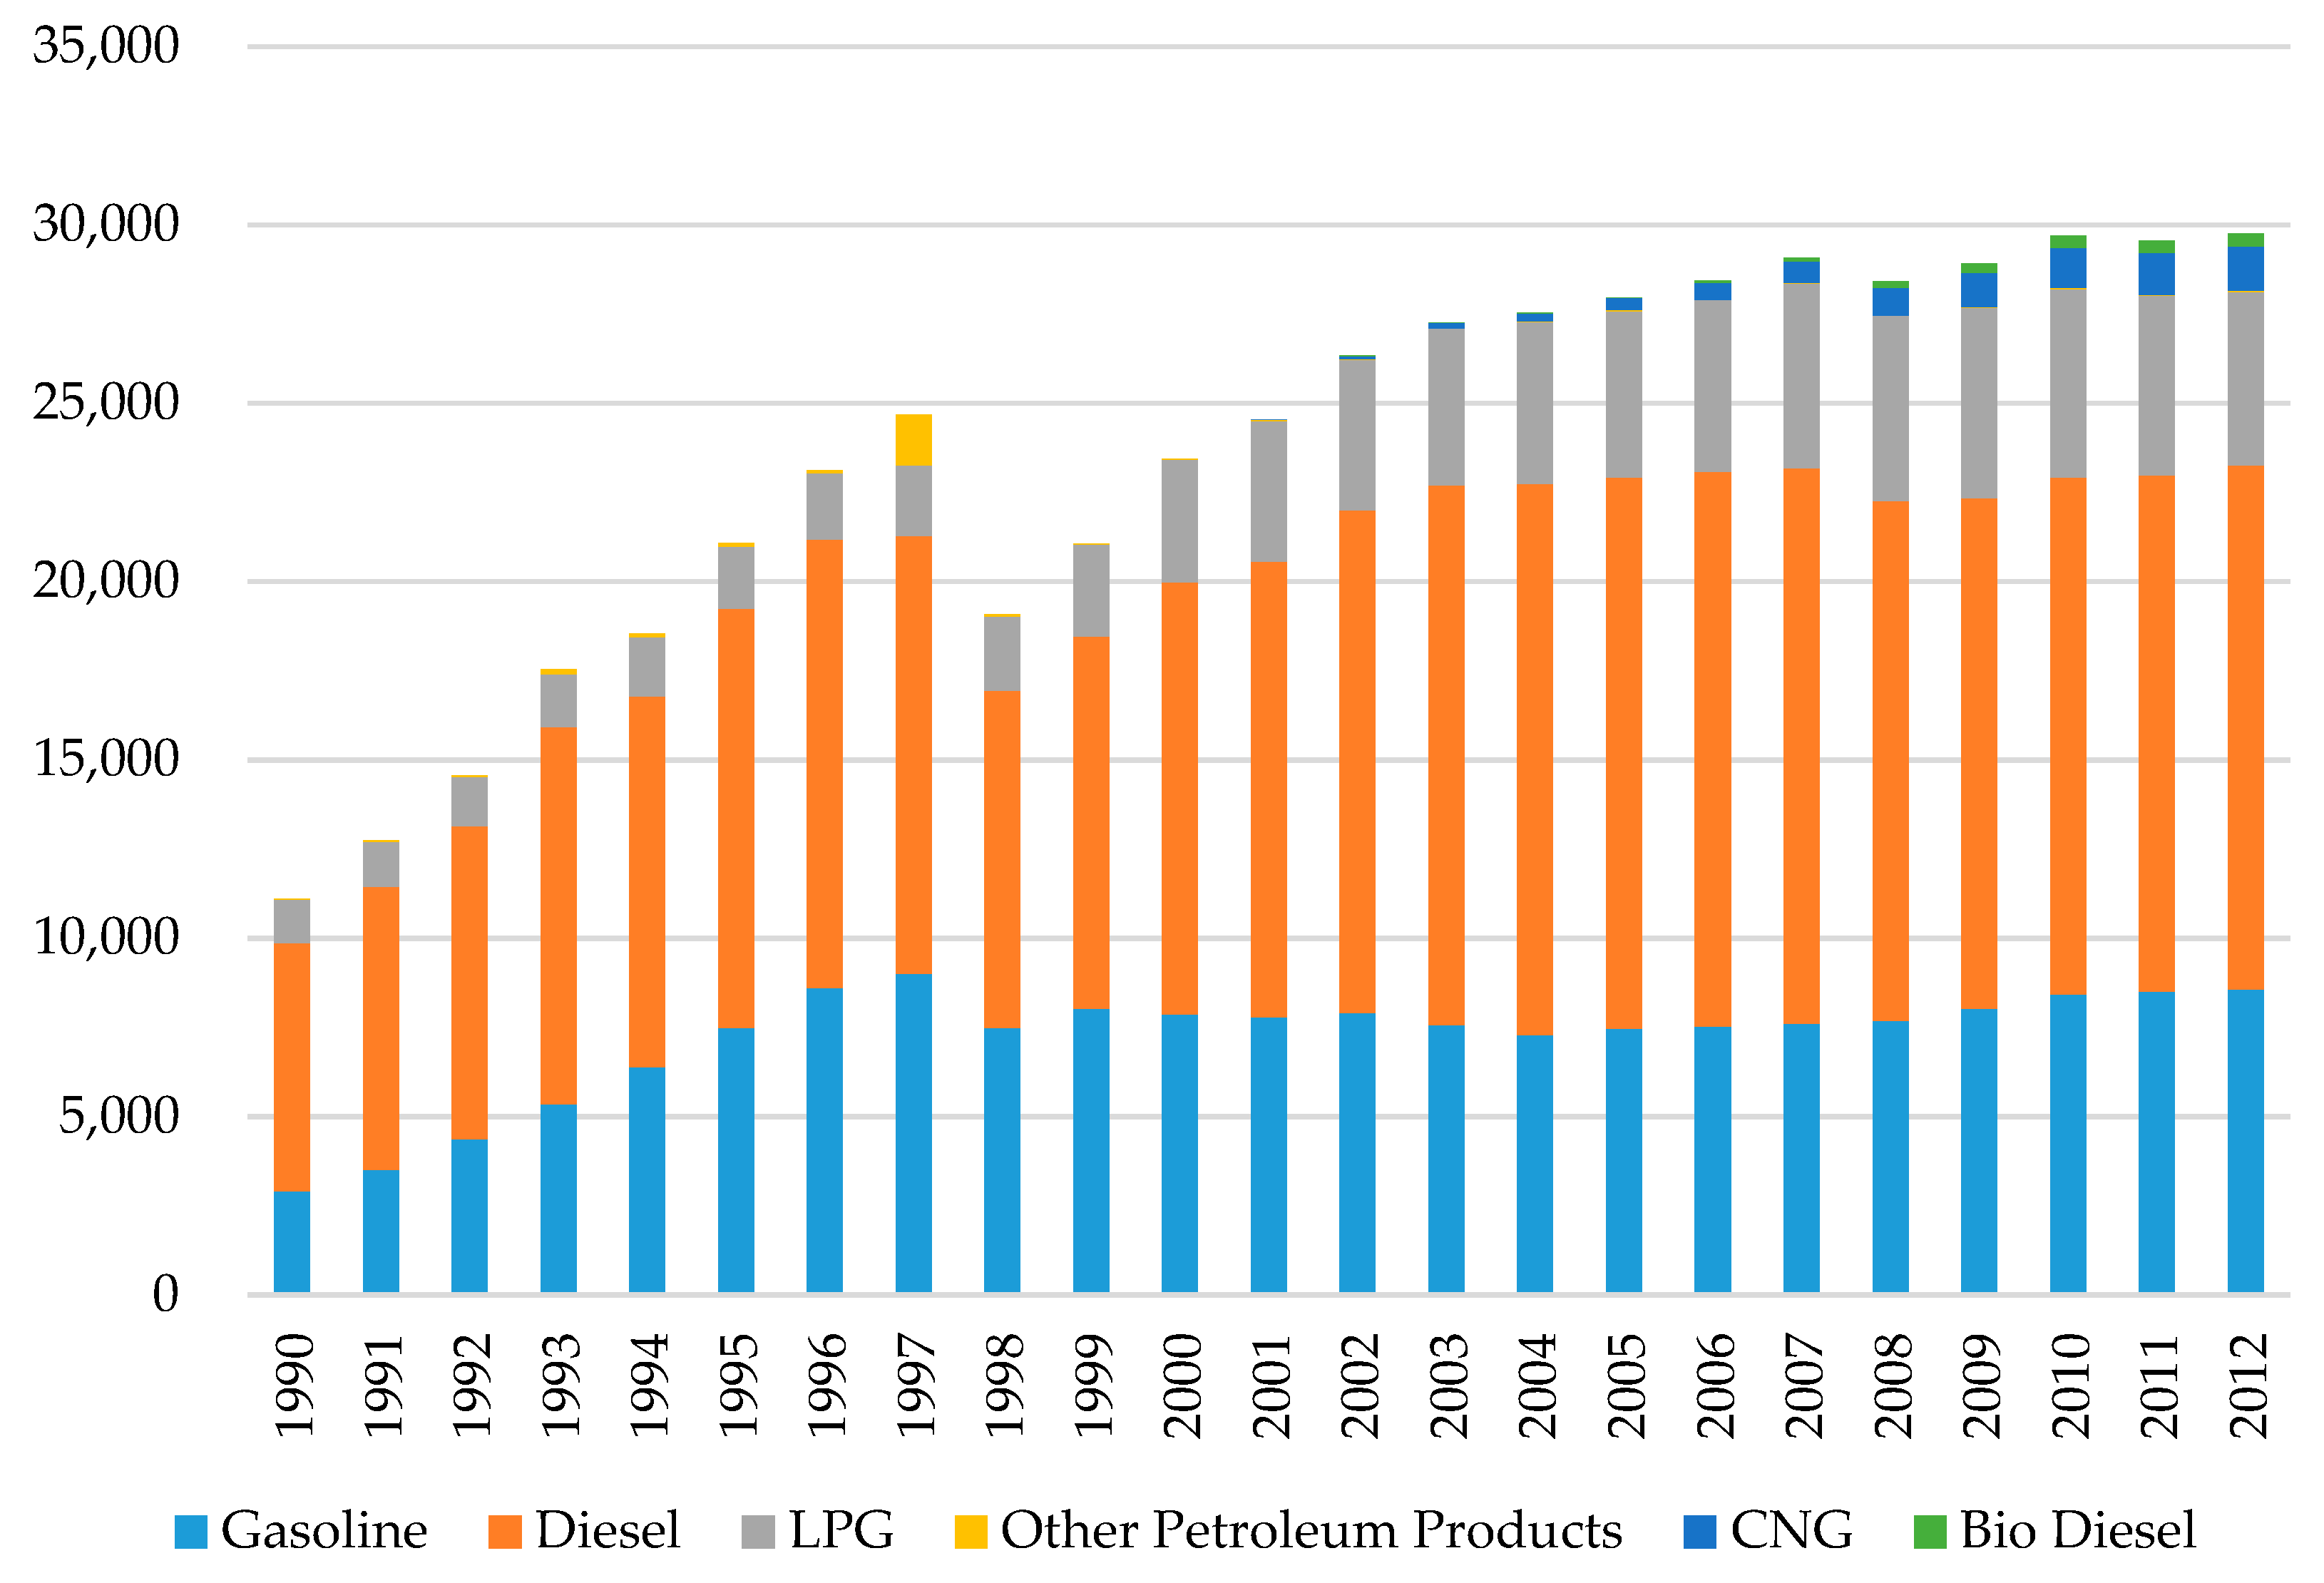
The energy mix and emission factor effects did not play a major role in reducing GHG emissions. GHG emissions increased due to these effects since the mid-2000s, even though the GHG emissions were temporarily reduced by these effects from the mid-1990s to mid-2000s. From 1990 to 2013, GHG reductions from energy mix and emission factor effects amounted to 877 and 612 Gg, respectively, representing only 1.6% and 1.1% of total change in GHG emissions.
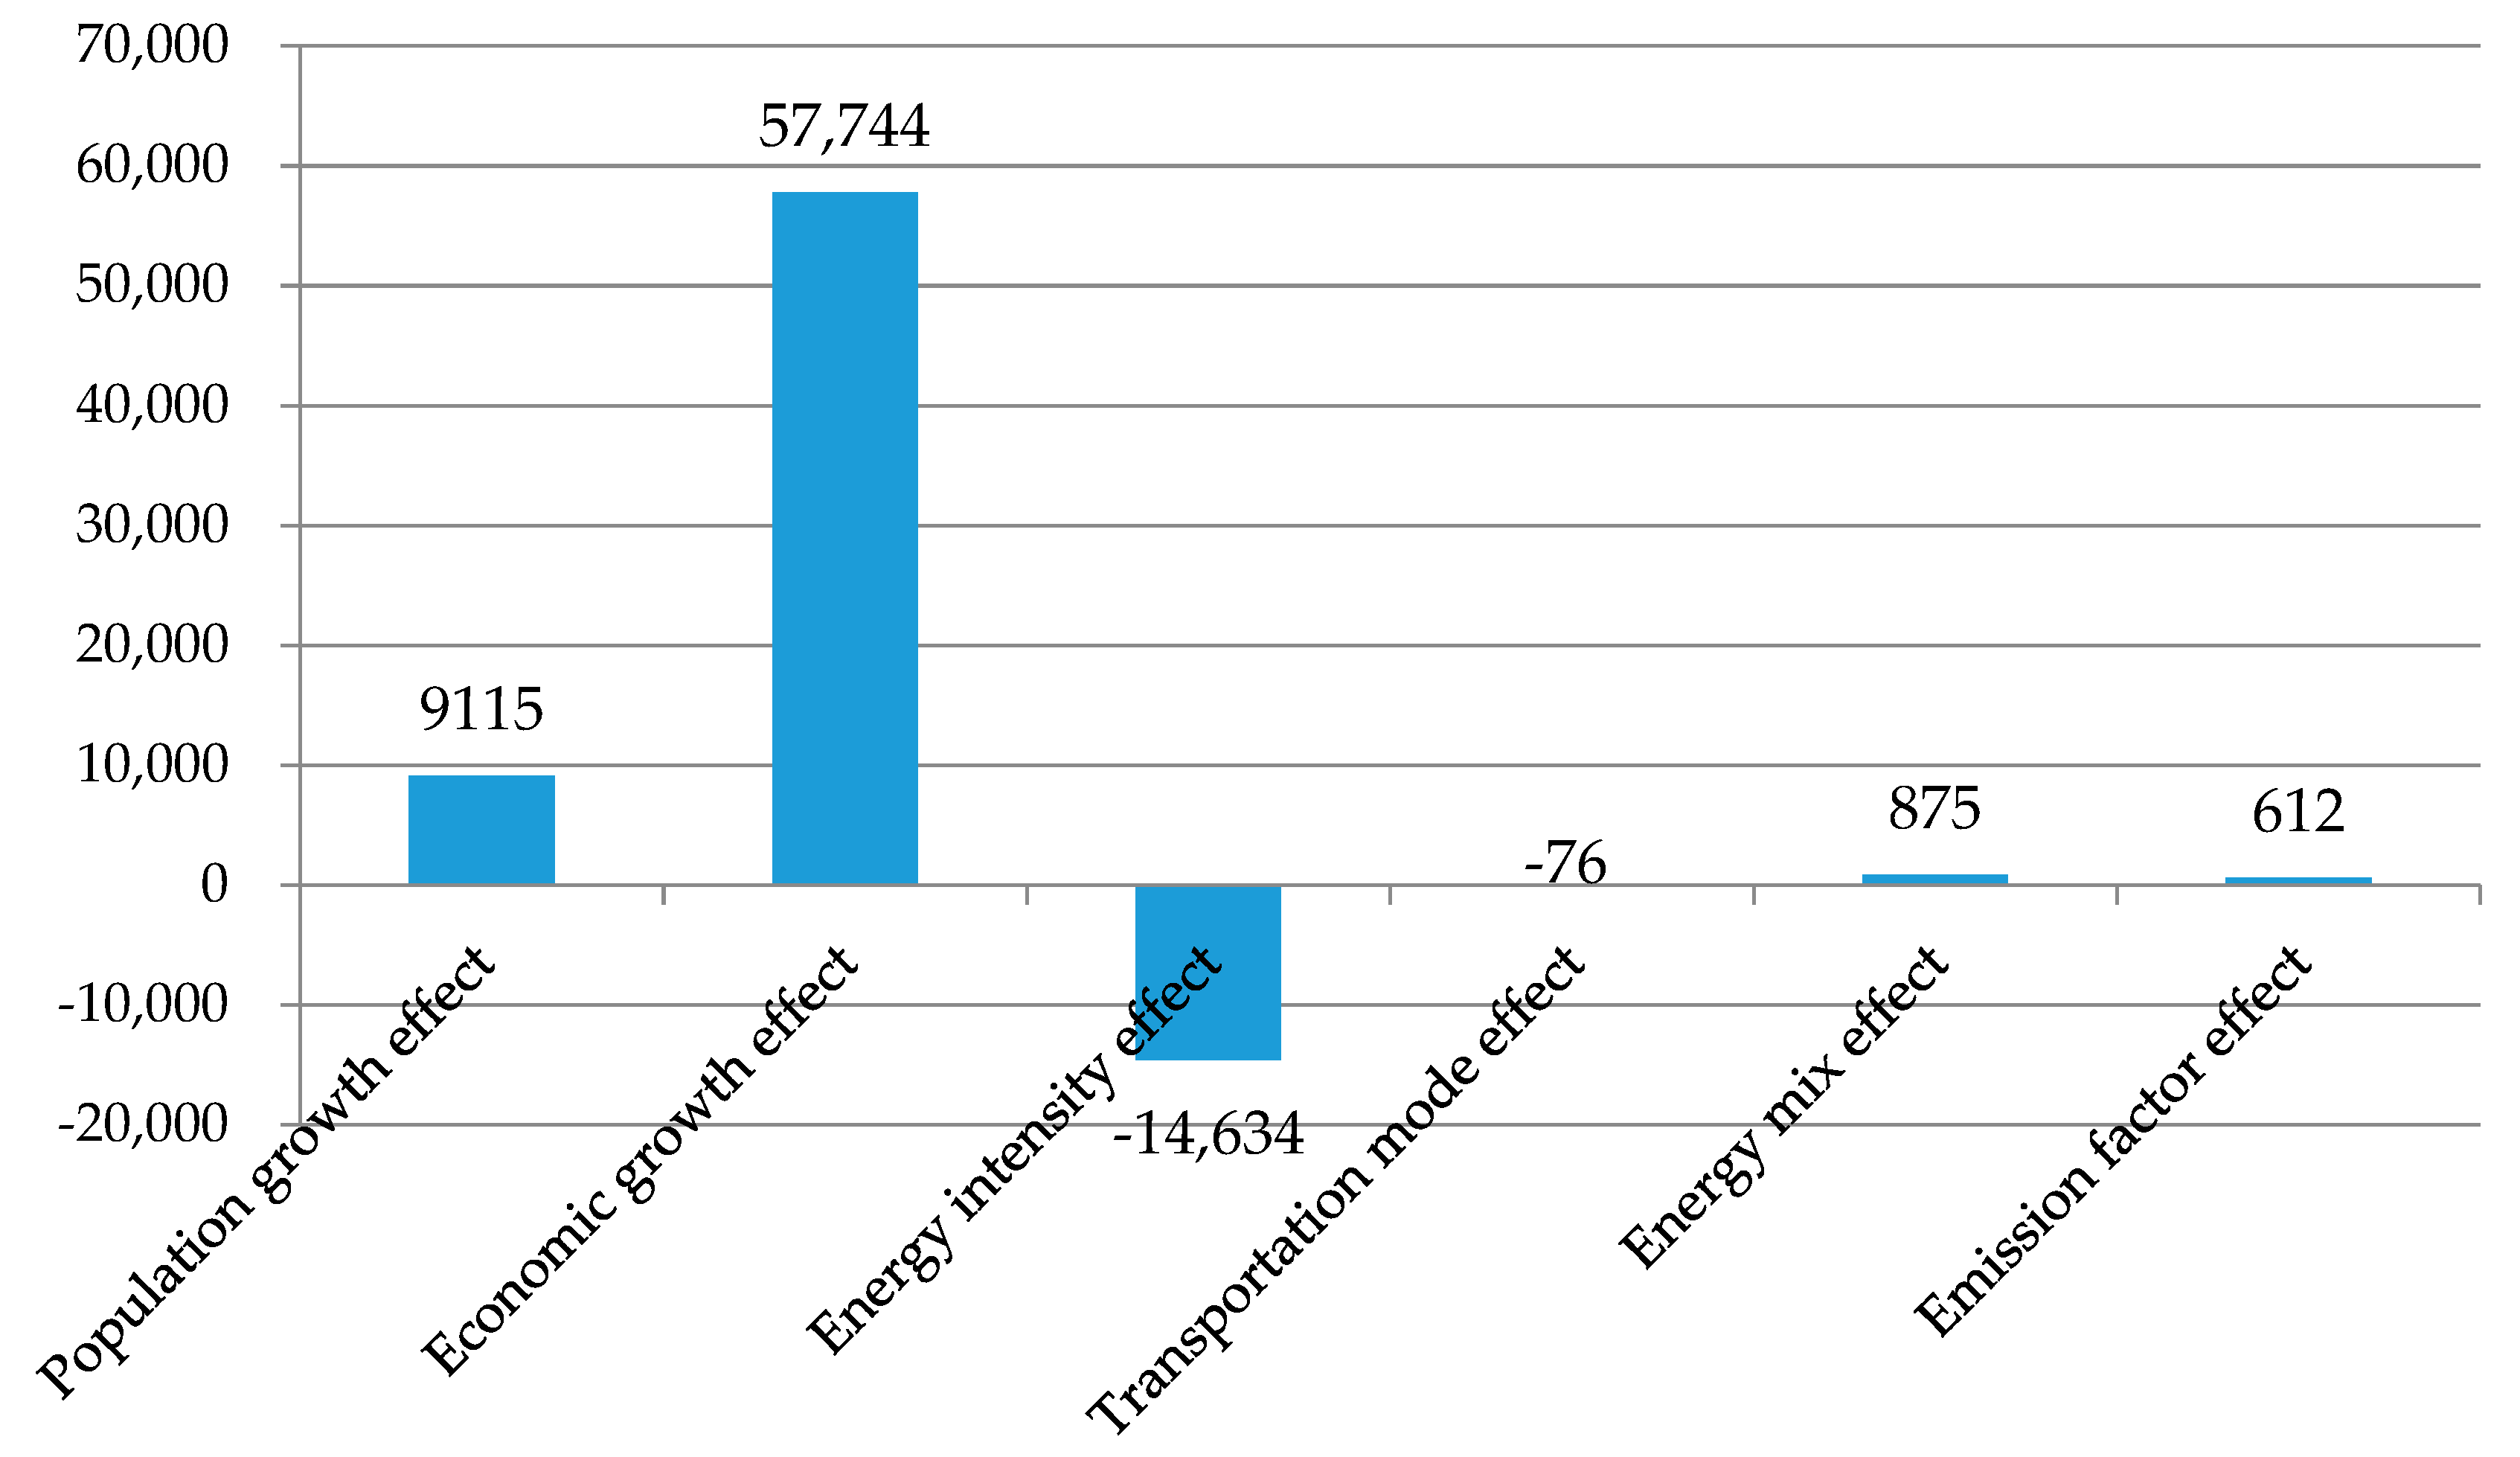
Figure 7 shows that the increase in GHG emissions from 1990 to 2013 was 53,635 Gg, broken down into six factors: Economic growth (by 57,744 Gg), population (by 9115 Gg), energy mix (by 875 Gg), and emission factor (by 612 Gg) effects, with economic growth as the biggest contributor followed by population growth. Whereas the effects from the emission factor and energy mix on GHG were negligible. The energy intensity and transport mode change effects both played a role in reducing GHGs during this period. The energy intensity effect led to the largest reduction in GHG emissions (by 14,634 Gg), followed by the transport mode change effect (by 76 Gg).
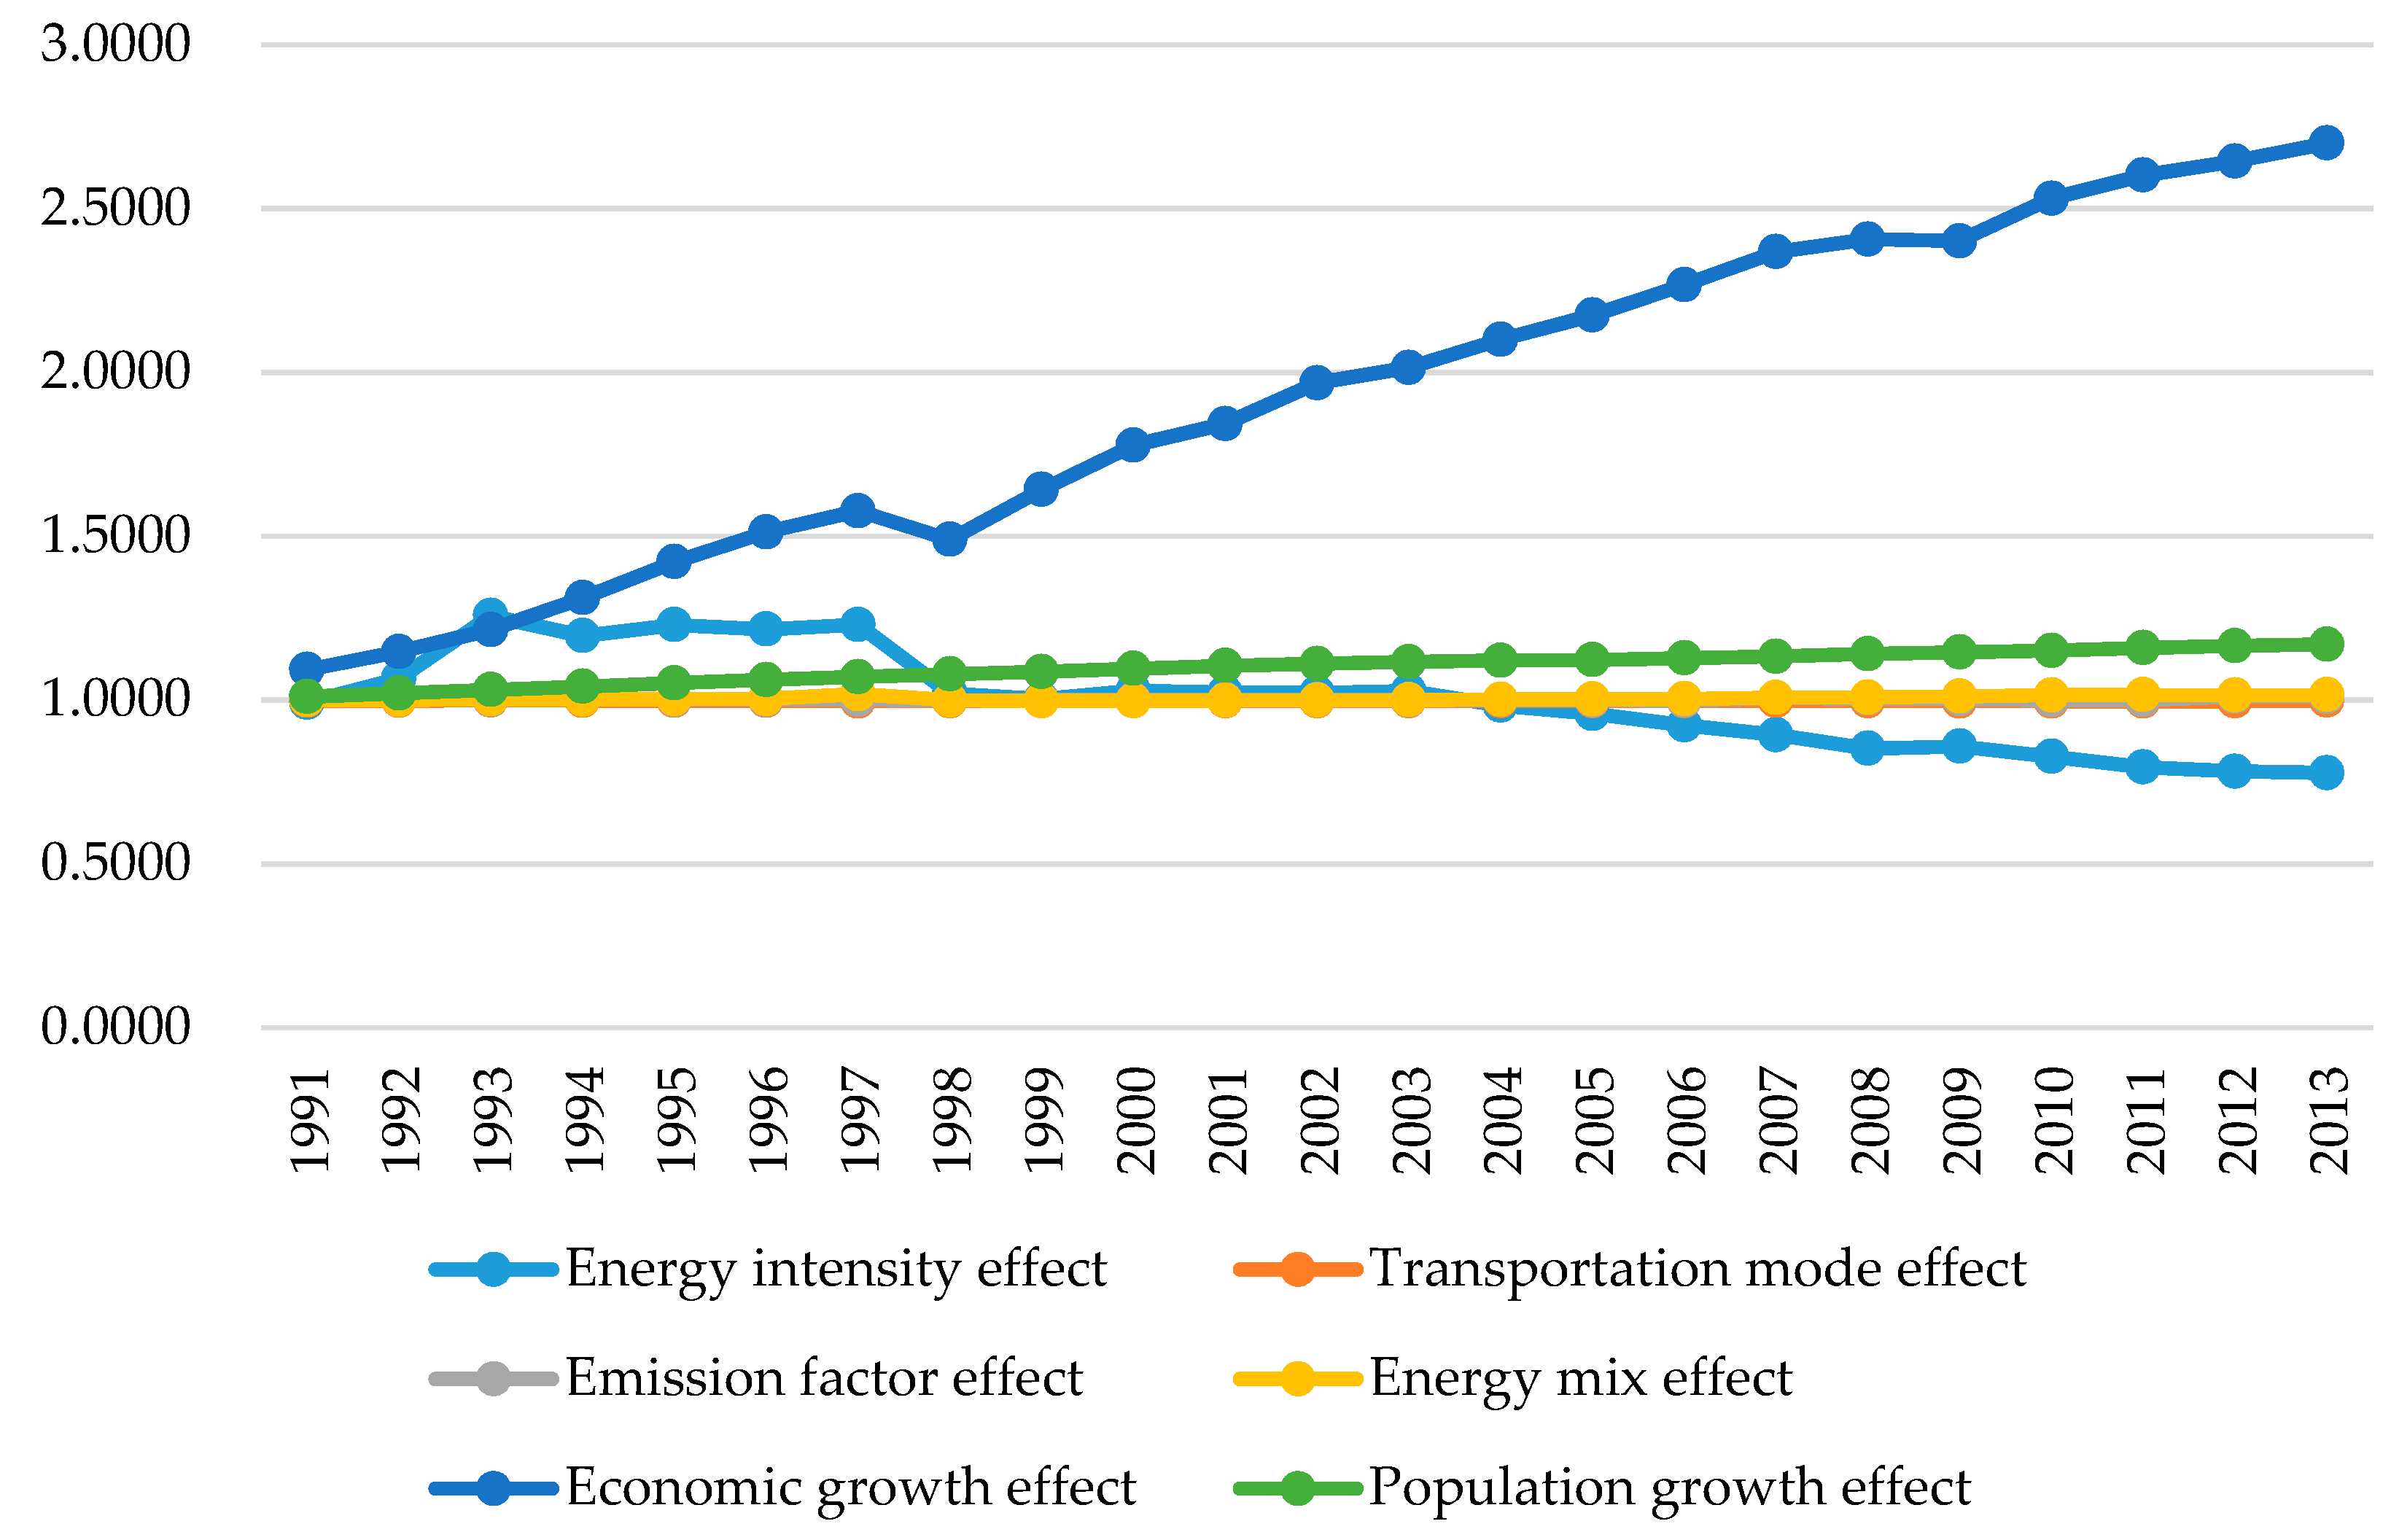
Table 5 provides the multiplicative factor decomposition results of GHG emissions increase for each year from 1990. A value of more than 1 indicated GHG emissions increase while a value of less than one indicated GHG emissions decrease. Results in that year 2000 can be interpreted as follows: GHG emissions increased by 99.28% compared to 1990. As decomposition, GHG emissions increased by 77.75% due to the economic growth effect, 9.59% due to the population effect, 2.81% due to the energy intensity effect, and 0.0006% due to the emission factor effect. However, GHG emissions decreased by 0.0027% due to the energy mix effect and 0.0028% due to the transportation mode effect. The total effect is calculated by multiplying the values of each individual effect.
The multiplicative factor decomposition time analysis is shown in
Figure 8, showing a trend very similar to that in
Figure 6, except that the vertical axis represents the relative ratio. The increase in GHG emissions in the transport sector was due to an economic growth effect, followed by a population growth effect. The energy intensity effect contributed to GHG emissions reduction since 2004. Other factors did not show a specific trend.
Figure 9 shows the cumulative results of multiplicative factor decomposition results from 1990 to 2013.
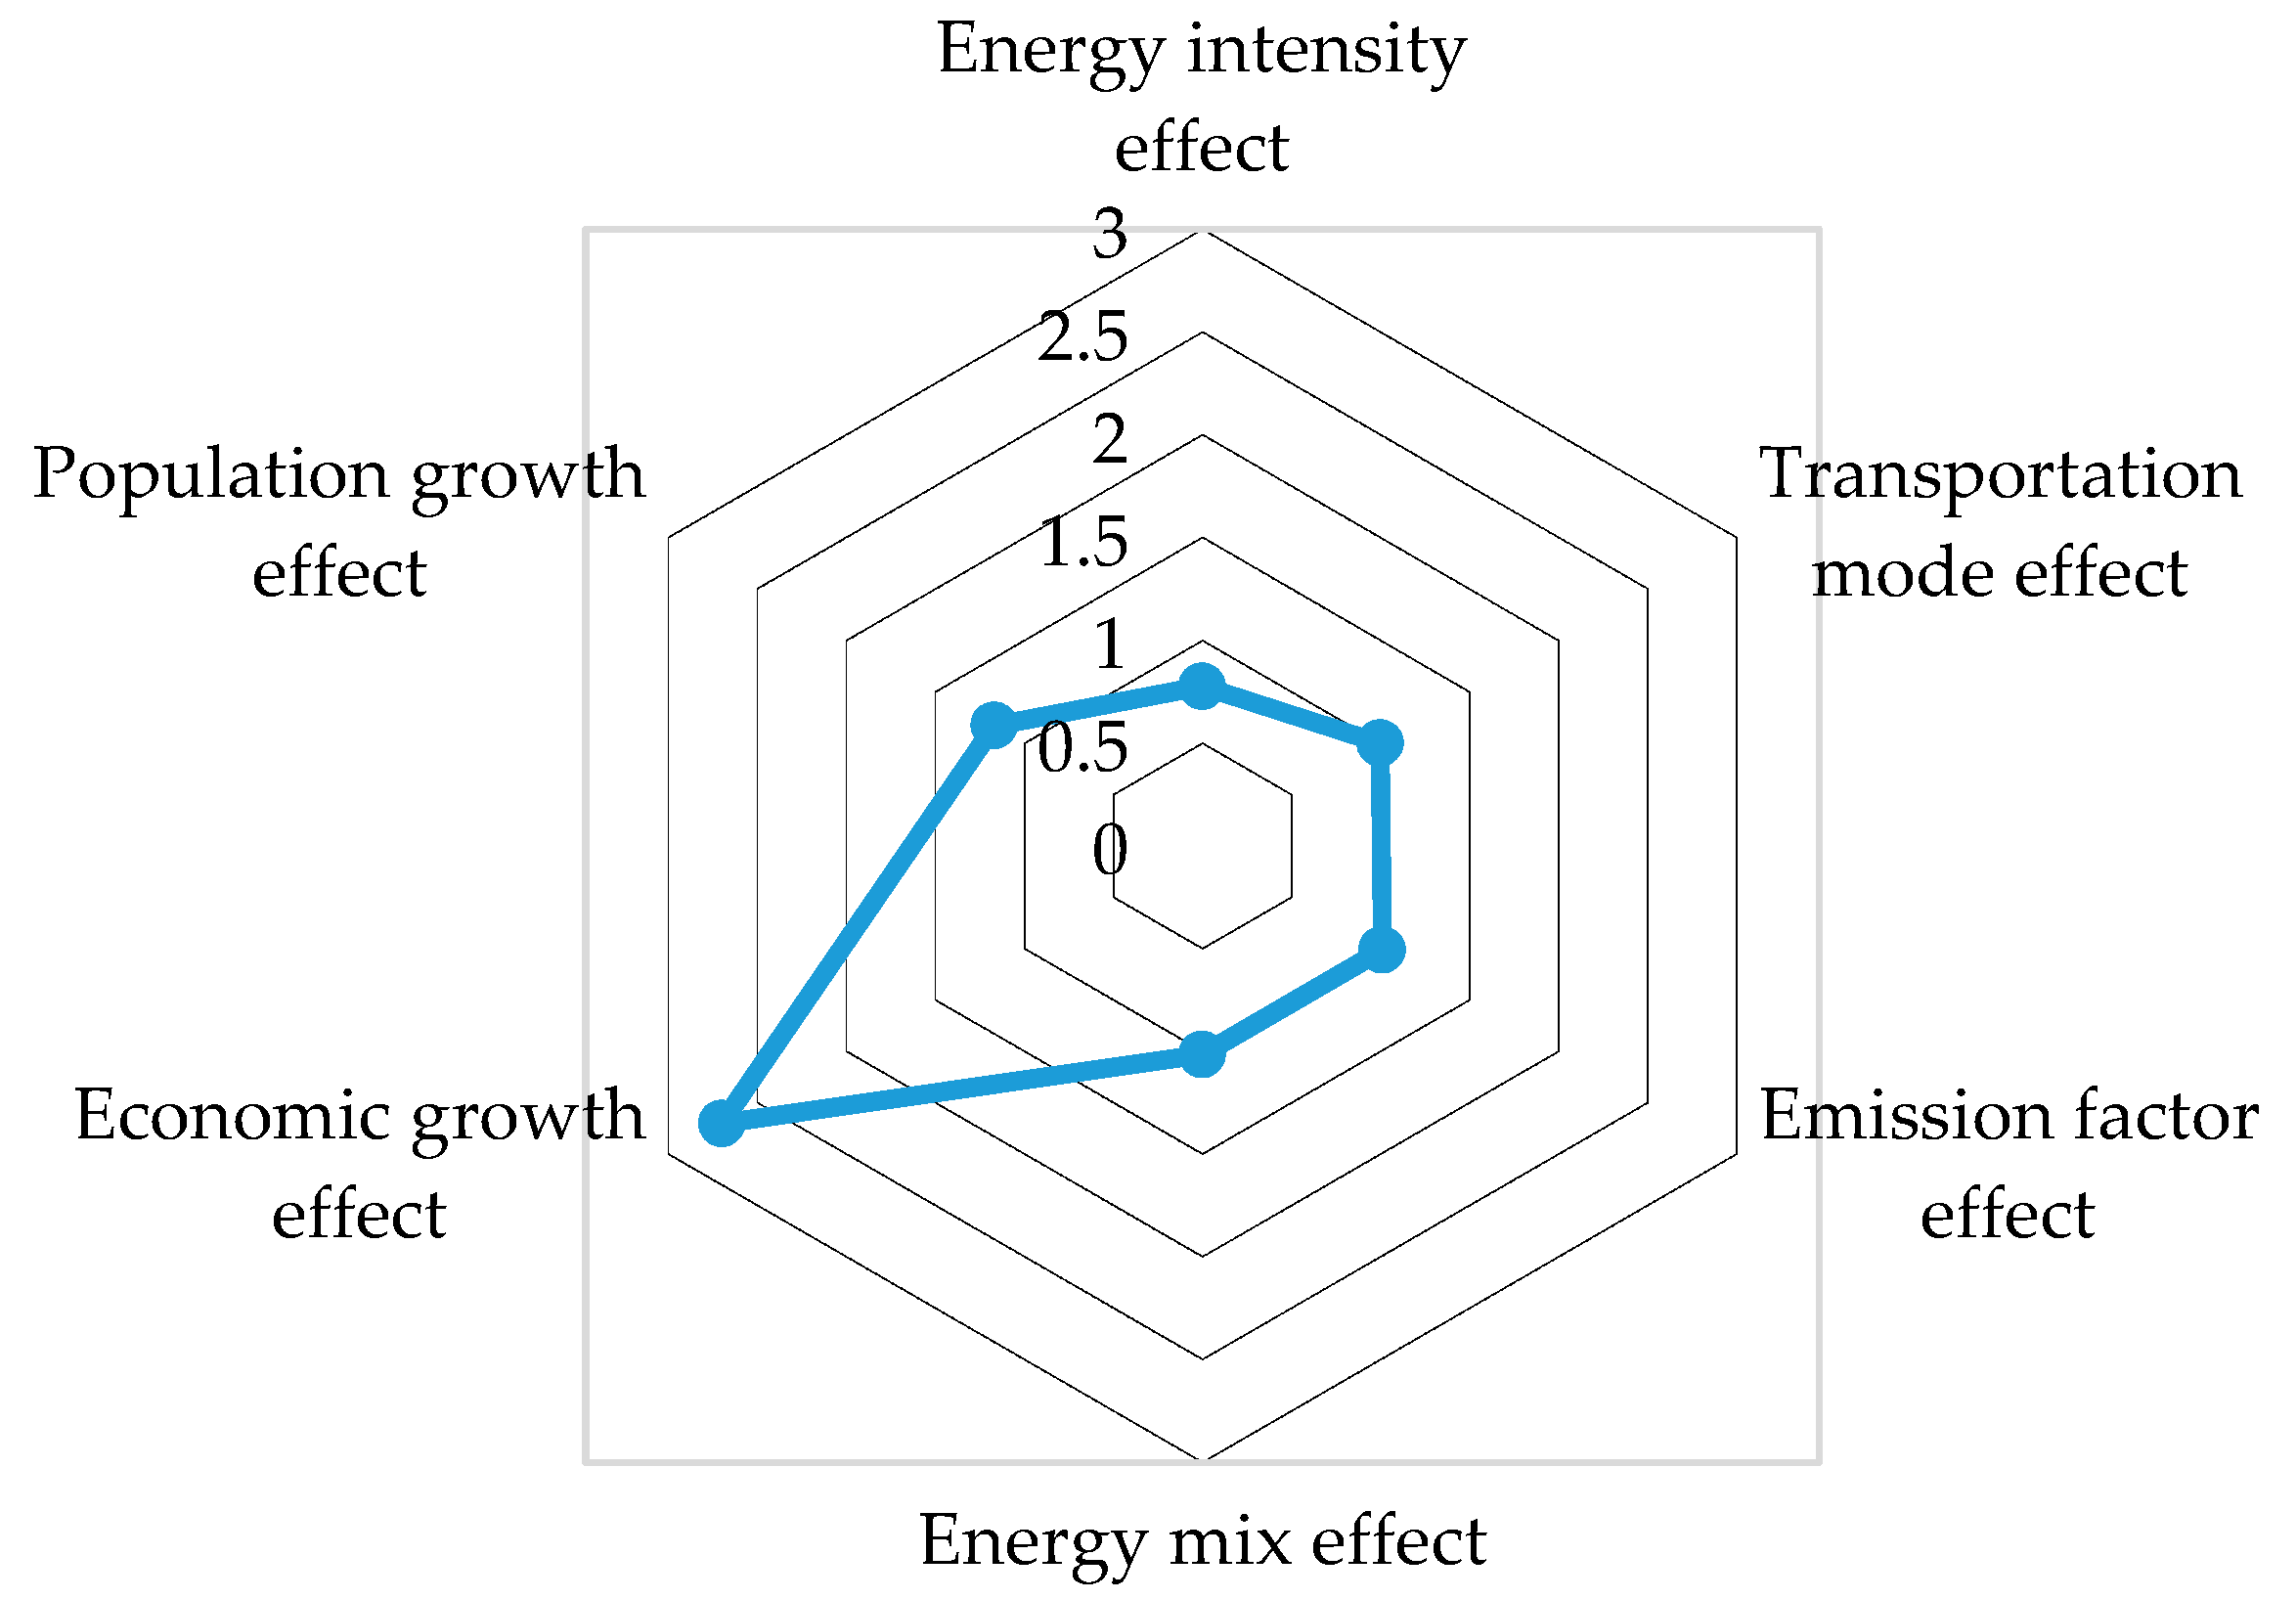
Figure 9 shows the multiplicative decomposition results for changes in GHG emissions from 1990 to 2013. As decomposition, GHG emissions increased by 170.00% under the economic growth effect, 16.51% under the population effect, 1.52% under the energy mix effect, and 1.06% under the emission factor effect. However, it decreased by 21.78% under the energy intensity effect and 0.35% under the transportation mode effect. So far, the economic growth effect is predominantly responsible for the increase for this sector.
5. Conclusions
This study conducted LMDI factor decomposition for Korea’s transportation sector during the period from 1990 to 2013 and presented both additive and multiplicative factor decomposition analyses of the decomposition methods. Our findings are as follows. The increase in GHG emissions is predominantly influenced by the economic growth effect, followed by the population growth effect. Reduction in GHG emissions is mainly influenced by the energy intensity effect. Since the mid-2000s, GHG reductions have been accelerated by this effect. The GHG emissions were also reduced by the transportation mode effect. However, the amount of reduction by the transportation mode effect is very small compared to the energy intensity effect. The energy mix effect and emission factor effect did not play a major role in reducing GHG emissions. Rather, since the mid-2000s, GHG emissions have increased due to these effects, even though the GHG emissions were temporarily reduced by these effects from the mid-1990s to mid-2000s
In light of the above analysis, some policy transitions should be made in order to reduce GHG emissions in this sector. First, energy intensity must be continuously improved in order to reduce GHG emissions. Policy measures for improving energy intensity include improving the fuel efficiency of various vehicles, improving the efficiency of the transportation system, and revitalizing public transportation. Such fuel efficiency improvements should be made not only in road transport cars but also in other transport equipment such as airplanes, railways, and ships. To improve fuel efficiency, technological development of high-efficiency transport equipment must be accompanied with the regulations such as fuel efficiency and GHG emissions standards. As shown in
Section 3.2, the Korean government has implemented policies in accordance with these policy directions.
Second, in the past, the transportation modes did not contribute significantly to the reduction of GHG emissions. The share of road transport in the transportation sector’s total energy consumption has consistently increased over years. It is therefore necessary to switch from road transport to the environmentally friendly transportation modes such as high-speed railways and subways. The accessibility to this railway should be improved and the railway network should be continuously expanded.
Third, the energy mix effect did not play a major role in reducing GHG emissions, but rather in recent years has led to an increase in GHG emissions. More specifically, after 2005, GHG emissions increased due to the energy mix effect. In order to reduce GHG emissions due to these effects, fuel conversion to environmentally friendly alternatives should be applied to road transport. We must therefore reduce the share of diesel vehicles and increase the share of environmentally-friendly vehicles such as electric, hybrid, and hydrogen cars. Currently, the Korean government is offering tax benefits and subsidies for environmentally friendly vehicles. The Korean government has set the year 2030 target of expanding environmentally friendly vehicles. To achieve this target, these financial supports on environmentally friendly vehicles must be continuously maintained. As the increase in diesel vehicles is due to the relatively low diesel prices, it is necessary to adjust the relative prices between gasoline and diesel through tax reform. Especially, electricity should be produced in an eco-friendly manner using non-fossil fuels to bring substantial GHG emission reductions from electric cars. Although the current GHG mitigation policies in the transportation sector for Korea may somewhat comply with policy suggestions, policy strength must be further discussed.


