The Environmental Effects of Urban Development in Hanoi, Vietnam from Satellite and Meteorological Observations from 1999–2016


Abstract
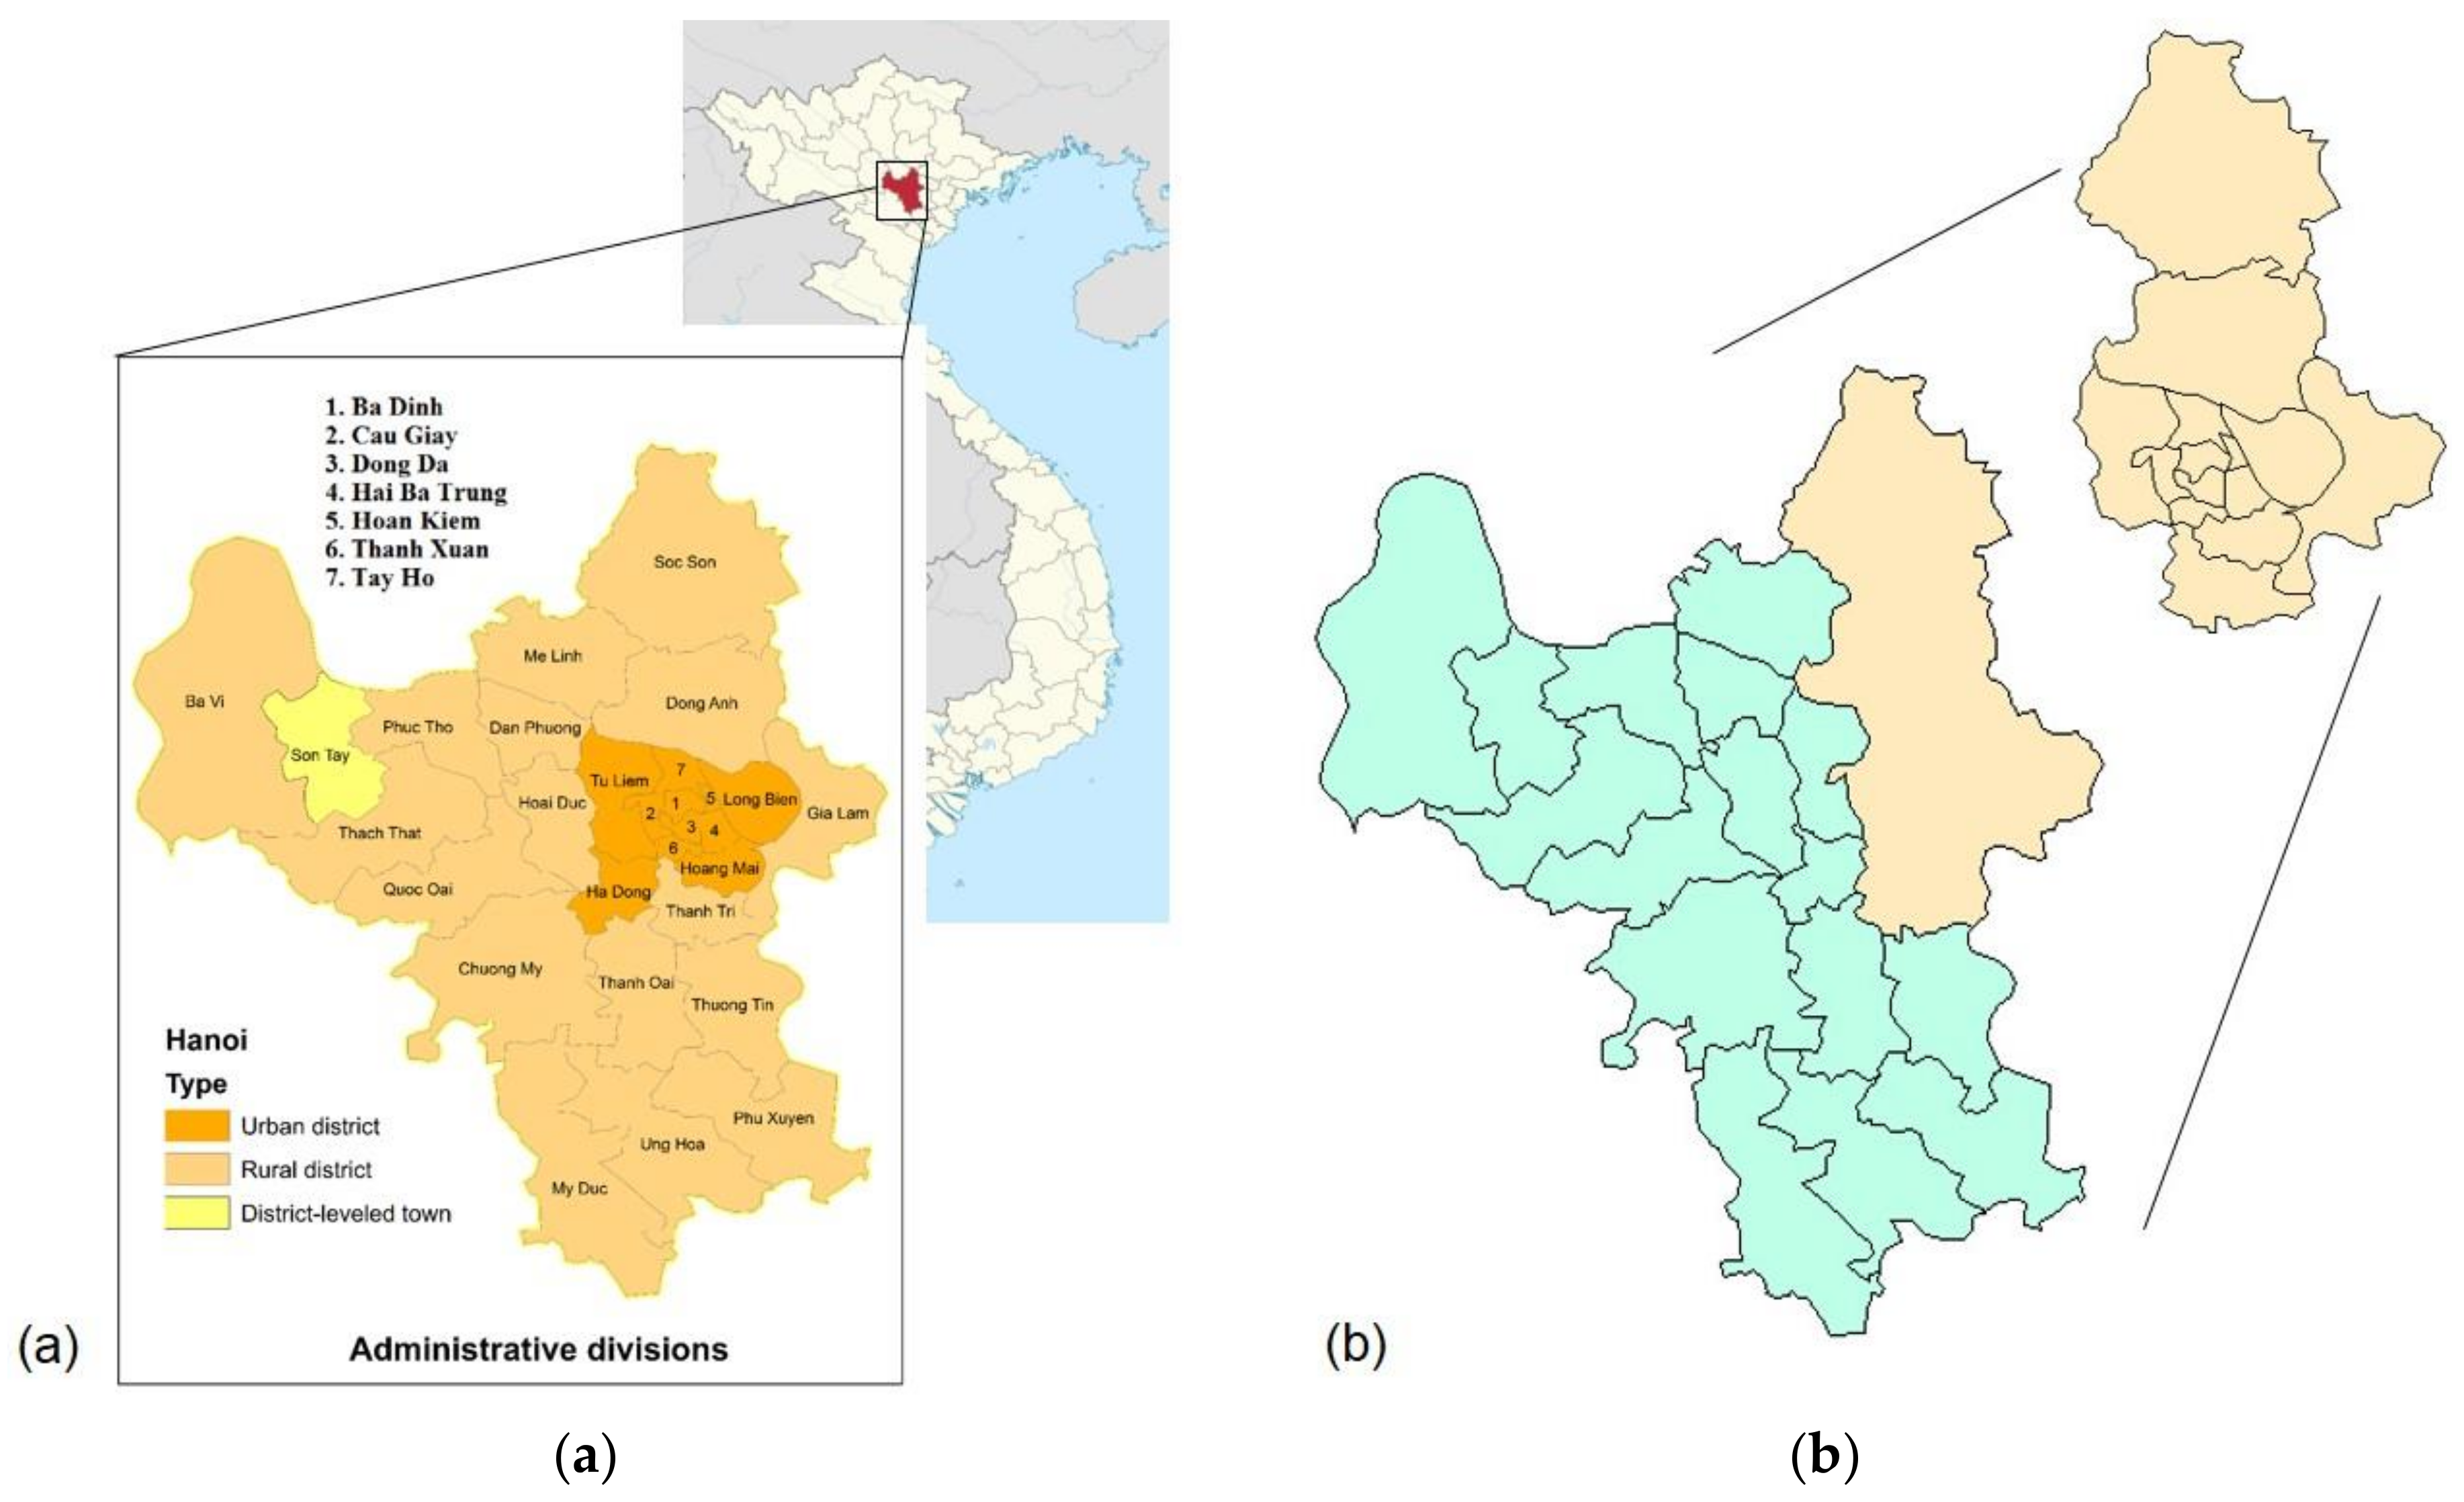
1. Introduction
2. Materials and Methods
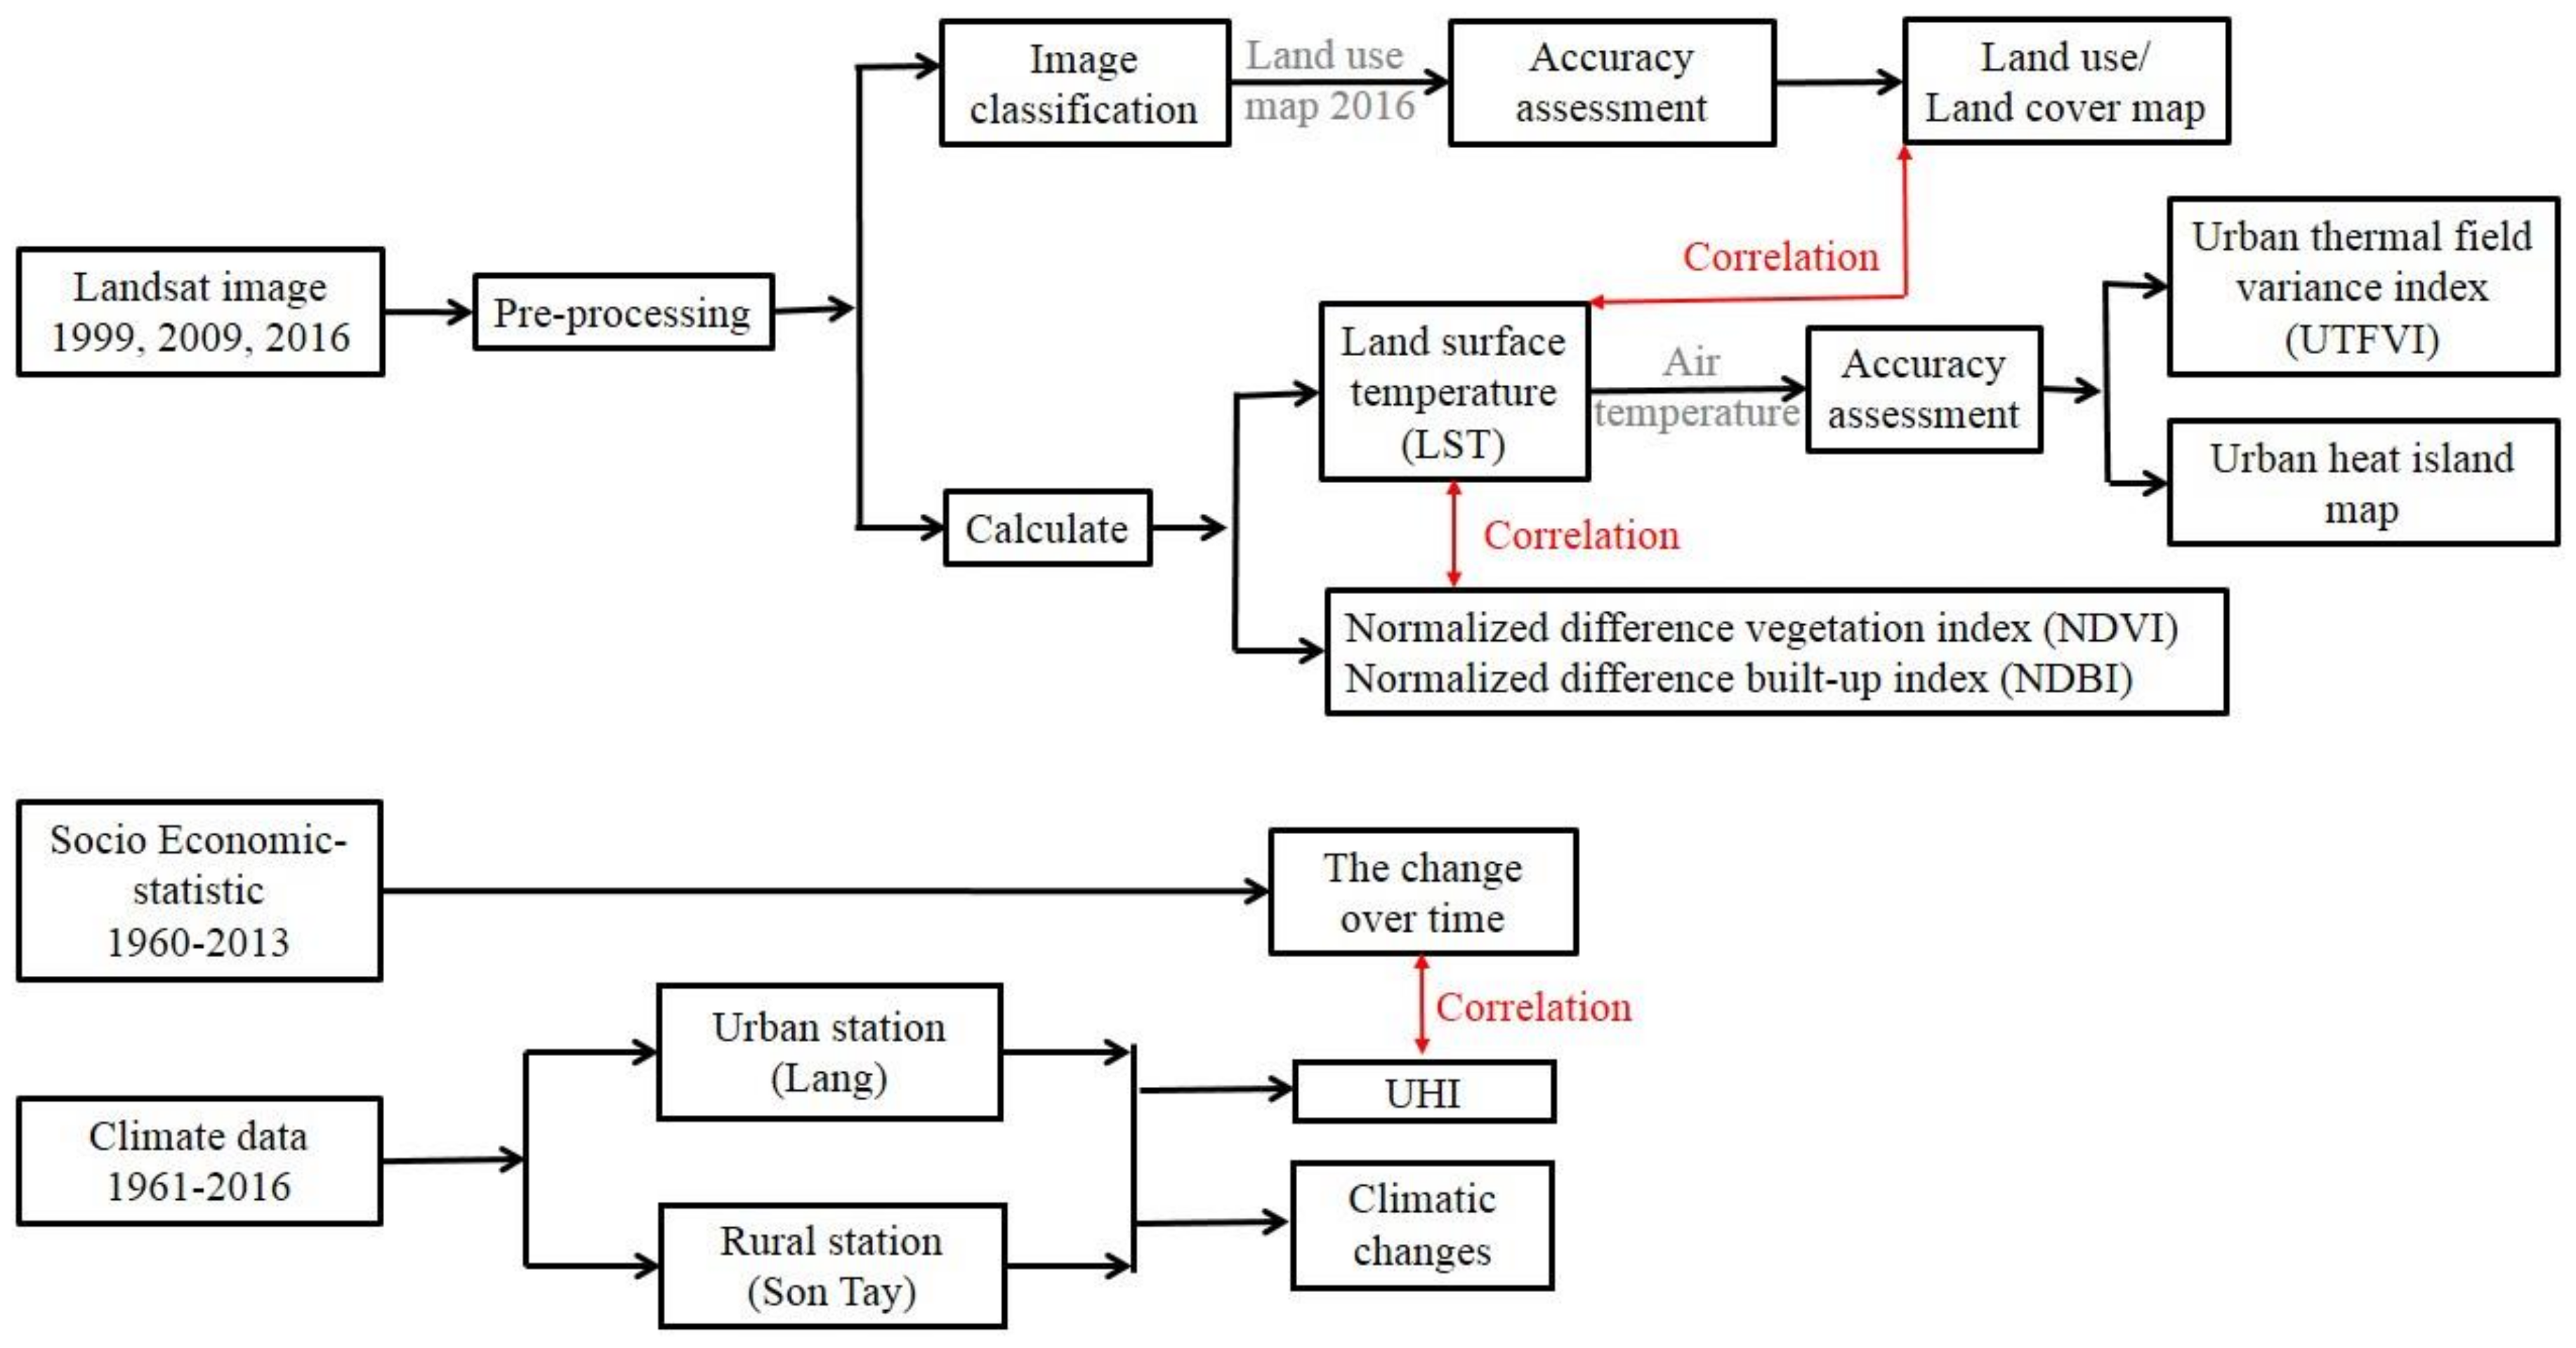
3. Methodology
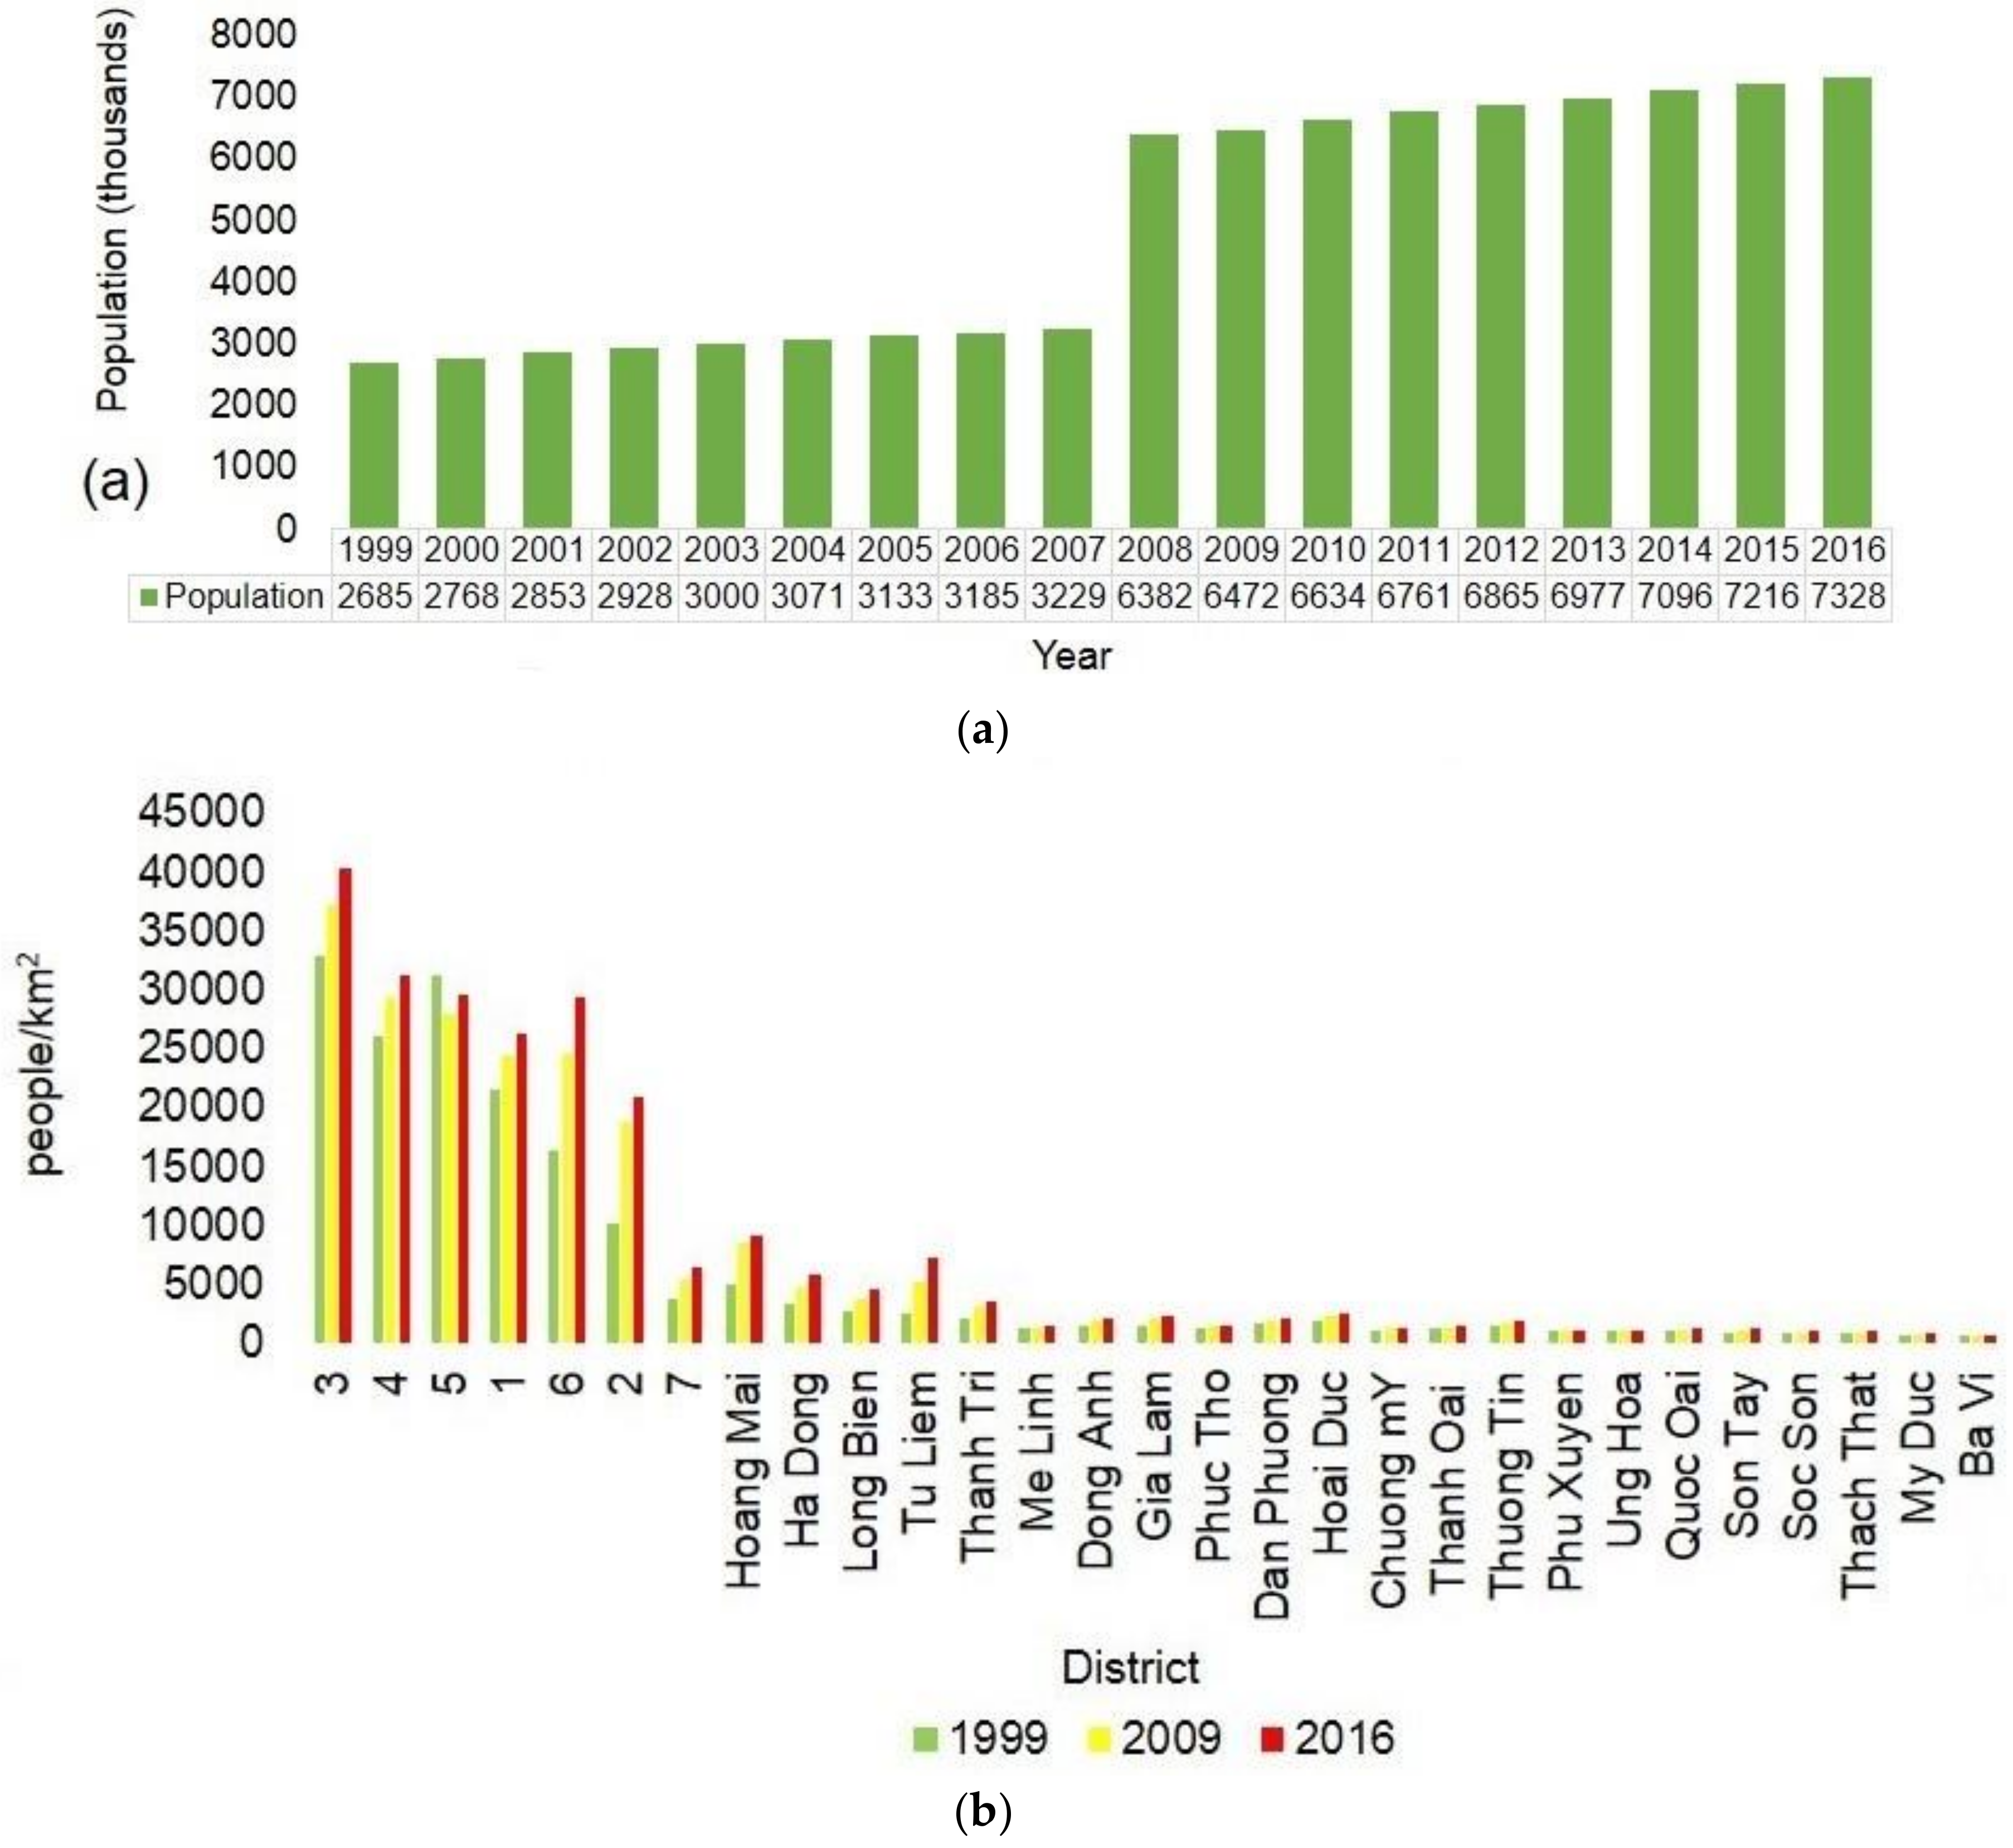
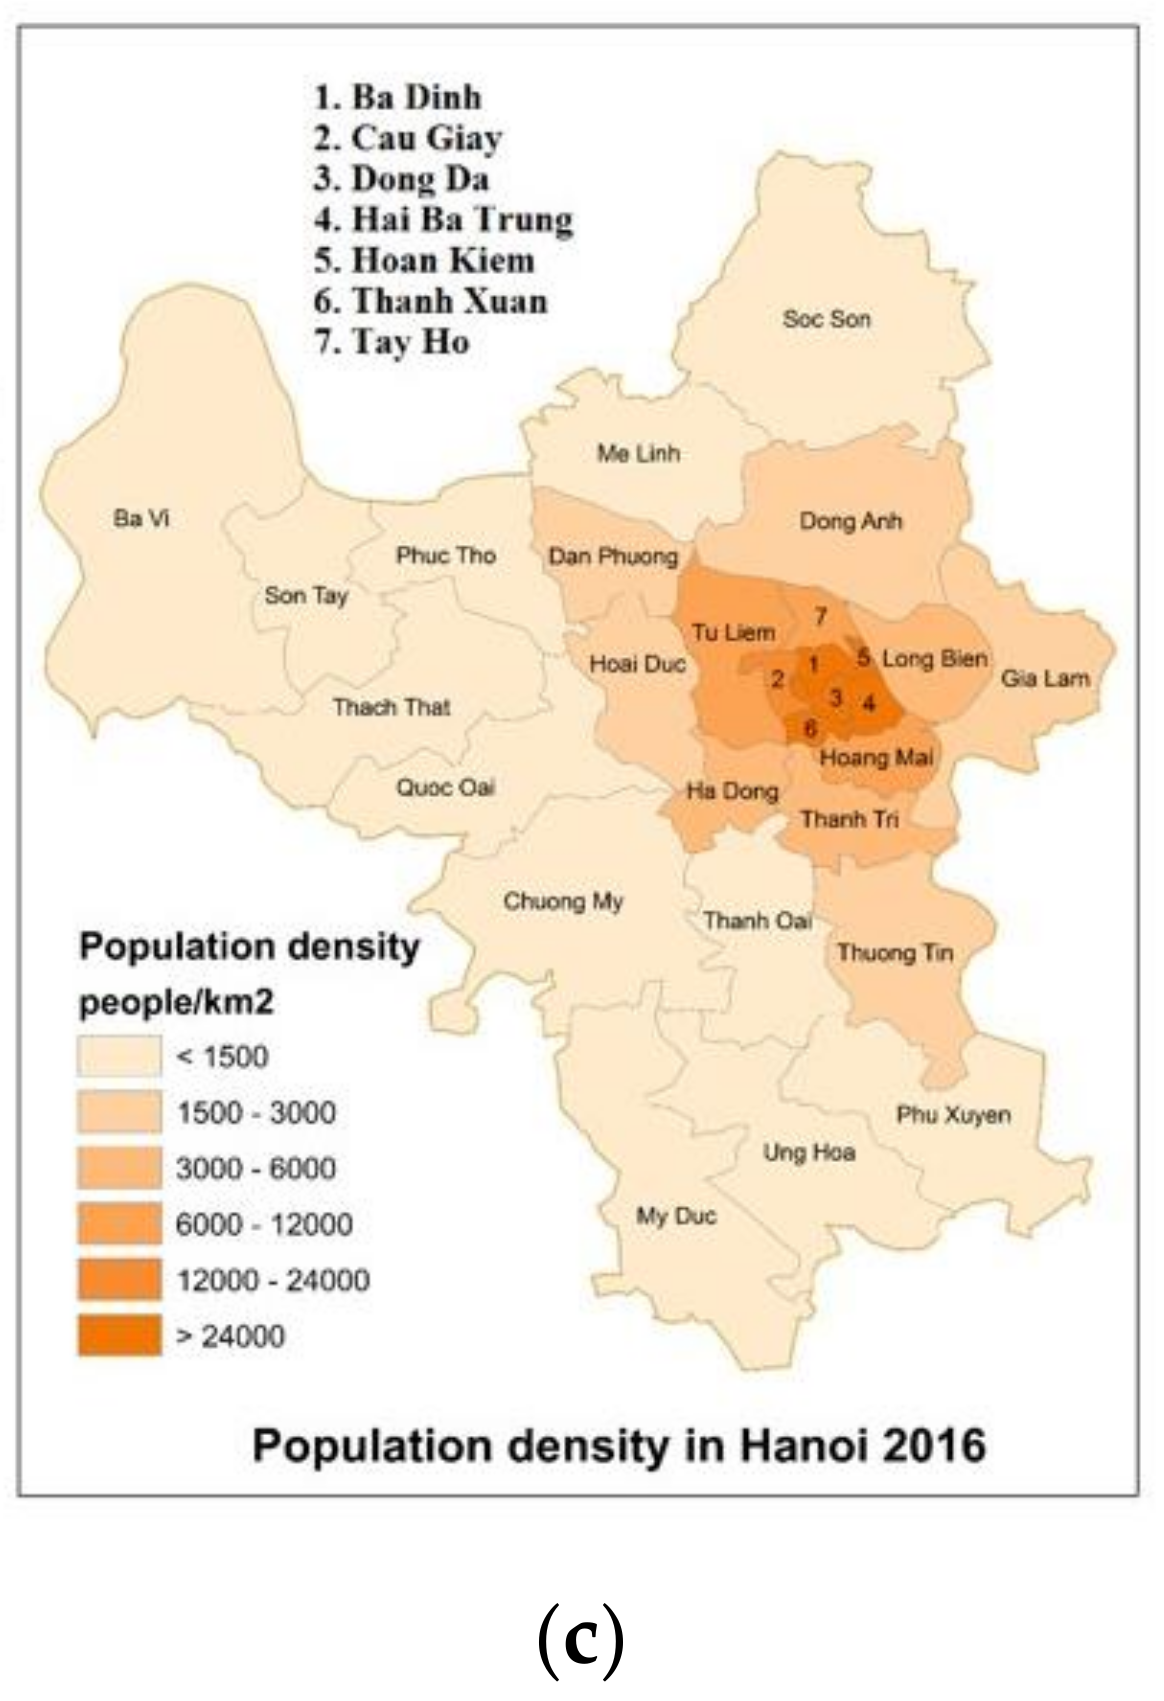
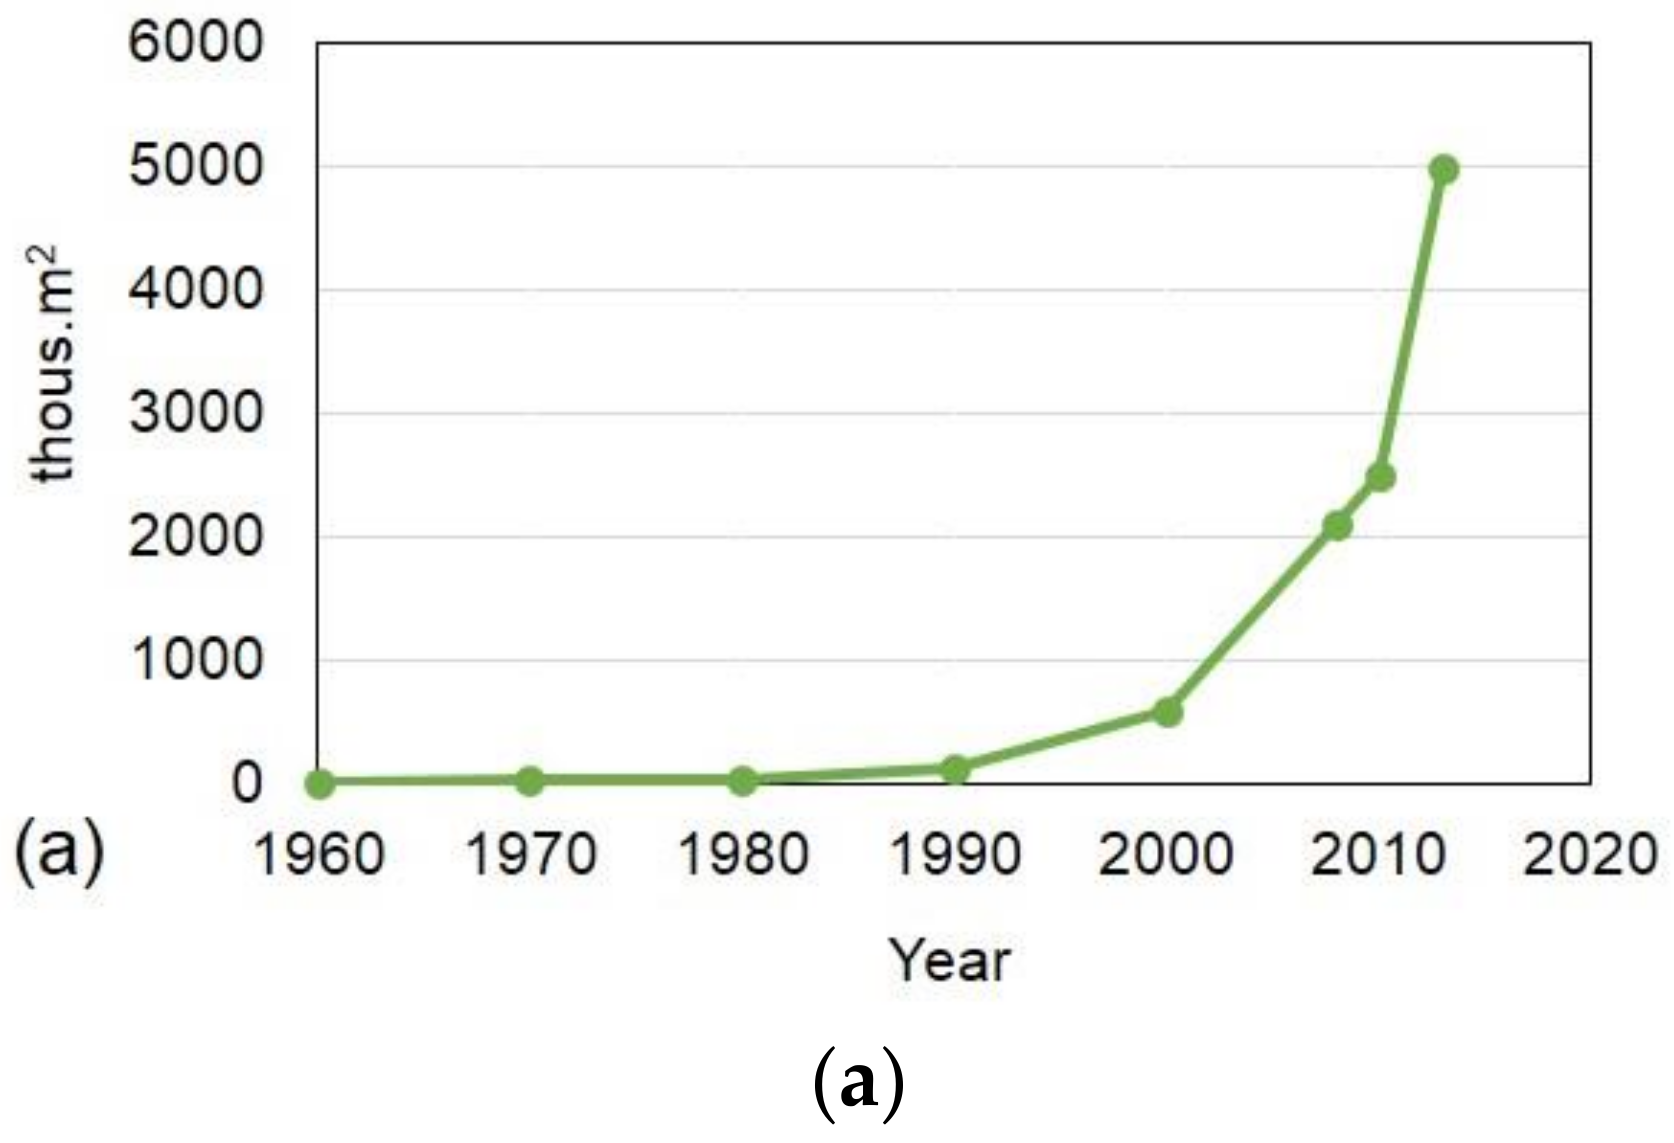
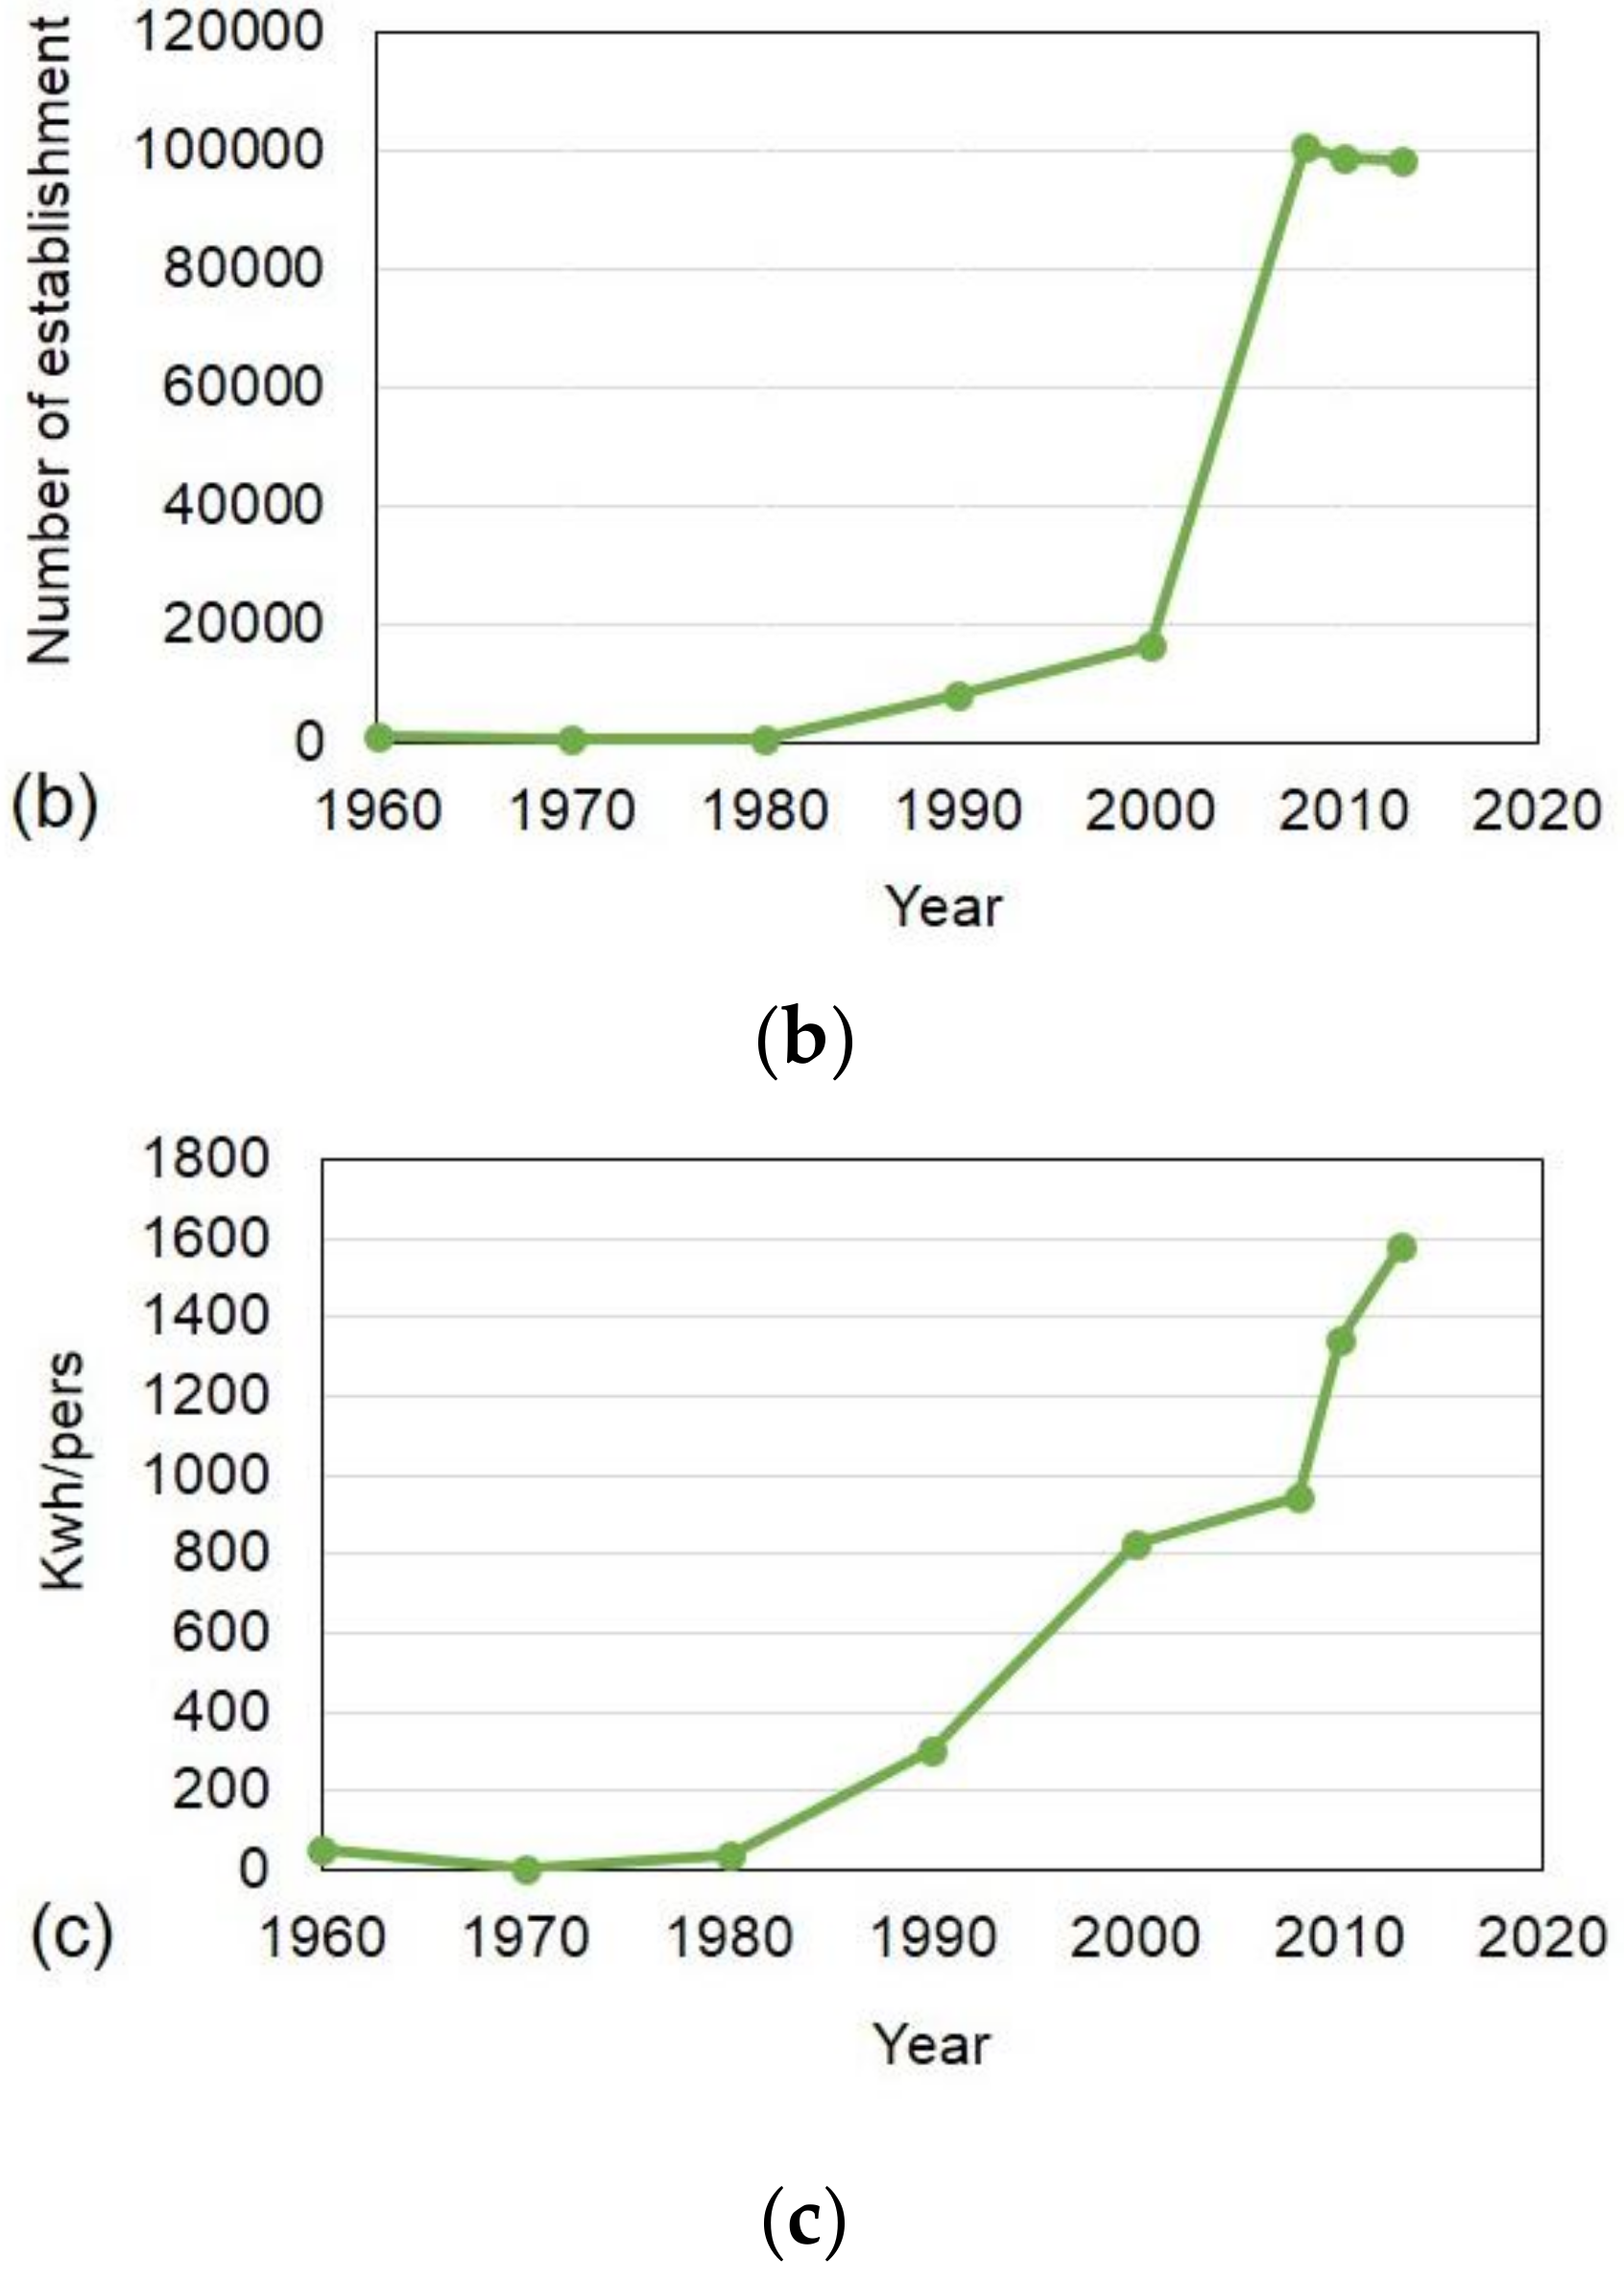
3.1. Change of Urbanization Indicators
3.2. Image Processing
3.2.1. Pre-processing
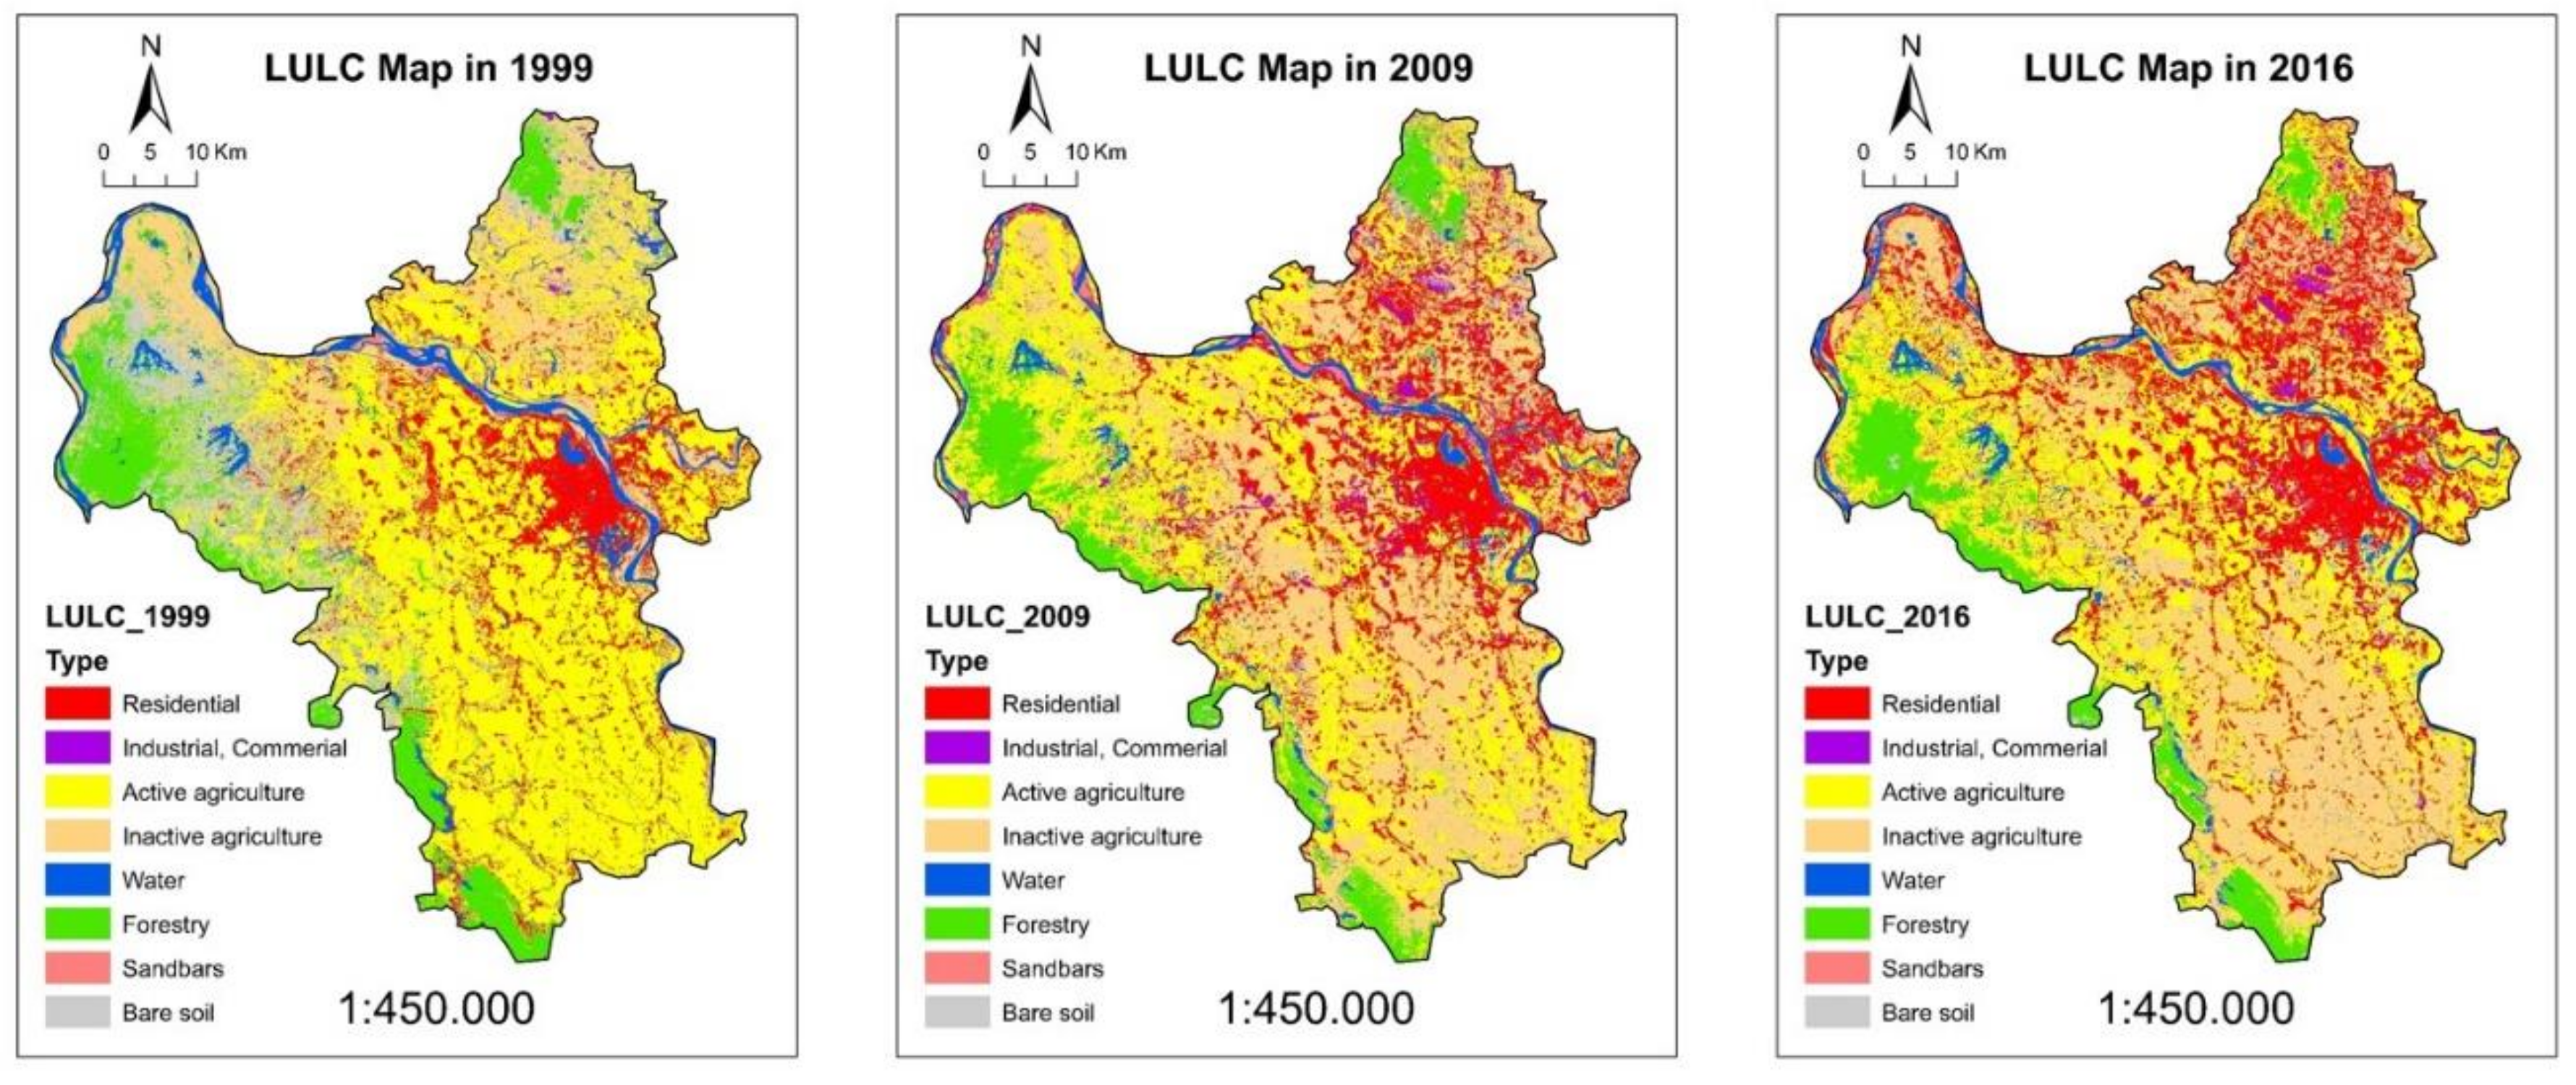
3.2.2. Mapping Land Use Land Cover (LULC)
3.2.3. Calculation of NDVI and NDBI
3.2.4. Retrieval of LST
3.2.5. Mapping of the UHI zone
3.2.6. Urban Thermal Field Variance Index (UTFVI)
3.3. Variation of Meteorology
3.4. Statistical Analysis
4. Results and Discussion
4.1. Evolvement of Urbanization in Hanoi
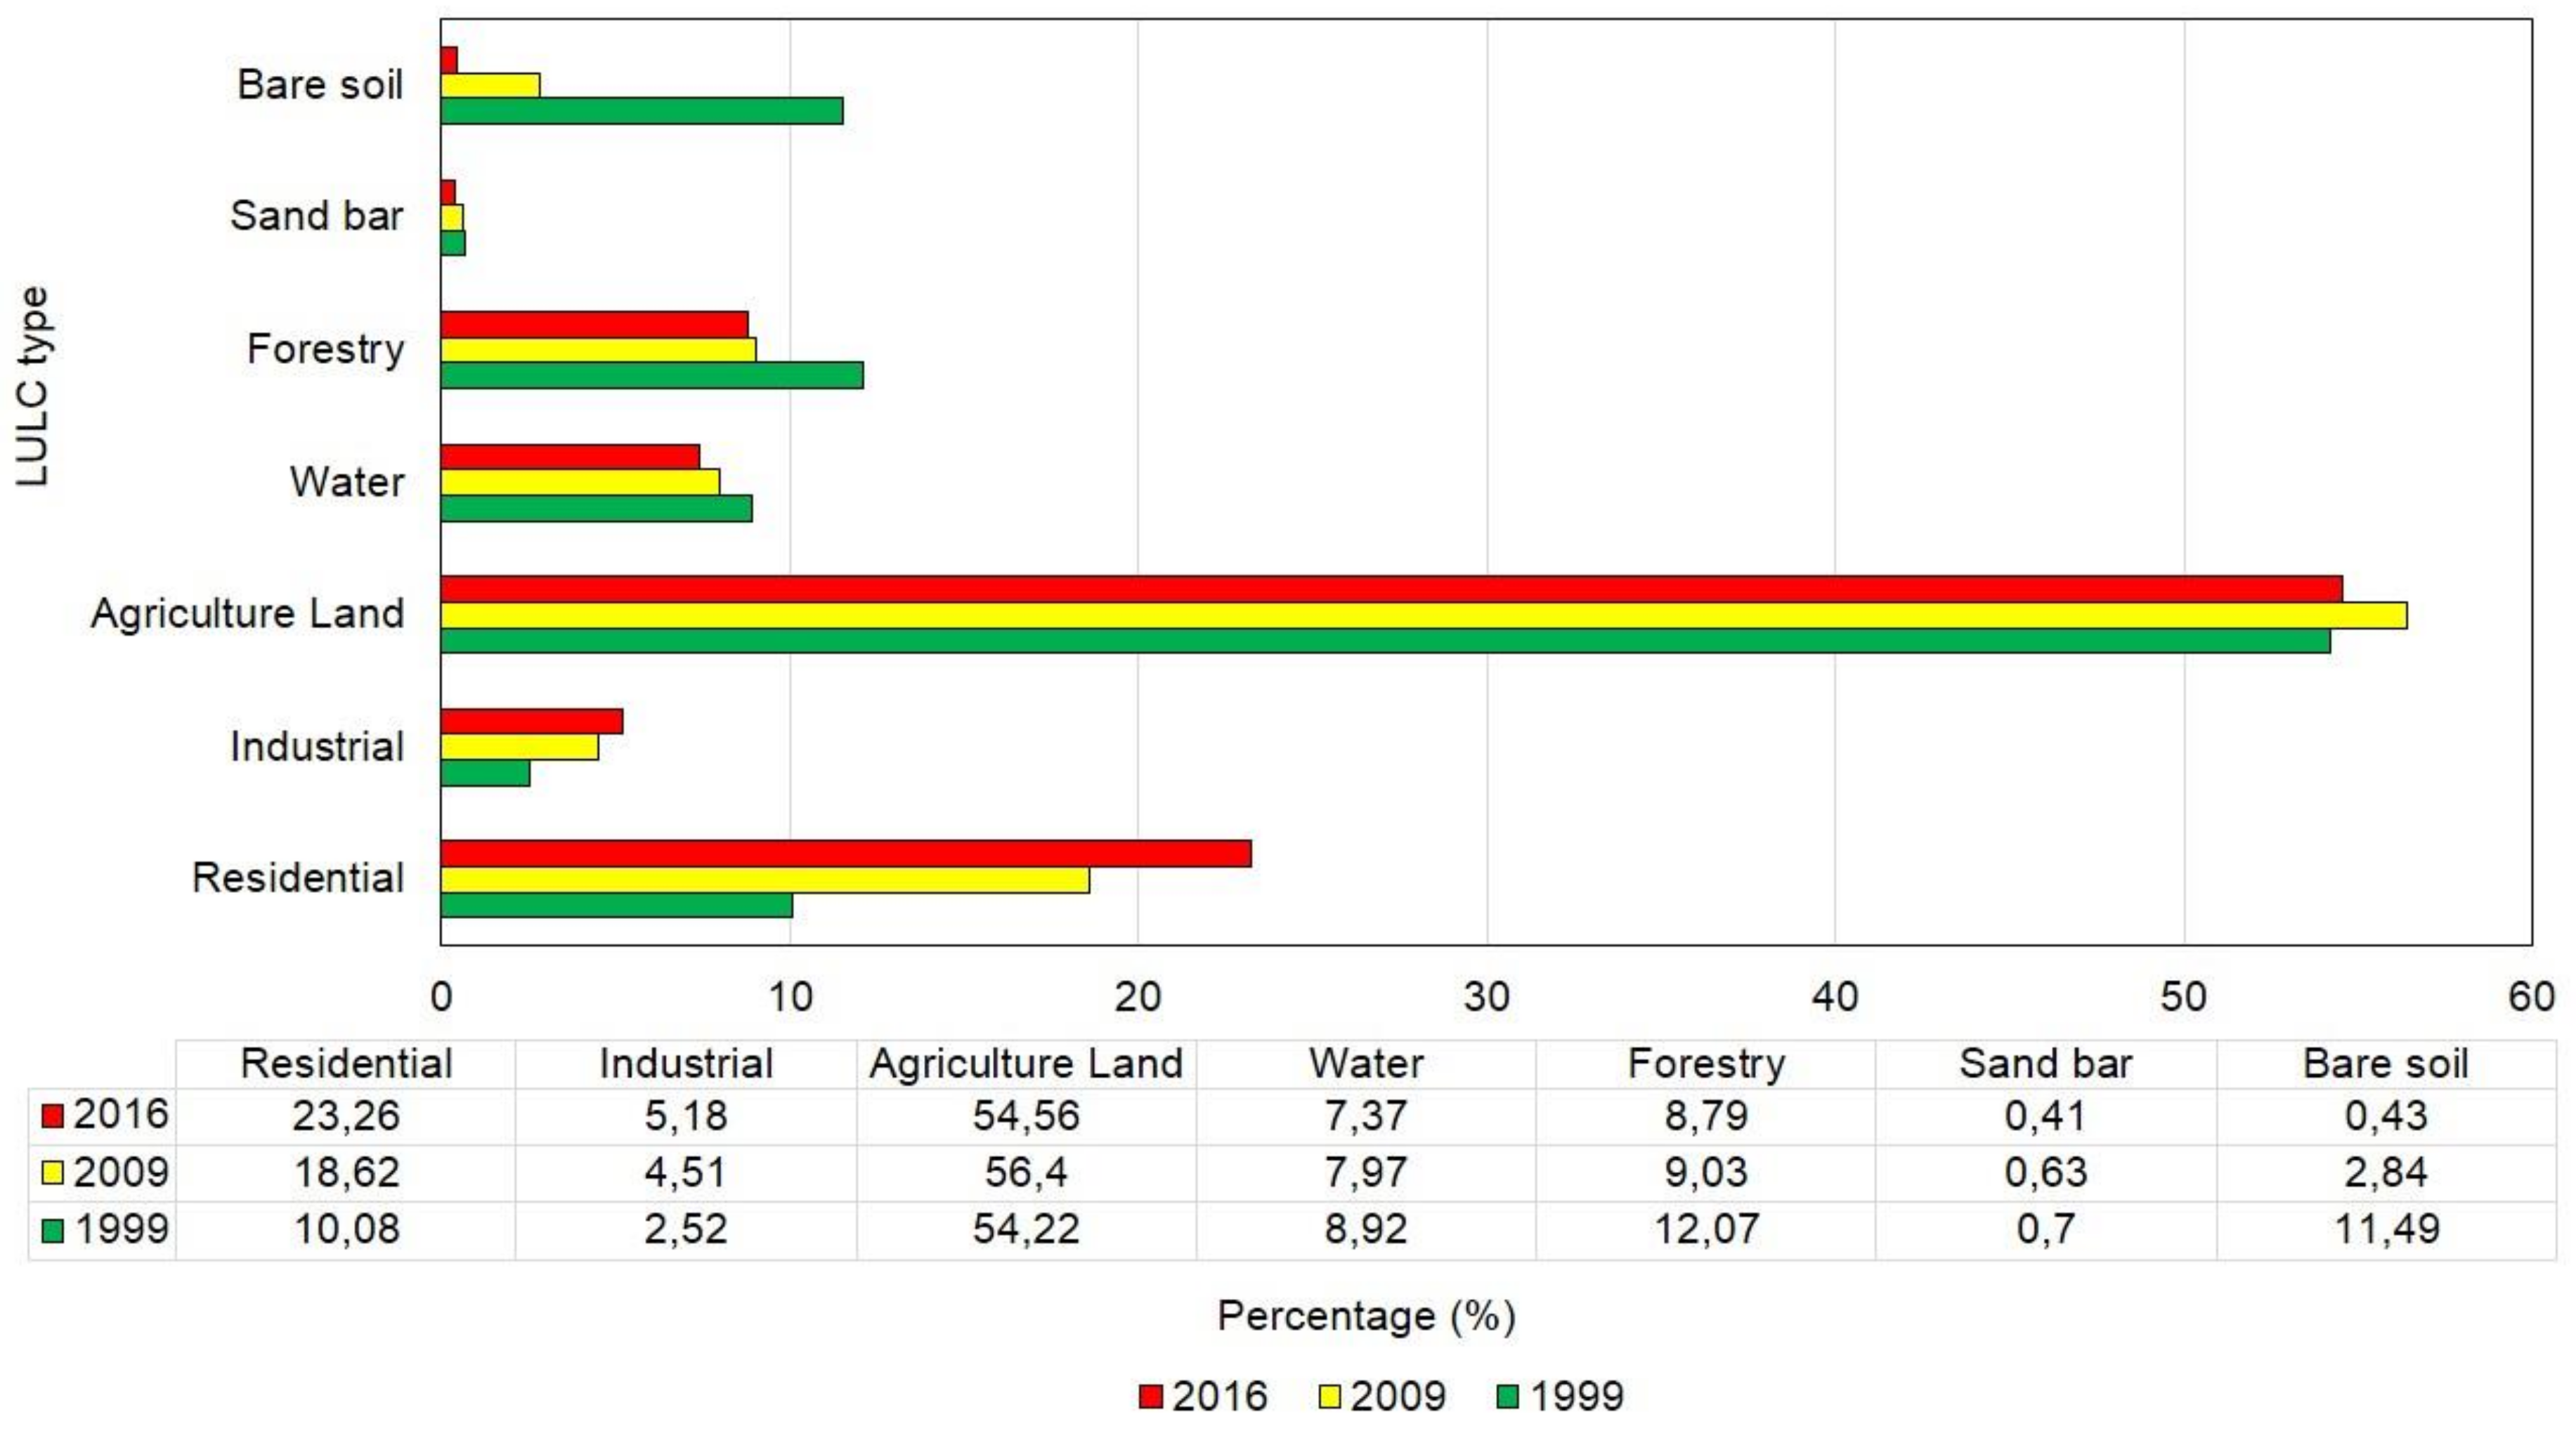
4.2. Changes of LULC
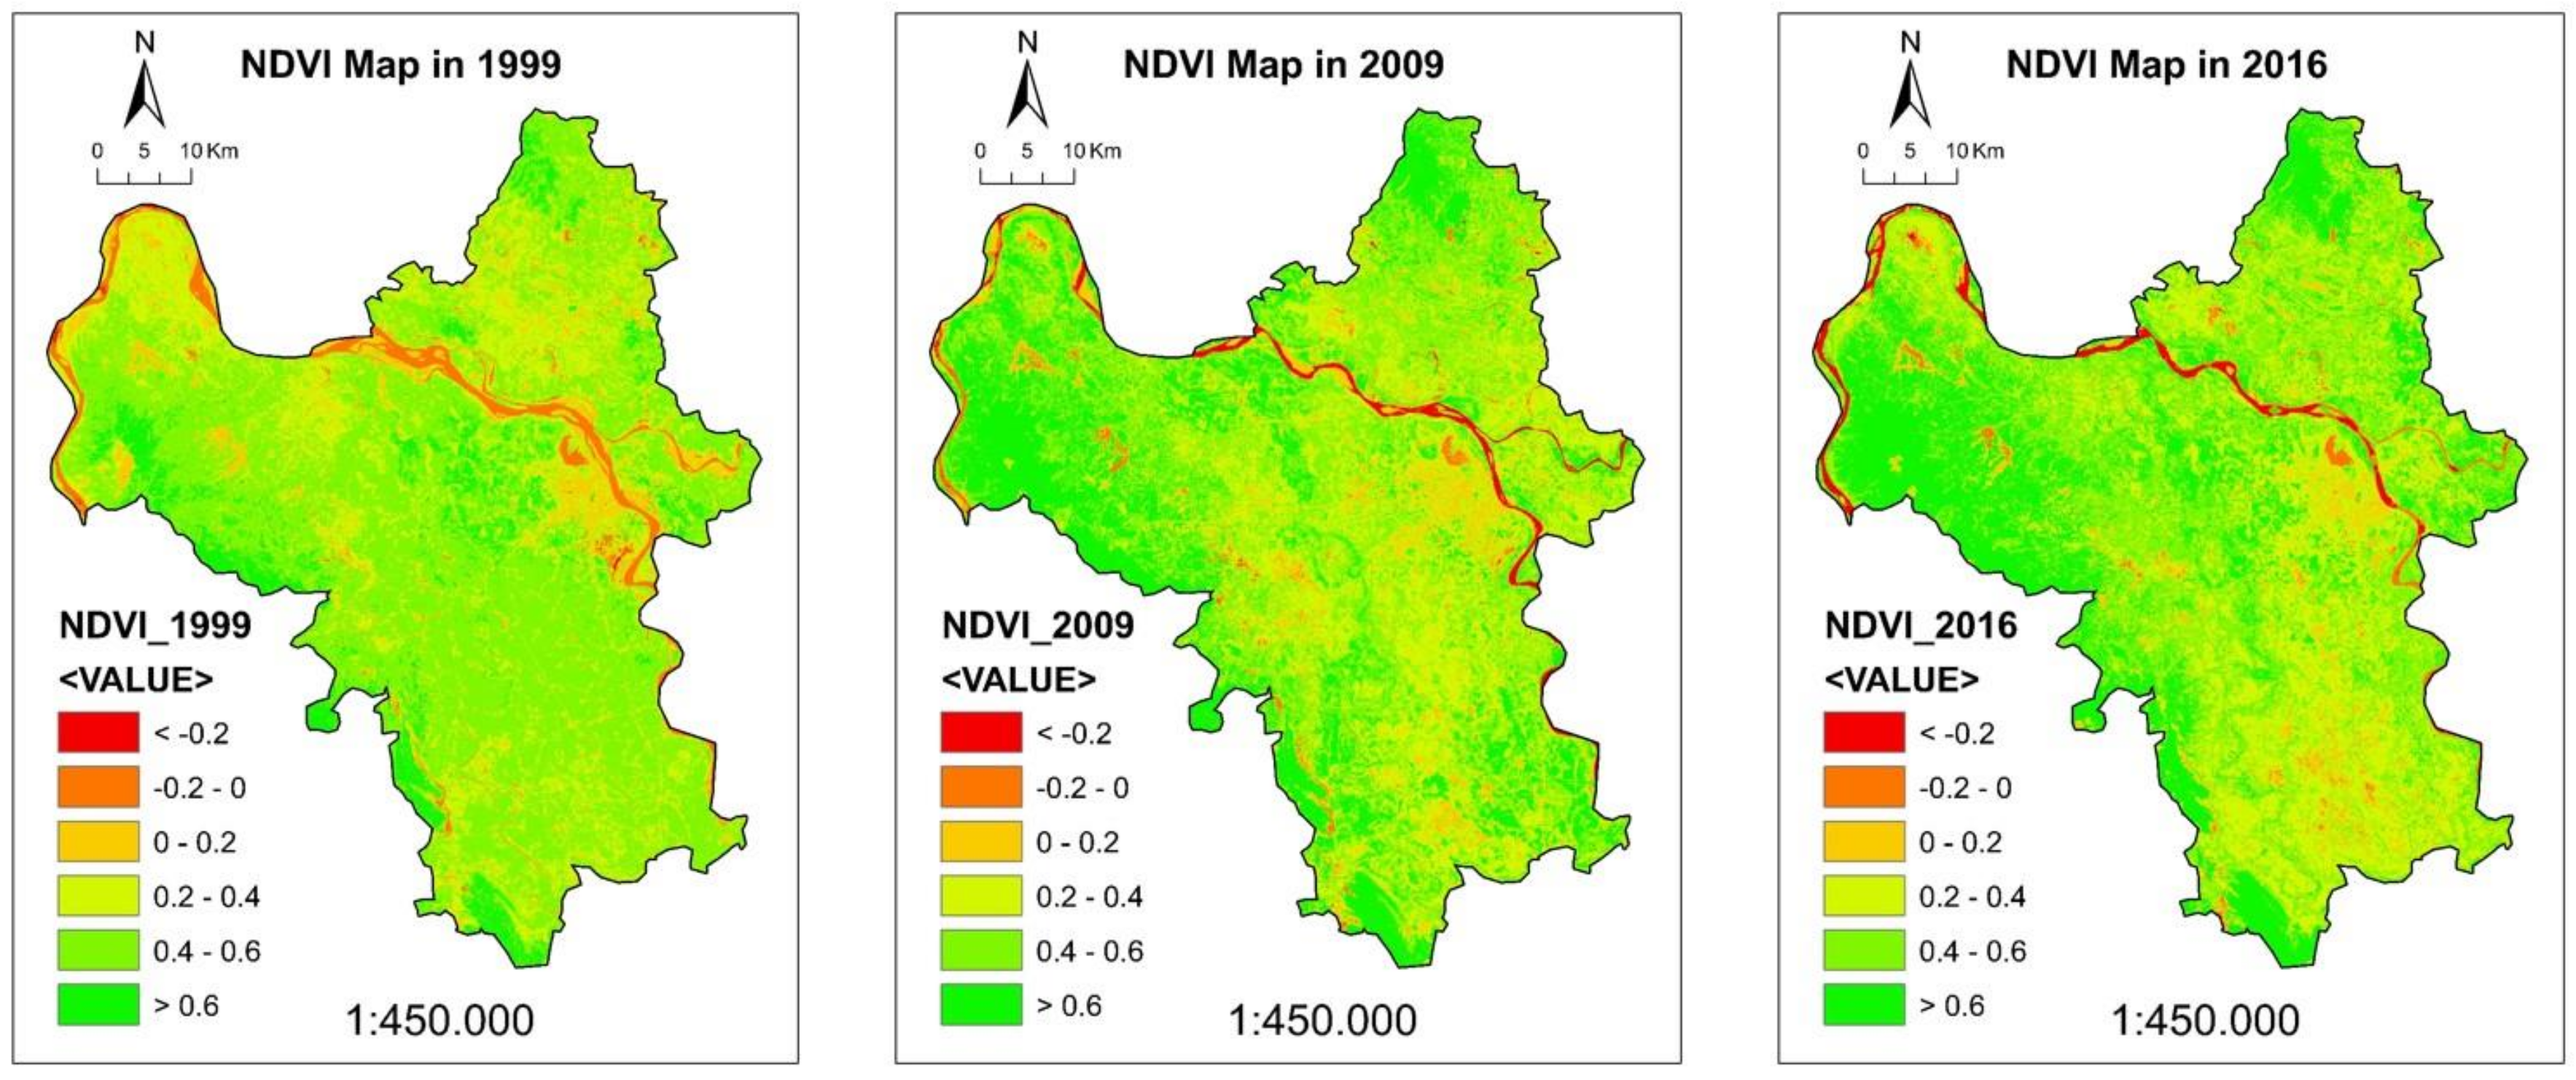
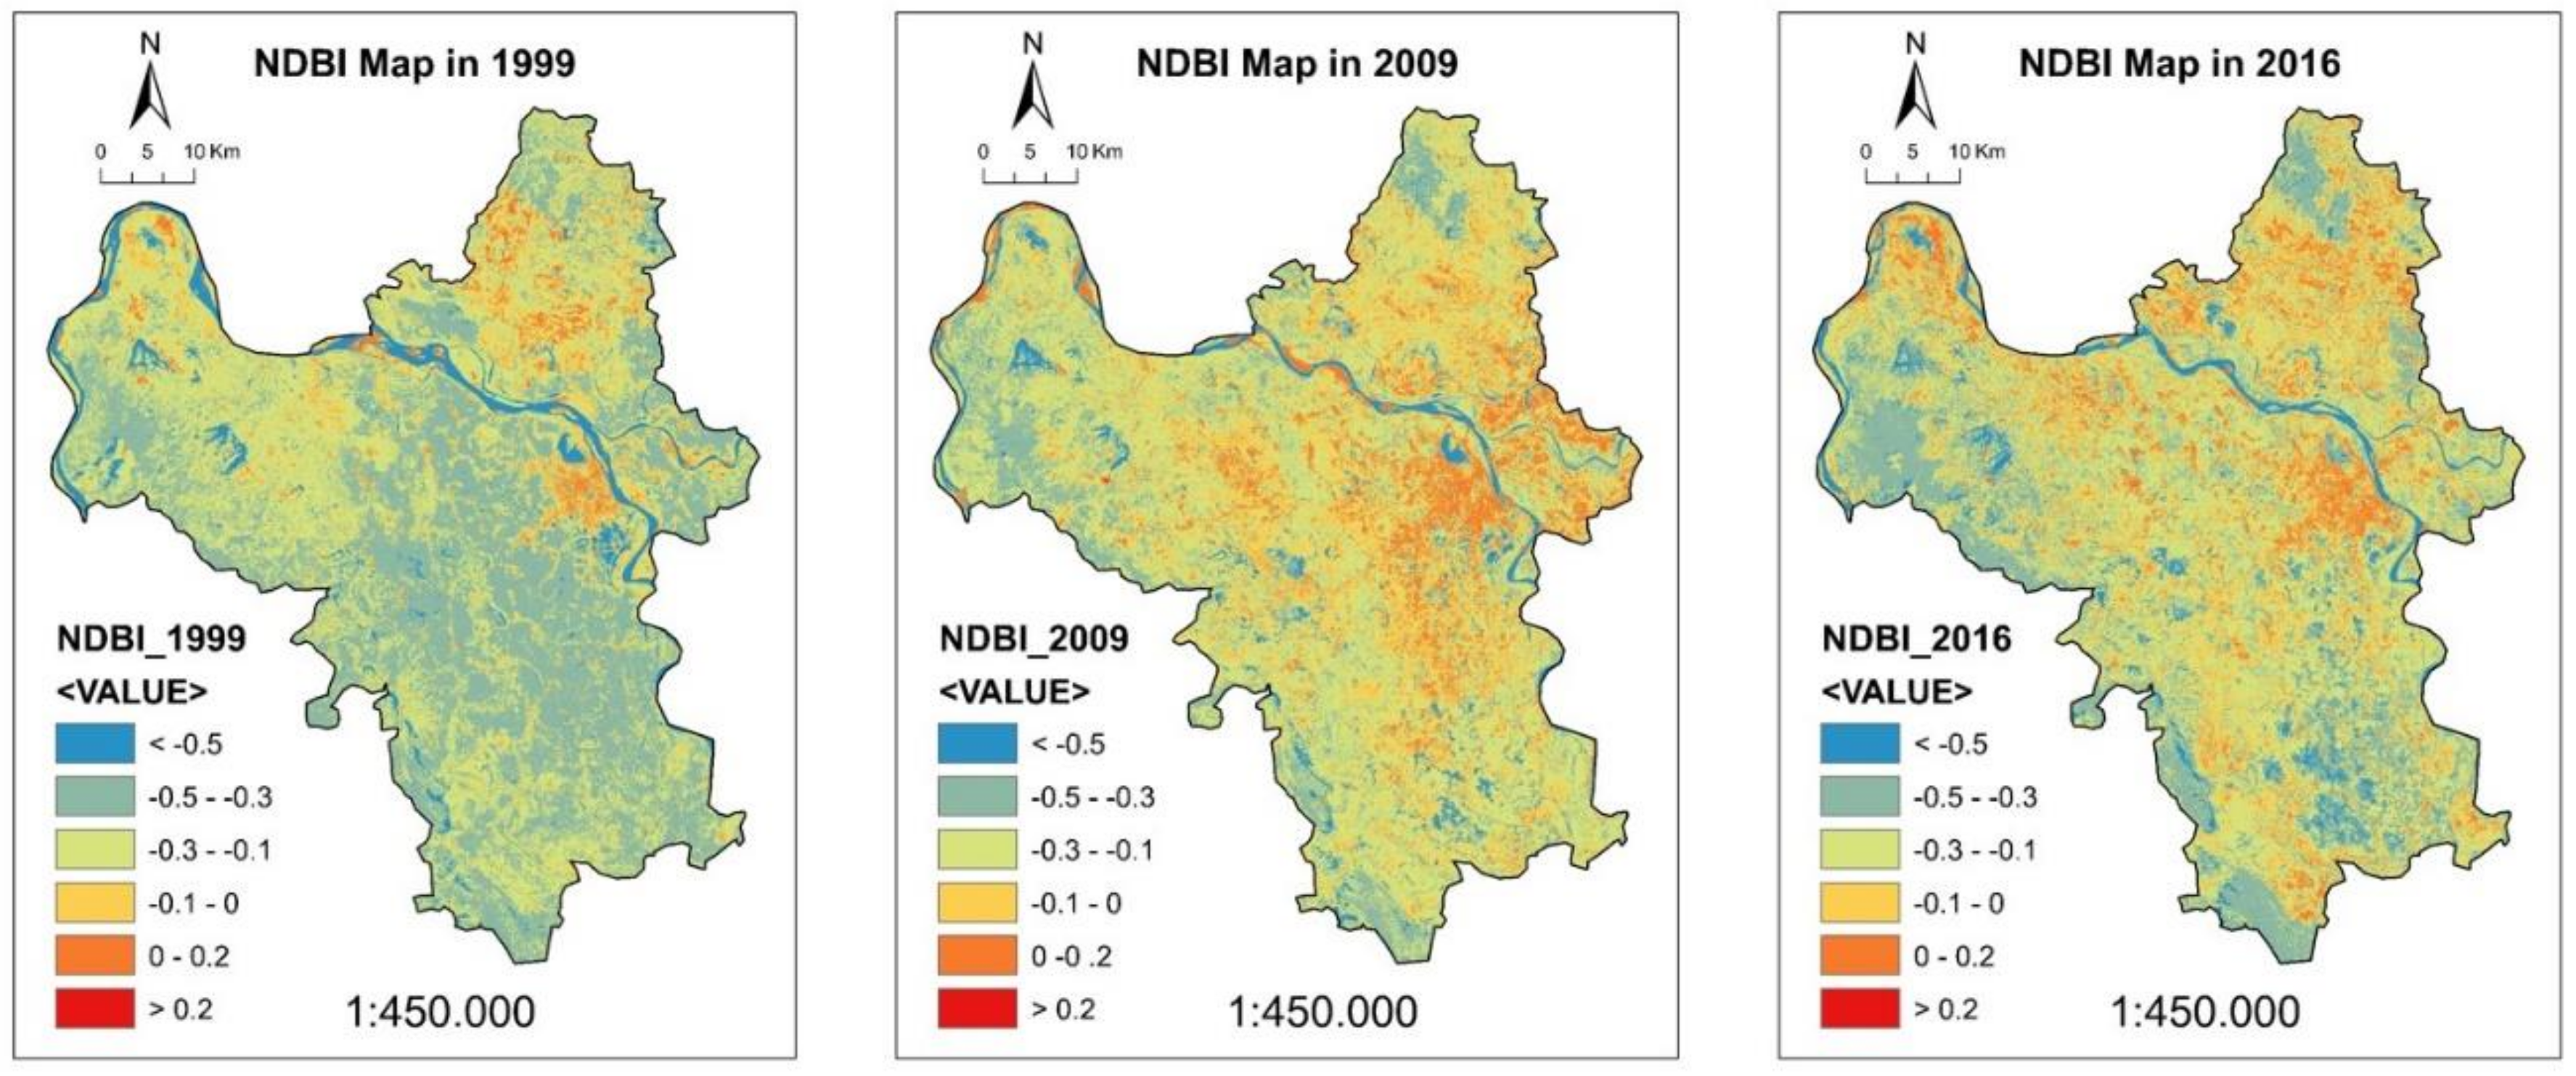
4.3. NDVI and NDBI Maps
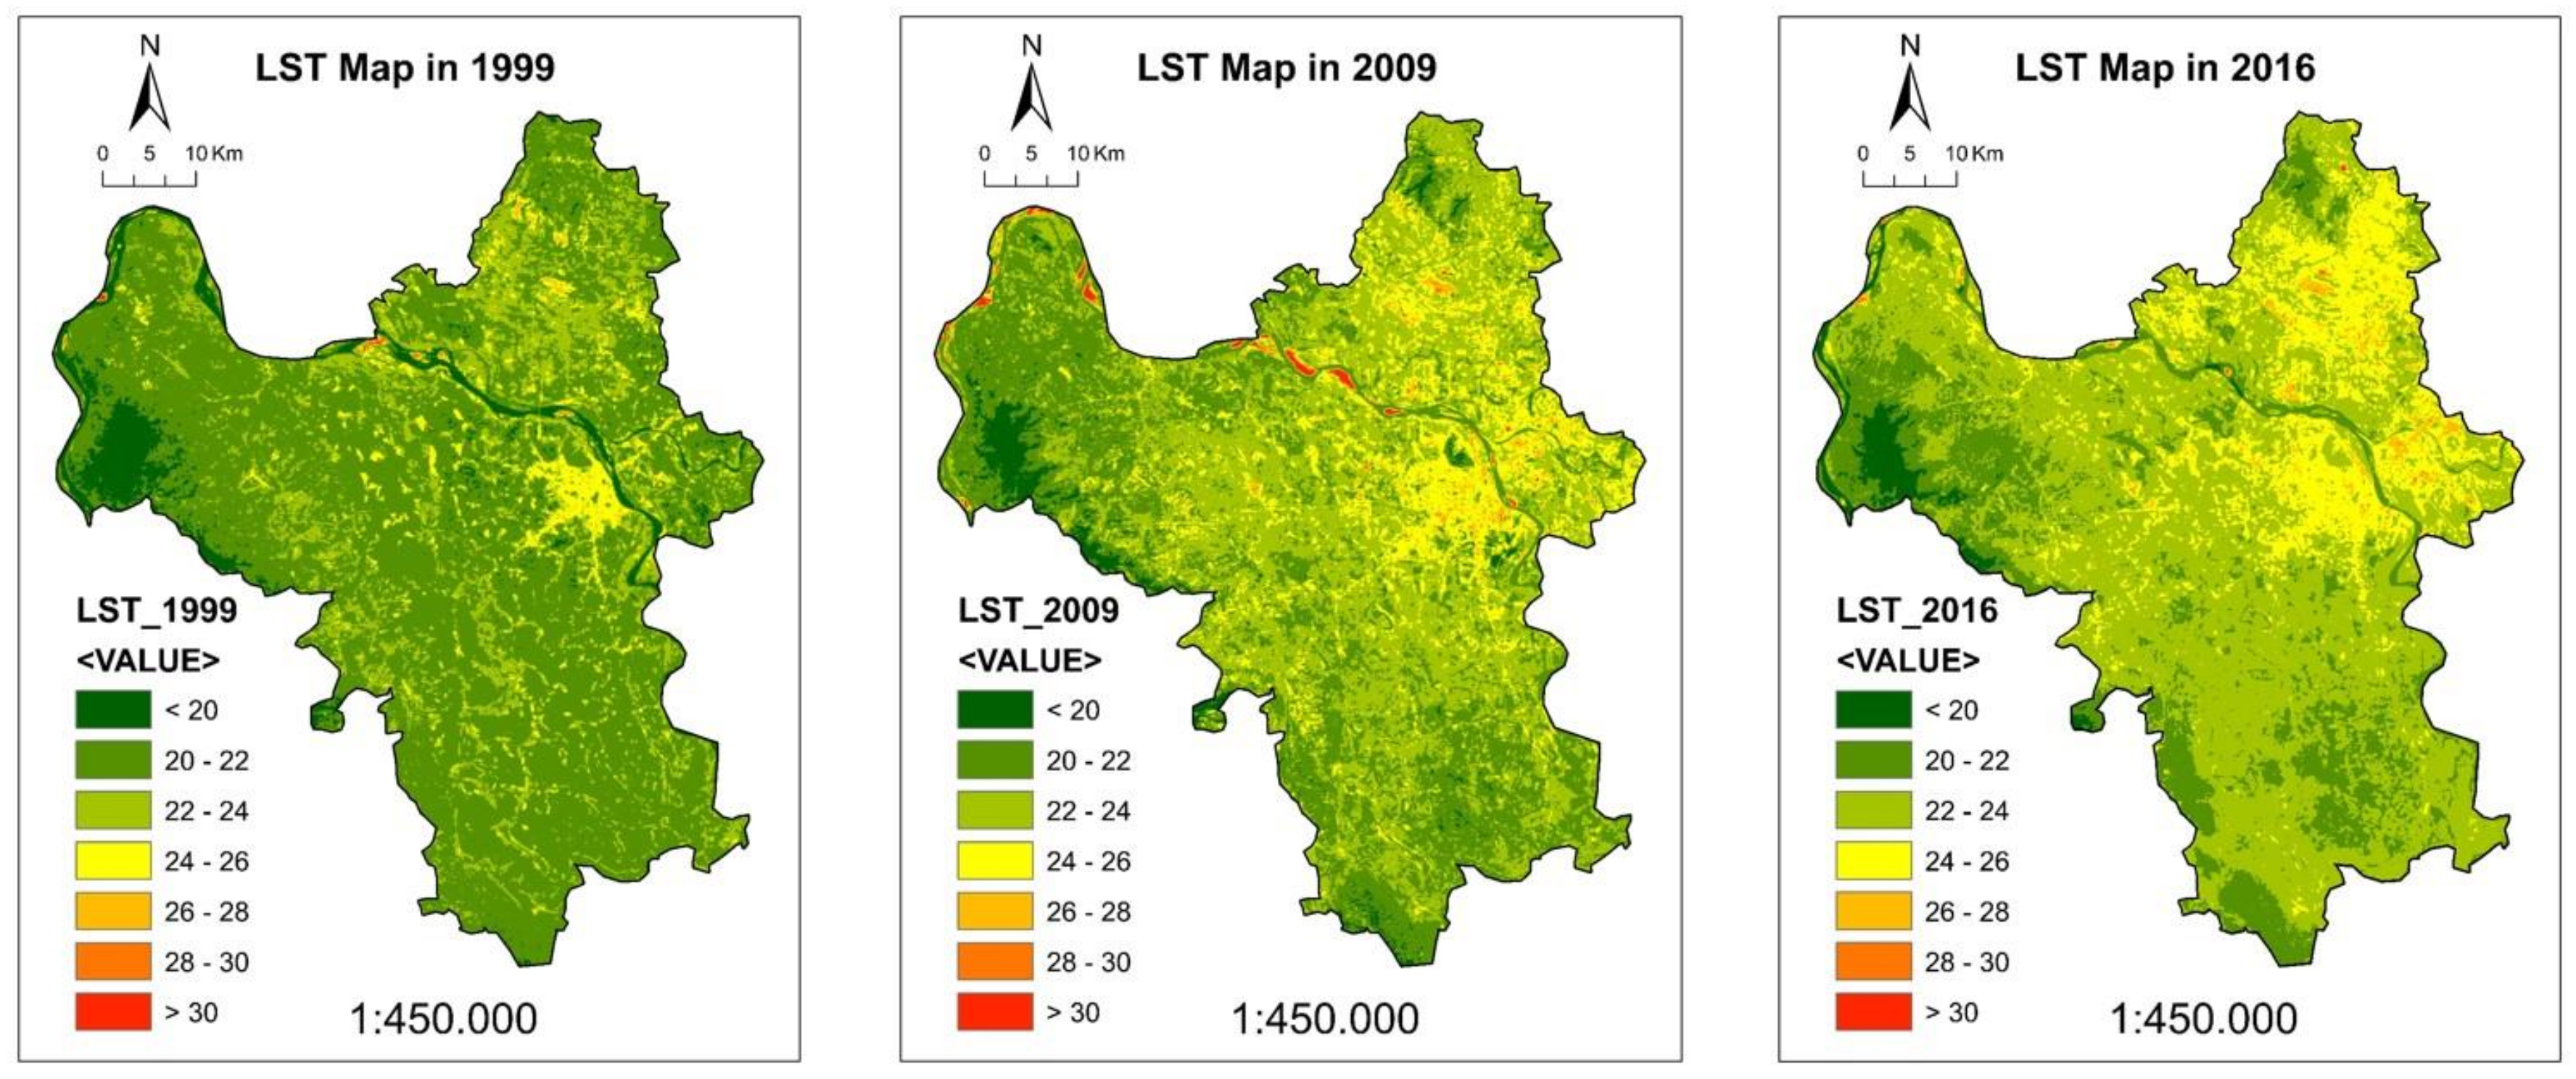
4.4. LST Retrievals
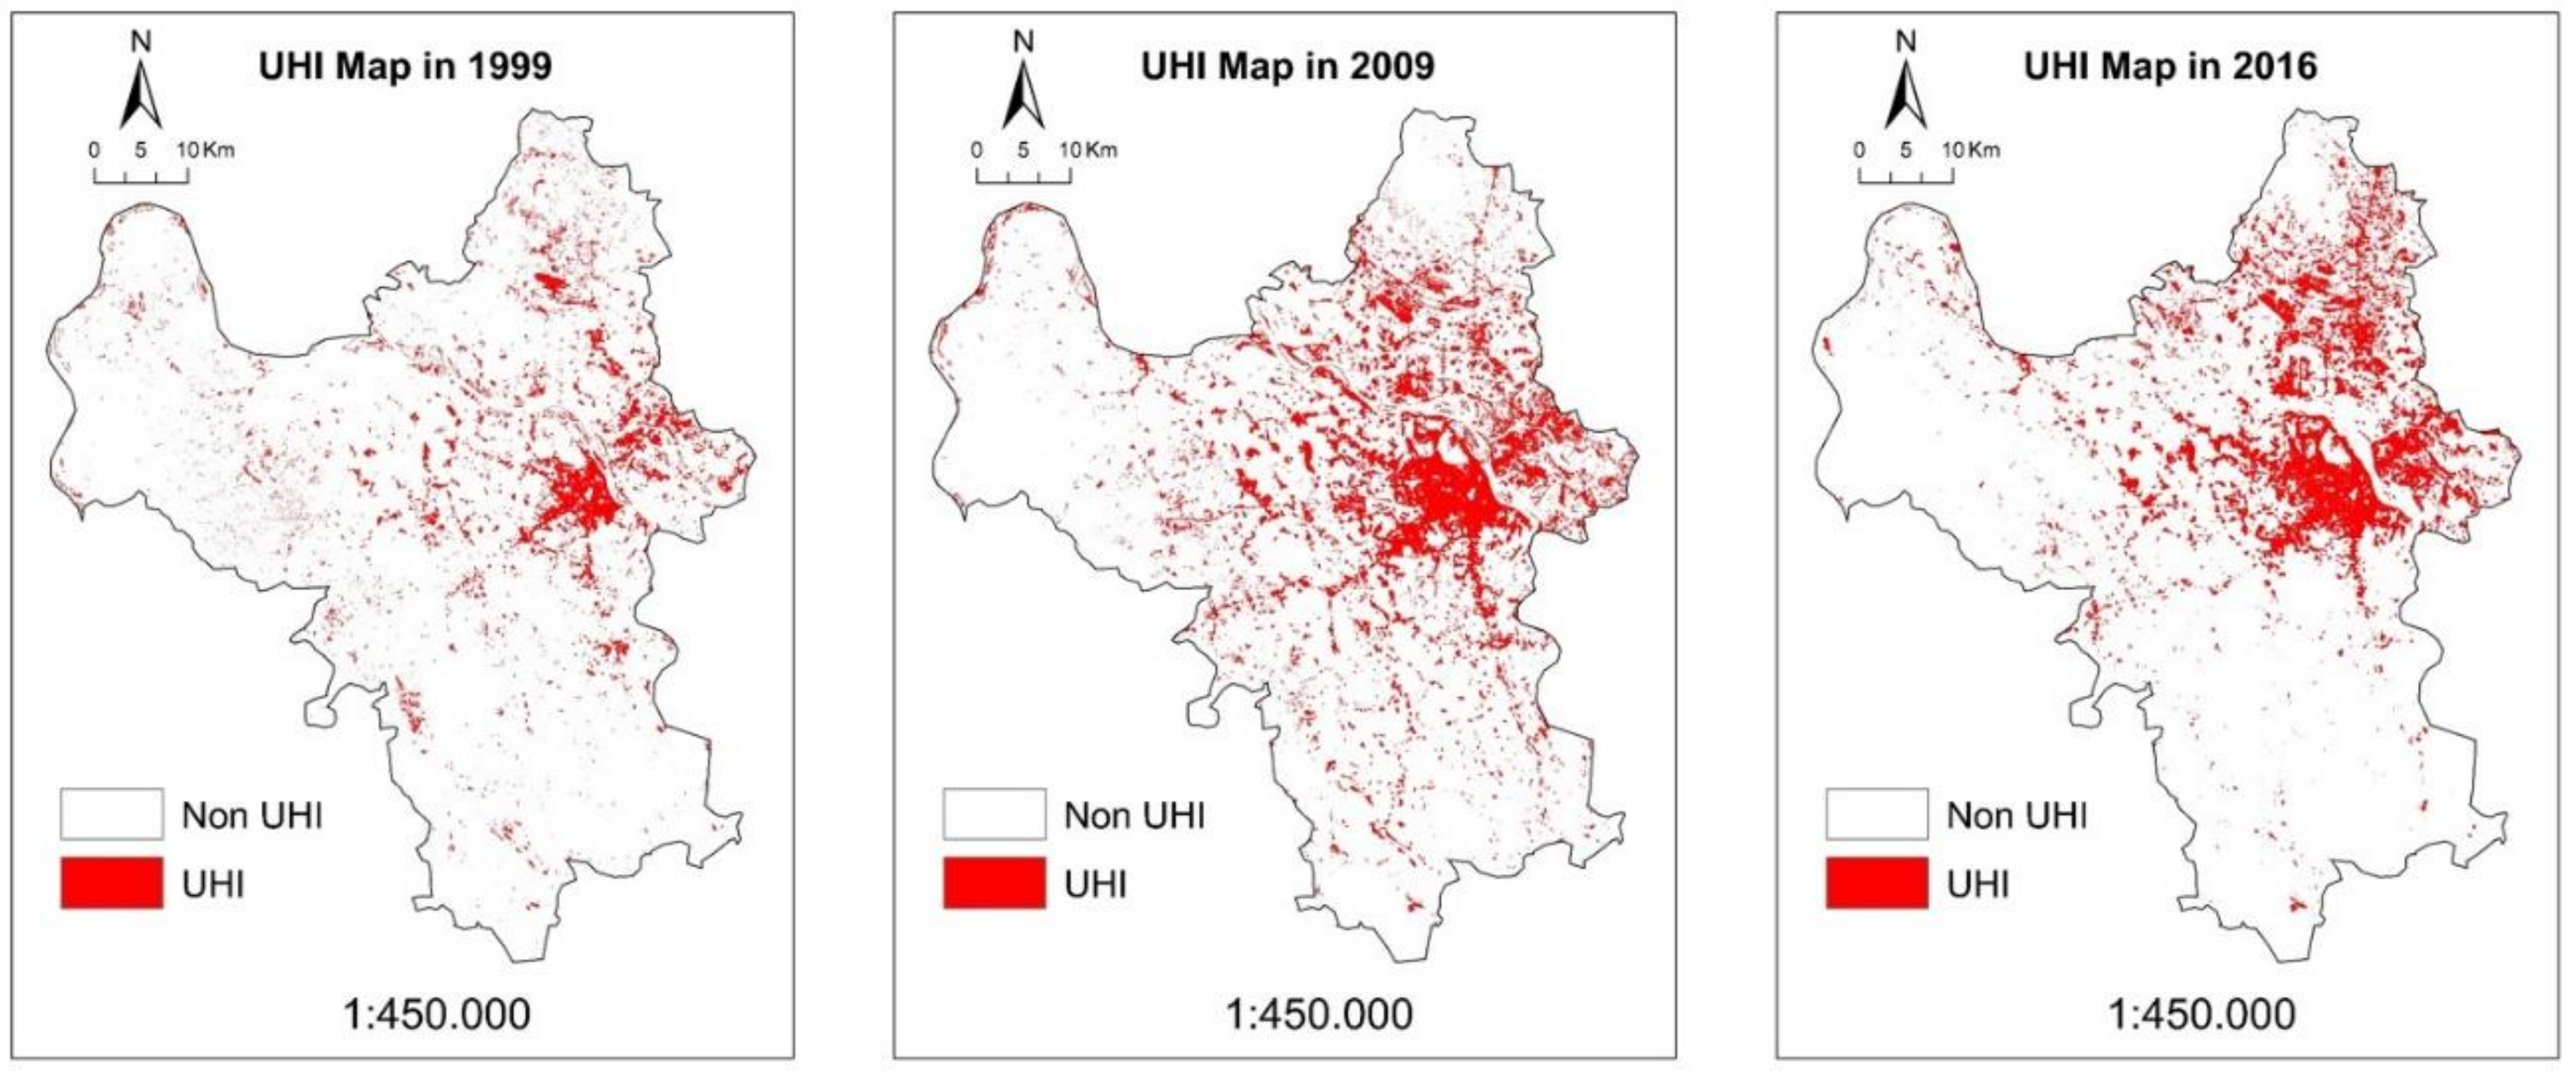
4.5. UHI and Non-UHI Zone
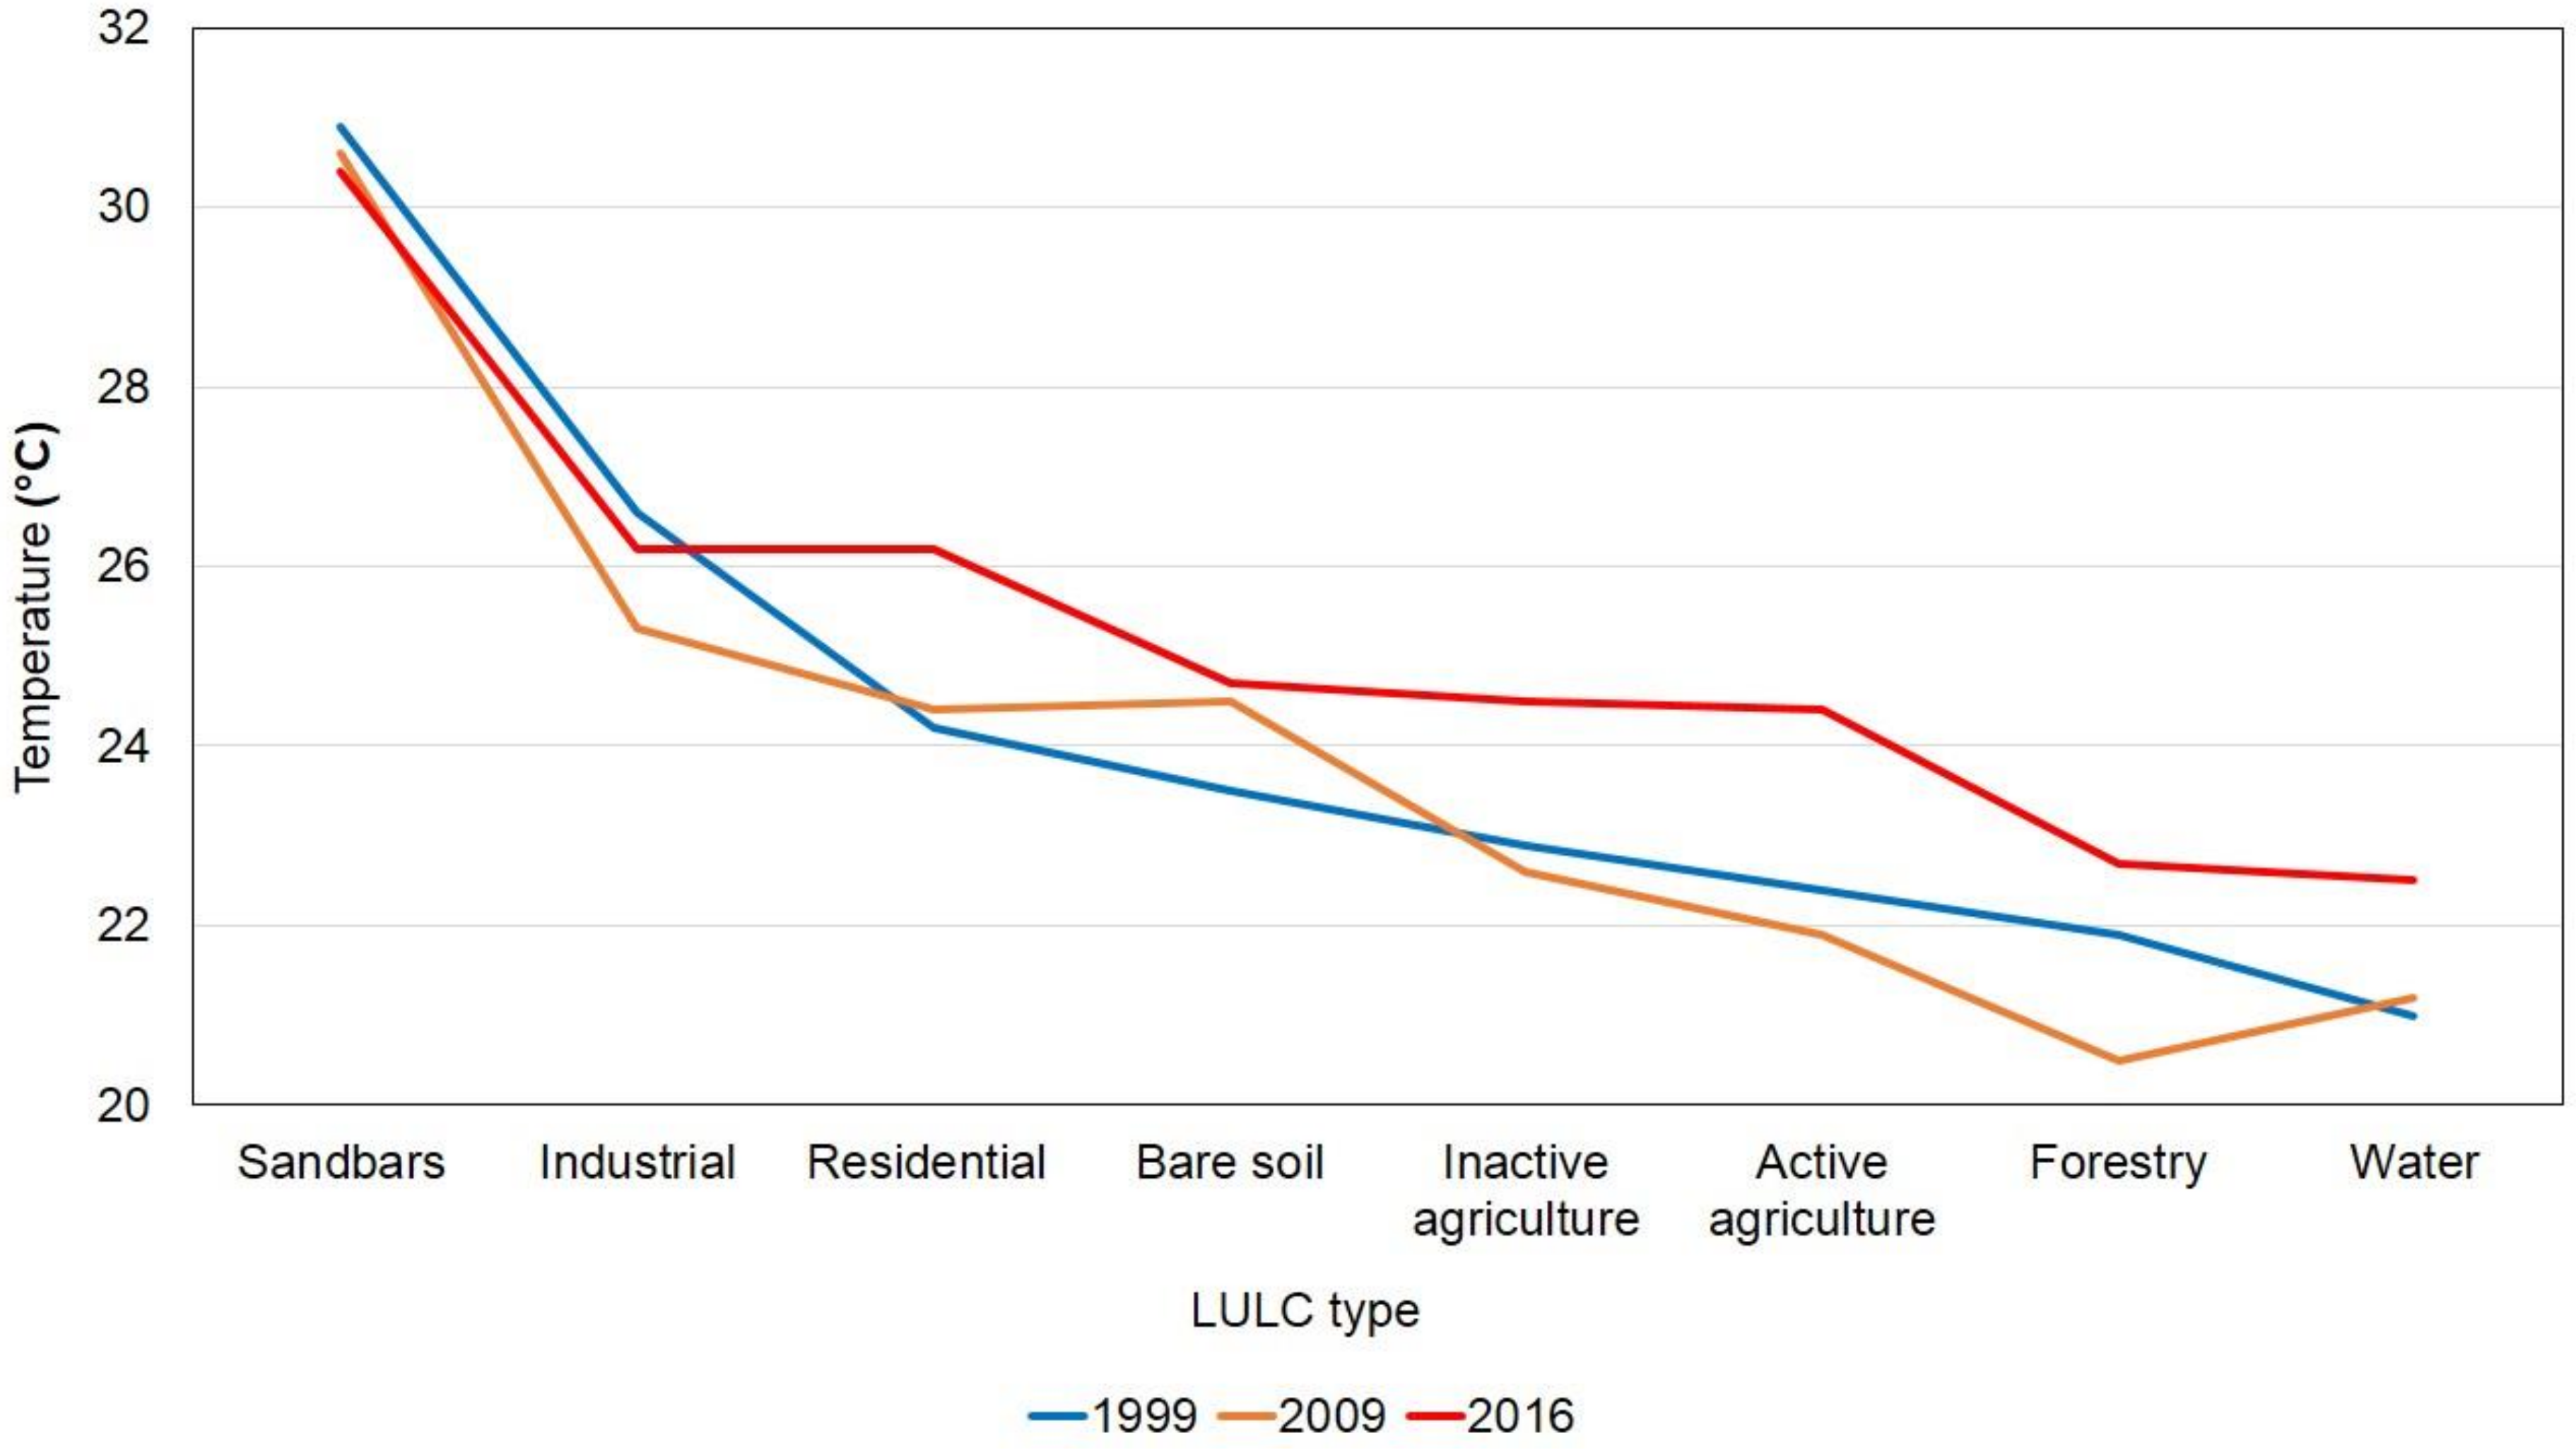
4.6. Association of LST with LULC
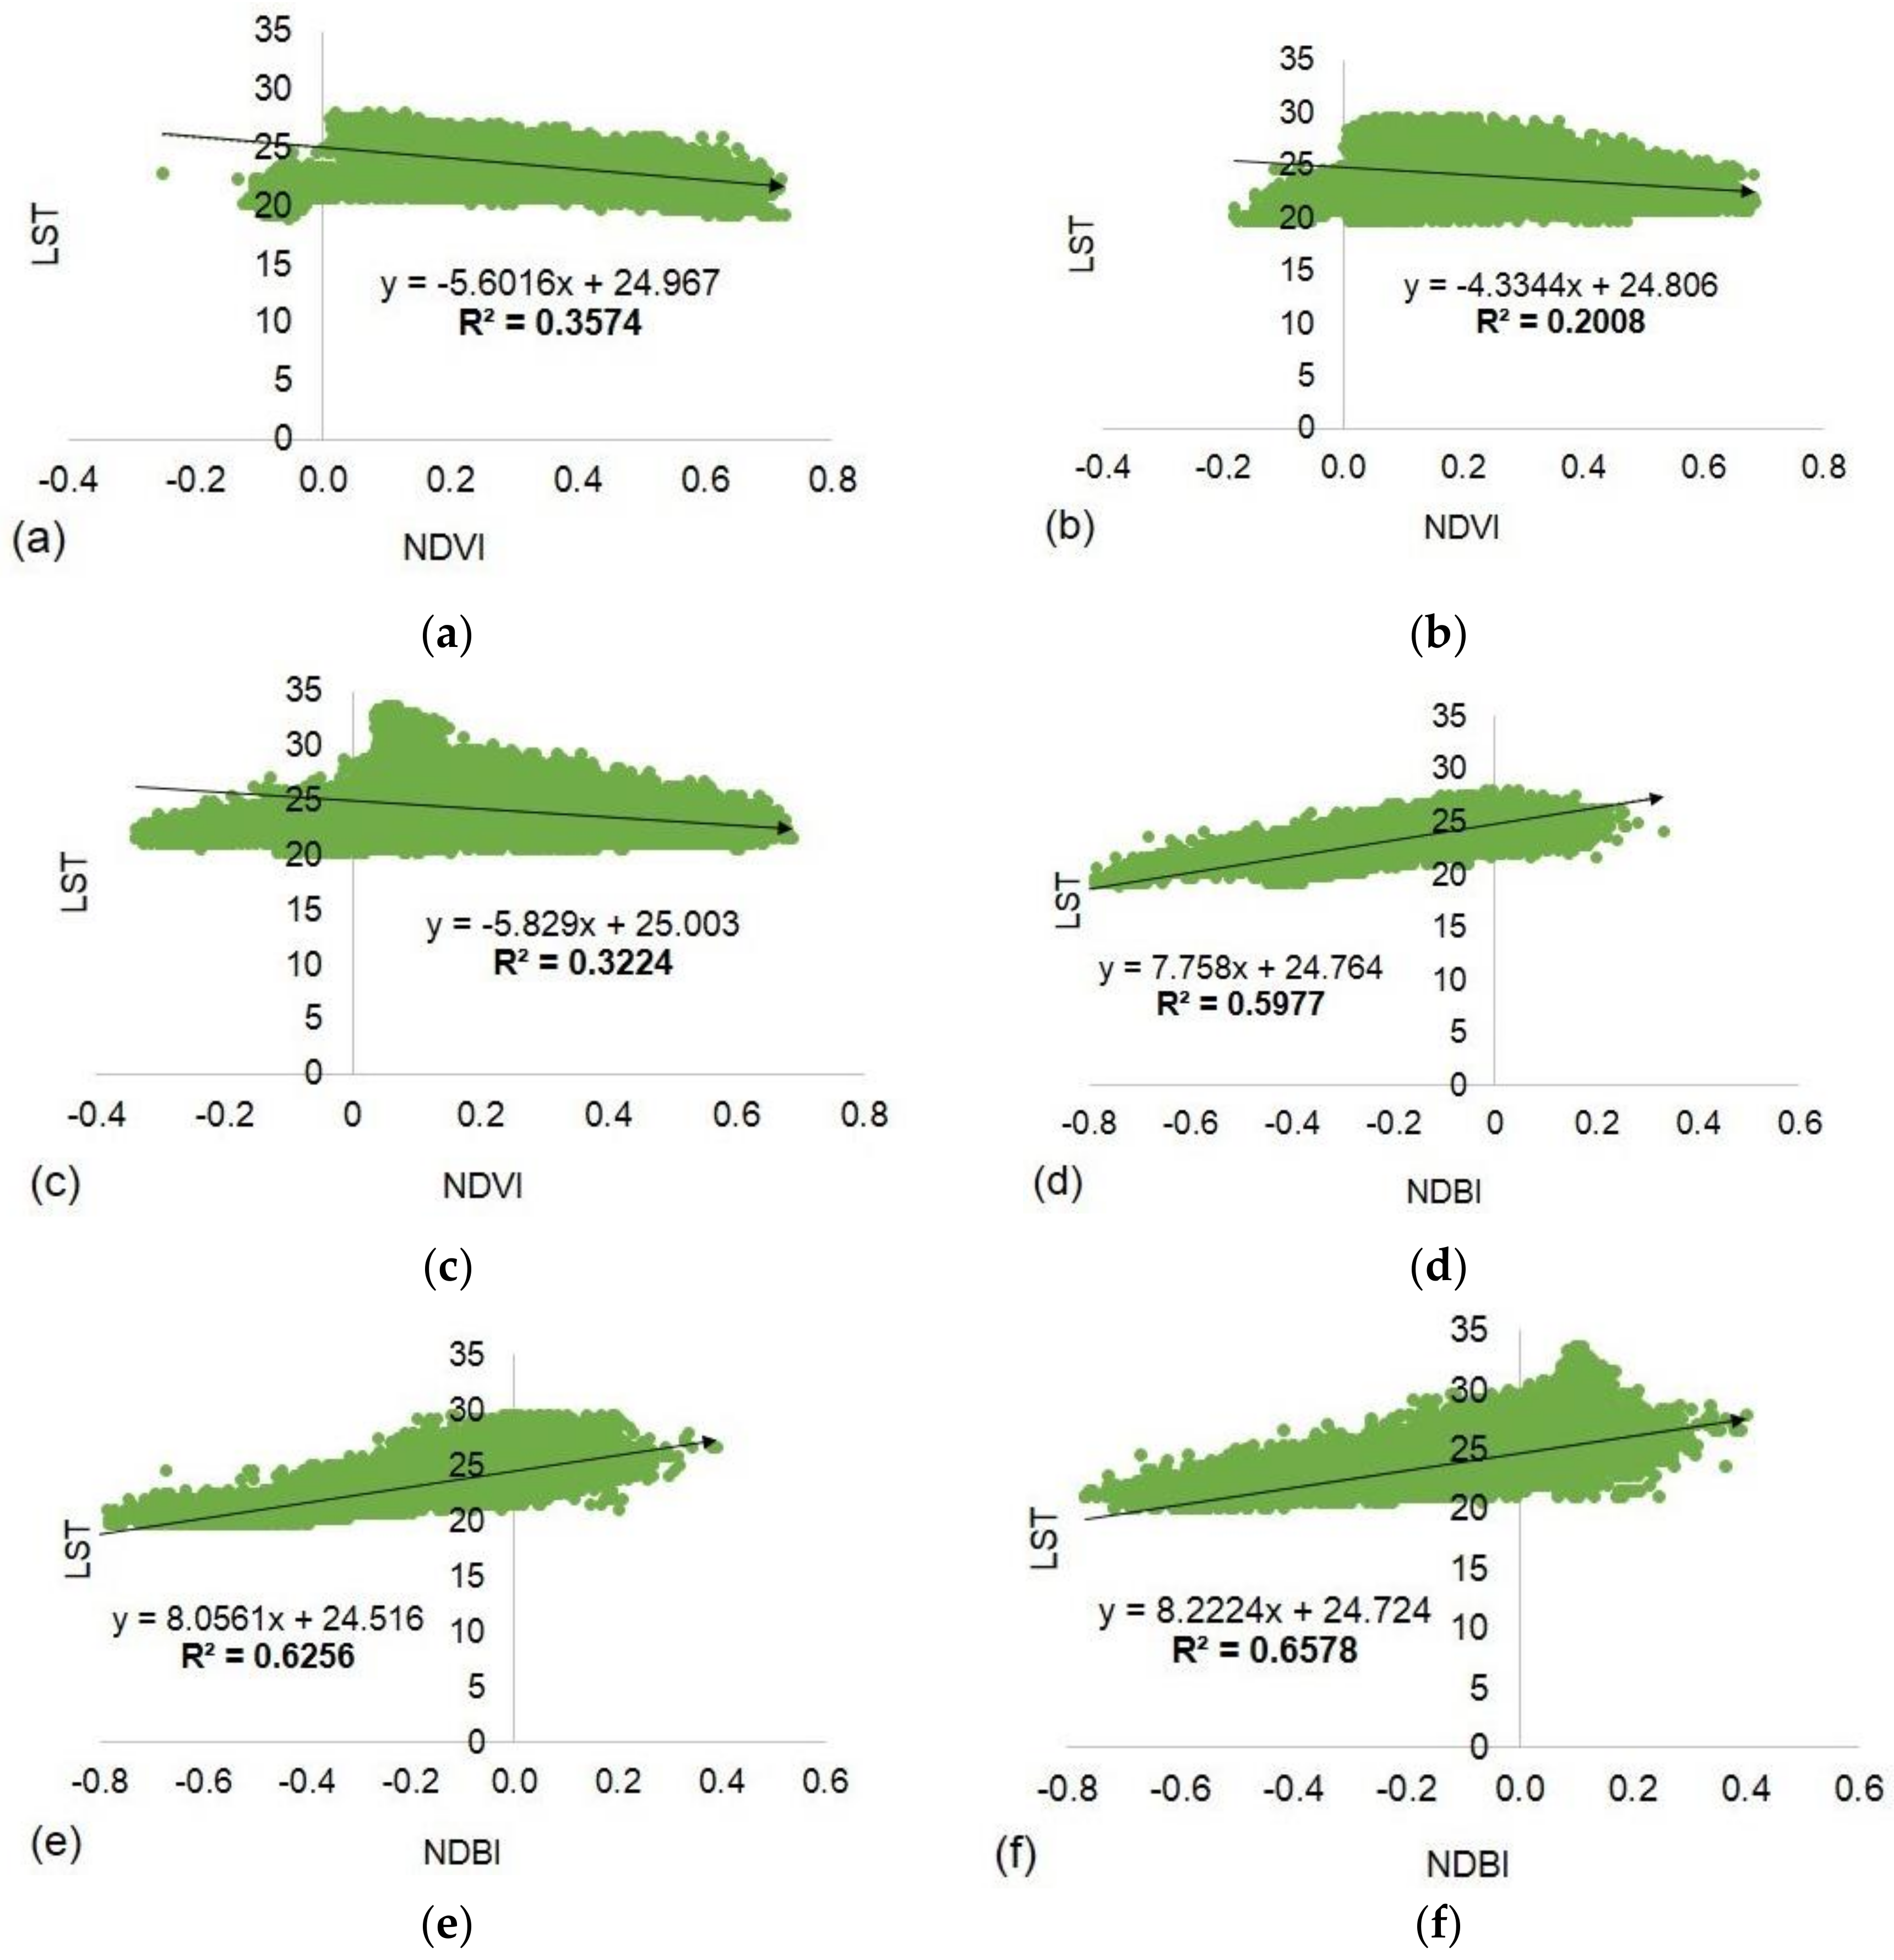
4.7. Correlations between LST and NDVI/NDBI
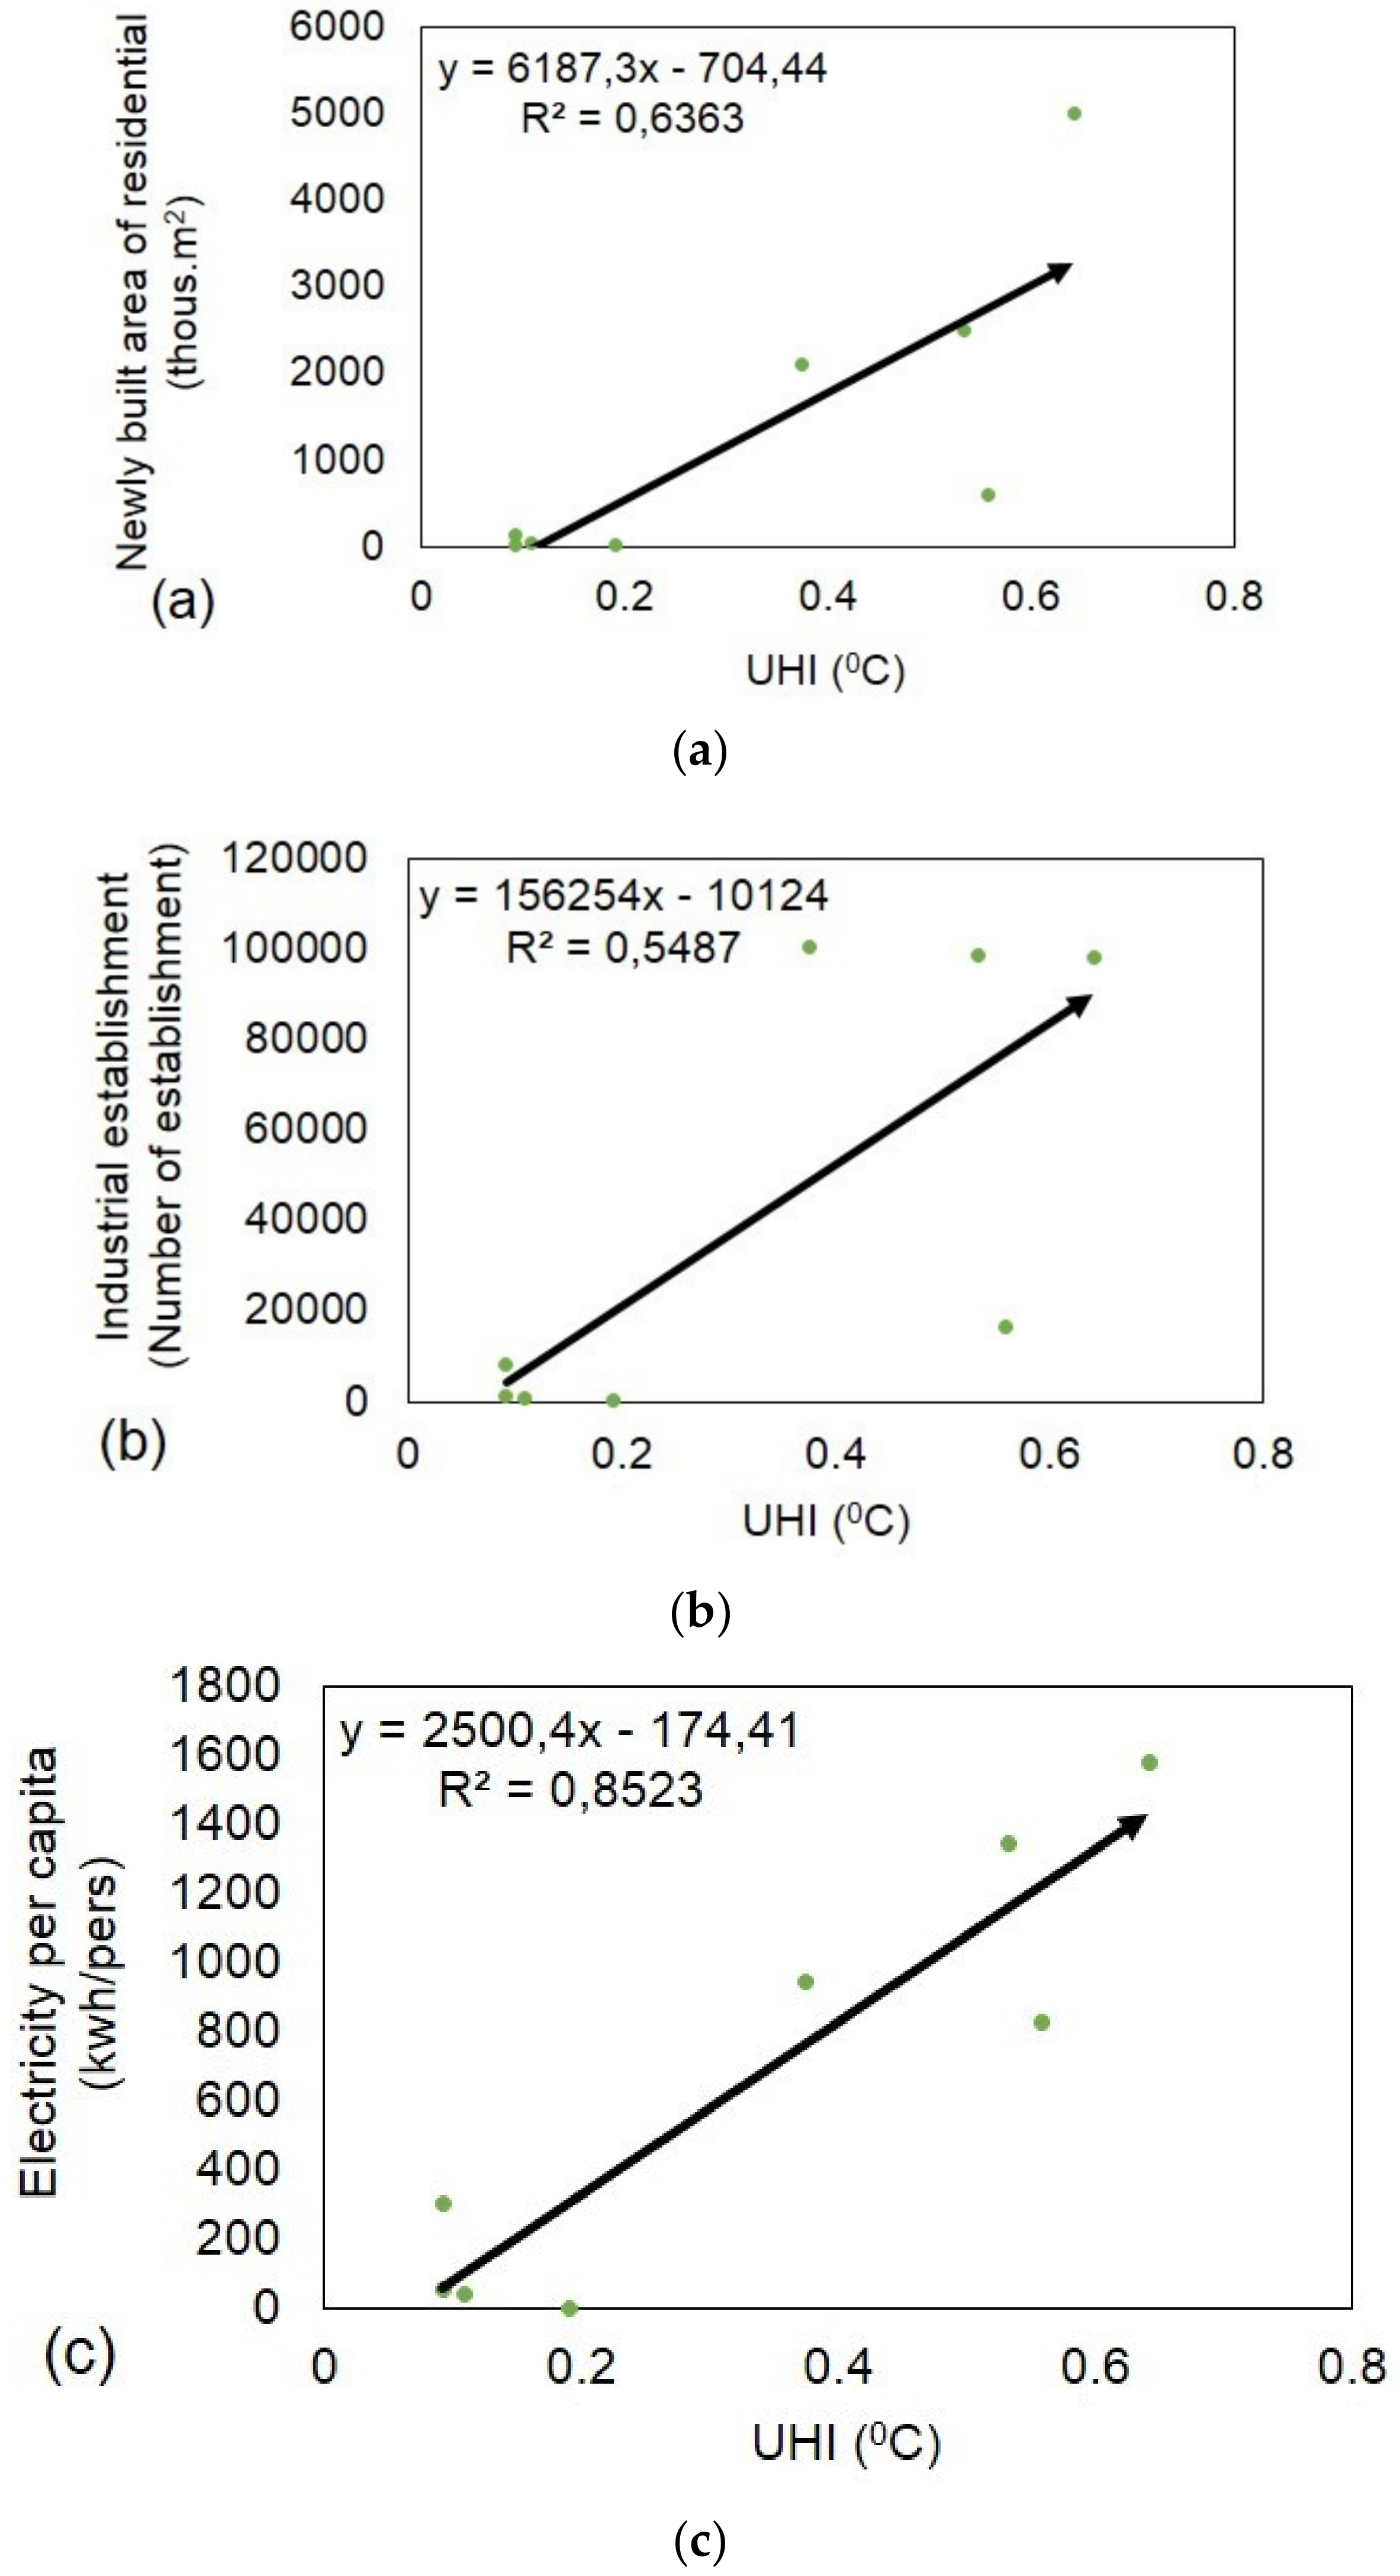
4.8. Relationships between UHI and Urbanization Indicators in Hanoi
4.9. Atmospheric UHI
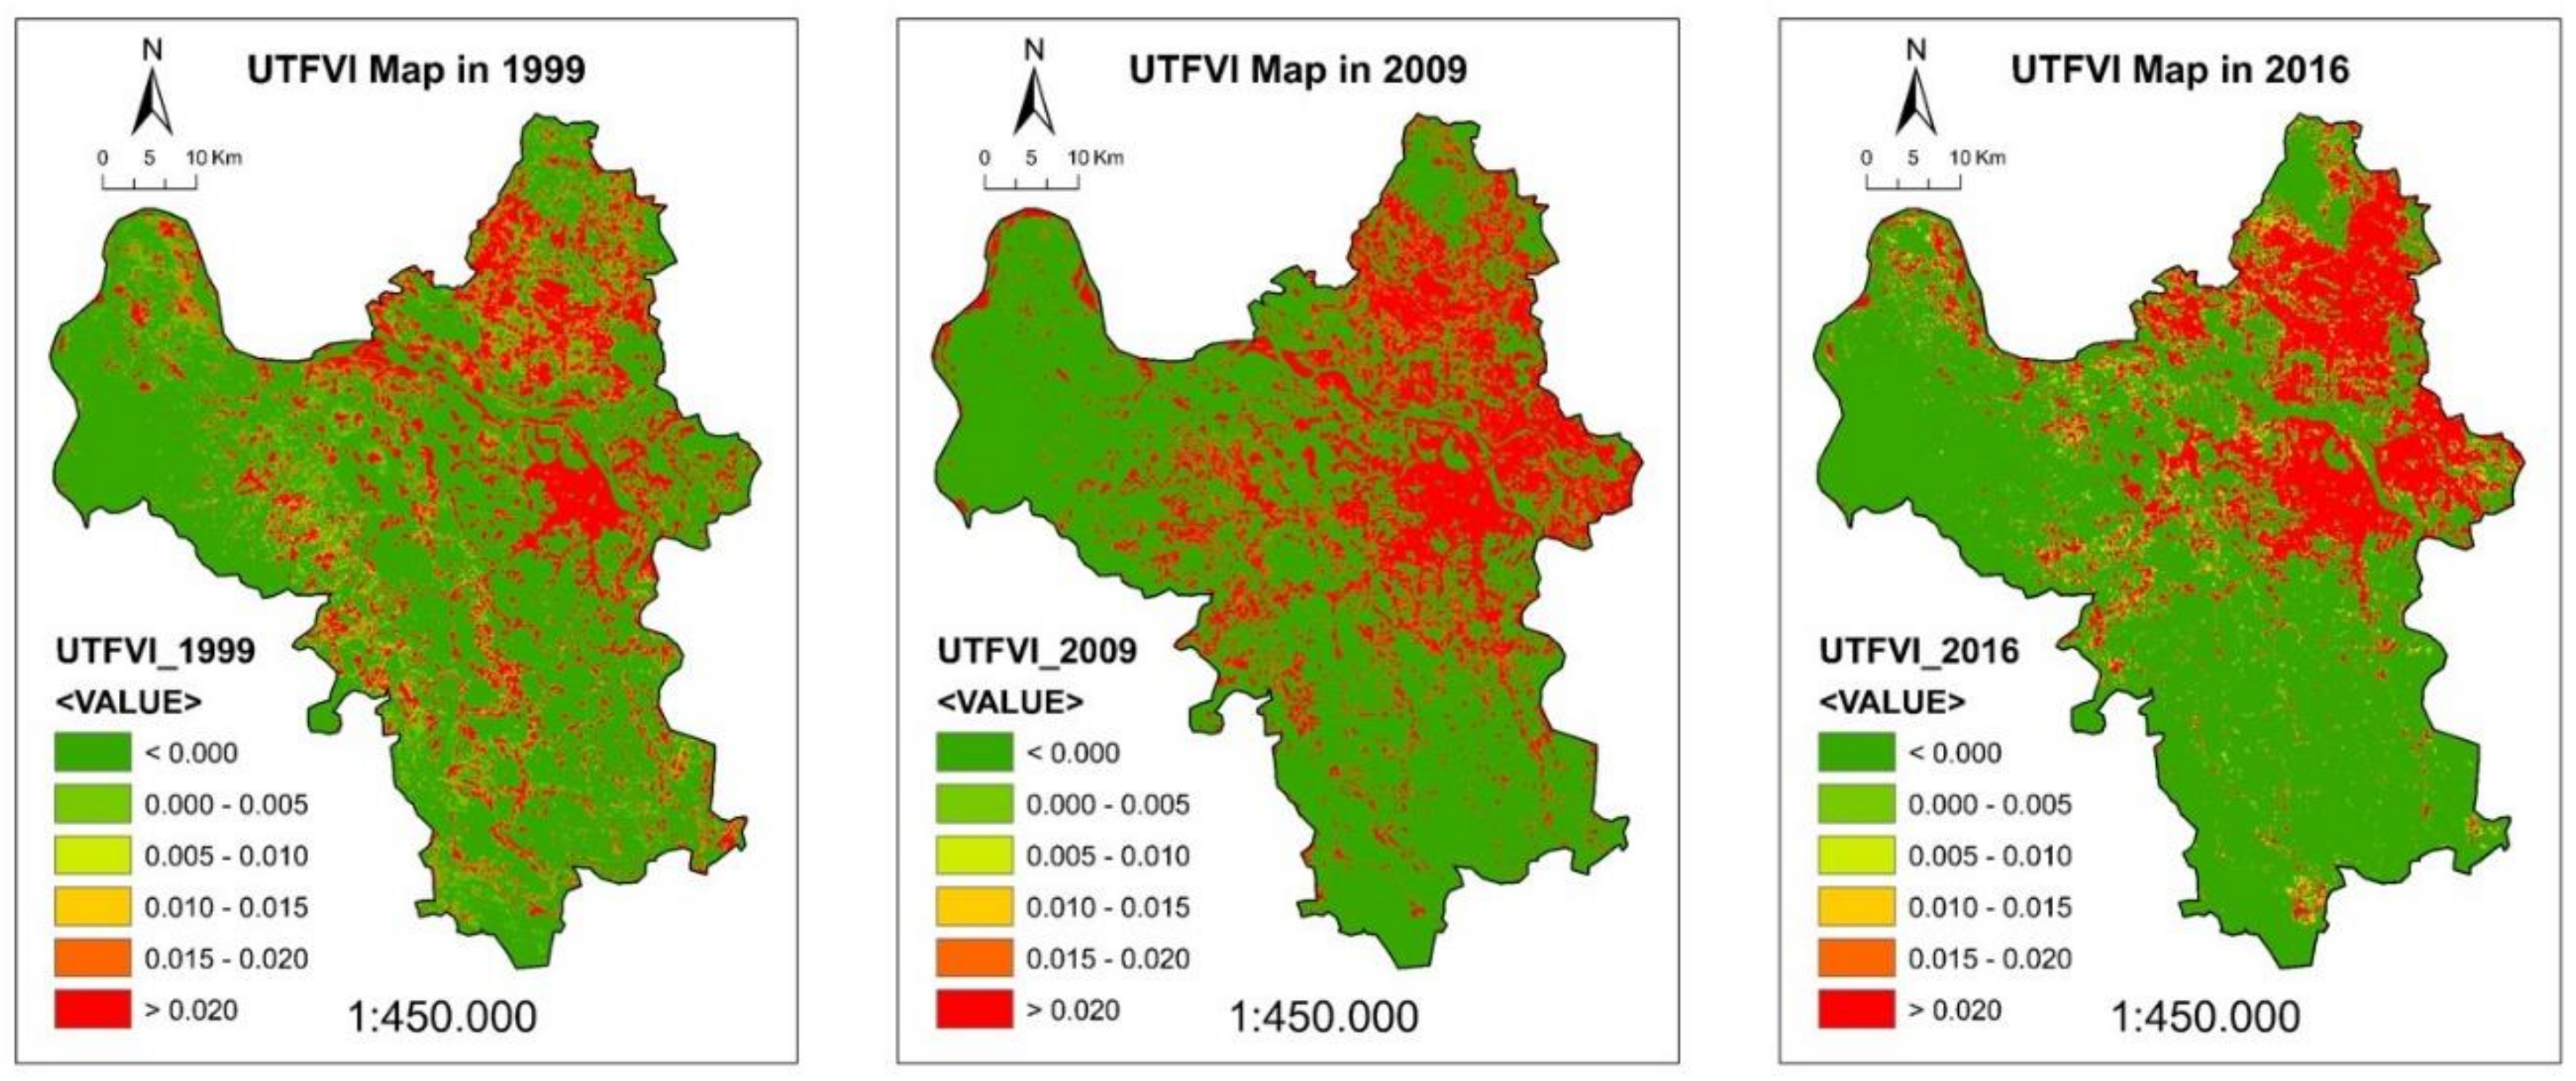
4.10. UTFVI Map in Hanoi
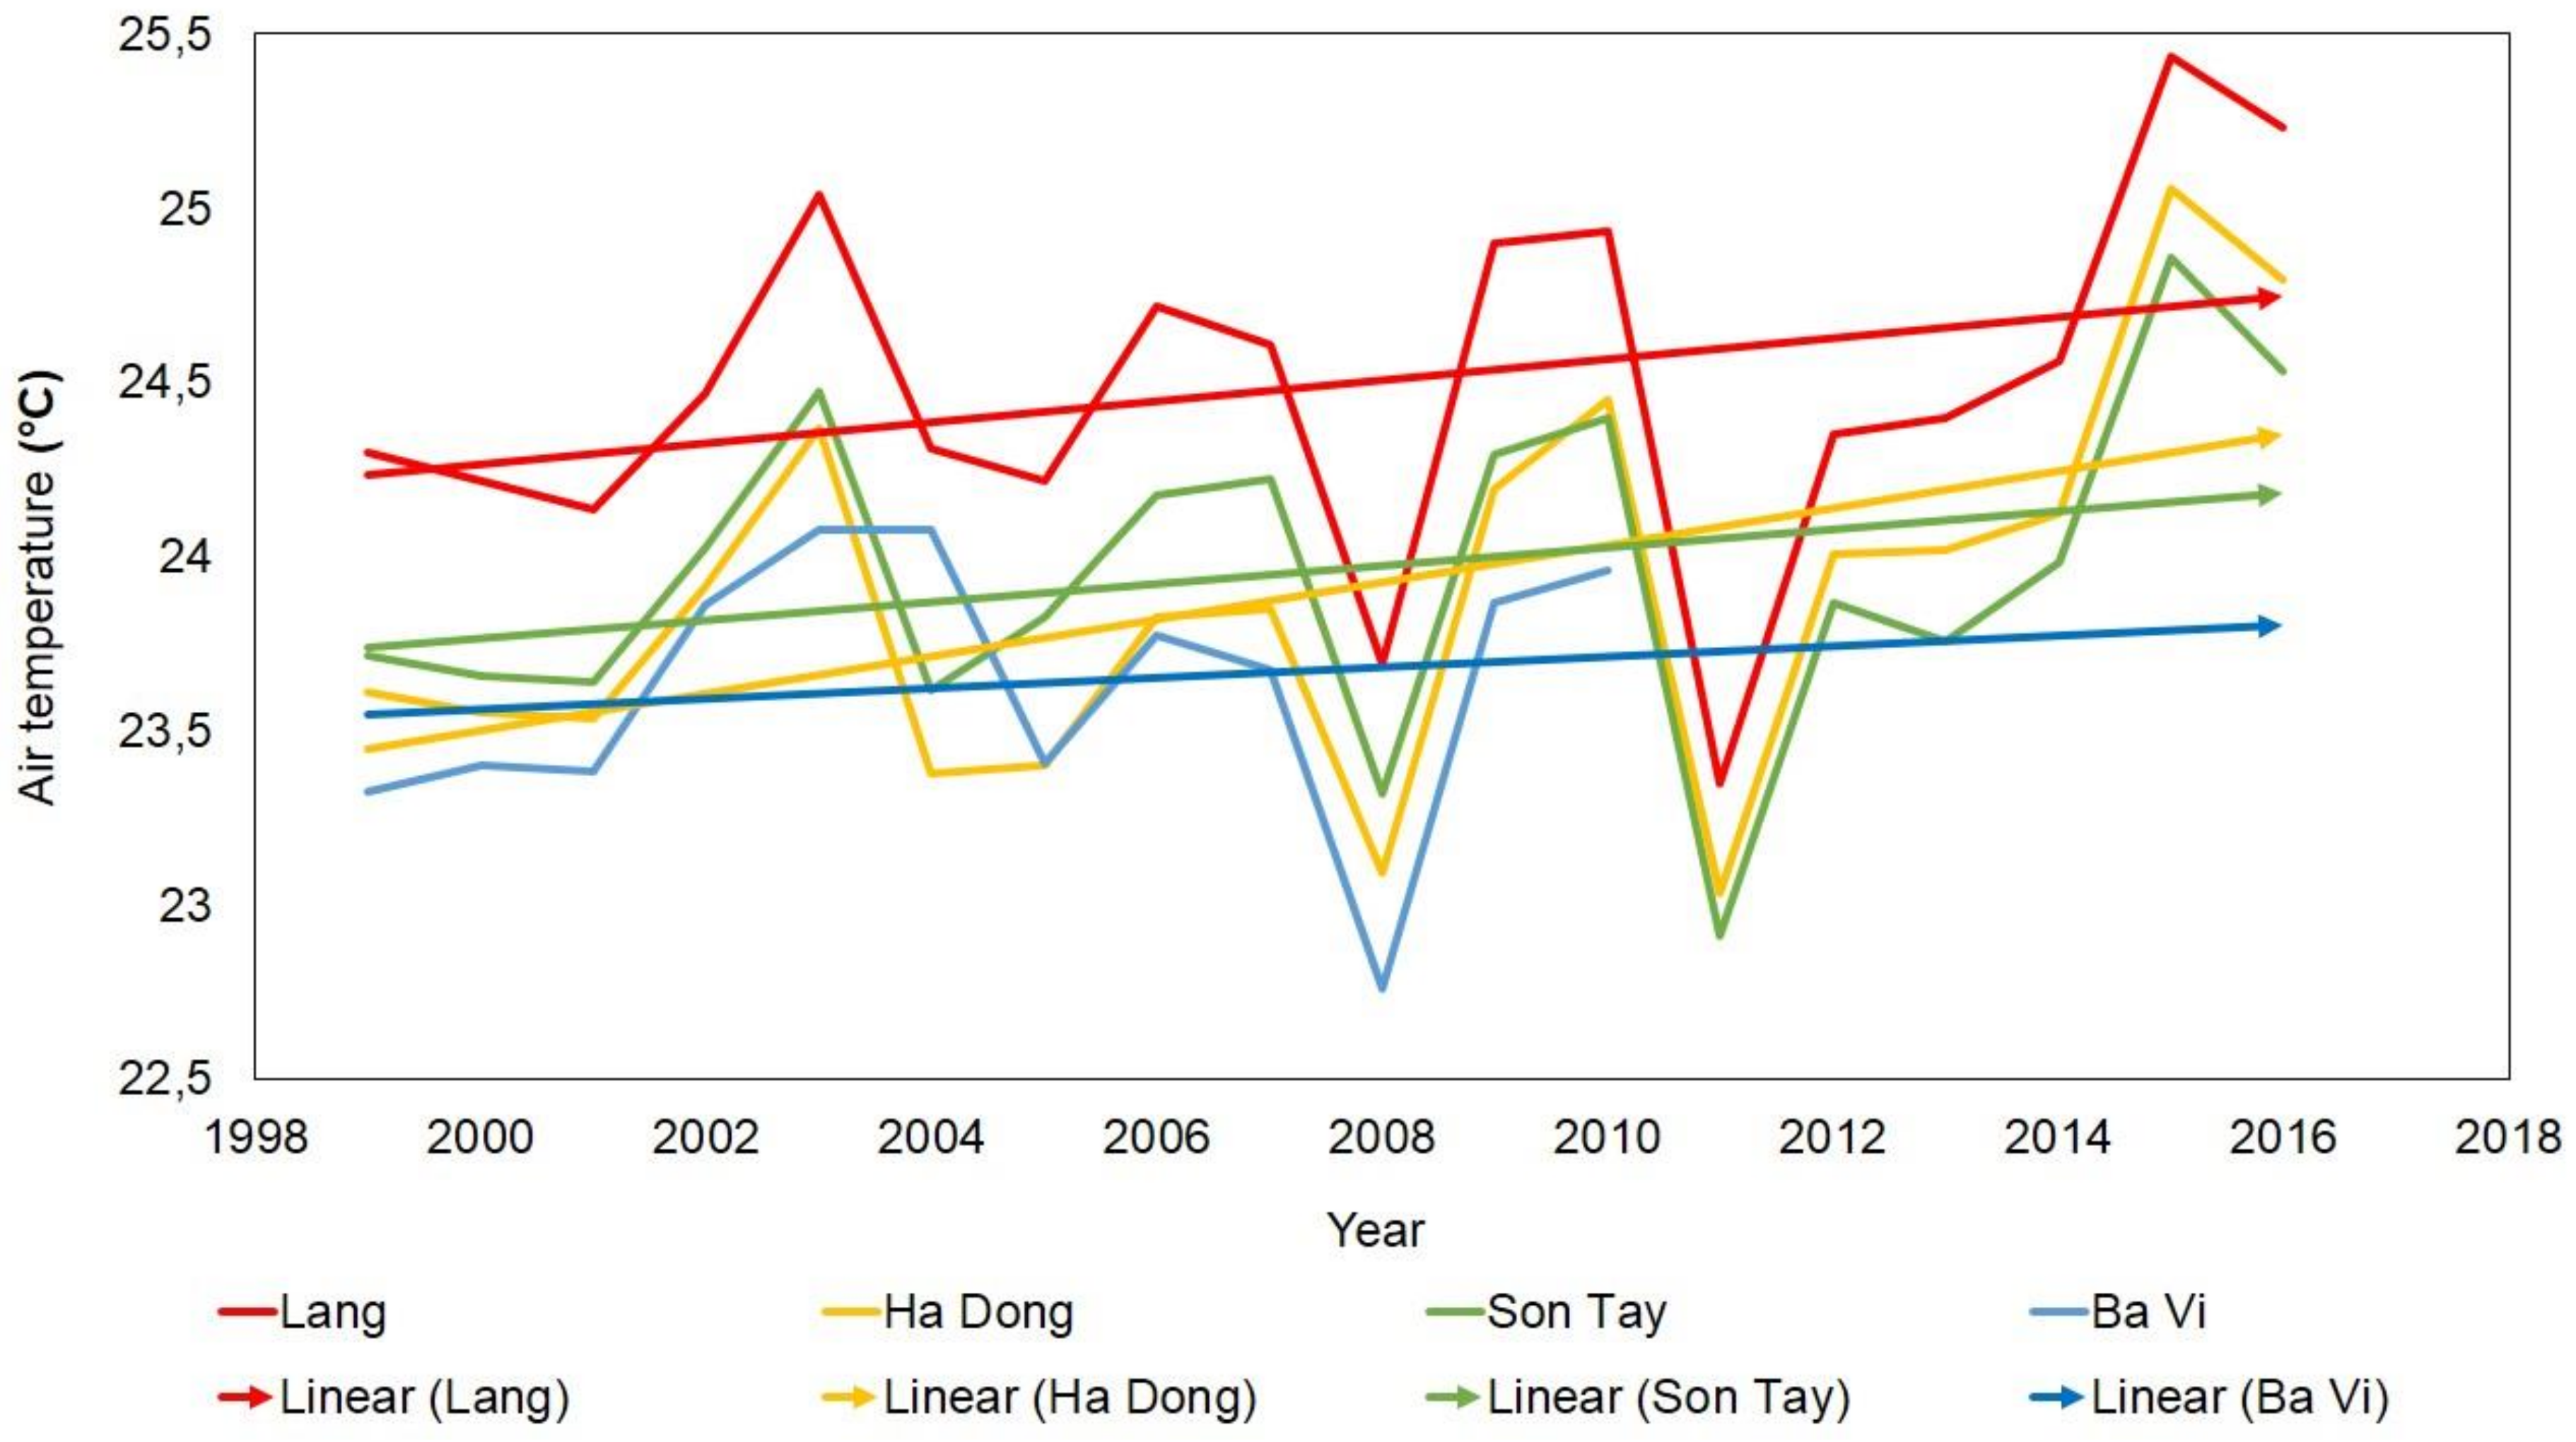
4.11. Variation of Regional Weather in Hanoi (1961–2016)
5. Conclusions
Author Contributions
Funding
Acknowledgments
Conflicts of Interest
References
- Chadchan, J.; Shankar, R. Emerging urban development issues in the context of globalisation. J. ITPI 2009, 6, 78–85. [Google Scholar]
- Cui, L.; Shi, J. Urbanization and its environmental effects in Shanghai, China. Urban Clim. 2012, 2, 1–15. [Google Scholar] [CrossRef]
- Kim, Y.-H.; Baik, J.-J. Spatial and temporal structure of the urban heat island in Seoul. J. Appl. Meteorol. 2005, 44, 591–605. [Google Scholar] [CrossRef]
- Asgarian, A.; Amiri, B.J.; Sakieh, Y. Assessing the effect of green cover spatial patterns on urban land surface temperature using landscape metrics approach. Urban Ecosyst. 2015, 18, 209–222. [Google Scholar] [CrossRef]
- Ranagalage, M.; Estoque, R.C.; Murayama, Y. An urban heat island study of the Colombo metropolitan area, Sri Lanka, based on Landsat data (1997–2017). Isprs Int. J. Geo-Inf. 2017, 6, 189. [Google Scholar] [CrossRef]
- Li, X.X.; Koh, T.Y.; Panda, J.; Norford, L.K. Impact of urbanization patterns on the local climate of a tropical city, Singapore: An ensemble study. J. Geophys. Res. Atmos. 2016, 121, 4386–4403. [Google Scholar] [CrossRef]
- Alfraihat, R.; Mulugeta, G.; Gala, T. Ecological evaluation of urban heat island in Chicago City, USA. J. Atmos. Pollut. 2016, 4, 23–29. [Google Scholar]
- Labbé, D.; Collin, J.-P.; Boudreau, J.-A. Facing the Urban Transition in Hanoi: Recent Urban Planning Issues and Initiatives. INRS Centre-Urbanisation Culture Société: Montréal, QC, Canada, 2010. [Google Scholar]
- Nong, D.H.; Lepczyk, C.A.; Miura, T.; Fox, J.M. Quantifying urban growth patterns in Hanoi using landscape expansion modes and time series spatial metrics. Plos One 2018, 13, e0196940. [Google Scholar] [CrossRef] [PubMed]
- Trihamdani, A.R.; Kubota, T.; Lee, H.S.; Sumida, K.; Phuong, T.T.T. Impacts of land use changes on urban heat islands in Hanoi, Vietnam: Scenario analysis. Procedia Eng. 2017, 198, 525–529. [Google Scholar] [CrossRef]
- Vietnam General Statistics Office. Figures of socio-economic achievements of the capital during 60 years of building and development, 2014. Available online: http://thongkehanoi.gov.vn/ (accessed on 4 March 2018).
- Chen, W.; Zhang, Y.; Pengwang, C.; Gao, W. Evaluation of urbanization dynamics and its impacts on surface heat islands: A case study of Beijing, China. Remote Sens. 2017, 9, 453. [Google Scholar] [CrossRef]
- Guha, S.; Govil, H.; Dey, A.; Gill, N. Analytical study of land surface temperature with NDVI and NDBI using Landsat 8 OLI and TIRS data in Florence and Naples city, Italy. Eur. J. Remote Sens. 2018, 51, 667–678. [Google Scholar] [CrossRef]
- Zhou, W.; Qian, Y.; Li, X.; Li, W.; Han, L. Relationships between land cover and the surface urban heat island: seasonal variability and effects of spatial and thematic resolution of land cover data on predicting land surface temperatures. Landsc. Ecol. 2014, 29, 153–167. [Google Scholar] [CrossRef]
- Kumar, D.; Shekhar, S. Statistical analysis of land surface temperature–vegetation indexes relationship through thermal remote sensing. Ecotoxicol. Environ. Saf. 2015, 121, 39–44. [Google Scholar] [CrossRef] [PubMed]
- Moser-Reischl, A.; Uhl, E.; Rötzer, T.; Biber, P.; van Con, T.; Tan, N.T.; Pretzsch, H. Effects of the urban heat island and climate change on the growth of Khaya senegalensis in Hanoi, Vietnam. For. Ecosyst. 2018, 5, 37. [Google Scholar] [CrossRef]
- Kakon, A.N.; Nobuo, M.; Kojima, S.; Yoko, T. Assessment of thermal comfort in respect to building height in a high-density city in the tropics. Am. J. Eng. Appl. Sci. 2010, 3, 545–551. [Google Scholar] [CrossRef]
- Matzarakis, A.; Mayer, H.; Iziomon, M.G. Applications of a universal thermal index: physiological equivalent temperature. Int. J. Biometeorol. 1999, 43, 76–84. [Google Scholar] [CrossRef]
- Willett, K.M.; Sherwood, S. Exceedance of heat index thresholds for 15 regions under a warming climate using the wet-bulb globe temperature. Int. J. Climatol. 2012, 32, 161–177. [Google Scholar] [CrossRef]
- Zhang, Y.; Yu, T.; Gu, X.; Zhang, Y.; Chen, L. Land surface temperature retrieval from CBERS-02 IRMSS thermal infrared data and its applications in quantitative analysis of urban heat island effect. J. Remote Sens. Beijing 2006, 10, 789. [Google Scholar]
- Iwata, S. The Comprehensive Urban Development Programme in Hanoi Capital City of the Socialist Republic of Vietnam (HAIDEP); Final report; JICA: Hanoi, Vietnam, 2007. [Google Scholar]
- ESRI. ArcGIS desktop: release 10. Environmental Systems Research Institute: Redlands, CA, USA, 2011. [Google Scholar]
- Phiri, D.; Morgenroth, J. Developments in Landsat land cover classification methods: A review. Remote Sens. 2017, 9, 967. [Google Scholar] [CrossRef]
- Lu, D.; Weng, Q. A survey of image classification methods and techniques for improving classification performance. Int. J. Remote Sens. 2007, 28, 823–870. [Google Scholar] [CrossRef]
- Patil, M.B.; Desai, C.G.; Umrikar, B.N. Image classification tool for land use/land cover analysis: A comparative study of maximum likelihood and minimum distance method. Int. J. Geol. Earth Env. Sci. 2012, 2, 189–196. [Google Scholar]
- Congalton, R.G. A review of assessing the accuracy of classifications of remotely sensed data. Remote Sens. Environ. 1991, 37, 35–46. [Google Scholar] [CrossRef]
- Congalton, R.G.; Green, K. Assessing the Accuracy of Remotely Sensed Data: Principles and Practices; CRC press: Boca Raton, FL, USA, 2008. [Google Scholar]
- Jiang, Z.; Huete, A.R.; Chen, J.; Chen, Y.; Li, J.; Yan, G.; Zhang, X. Analysis of NDVI and scaled difference vegetation index retrievals of vegetation fraction. Remote Sens. Environ. 2006, 101, 366–378. [Google Scholar] [CrossRef]
- Vani, V.; Mandla, V. Comparative Study of NDVI and SAVI vegetation Indices in Anantapur district semi-arid areas. Int. J. Civ. Eng. Technol. 2017, 8, 287–300. [Google Scholar]
- Zhang, Y.; Odeh, I.O.; Han, C. Bi-temporal characterization of land surface temperature in relation to impervious surface area, NDVI and NDBI, using a sub-pixel image analysis. Int. J. Appl. Earth Obs. Geoinf. 2009, 11, 256–264. [Google Scholar] [CrossRef]
- He, C.; Shi, P.; Xie, D.; Zhao, Y. Improving the normalized difference built-up index to map urban built-up areas using a semiautomatic segmentation approach. Remote Sens. Lett. 2010, 1, 213–221. [Google Scholar] [CrossRef]
- Zha, Y.; Gao, J.; Ni, S. Use of normalized difference built-up index in automatically mapping urban areas from TM imagery. Int. J. Remote Sens. 2003, 24, 583–594. [Google Scholar] [CrossRef]
- Quintano, C.; Fernández-Manso, A.; Calvo, L.; Marcos, E.; Valbuena, L. Land surface temperature as potential indicator of burn severity in forest Mediterranean ecosystems. Int. J. Appl. Earth Obs. Geoinf. 2015, 36, 1–12. [Google Scholar] [CrossRef]
- Sobrino, J.A.; Jimenez-Munoz, J.C.; Paolini, L. Land surface temperature retrieval from LANDSAT TM 5. Remote Sens. Environ. 2004, 90, 434–440. [Google Scholar] [CrossRef]
- Tan, K.C.; San Lim, H.; MatJafri, M.Z.; Abdullah, K. Landsat data to evaluate urban expansion and determine land use/land cover changes in Penang Island, Malaysia. Environ. Earth Sci. 2010, 60, 1509–1521. [Google Scholar] [CrossRef]
- Guha, S.; Govil, H.; Mukherjee, S. Dynamic analysis and ecological evaluation of urban heat islands in Raipur city, India. J. Appl. Remote Sens. 2017, 11, 036020. [Google Scholar] [CrossRef]
- El-Hattab, M.; Amany, S.; Lamia, G. Monitoring and assessment of urban heat islands over the Southern region of Cairo Governorate, Egypt. Egypt. J. Remote Sens. Space Sci. 2017. [Google Scholar] [CrossRef]
- Liu, L.; Zhang, Y. Urban heat island analysis using the Landsat TM data and ASTER data: A case study in Hong Kong. Remote Sens. 2011, 3, 1535–1552. [Google Scholar] [CrossRef]
- Bencardino, M.; Nesticò, A. Demographic changes and real estate values. A quantitative model for analyzing the urban-rural linkages. Sustainability 2017, 9, 536. [Google Scholar] [CrossRef]
- Bencardino, M.; Nesticò, A. Urban sprawl, labor incomes and real estate values. Part II, LNCS. Proc. Int. Conf. Comput. Sci. Its Appl. 2017, 10405, 17–30. [Google Scholar]


| Sensor | Scene ID | Acquisition date | Season |
|---|---|---|---|
| Landsat 5 TM | LT51270451999266BKT00 | 23/09/1999 | Autumn |
| LT51270461999266BKT00 | |||
| Landsat 5 TM | LT51270452009309BJC00 | 05/11/2009 | Autumn |
| LT51270462009309BJC00 | |||
| Landsat 8 OLI/TIRS | LC81270452016281LGN01 | 07/10/2016 | Autumn |
| LC81270462016281LGN01 |
| Classes | Include | |
|---|---|---|
| 1 | Residential | Rural residential land and urban residential land |
| 2 | Industrial, Commercial | Land for industrial parks, industrial clusters, export processing zones; land for trading and service |
| 3 | Active agriculture | Land for cultivation of perennial trees, land for cultivation of annual crops, paddy land |
| 4 | Inactive agriculture (Wetland and Dry land) | Wetland—Paddy land: pump water in the field to prepare for farming works Dry land—Land for cultivation of perennial trees, land for cultivation of annual crops |
| 5 | Water | Land with rivers, streams, canals, springs (located in rivers, natural lakes) |
| 6 | Forestry | Land for special-use forests Land for protection forests Land for production forests |
| 7 | Sandbars | Riparian land |
| 8 | Bare soil | Unused land and Unused Mountain Land |
| UTFVI | Urban Heat Island (UHI) Phenomenon | Ecological Evaluation Index |
|---|---|---|
| <0.000 | None | Excellent |
| 0.000–0.005 | Weak | Good |
| 0.005–0.010 | Middle | Normal |
| 0.010–0.015 | Strong | Bad |
| 0.015–0.020 | Stronger | Worse |
| >0.020 | Strongest | Worst |
| Types of LULC | User’s (%) | Producer’s (%) |
|---|---|---|
| Residential | 94 | 96 |
| Industrial | 93 | 92 |
| Active agriculture land | 90 | 94 |
| Inactive agriculture land | 81 | 78 |
| Water | 88 | 90 |
| Forestry | 94 | 94 |
| Sand-bar | 96 | 98 |
| Bare soil | 88 | 84 |
| Overall Accuracy (%) | 90.75 | |
| Kappa Index | 0.88 | |
| Land surface temperature validation (°C) | |||||||||
|---|---|---|---|---|---|---|---|---|---|
| Station | 23/09/1999 | 05/11/2009 | 07/10/2016 | ||||||
| Retrieved LST | Air temperature AT | Difference LST-AT | Retrieved LST | Air temperature AT | Difference LST-AT | Retrieved LST | Air temperature AT | Difference LST-AT | |
| Lang | 27.92 | 26.4 | 1.52 | 25.88 | 23.1 | 2.78 | 28.49 | 26.7 | 1.79 |
| Ha Dong | 26.87 | 25.7 | 1.17 | 25.34 | 22 | 3.34 | 27.23 | 26 | 1.23 |
| Son Tay | 25.9 | 25.6 | 0.3 | 22.76 | 21.5 | 1.26 | 25.84 | 25.3 | 0.54 |
| Ba Vi | 24.88 | 23.8 | 1.08 | 22.75 | 21 | 1.75 | 25.17 | 24.1 | 1.07 |
| Class | 1999 (%) | 2009 (%) | 2016 (%) |
|---|---|---|---|
| UHI | 10.98 | 25.36 | 31.83 |
| Non-UHI | 89.02 | 74.64 | 68.17 |
© 2019 by the authors. Licensee MDPI, Basel, Switzerland. This article is an open access article distributed under the terms and conditions of the Creative Commons Attribution (CC BY) license (http://creativecommons.org/licenses/by/4.0/).
Share and Cite
Nguyen, T.M.; Lin, T.-H.; Chan, H.-P. The Environmental Effects of Urban Development in Hanoi, Vietnam from Satellite and Meteorological Observations from 1999–2016. Sustainability 2019, 11, 1768. https://doi.org/10.3390/su11061768
Nguyen TM, Lin T-H, Chan H-P. The Environmental Effects of Urban Development in Hanoi, Vietnam from Satellite and Meteorological Observations from 1999–2016. Sustainability. 2019; 11(6):1768. https://doi.org/10.3390/su11061768
Chicago/Turabian StyleNguyen, Thi Mai, Tang-Huang Lin, and Hai-Po Chan. 2019. "The Environmental Effects of Urban Development in Hanoi, Vietnam from Satellite and Meteorological Observations from 1999–2016" Sustainability 11, no. 6: 1768. https://doi.org/10.3390/su11061768
APA StyleNguyen, T. M., Lin, T.-H., & Chan, H.-P. (2019). The Environmental Effects of Urban Development in Hanoi, Vietnam from Satellite and Meteorological Observations from 1999–2016. Sustainability, 11(6), 1768. https://doi.org/10.3390/su11061768