1. Introduction
Demand for sustainable aquaculture is growing [
1,
2,
3]; in particular, an aquaculture system that maintains economic, environmental, and social sustainability [
4]. With increasing awareness of its value for the environment, sustainable aquaculture is gaining greater interest among fish farmers, as well as consumers. In 2010, the World Wide Fund for Nature (WWF) initiated the Aquaculture Stewardship Council (ASC) to promote sustainable aquaculture [
5]. The council has developed ASC farm standards for certifying sustainable and responsible aquaculture. ASC’s consumer label intends to support sustainable aquaculture through a market mechanism that would enable consumers to identify responsibly farmed seafood, thereby generating a price premium for ASC-labeled products. The price premium can then be assessed by consumer willingness-to-pay (WTP) for sustainable aquaculture products.
Consumer WTP for sustainable aquaculture is likely to cause a chain reaction; for example, higher consumer value for sustainable aquaculture products increases demand from retailers and intermediaries, which subsequently incentivizes fish farmers to move toward sustainable aquaculture. Moving toward sustainable aquaculture is especially critical to cage farming enterprises that often produce unfavorable environmental conditions. In marine cage aquaculture for finfish species, a typical environmental issue involves managing the fouling in cage nets. Fouling is inevitable in fish culture, and mechanical and chemical measures are employed to handle it [
6]. The main components of an antifouling agent are copper and zinc powders, which remove organisms that have adhered to cage nets [
6]. However, the properties of antifouling agents can adversely affect the marine environment. The concentration of metallic elements in sediment near fish farming sites, for instance, has attracted public concern over environmental sustainability. One way to alleviate this concern and eliminate the metallic elements is by using copper-alloy aquaculture nets [
7]. These nets do not require antifouling paint treatment, and the used net can be recycled into new nets. However, it is difficult for a producer to use copper-alloy nets in aquaculture due to the higher cost. The cost difference between using copper alloy and nylon nets could be interpreted as the cost in maintaining environmental sustainability in aquaculture. While public funding might be an option, the price premium from an eco-friendly consumer label could resolve cost issues. Given that conventional aquaculture is the dominant system, sustainable aquaculture using copper-alloy nets could lose its place in the industry without establishing consumer support.
The Korean government recently launched a research and development program for the adoption of copper-alloy nets in red seabream (
Pagrus major) aquaculture. Red seabream is a popular sushi ingredient in South Korea, where its annual aquaculture production reaches an average of 5400 tons (
Table 1). The government has installed a testing cage in a red seabream aquaculture farm to determine the feasibility of introducing copper-alloy nets in marine cage culture.
This study examines consumer perception of the environment and consumer WTP for sustainable aquaculture products when using copper-alloy nets. Specifically, the present research investigates consumer attitudes toward a pro-ecological worldview using the New Ecological Paradigm (NEP) scale. The results of the NEP measurements are used to conduct a double-bounded contingent valuation method (CVM) to estimate WTP for red seabream. The study also investigates which factors affect consumer value judgment using this analytical process.
The present findings contribute to promotion of sustainable aquaculture and seafood marketing as the CVM results could provide crucial information about the price premium of sustainable aquaculture products, as well as factors influencing WTP. Making this practical information available will enable marketers and policy developers to understand consumer purchasing behavior and value, thereby priming the transition from conventional to sustainable aquaculture.
2. Literature Review
2.1. New Ecological Paradigm
Support for sustainable aquaculture is growing stronger with the recognition of environmental sustainability. The ASC and the Marine Stewardship Council (MSC) are fishery certification schemes that reflect the value of ecology and environmental sustainability. The introduction of such schemes would be successful as long as consumers actively participate in and support the scheme because research shows that consumer perception eventually leads to support [
8,
9,
10,
11,
12].
Certain psychological items can be used to measure consumer perception. For example, the NEP scale mentioned earlier and first proposed by Dunlap and Van Liere [
13] is one of the most representative measurement tools for environmental awareness [
14,
15]. It initially comprised 12 measurement items; after 20 years of development, Dunlap et al. presented a refined version of this scale [
14]. The revised NEP scale now comprises 15 measurement items including three dimensions: limitations of growth, nature and balance, and human dominance.
Scholars have used the NEP scale as a research tool to measure environmental awareness in various fields, such as education, environment, and marketing [
16]. It has also been used to examine the effects of human environmental awareness on behavior and value judgment. For example, Park et al. integrated the NEP measurement scale and decision-making theory to analyze the influence of environmental awareness on travelers’ pro-environmental behavior [
17].
The theory of planned behavior is a fundamental theory concerning human behavior and the decision-making process, which argues that human attitude, subjective norms, and perceived behavior control determine human behavior [
8,
18,
19,
20]. Fielding [
8] states that environmental awareness is more likely to affect human attitude, which consequently affects human behavior. Kotchen and Reiling examined relationships between environmental attitudes and value for endangered species, as well as motivations for contingent valuation [
21]. The authors integrated the attitude–behavior theory and economic valuation technique, and used the NEP scale as a proxy for attitude concerning the environment. This allowed them to estimate economic values of endangered species, such as falcons and shortnose sturgeons.
2.2. Contingent Valuation Method
The purchasing behavior and price premium of a product could reflect consumer value [
22,
23,
24]. If NEP is a measure of environmental awareness, consumer value for environmental sustainability can be measured by examining the relationship between NEP and consumer WTP.
The CVM enables individuals to evaluate value for a hypothetical situation in which researchers have limited information on the real market. In CVM analysis, researchers develop a survey for a hypothetical market and ask a survey participant to make an economic decision (i.e., to buy or not to buy). Many academic studies have used CVM as an analytical tool. For example, in the environmental research field, it has been traditionally used for measuring non-market value for the environment [
25,
26]. It has seen application even in fields of outdoor recreation and tourism [
27,
28,
29]. In food marketing research, CVM has been used to estimate consumer WTP for organic food and environmentally friendly products [
30,
31,
32].
The theoretical background of CVM is choice modeling, which can be used in revealed preference and stated preference studies [
33]. CVM itself is a stated preference study method, which assumes that an individual makes an economic decision to choose product A over product B to maximize utility. This selection is a function of utility maximization in repeated selection opportunities. The choices made by individuals under experimental conditions are used for estimating values in a hypothetical situation.
In a CVM survey, participants are asked to indicate their WTP for a good or service by answering whether or not they accept the offer given. Another way to determine WTP involves two-stage answers. At each stage, the suggested amount of money is different, similar to auction bidding. The survey participants must answer “Yes” or “No” to the stated prices that have been increased or decreased. This is called a double-bounded dichotomous choice CVM.
3. Methods
3.1. Sample
A major online survey company in South Korea recruited the survey participants for this study. The survey panel is designed to represent typical demographic variables of the Korean population, reflected in gender, age group, income level, and location. The participants were asked to respond to the survey questions based on their WTP for a sustainable aquaculture product, such as farmed red seabream. The research company distributed 2712 survey questionnaires to the panel members; 1000 usable responses were obtained (response rate of 36.8%).
3.2. Survey Instrument
The survey questionnaire comprises three parts: 1) attitude toward the environment; 2) WTP for sustainable aquaculture products; and 3) demographic information.
The current research used the NEP scale to measure the respondents’ attitudes. This scale has evolved over two decades, and among its variants, the author selected the revised NEP scale [
14]. It consists of 15 items to measure survey participants’ perception and attitude (
Table 2).
The survey respondents’ WTP was measured by their responses to a suggested price for sustainable aquaculture products (i.e., farmed red seabream). The survey began with displayed text concerning aquaculture (
Table 3). Next, a randomly selected amount was proposed for determining WTP for a sustainable aquaculture product (i.e., red seabream for sushi). The survey contained two preference questions that required a “Yes/No” response: one for the randomly selected amount of money, and another for the modified amount of money.
3.3. Model
The double-bounded dichotomous-choice CVM analytically estimates WTP for sustainable aquaculture products. The author categorizes consumer responses into four types [
34]. The first response type is “Yes/No,” which the researcher denotes as
and
. Its probability model is shown below:
where Pr(s,n) represents the probability of an event that the survey participants accept the first offer (i.e., s = yes) and decline the next offer (i.e., n = no); t
1 and t
2 represent the suggested amount for the first and second offer respectively; z
i is a vector of explanatory variables and u
i is an error term.
The second response type is also “Yes/No,” denoted as
and
. Its probability model is shown below:
Equation (2) can be described based on Bayes’ theorem, as shown below:
The third response type is “Yes/No,” denoted as
and
. Its probability model is shown below:
Finally, the fourth response type, “Yes/No,” is denoted as
and
. Its probability model is shown below:
Using equations (1)–(5), the author derives the likelihood function for WTP estimation:
where
are indicator variables that represent the values of survey responses (i.e., s = yes, n = no).
3.4. Empirical Analysis
To analyze the collected data, STATA 15 was used [
35]. After performing the exploratory factor analysis (EFA) on consumer perceptions of environmental concerns, the author utilized EFA results (i.e., underlying dimensions of consumer perceptions) as one of the independent variables in the double-bounded dichotomous choice model for sustainable aquaculture [
36,
37,
38]. An economic variable (i.e., household income), socio-demographic variables (e.g., age, family size, and gender), and seafood preference (frequency of consuming seafood) were also included in the estimation model.
Traditionally, economic variables (e.g., household income) are essential for estimating economic models, such as a demand model. Socio-economic variables became important for describing a demand function along with the economic variables [
39]. The seafood preference variable is an extended version of socio-economic variables; the variable is a useful indicator for measuring the preference for aquaculture products [
40]. In the current study, the author set the frequency of seafood consumption as a proxy variable to measure seafood preference.
After conducting the CVM analysis, the present research compared the mean WTP by the level of the NEP scale. The author used the mean of the composite NEP score, categorizing respondents into two groups: high NEP and low NEP. The mean WTP was compared for both groups to examine group differences by the NEP level (i.e., level of environmental concern).
4. Results
4.1. Descriptive Information
The sample profile shows that 50.4% of the respondents are female and 49.6% are male, with equal age group distribution (
Table 4). Furthermore, 66.5% of the respondents are married, and 33.5% are single. In terms of education level, 64% of the respondents have a bachelor’s or postgraduate degree. More than half of the respondents were between 20 and 49 years old at the time. Most annual household incomes fall between
$54,654 and
$76,363, accounting for 22.1% of the respondents.
4.2. Exploratory Factor Analysis Results
Exploratory factor analysis produced two-dimensional factors, such as nature and balance and human dominance (
Table 5, Item). The eigenvalues for the factors were 2.374 and 1.699, respectively (
Table 5, Eigenvalues). Items under nature and balance loaded highly on factor 1; human dominance items loaded on factor 2. The Cronbach’s ɑ for both factors exceeded 0.70, which is the minimum requirement for item reliability [
41].
4.3. Estimation of Willingness-to-Pay for Sustainable Aquaculture Products
According to the double-bounded choice model estimation, household income is significant, whereas respondent attitude is partially significant. The demographic variables are insignificant, whereas seafood preference is statistically significant (
Table 6,
p-value).
The author estimated consumer WTP based on the CVM results. WTP for 1 kg of live red seabream (i.e., sustainable aquaculture products) is ₩48,951 (Korean won), which is equivalent to
$44.5/kg (USD) (
Table 7, coefficient). This amount is about
$10 higher than a conventional aquaculture product (i.e., live red seabream). In the estimation, insignificant variables (human dominance and demographic variables) were excluded, whereas household income, nature and balance, and seafood preference were considered.
Independent samples T-test results show that the high NEP group has more WTP for sustainable aquaculture products—as much as ₩5901 or
$5.36/kg (
Table 8, Mean).
5. Discussion
For this study, the NEP scale was used to measure consumer perception of the environment and its underlying dimensions were identified. EFA results indicated that consumer perception comprises two dimensions: nature and balance and human dominance, yielding two indicators as independent variables in the contingent valuation method estimation. A double-bounded CVM model enabled estimation of WTP for sustainable aquaculture products (e.g., live red seabream) farmed using a copper-alloy aquaculture net system. The CVM estimation results indicated that the demographic variables and the consumer perception variable of human dominance are insignificant, while the economic variable, the consumer perception variable of nature and balance, and seafood preference are significant. Moreover, the present research estimated the WTP for sustainable aquaculture products by comparing the mean WTP by NEP level groups.
In economic theory, income is one of the most important variables for determining product demand and consumption [
42]. Our estimation results show that the coefficient of household income is positive: higher household incomes show higher WTP for sustainable aquaculture products. Solgaard and Yang [
43] reported similar results too. Their model shows that household income positively affects the price premium for sustainable aquaculture products.
Consumer perception of the environment is a significant variable that affects WTP. Numerous studies have examined the effect of consumer perceptions on consumer behavior [
43,
44,
45,
46,
47,
48]. For example, Solgaard and Yang [
43] found that pro-environment consumers had a 25% greater payout for sustainable aquaculture products and securing animal welfare; here, the demographic variable and household income were significant. However, Solgaard and Yang focused more on animal welfare than on consumer perception of the environment because they lacked reliable instruments to measure consumers’ environmental concern. To overcome this limitation, the author introduced the NEP scale in the context of seafood marketing.
The author divided the survey respondents into high and low NEP groups to examine the mean difference of WTP between the two groups. The difference is statistically significant, showing a price premium that reaches ₩5901 (i.e.,
$5.36). This finding is consistent with previous research. For example, Kotchen and Reiling [
21] used the NEP scale to measure respondents’ perceptions, revealing that attitudes toward the environment could influence WTP for nonuse value of endangered species. Paul et al. [
48] used the theory of planned behavior to analyze how consumers’ environmental perceptions and attitudes affect their behavior. Instead of CVM, they used structural equation modeling to analytically investigate behavioral intent (rather than WTP). Their results indicate that environmental concerns affect attitudes toward pro-environment behavior, subjective norms, and perceived behavioral control. Such constructs eventually affect behavioral intentions. Overall, the perception of the environment is more likely to affect consumers’ WTP. Our study provides empirical evidence for this mechanism.
Uniquely, the study findings considered seafood preference as a crucial variable affecting consumer WTP. Some research has attempted to include food-related variables in research models [
43,
49]. For example, Solgaard and Yang [
43] found that consumers who understand the characteristics of seafood products were also willing to pay more money. Klöckner et al. [
49] analyzed the effect of country of origin and echo-labeling on CVM, concluding that knowledge of food affects CVM. Such results are consistent with the present results. Notably, the food-related variable is meaningful—the current research found that those who consume seafood regularly and frequently are willing to pay more money.
6. Conclusions
The present research explored the consumer WTP using double-bounded choice modeling (CVM). The research findings provide significant implications for the aquaculture industry. Sustainable aquaculture is likely to be costlier than conventional aquaculture. Even though copper-alloy farming nets are eco-friendly, most fish farmers use nylon farming nets as they are less expensive. Sustainable aquaculture minimizes the environmental impact, improving environmental sustainability, as well as its values. However, the market does not yet fully reflect these values, exhibiting a typical example of a negative externality. To resolve this issue in the aquaculture industry, the government should either support aquaculture or create opportunities for the market to recognize and reflect environmental values, along with compensation for sustainable aquaculture producers. Compensation could include retailers’ commitment toward favorably handling sustainable aquaculture products or a price premium in the market. The ASC certification is an excellent example of such a mechanism.
The author identified the price premium for sustainable aquaculture using the CVM method. Originally a measurement tool for values, it helped us determine which variables could affect values: income was identified as a significant variable. Note that the income level in South Korea has increased in the last three decades, leading up to gross national product per capita of $30,000, which is expected to continue increasing in the future along with consumer WTP.
Environmental perception is a crucial factor affecting the WTP for sustainable aquaculture products. The perception reportedly increases consumer-based environment activities and strengthens consumer awareness of the environment’s importance [
50]. For example, because of the spread of sustainable aquaculture certification systems (e.g., ASC, Friend of the Sea, Naturland, and GSSI), organizers are actively promoting marketing activities to increase consumer awareness of the environment. The response in the market has been positive: Hilton Worldwide, IKEA, and Carrefour, for example, now serve ASC products [
51], whereas at the Rio Olympics 2016, organizers served ASC products at the dining courts [
52].
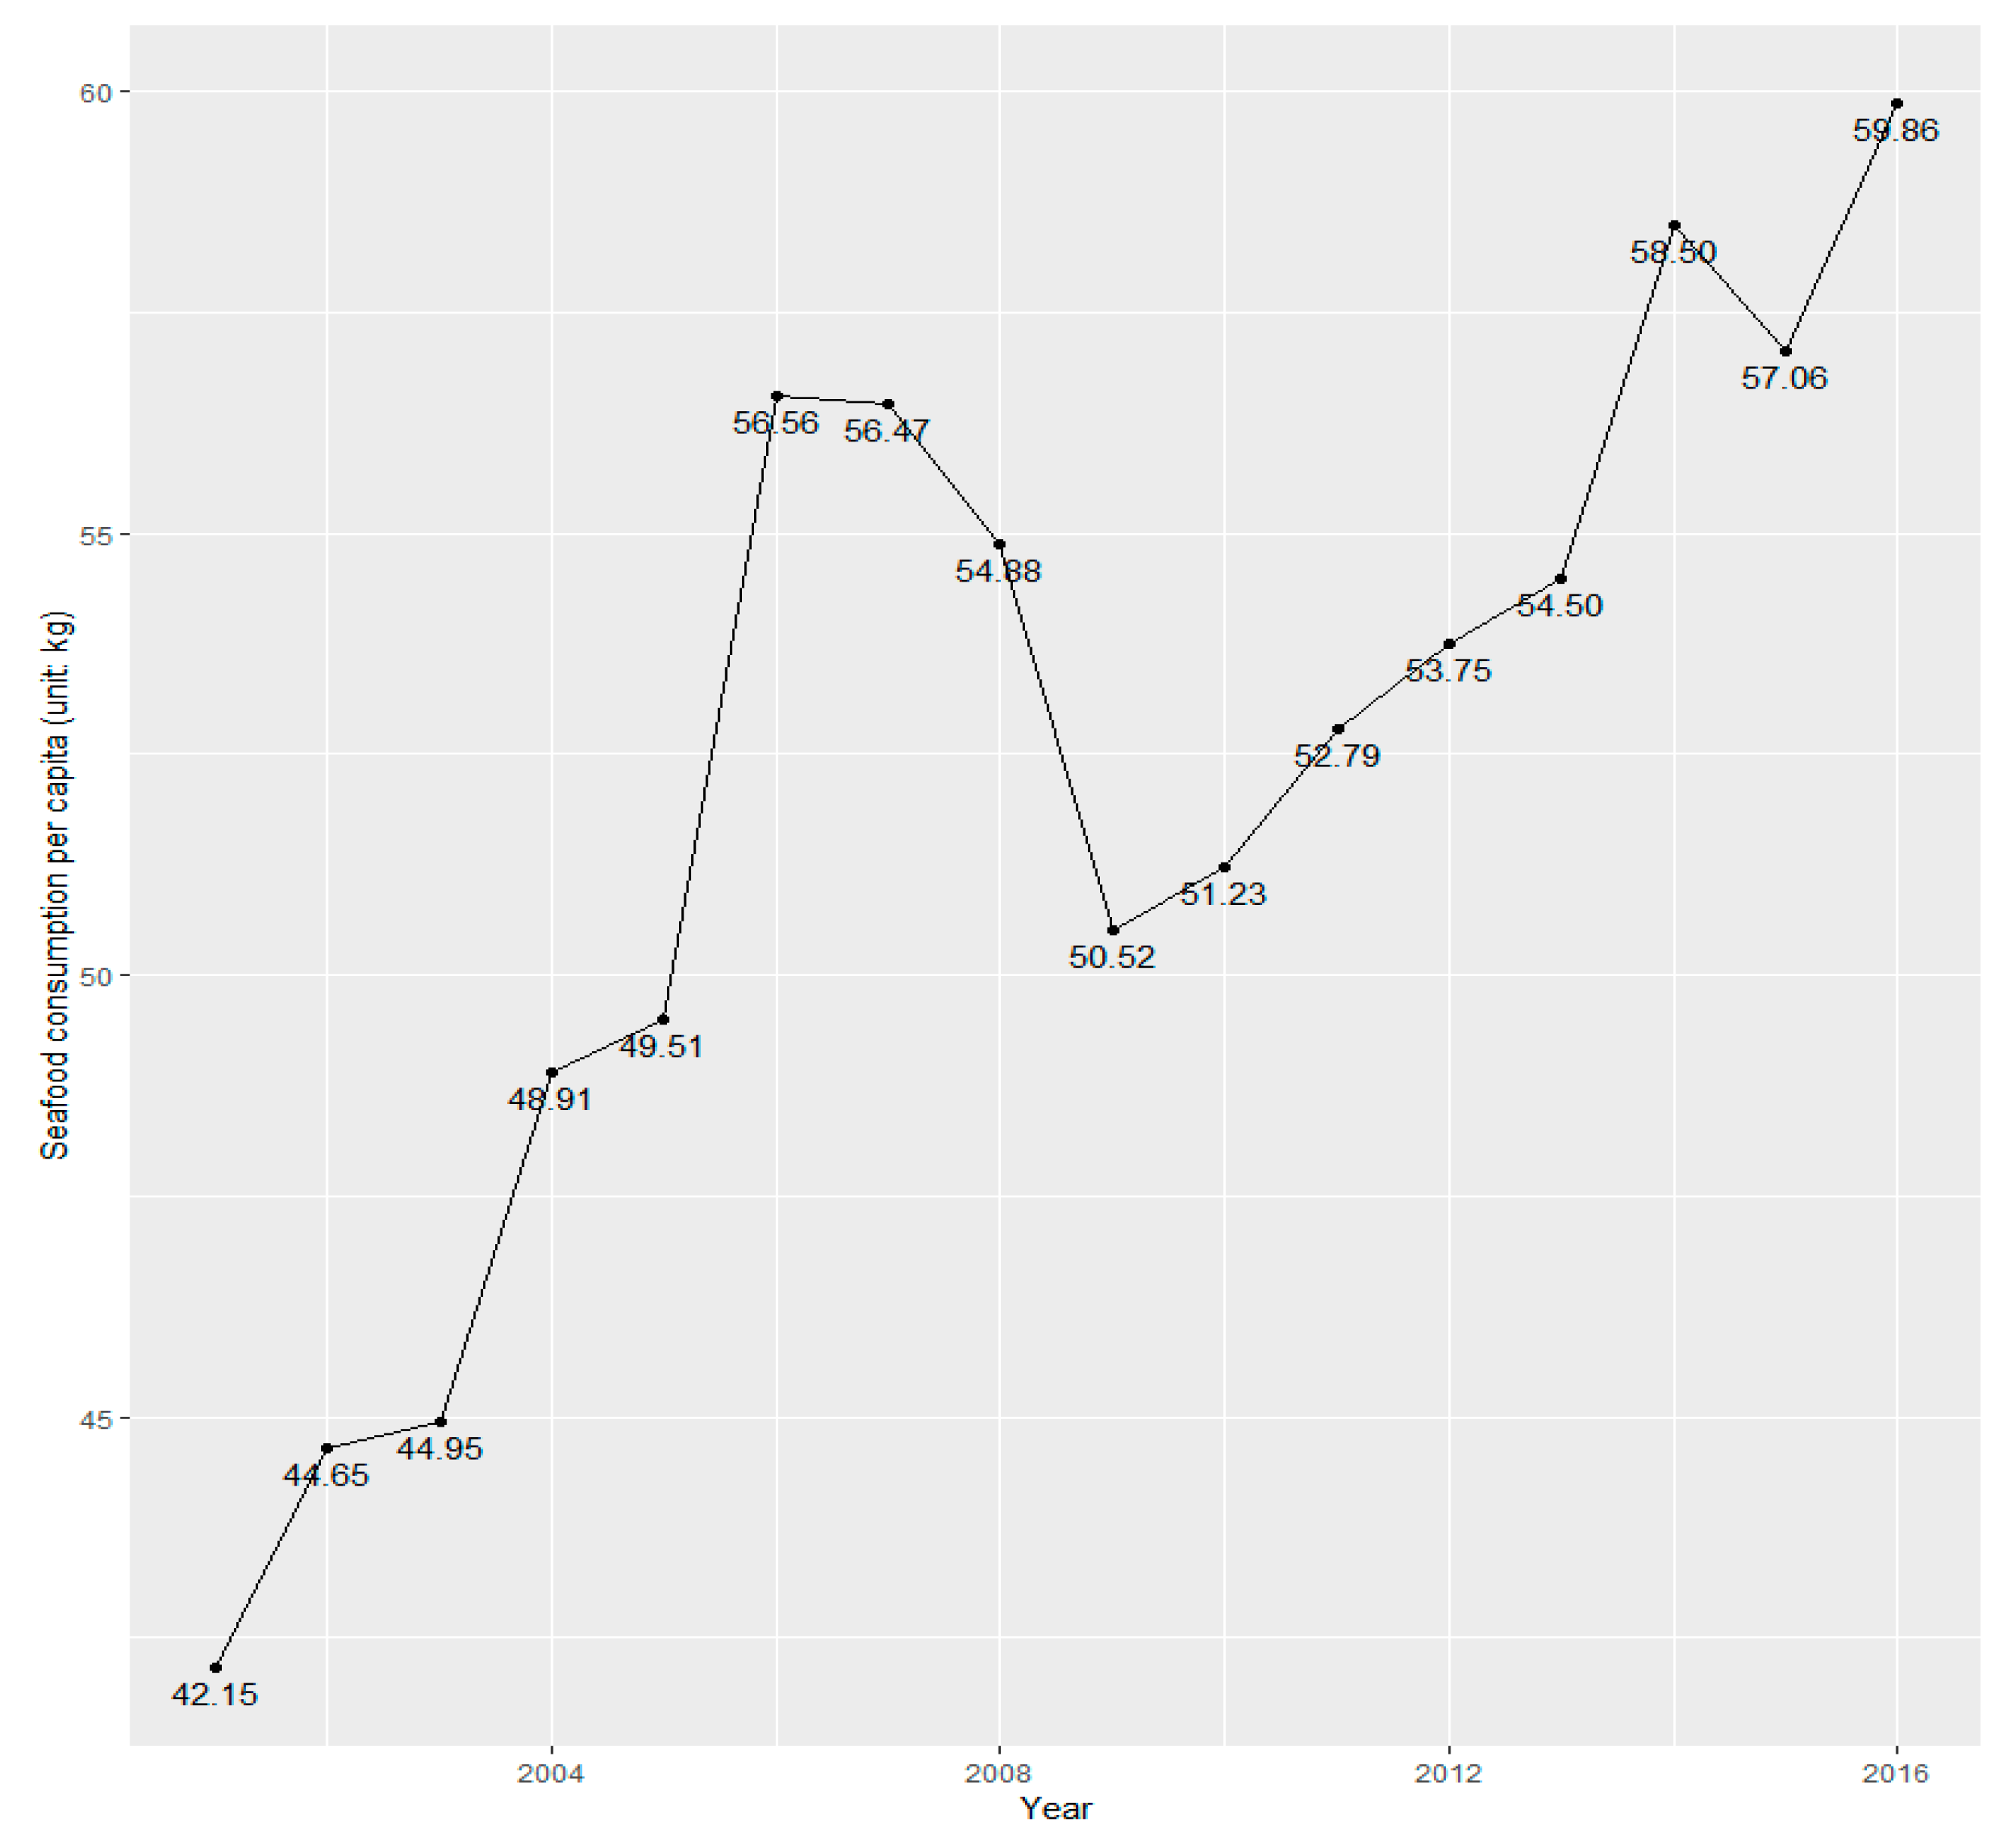
Seafood preference (i.e., frequency in consuming seafood) is an important variable for CVM in sustainable aquaculture. It can be measured by consumption frequency and amount. In South Korea, seafood consumption has been steadily increasing since 2009. According to FAO [
53], seafood consumption per capita for all populations is around 20 kg, but consumption in South Korea is far above this amount. Annual per capita seafood consumption in South Korea has increased from 50.52 kg in 2009 to 59.86 kg in 2016 (See
Appendix A). Thus, the Korean seafood market has more potential to generate price premiums for sustainable aquaculture products compared with other counties.
South Korea has the potential to transition to sustainable aquaculture through consumer participation. However, the focus of its current aquaculture policy is not on quality, but on production volume-oriented measures. The government must urgently shift to sustainable aquaculture because consumer expectations are now higher than expectations of government officials and fish farmers.
Finally, the current study is not free from limitations. The present research focused on red seabream, a cage-farmed species, as well as aquaculture cage net selection, which represent only one aspect of sustainable aquaculture practices. Although red seabream is a typical aquaculture species in South Korea and the copper-alloy aquaculture net is a promising technology for sustainable aquaculture, it is difficult to generalize our findings to the entire aquaculture industry based on an analysis of one species and technology. Therefore, future research should expand the scope of sustainable aquaculture research.

