Article

Is Bicycle Sharing an Environmental Practice? Evidence from a Life Cycle Assessment Based on Behavioral Surveys

1
State Key Laboratory of Fluid Power and Mechatronic Systems, Zhejiang University, Hangzhou 310027, China
2
Department of Industrial and System Engineering, Zhejiang University, Hangzhou 310027, China
3
National Institute of Innovation Management, Zhejiang University, Hangzhou 310027, China
4
Institutes of Science and Development, Chinese Academy of Sciences, Beijing 100190, China
5
School of Public Policy and Management, University of Chinese Academy of Sciences, Beijing 100049, China
*
Author to whom correspondence should be addressed.
Sustainability 2019, 11(6), 1550; https://doi.org/10.3390/su11061550
Submission received: 28 December 2018 / Revised: 16 February 2019 / Accepted: 5 March 2019 / Published: 14 March 2019
(This article belongs to the Section Sustainable Transportation)

Abstract

:
As an icon of sharing economy and product service systems, bicycle sharing is gaining an increasing global popularity, yet there is little knowledge about the environmental performance of this emerging traveling mode. To seek the answer to the question, the paper employs a survey-based method and a life cycle assessment (LCA) approach. We first conduct a questionnaire-based survey to identify the changes in traveling modes after the introduction of shared bicycles. The survey results show that the use of shared bicycles is more popular among young and low-income populations, and shared bicycles are predominantly used to replace walking and bus-taking. Based on the survey results, we model the environmental impacts of the changed traveling behaviors and the life cycle of shared bicycle with the aid of Gabi software. The LCA results shows that bicycle sharing is currently an environmentally friendly practice, as it brings environmental savings in all the indicators except metal consumption. Further, the results of sensitivity analysis show that aging, rising rental fees, and increasing volume of shared bicycles would impart negative impacts on the environmental performance of bicycle sharing. The findings of this work facilitate the management and development of bicycle sharing.

1. Introduction

As a representative of sharing economy and product service system (PSS), bicycle sharing has been adopted in major cities such as Shanghai, London, Chicago, and Paris [1,2]. In China, it has reported that more than 23 M shared bicycles have been introduced and attracted 400 M users as of January 2018 [3], the rapid development of bicycle sharing service has created over 100,000 jobs [4]. OFO, one of bicycle sharing startups in China, has approximately 8 M yellow-framed bicycles in more than 170 cities in nine countries. The company is reported to have approximately 25 M orders per day and 3 B cumulative orders through to July 2017 [5]. In March 2018, OFO received an investment of $866 M USD, setting a record for the bicycle sharing industry [6]. Bicycle sharing has also enjoyed a substantial growth in the United States from 2010 to 2016; the number of shared bicycles has reached over 42,000 in 2016, while the figure was only 1600 in 2010 [7]. However, the environmental sustainability of bicycle sharing is a center of controversy, as this traveling mode is under heavy criticisms, such as oversupply and low recycling rate [8]. Furthermore, there is little knowledge about the environmental performance of this emerging traveling mode. Caggiani et al. [9] stated that bicycle sharing can significantly reduce air pollution, since it provides users with a carbon-free traveling mode. This argument is agreed by other scholars like Shaheen et al. [10] and Otero et al. [11] and Cohen [12], yet, their claim lacks of quantitative support.
Due to limited data availability [13,14], only one study quantitatively examines the environmental performance of bicycle sharing. Zhang and Mi [15] employed a dataset provided by Mobike to analyze the environmental performance of bicycle sharing, and found that the adoption of bicycle sharing in Shanghai saved 8358 tons of gas and 25,240 tons of CO2 emission. In the work of Zhang and Mi [15], it is assumed that shared bicycles are only used to replace taxi or walking; it is inconsistent with the literature on the adoption of bicycle sharing [1,16,17]. Additionally, the work only includes carbon emission and oil consumption [15], which only account for a very small proportion of the overall environmental impacts; other categorized environmental impacts, such as particulate formulation and human toxicity, have been neglected. Moreover, the environmental impacts of the entire life cycle of shared bicycles have not been considered in the extant literature on bicycle sharing. To conclude, until now, the question of “whether bicycle sharing is an environmental practice” is still in need of a proper answer.
The primary objective of our work is to answer the aforementioned question, as well as to identify the influential factors that affects the answer. To this end, we employ a life cycle assessment (LCA) approach to quantitatively analyze the environmental impacts of the traveling behaviors that are changed by the introduction of bicycle sharing and the life cycle environmental impacts of a shared bicycle. To overcome the limitations in data acquisition, we conduct a questionnaire-based survey to identify the changes in traveling modes that are associated with the introduction of bicycle sharing. The survey method was adopted to investigate the information of shared bicycle users in China, rather than the general public, due to the availability, comprehensiveness, and accessibility of the data obtained from the questionnaire. China is the leading market of bicycle sharing, as the number of sharing-trips in China has exceeded 10 B, accounts for 67% of the global market share [18]. Extensive participation promotes the understanding of sharing economy, suggested by Böcker and Meelen [19]. On the basis of the survey results, we employ the LCA method to model the whole life cycle of a shared bicycle, including the replaced traveling processes during its life cycle. The questionnaire surveys the weekly short trip due to the following reasons: (1) shared bicycles are generally used as a solution to the “last mile problem” [1,20], mainly for short trips; (2) the weekly traveling data can avoid the differences between working days and weekends [21]. With the aid of the Gabi software package (Leinfelden-Echterdingen, Germany), we evaluate the life cycle environmental impacts of changed traveling behaviors and shared bicycles in terms of both the ReCiPe mid- and end-level indicators. A sensitivity analysis is carried out to assess the changes of parameters of the following four aspects: (1) population structure, (2) rental fee, and (3) service life of a shared bicycle, and (4) volume of shared bicycle.
The contribution of this work is threefold. First, we combine the life cycle data of shared bicycles with users’ traveling behaviors to assess the environmental impacts of bicycle sharing. Second, we evaluate the environmental performance of bicycle sharing in a comprehensive manner, as multiple environmental impact indicators, such as global warming potential, fossil depletion potential, and metal depletion potential are included. Third, we conduct a sensitivity analysis on the four selected factors to identify their potential impacts on the life cycle environment performance of shared bicycles. Based on the results, we provide recommendations on the management and development of bicycle sharing, with the objective to promote the environmental benefits.
The rest of this paper is organized as follows: Section 2 illustrates the design of questionnaire and the procedure of the LCA methodology. Section 3 presents the results of surveys and LCA. Section 4 discusses the shortcomings of this work and offers recommendations for administrators and business practitioners. The conclusive marks are given in Section 5, as well as the potential directions of future research.

2. Methodology

2.1. Questionnaire Design

Since the data of sharing bicycles from bicycle sharing companies can only obtain traveling trajectories of their users, while the demographic information of users and the potential changes in their traveling modes are unknown. The primary objective of our work is to assess whether the environmental impacts of the reduced mileage of other traveling modes that are replaced by shared bicycle can sufficiently offset the life cycle environmental burdens associated with shared bicycle. Without information of socioeconomic characteristics and changed traveling behaviors, our goal can never be achieved. Additionally, such datasets from bicycle sharing companies are always in short supply. Self-reported data is widely used in the study of shared bicycle [22,23,24], since it can efficiently investigate user characteristics, attitudes and usage of shared bicycles, although it may be biased and participants may overestimate their traveling intention to meet social expectations towards environmental behaviors [25], besides, the survey results are also difficult to copy, which is one of the defects of the questionnaire survey method [26]. To achieve our objective, we thereby carry out a questionnaire-based survey to explore the impacts of adopting bicycle sharing on individual traveling modes, and take some measures to ensure the authenticity and representativeness of online survey results, such as questionnaire screening and stratified adjustment. Since the purpose of this study is to investigate the replacement of shared bicycle by its users, the survey target at shared bicycle users rather than the general public. The questionnaire consists of the three following parts, and its complete form is shown in Table A1 in the Appendix A:
(1)
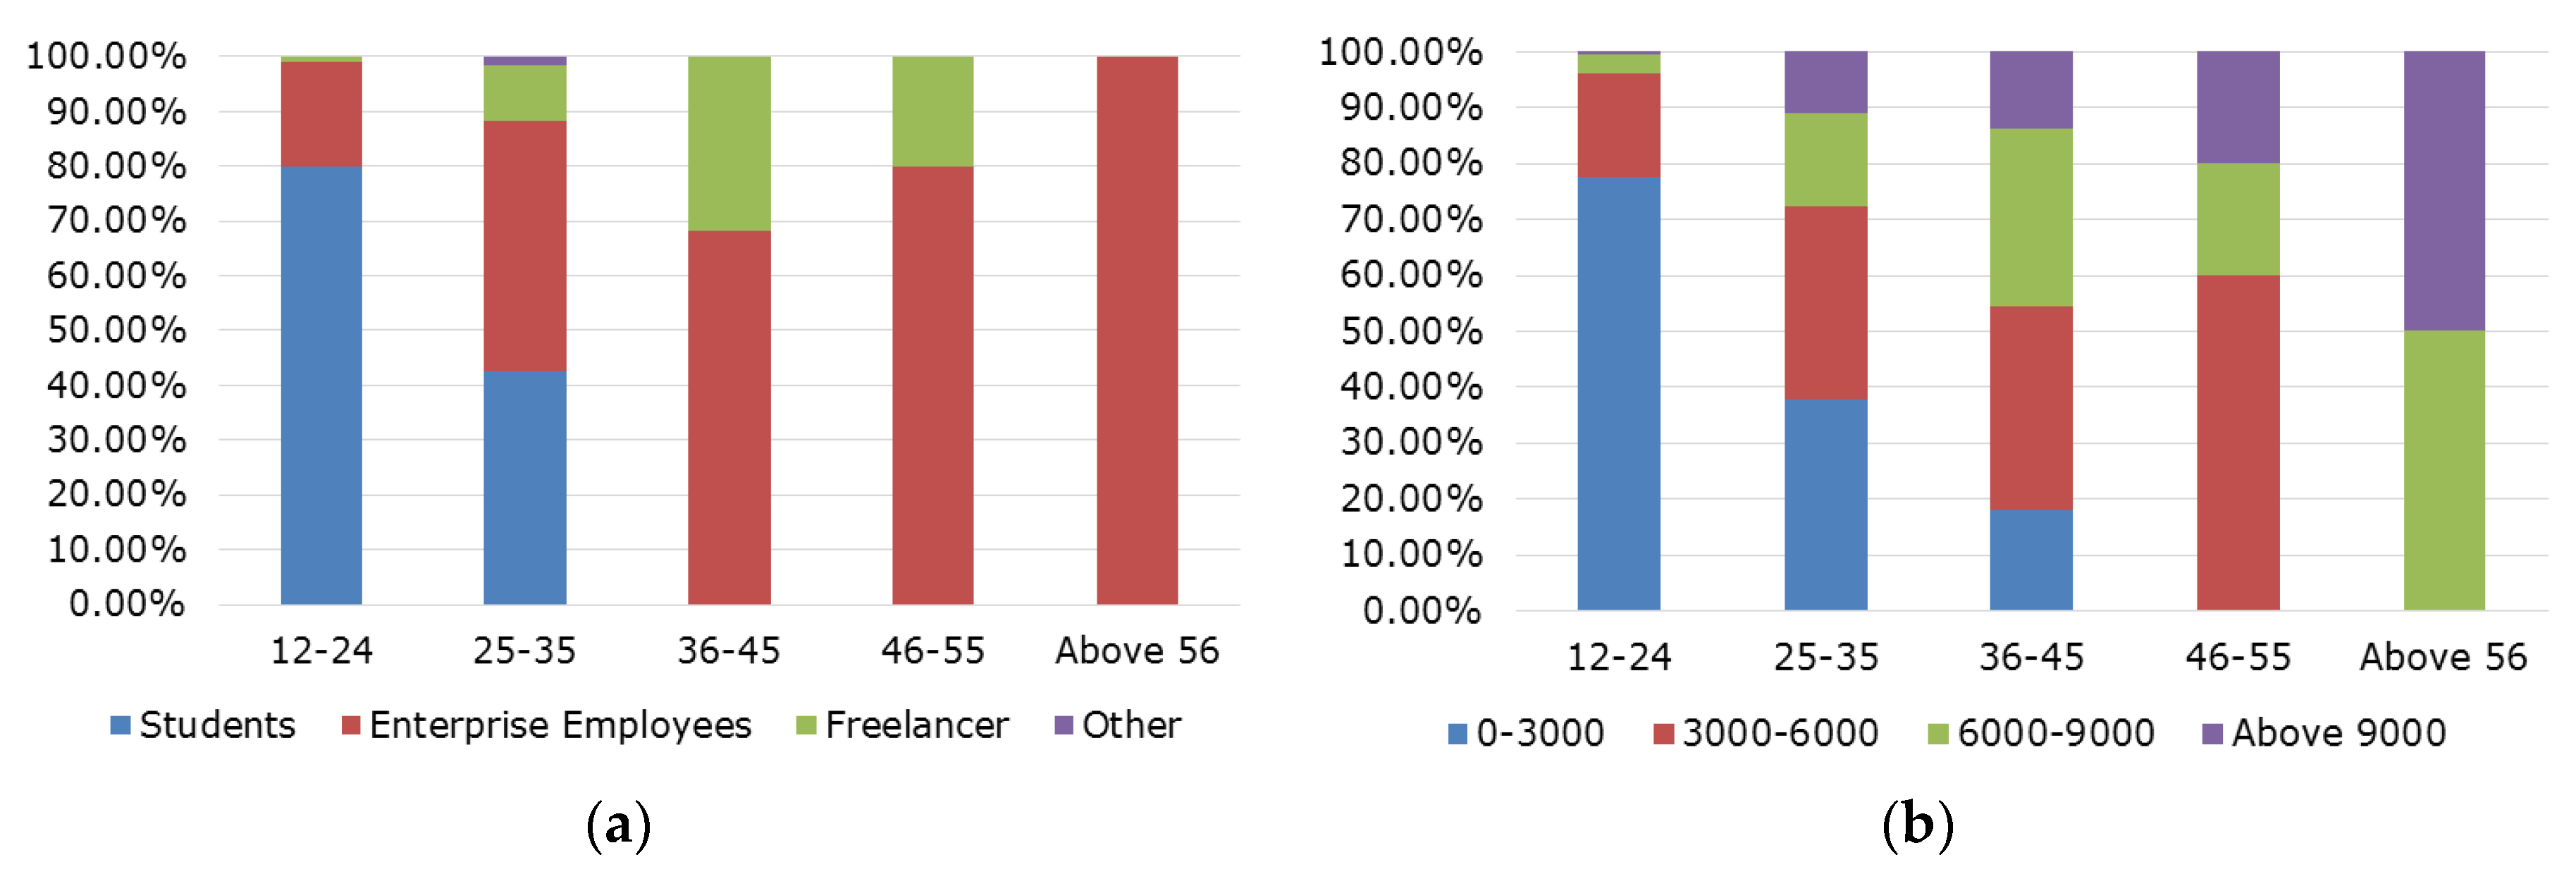
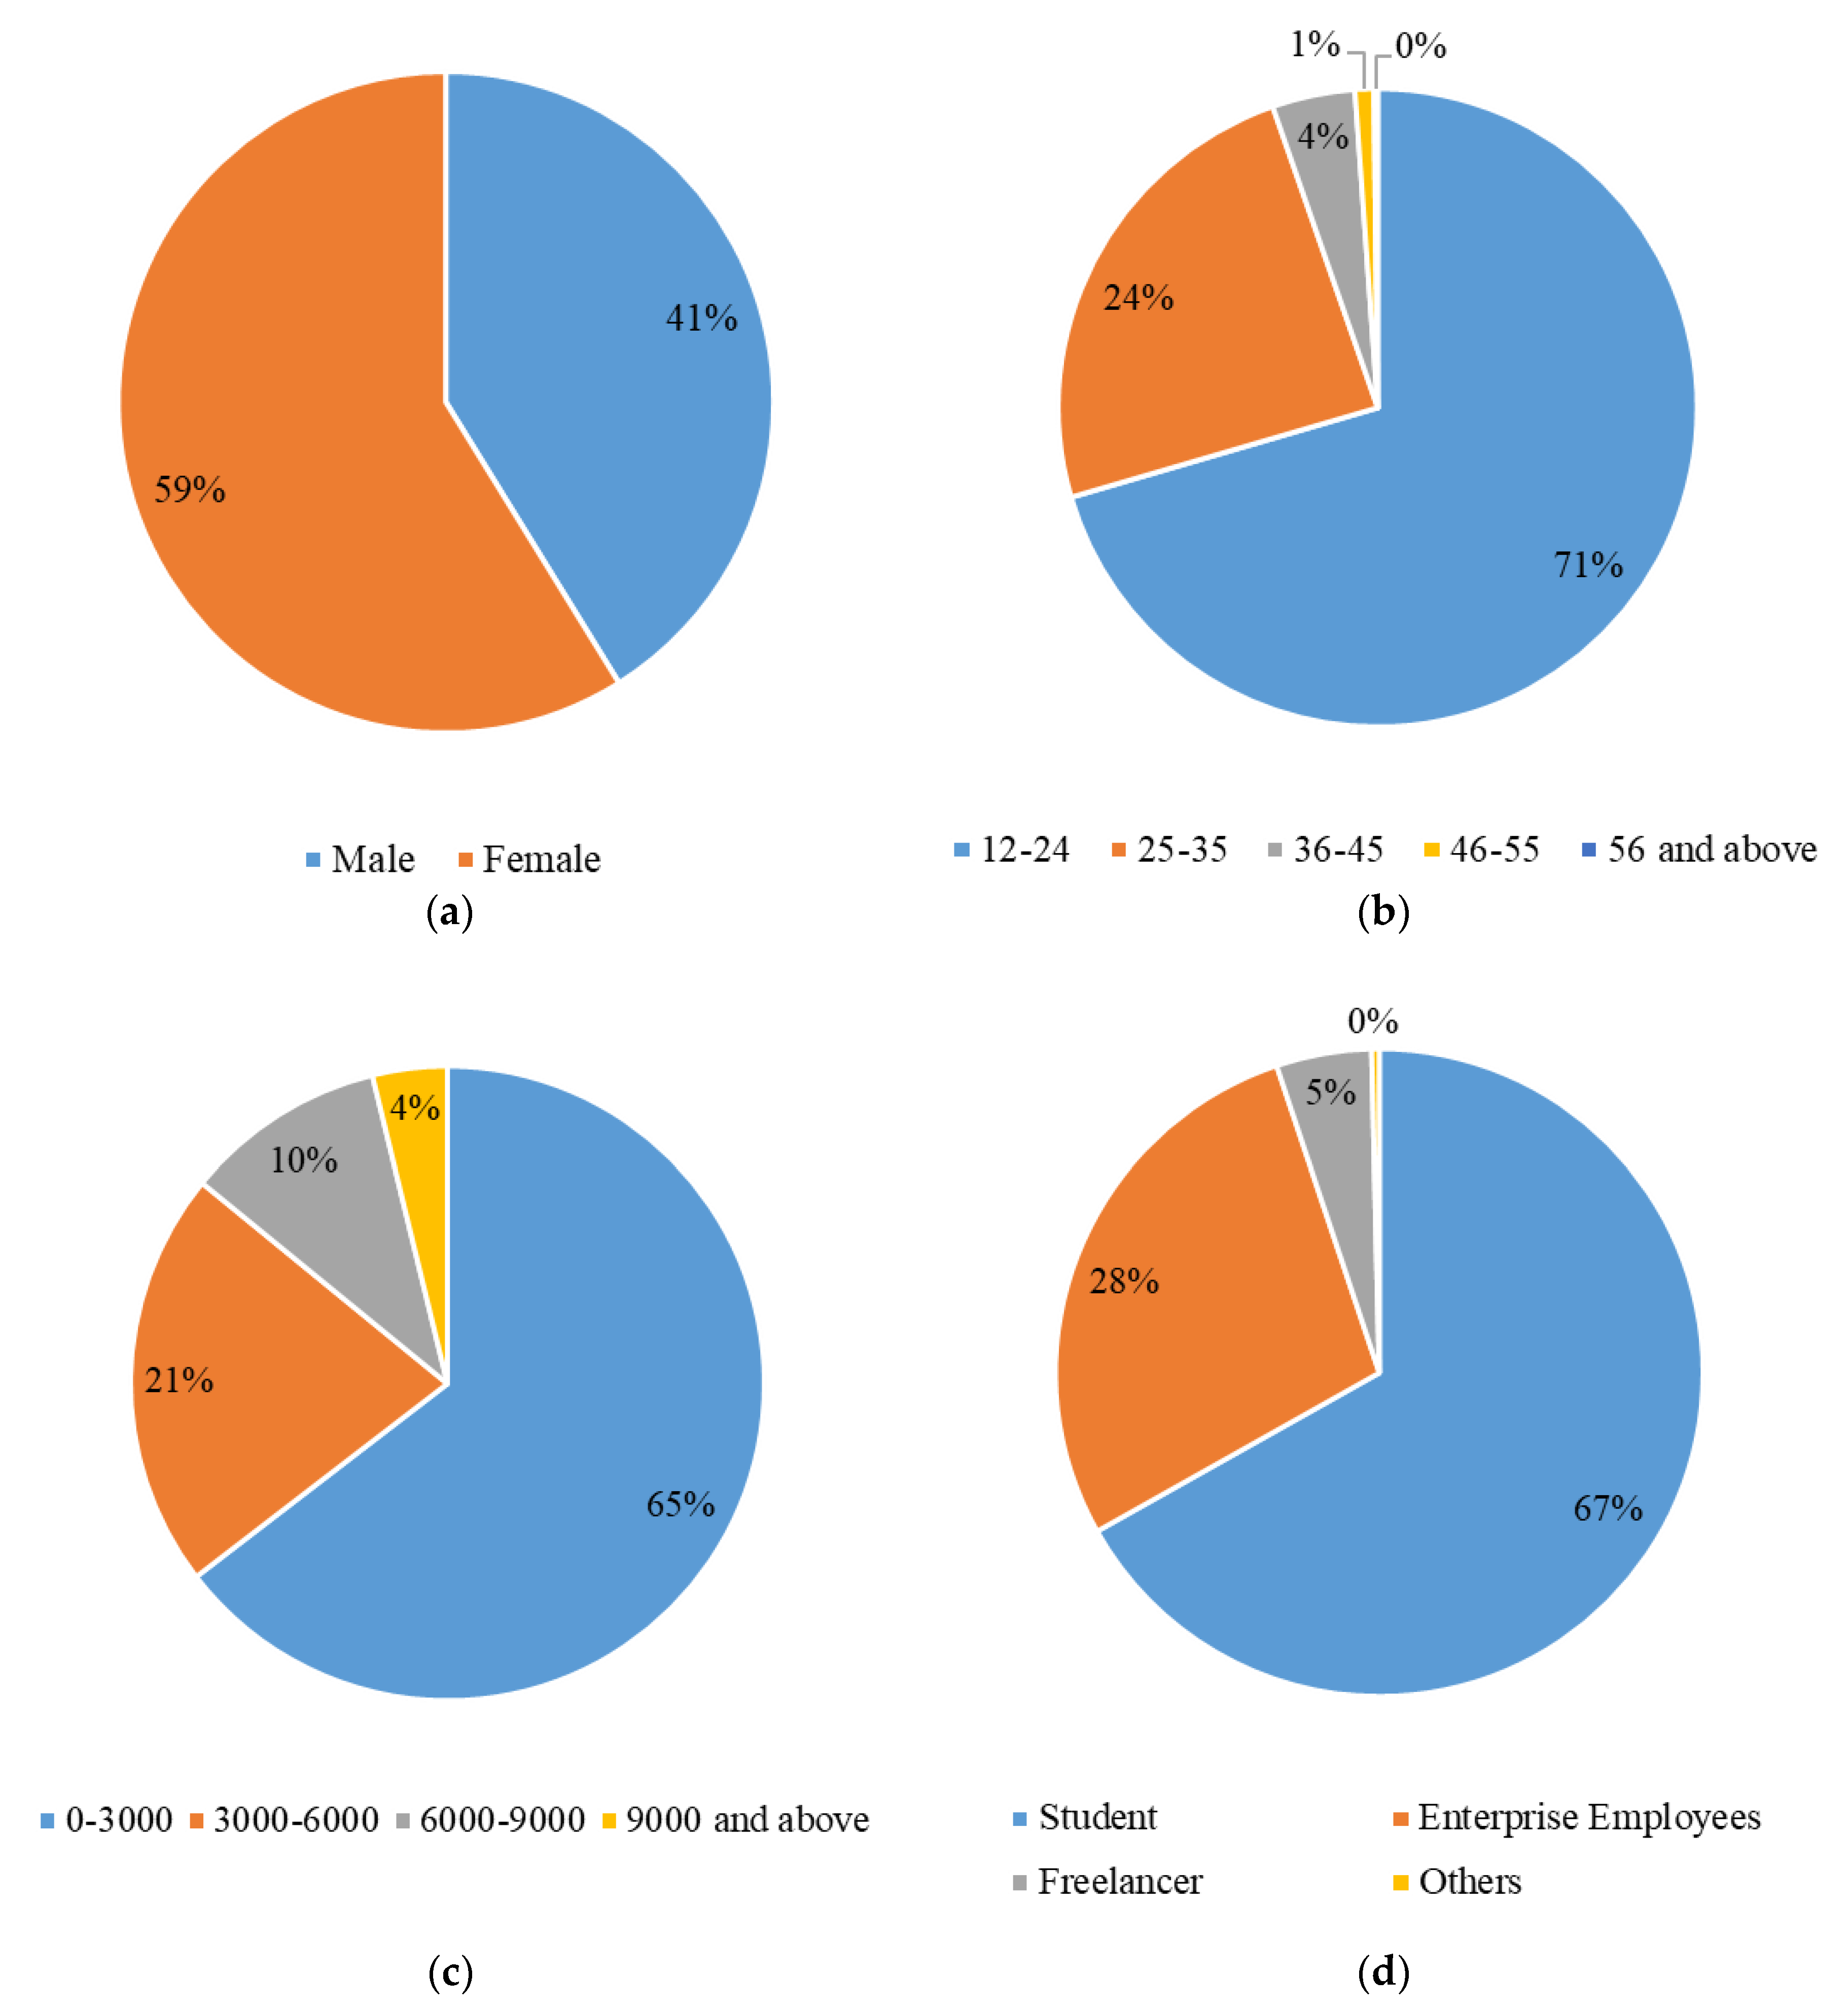
The socioeconomic (demographic) information of the respondents, including age, gender, occupation, income, and location. This information is used to understand the persona of shared bicycle users.
(2)
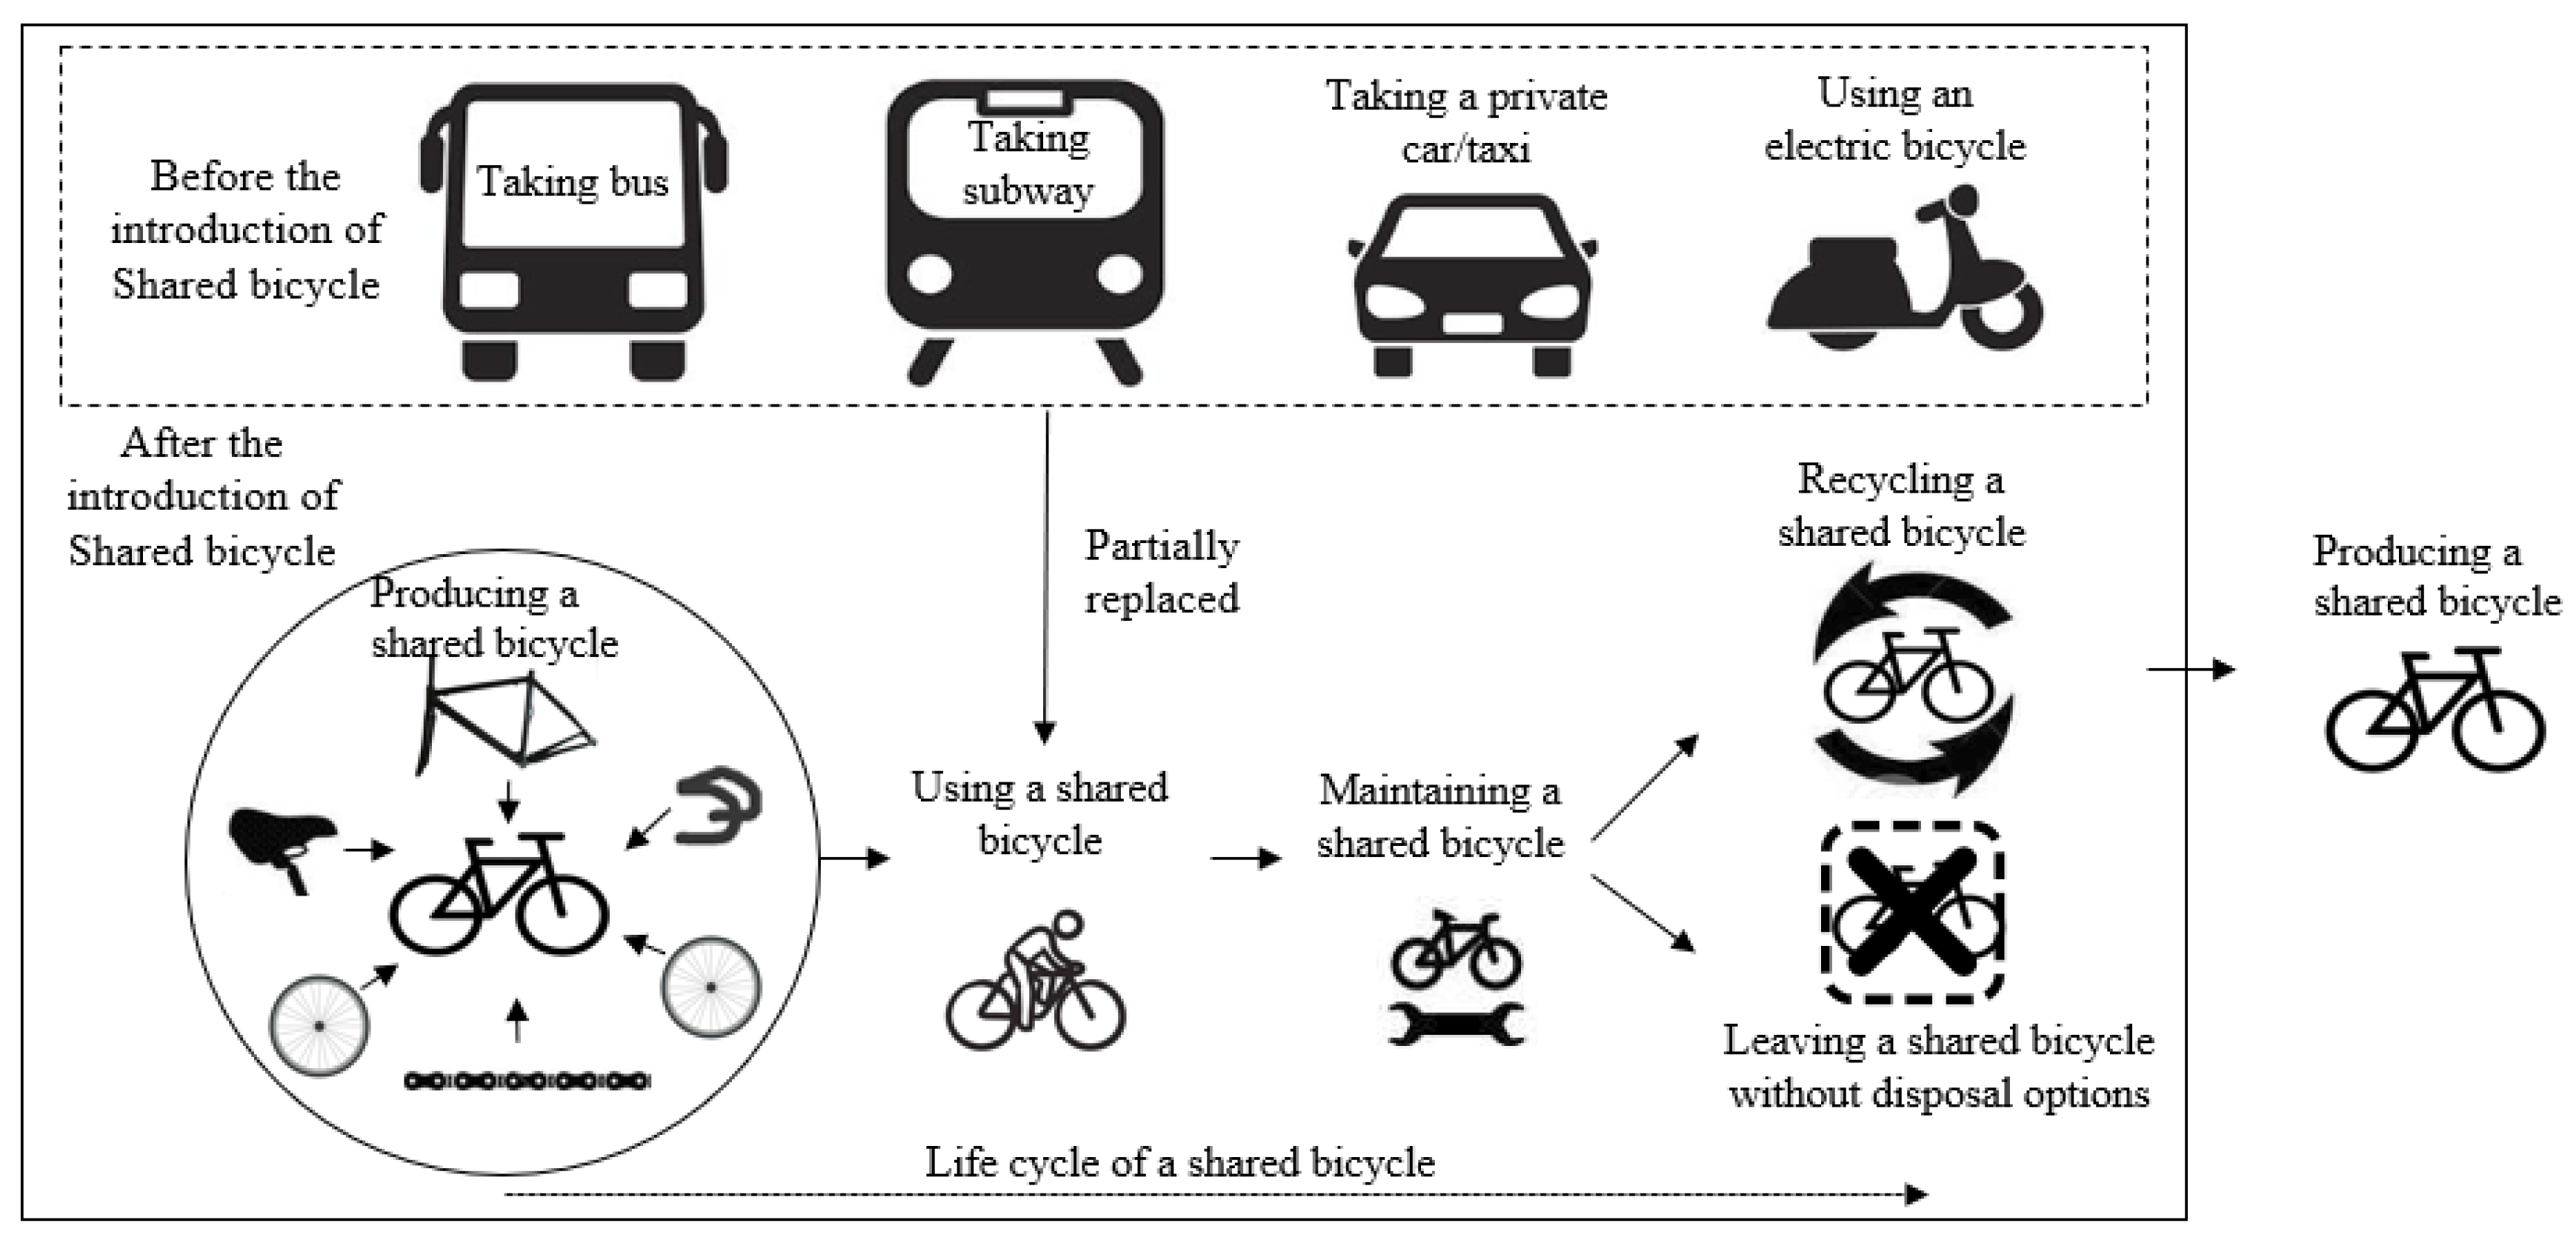
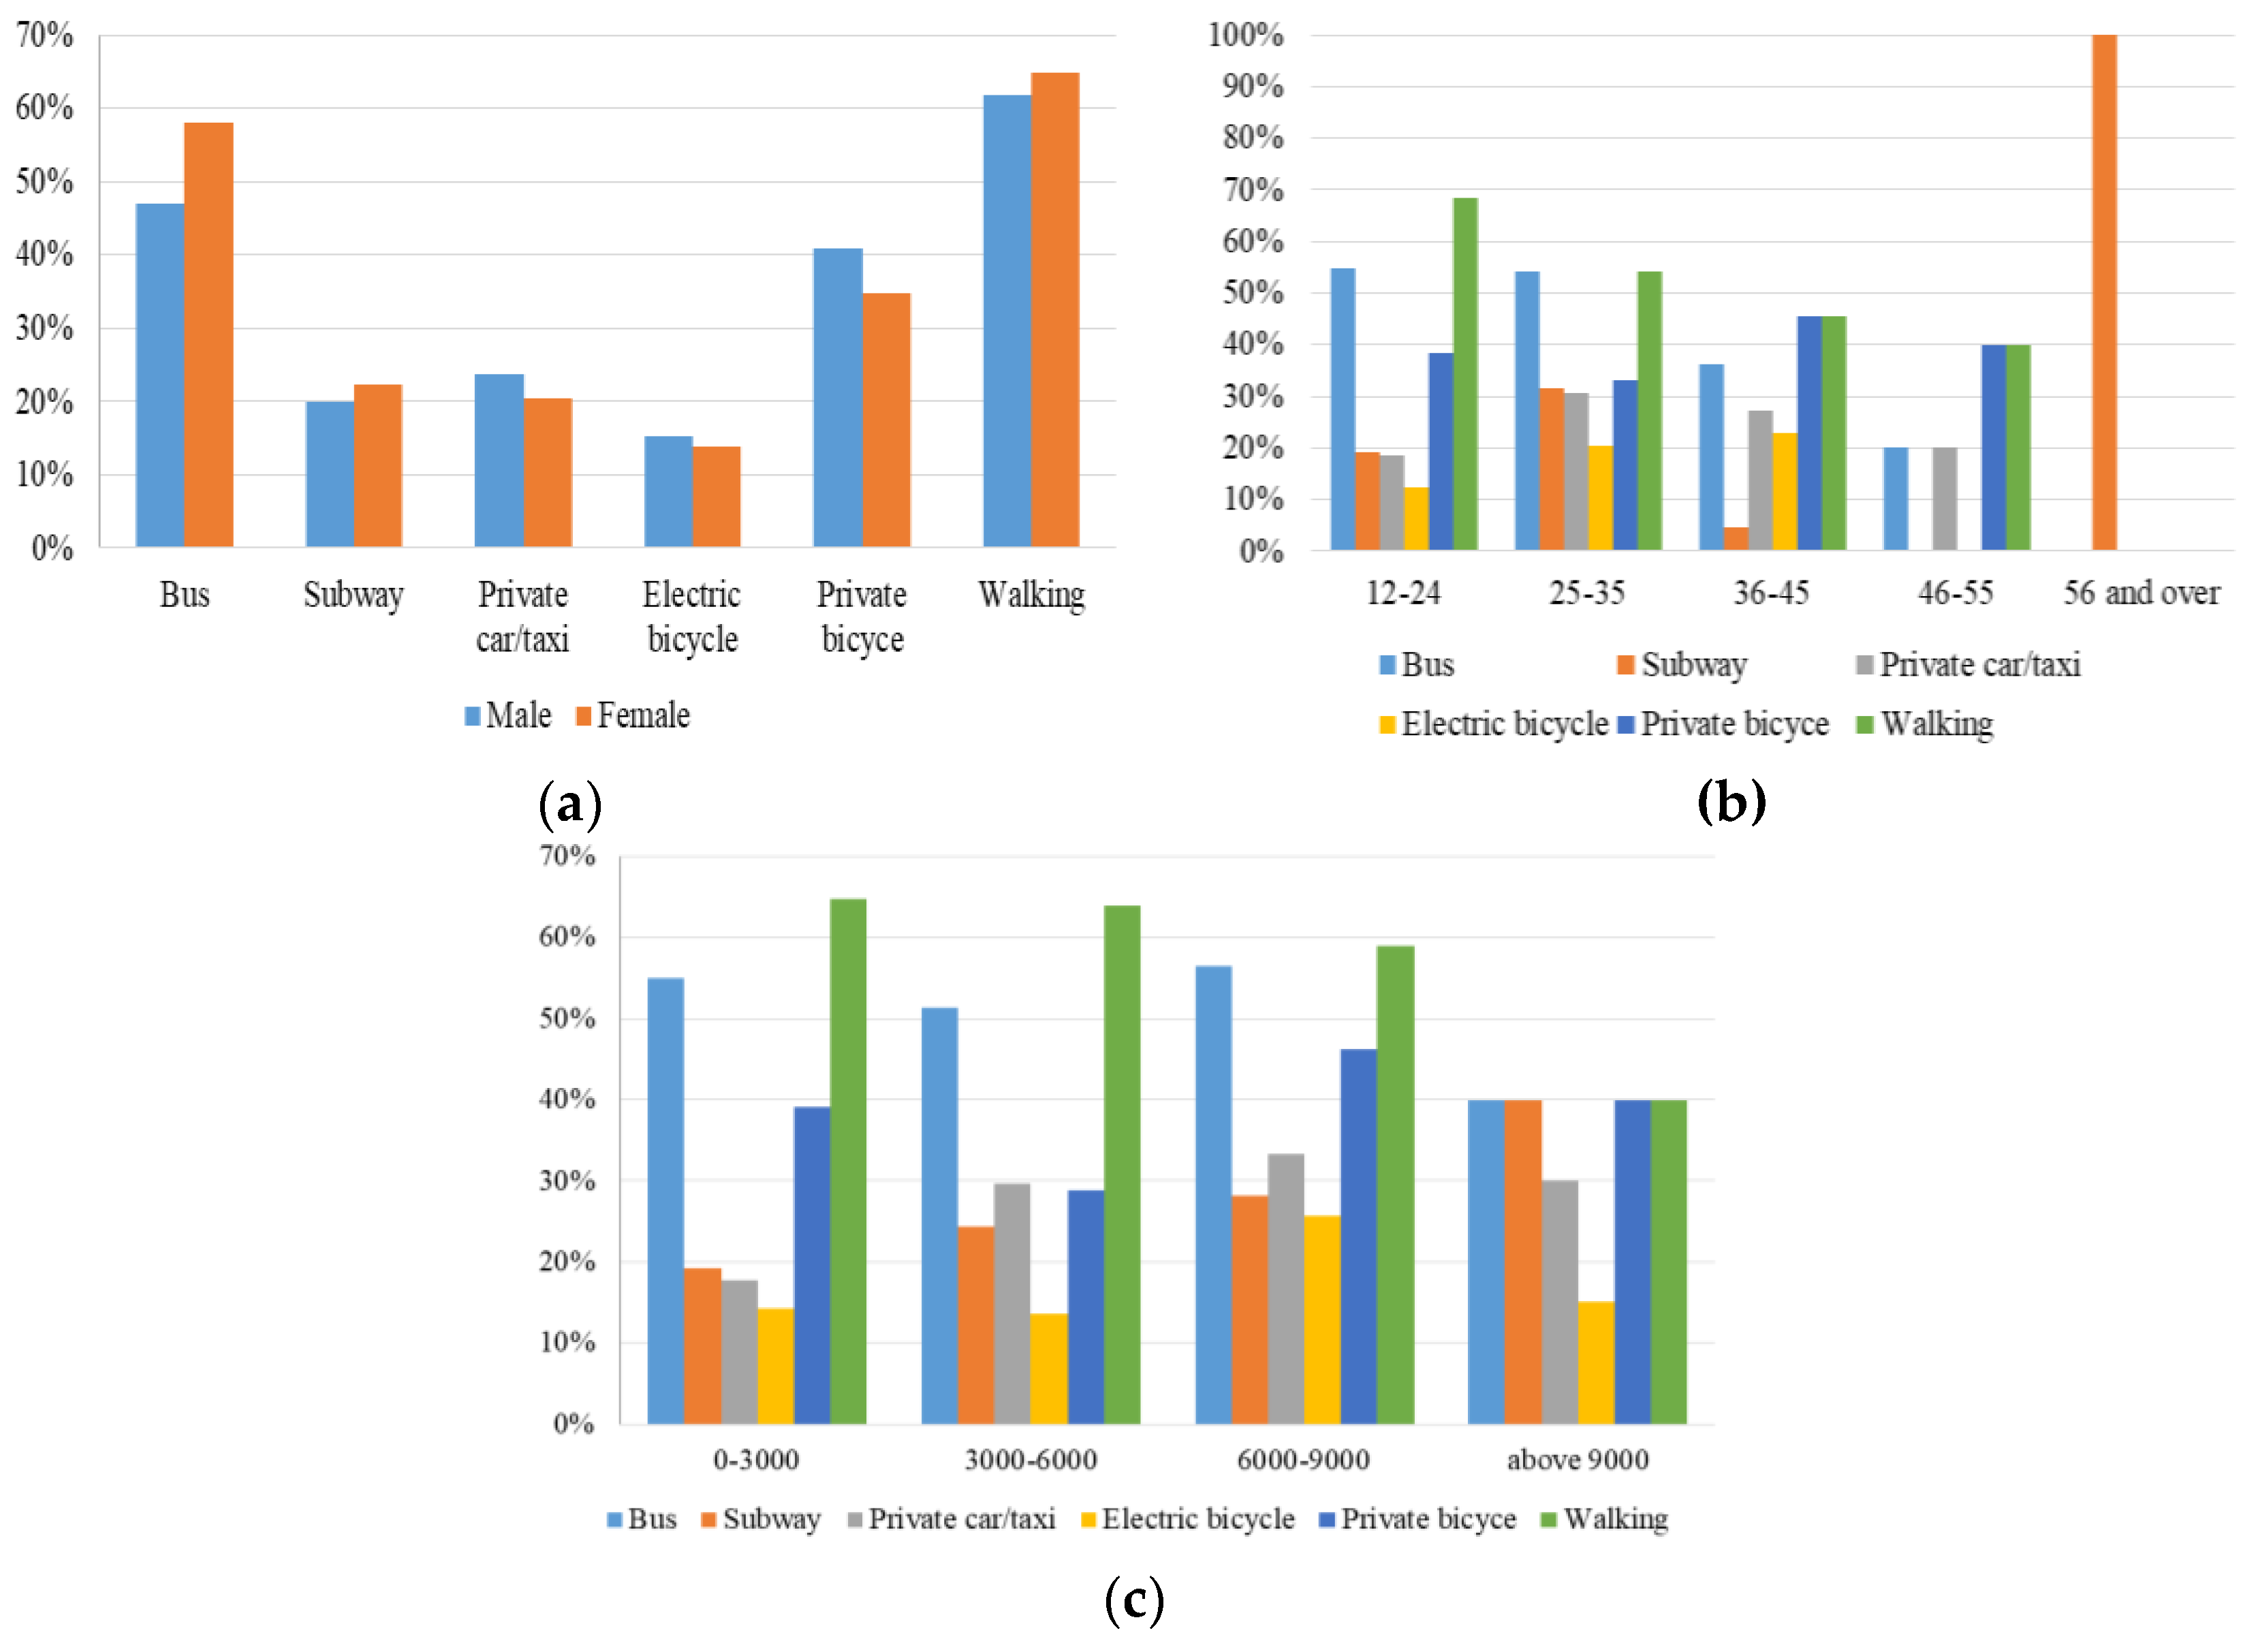
The changes in traveling modes after the introduction of bicycle sharing are identified in terms of mileage per capita per week. Based on the previous literature that reports the use of shared bicycles [27,28,29], options of original traveling means are thereby developed: bus, subway, private car/taxi, electric bicycle, private bicycle, and walking. The information is used to model the environmental impacts associated with replacing original traveling means with shared bicycles.
(3)
The perception, attitude towards the bicycle sharing, e.g., how the respondents view the number of existing shared bicycle in their city, and whether increasing the volume of shared bicycle will affect their traveling modes. This information is used to evaluate residents’ attitudes toward bicycle sharing, with the objective of providing suggestions on managing this traveling mode.
Online survey is adopted in this study since it has the characteristics of wide coverage, high speed, convenience and high efficiency [30]. It is conducted during 20 January 2018 to 20 November 2018. To ensure the authenticity and representativeness of online survey results, the following measures are adopted:
(1)
The questionnaire is published through WJX (www.wjx.cn), a survey app based on WeChat which is one of the most popular social networking platforms in the world, with over 1000 M monthly active users [31].
(2)
Record the respondent’s Internet Protocol (IP), to exclude duplicate responses from the same IP address, and to guarantee that the responses are taken from major Chinese cities where bicycle sharing has been introduced.
(3)
Only the returned questionnaires from the respondents over 12 years old are included. As Shared bikes are prohibited to provide services to users under the age of 12, the respondents of this paper are users over the age of 12 [32].
(4)
Record the time spent on filling out the questionnaire. According to the reading habits [33], a questionnaire with a timespan of less than 15 s is considered as invalid.
(5)
Stratified adjustment [34] is conducted according to the number of shared bicycles in different levels of cities [35], instead of age structure, because there is no data on the age structure of shared bicycle users. The aim of this adjustment is to correct possible bias in the different traveling demands, public transit infrastructures, and adoption rates of bicycle sharing in different levels of cities [36].
The existing questionnaire processing techniques include descriptive statistic [37,38,39], a simplest and most widely used method, regression analysis [40,41], correlation analysis and cluster analysis [42,43,44]. Since the purpose of the questionnaire in this paper is to observe the usage and attitude of different groups on bicycle sharing, the focus is to apply the replaced mileage of various alternative vehicles in subsequent calculation, this paper adopts the method of frequencies statistics and cross-analysis to deal with the collected questionnaire.

2.2. Life Cycle Assessment

Life cycle assessment (LCA) is a popular tool to assess environmental impacts associated with a product [45,46] or a business model [47,48], and it has been widely employed in the environmental impacts of traveling modes like car, bus and rail [49,50]. This study employs the LCA methodology to answer the question of “whether bicycle sharing is an environmental practice”. According to the related ISO 14040 standard [51], the LCA study includes four basic stages: goal and scope definition, life cycle inventory (LCI), life cycle impact assessment (LCIA), and interpretation [45,46,52].

2.2.1. Goal and Scope

The objective of this LCA study is to assess whether the environmental impacts of the reduced mileage of other traveling modes that are replaced by shared bicycle can sufficiently offset the life cycle environmental burdens associated with shared bicycle.
Functional unit (FU) is defined as the quantified performance of a product system for use as a reference unit [45,53]. Based on the previous LCA studies on bicycling [54], the FU of this study is defined as “the complete life cycle of a 17 kg shared bicycle, with an aluminum frame and an expected lifespan of three years, and includes the reduced traveling process of the replaced vehicle during the life cycle”. Considering the differences in residents’ traveling behaviors on working days and weekends [55], the questionnaire surveys the weekly mileages replaced by shared bicycles. The datasets for the LCA study are taken from the survey results, and public databases like Eco-Invent (EI), the datasets and assumptions are illustrated in the following subsection.
Adopting “zero burden assumption” and to be consistent with the goal of this LCA study, the system boundaries shall include the whole life cycle of a shared bicycle and the traveling process of alternative traveling modes, as the cradle-to-grave LCA method is approached in evaluating the whole systems, which is shown in Figure 1. Considering the fact that replacing private bicycle and walking with shared bicycle do not change the environmental performance, system boundaries of this study only cover the first four types of vehicles. This study studies bicycle sharing of both private and public sectors, electric bicycle sharing and car sharing are not included. The processes in the studied system include (1) taking bus, (2) taking subway, (3) taking a private car/taxi, (4) using an electric bicycle, (5) producing a shared bicycle, (6) using a shared bicycle, (7) maintaining a shared bicycle, (8) recycling a shared bicycle, and (9) leaving a shared bicycle without disposal options.

2.2.2. Inventory Analysis

In this study, both primary and secondary data are employed. Surveyed behavioral changes in traveling means are exploited as the primary data, the secondary data refers to the public datasets which cover a wide range of existing materials, traveling means and energy consumption processes. The overall environmental impacts can be calculated using Equation (1), details of the operational data and related assumptions for life cycle impact modeling are reported in this section, as shown in Table 1. The inputs of each process are shown in Table A2 in Appendix A.
The environment performance of bicycle sharing is determined by the traveling process of alternative traveling modes and the environmental impacts of a shared bicycle’s full life cycle. The overall environmental impacts can be calculated using Equation (1):
S = B + F = ( P r o + i = 1 4 α i R i d + M a i n t + R e c +   N o D ) +     i = 1 4 α i f i V o U / V o B W e e k s
where S is the mid- or end-level indicators, and its value determines whether bicycle sharing is a burden or a savior to the environment; B is the environmental impacts associated with the whole life cycle of a shared bicycle; F stands for the reduced environmental impacts associated with replacing other traveling means with shared bicycles; Pro represents the environment impacts arising from the production of one shared bicycle; Rid represents the environment impacts arising from the use of a shared bicycle per kilometer; Maint represents the environment impacts arising from the maintenance of a shared bicycle; Rec represents the environment impacts arising from the recycling of a shared bicycle; NoD represents the environment impacts of leaving a shred bicycle without disposal options, which can be calculated based on the type and amount of material in one shared bicycle, as detailed in Table A2 in the Appendix A; ai represents the mileages of one user each week that shared bicycle instead of other traveling modes, which can be obtained by questionnaire, and the median value of the questionnaire option interval serves as the alternative mileage in this case; i can be 1,2,3,4 representing bus, private car/taxi, electric bicycle, subway, respectively; fi represents the environment impacts of the corresponding traveling modes that are replaced by bicycle sharing; VoU represents the volume of active shared bicycle users since it is more representative of the number of users using shared bicycles, and the current number of VoU is 56.53 million [56]; VoB represents the volume of shared bicycle, and the current number of VoB is 23 million [3]; and Weeks represents the number of weeks during a shared bicycle’s life cycle, which is three years, 156 weeks in this scenario.

2.2.3. Impact Assessment

As an up-to-date LCA method, the ReCiPe method has been applied on modeling traveling behaviors [50,57]. The following mid-point indicators of the ReCiPe method are selected: Global warming potential (GWP, in kg CO2 eq), fossil depletion potential (FDP, in kg oil eq), freshwater ecotoxicity potential (FETP, in kg 1,4 DB eq), freshwater eutrophication potential (FEP, in kg P eq), human toxicity potential (HTP, in kg 1,4-DB eq), ionizing radiation potential (IRP, in kg U235 eq), marine ecotoxicity potential (METP, in kg 1,4-DCB-eq), marine eutrophication potential (MEP, in kg N-eq), metal depletion potential (MDP, in kg Fe eq), particulate matter formation potential (PMFP, in kg PM10-eq), and photochemical oxidant formation potential (POFP, in kg NMVOC). Three end-point ReCiPe indicators are selected, namely, ecosystem quality, human health, and resources. It is worth mentioning that the selected indicators measure the potential environmental impacts rather than the actual impacts.

2.2.4. Sensitivity Analysis

A sensitivity analysis is carried out to assess the fluctuations in LCA results by changing individual assumptions and parameter specifications [58]. In this study, the influences of the potential changes are investigated in the following four aspects: (1) the population structure, (2) the rental fee of shared bicycle, (3) the service life of shared bicycle, and (4) the volume of shared bicycle. The current situations of these four aspects are denoted as “base scenario”, which have been described in inventory analysis section and based on the current situation.
(1) Population structure
China is aging rapidly [59]. According to Szeto et al. [60], the traveling mode of elderly residents is quite different from that of young ones; aged groups favor shorter walking distance and more seat availability. In the analysis of this aspect, age structure is taken as an independent variable to explore the effect on the replaced mileages and LCA results. Based on the literature on behaviors and attitudes [61,62], this study assumes that the attitude of the same age group to the shared bicycle is unchanged. The population-age ratios of China from 2015-2035 are obtained from the report of United Nations Population Division (UNPD) [63], the current population-age ratio of shared bicycle users is obtained from the survey. The population-age ratio of shared bicycle users for the forthcoming years are calculated based on assumptions that the proportion of shared bicycle users in different age groups remain the same, which can be calculated using Equation (2). Table 2 shows the population-age ratios and the estimated ratios of shared bicycle users. By changing the population-age ratio of shared bicycle users, it will affect the mileages that shared bicycle instead of other traveling modes, namely ai in Equation (1), and we obtain the changed LCA results relative to that of the base scenario:
Population     age   ratio   in   2015 Population     age   ratio   in   N   year     = Population age   ratio   of   shared   bicycle   users   in   2015 Population age   ratio   of   shared   bicycle   users   in   N   year
where N is the year, and N can be 2020, 2025, 2030, or 2035. The population-age ratios of China from 2015–2035 are obtained from the report of UNPD 64, the current population-age ratio of shared bicycle users is obtained from the survey.
(2) The rental fee of shared bicycles
In this study we assume the rental fee and demand follow the principal of the demand curve [64]; in general, the quantity demanded for a commodity is low when its rental fee is high, and high when its rental fee is low. In February 2018, the rental fee of Mobike and OFO’s monthly card raised from 1 to 20 RMB [65], which may affect users’ decisions. Referring to commuting and driving elasticity coefficients [66,67], this paper assumes that the elasticity coefficient of shared bicycle price is 0.15, that is, when the rental fee of shared bicycle increases by 10%, the demand for shared bicycles decreases by 1.5% and the demand for other traveling modes increases by 1.5%. We explore the changes in LCA results relative to that of the base scenario when the range of rental fee variation is set between 80% and 120%.
(3) The service life of shared bicycles
The environmental friendliness of bicycle sharing depends on the environmental impact of its replacement process, which is related to its service life. Short service life may lead to insufficient environmental impact saved by the replacement process to offset the environmental impact of its production, maintenance, and recycling processes, while prolonged service life may lead to a greater maintenance rate, thus resulting in a poor user experience [68]. This study assumes that the change in the shared bicycle’s service life is positively related to the environmental impacts of maintaining a shared bicycle. We explore the changes in LCA results relative to that of the base scenario when the service life is set as a year (52 weeks), two years (104 weeks), and three years (156 weeks), four years (208 weeks), and five years (260 weeks).
(4) The volume of shared bicycles
The large-scale diffusion of bicycle sharing leads to low usage rate [69], cost inefficiency [70], and traffic congestion, but its impact on environmental performance has yet to be verified. A survey shows that the idle rate of shared bicycles is around 50% [71]. Hence, it is assumed that changing the volume of shared bicycle only affect the idle rate rather than usage. We explore the changes in LCA results relative to that of the base scenario when the volume of shared bicycles is set to 50%, 75%, 125%, and 150% of the current volume.

3. Results

3.1. Survey Results

After eliminating respondents under the age of 12 and non-shared bicycle users, the total number of returned questionnaires is 525. Excluding all foreign IP addresses, IPs from the cities where there are no shared bicycles and questionnaires with less than 15 s, the total number of valid questionnaires is 507; the availability rate is 97.3% with an average completion duration of 1 min. According to Leedy and Ormrod [72], sample size over 400 is acceptable for a large population even for national scale. The valid questionnaires cover 30 provinces, 109 cities of China. It is observed that the proportion of valid respondents is consistent with the users’ geographical distribution in different city categories [73], as shown in Table 3, indicating that the stratification of the questionnaire is valid and the questionnaire is representative.

3.1.1. Demographic Information

The socioeconomic characteristics of respondents is shown in Figure A1 in the Appendix A. Among the 507 effective questionnaires, there is a bias in the sample that toward female (59%), 12–24 years (70.36%), students (66.92%), and low income (0–3000 RMB per month) (64.63%) respondents. The characteristics of shared bicycle users in this survey are consistent with Wang’s survey results [74] and the survey results of Shaheen et al. [75], hence, we do not correct for the age bias. The demographic composition implies that young residents are more willing to complete the questionnaires. Figure 2 shows that 80.16% of respondents between 12–24 years are students, and 77.72% of this group are low-income earners.

3.1.2. Processes Replaced by Bicycle Sharing

The socioeconomic characteristics of the respondents are linked to the changes in their traveling modes, as shown in Figure 3. Figure 3a shows that shared bicycle is predominantly used to substitute walking and bus taking; this observation is consistent with the finding of Fishman et al. [76]. It is shown that the modal shift from taking private car/taxi, riding on electric bicycle, taking subway, and walking to shared bicycles between female and male users are similar, in general, but have some noticeable differences. Female users are more likely to replace buses with shared bicycles and less to replace their own bicycles. This can be explained by the fact that more males owned and used private bicycles before the introduction of bicycle sharing [60].
Figure 3b shows that the introduction of bicycle sharing has the greatest impact on respondents between 25–35 years, while for other age fractions, shared bicycle has little influences on their traveling behaviors. For the respondents between 46–55 years, the introduction of shared bicycles has less impact on their traveling modes of taking subway and riding electric bicycle; the observation is consistent with the findings of Szeto et al. [60]. For the respondents between 12–24 years, shared bicycles are mainly used to replace walking. This is due to the age group is generally consisted of students; their short-trip traveling destinations are generally either school or home, walking is the predominant traveling means of these respondents [77]. For the respondents between 25–35 years, shared bicycle replaces subway at a higher frequency. This can be explained that people of this age group are most likely to be office workers, and subway is their favored traveling mean [78]. Similarly, bicycle sharing has a moderate impact on the traveling modes of the respondents between 36–45 years, as their traveling modes have been affected to a similar extent.
Figure 3c shows that traveling mode shift for lower income earners (0–3000 RMB per month) is mainly from bus taking or walking to riding shared bicycle, whilst higher income respondents (6000–9000 RMB per month) substituted more car/taxi trips than the lower income ones, and their major substituted modes are still bus, walking, and private bicycles. The differences in the original traveling modes of people with different income levels can be explained by Fishman et al. [76]; higher income earners tend to choose faster and more comfortable traveling means.
The results of this survey that the mileages of using shared bicycle to replace other four traveling means per week of different age groups, is shown in Table 4. The results suggest that bicycle sharing affects all travel modes, consistent with Shaheen’s survey [75]. We calculate the replaced mileages of four traveling means according to age-level, and then multiply by the corresponding population-age ratio of shared bicycle users (Figure 2b) to get an average mileage of general population, that is, α i in Equation (1).

3.1.3. Attitudes toward Bicycles Sharing

As shown in Figure 4a, 72.19% of respondents can easily find a shared bicycle when they need, while 19.62% of respondents could find a shared bicycle all the time, indicating that the supply of shared bicycle is basically sufficient in the opinion of most respondents. Figure 4b shows that 47.81% of respondents believe that the volume of shared bicycle is suitable, while 27.81% of respondents thought that there are already are too many shared bicycles. Most of the respondents (83.11%) expressed their willingness towards using shared bicycles (Figure 4d), regardless whether they think of the number of existing shared bicycles is sufficient. The quantitative impacts of increased the number of shared bicycles needs to be further explored.

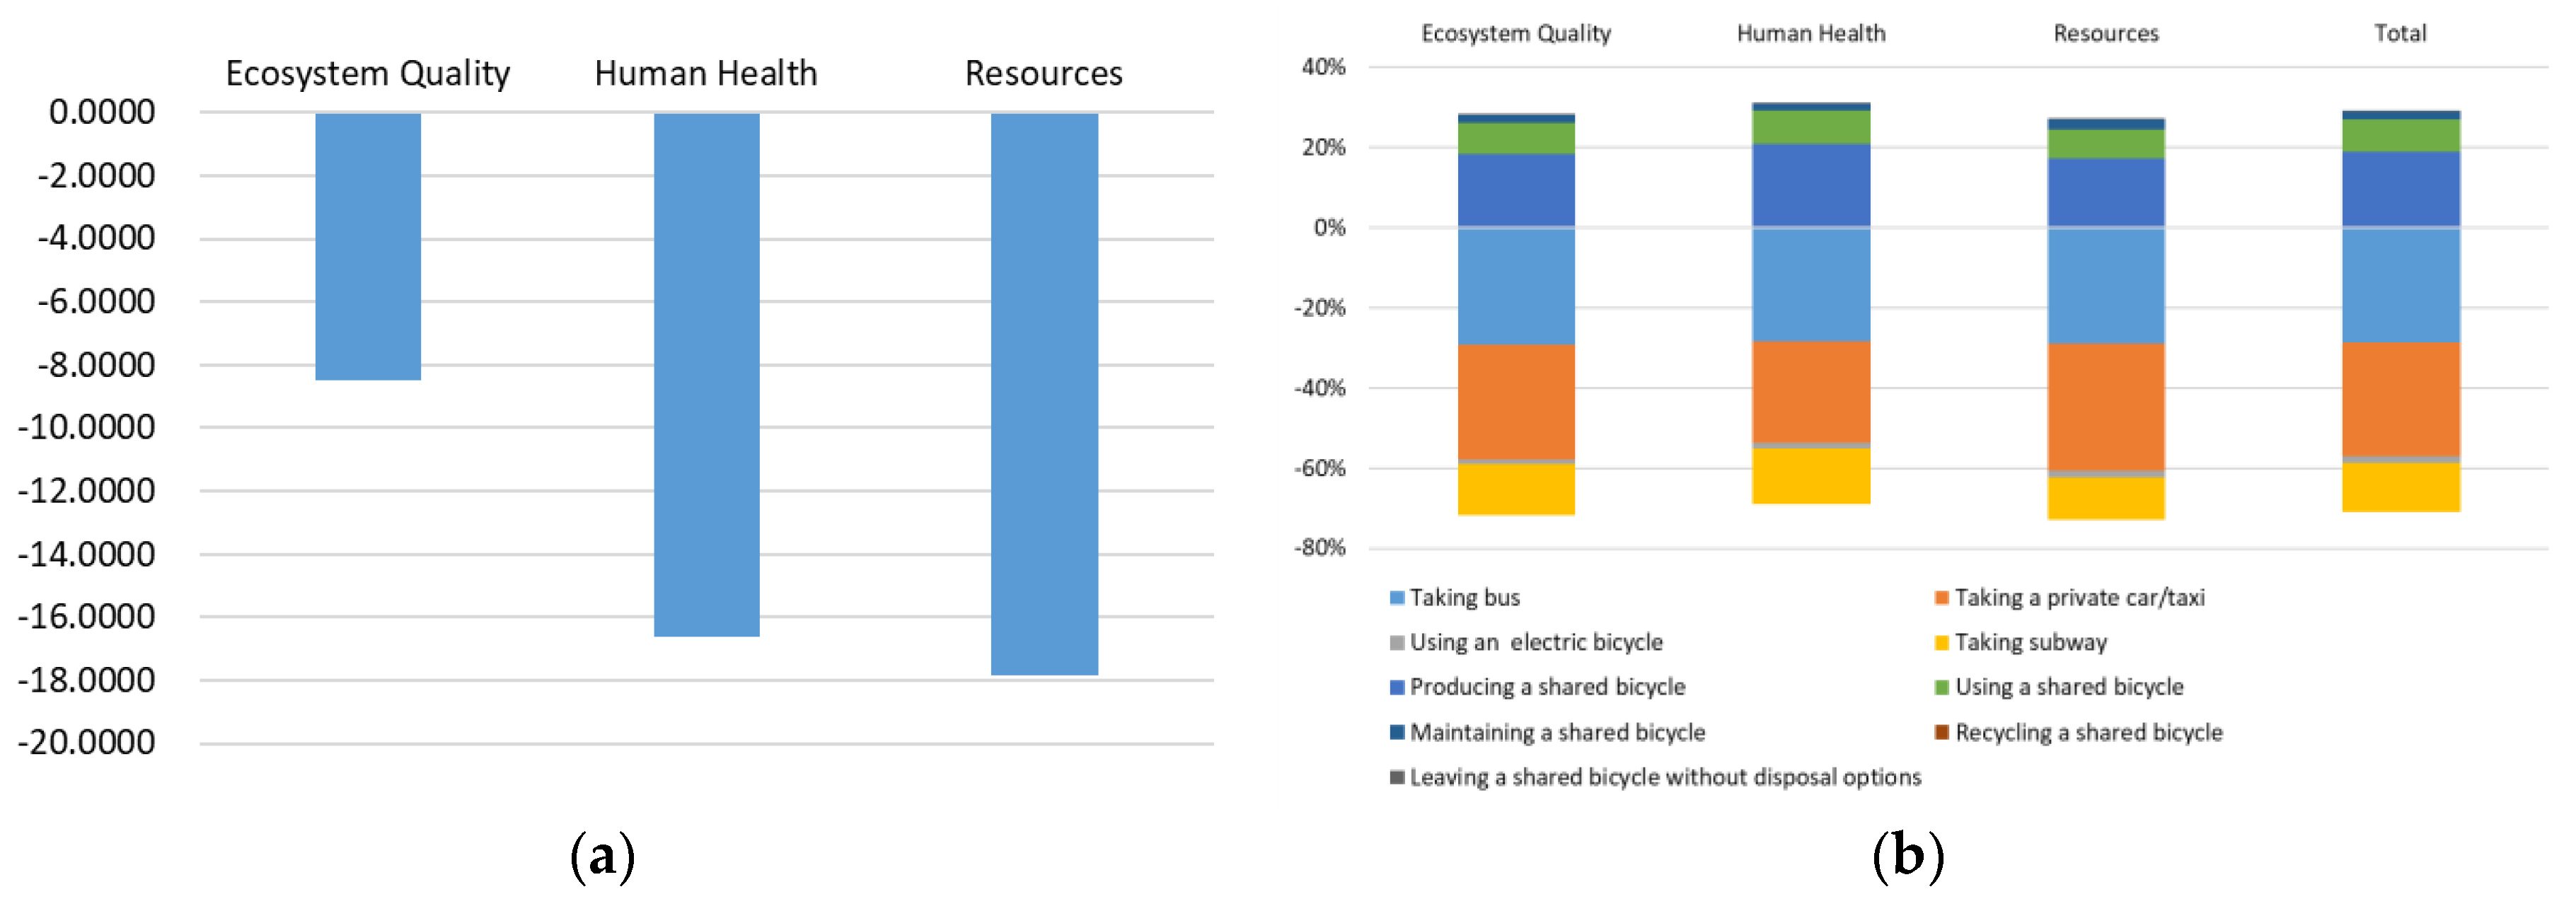
3.2. Results of Life Cycle Assessment

Table 5 shows the mid-point LCA results of shared bicycle. The value of the selected eleven impact categories, except MDP, are negative, indicating that the environmental savings of using shared bicycles are sufficient to offset the environmental impacts of shared bicycles arising from their entire life cycles. This work partially quantitatively proves the assertion of Caggiani et al. [9], which regards shared bicycles as a sustainable carbon-free mode of transportation, and deem it can significantly reduce pollution. However, the results show that bicycle sharing is environmental unfavorable in terms of metal depletion.
Compared to the original traveling modes, the environmental savings of one bicycle sharing are 383.9922 kg CO2 eq, 150.4658 kg oil eq, 79.1909 kg 1,4-DB eq, and 2.5644 kg Fe eq during its life cycle. The CO2 savings are equivalent to 52.08 kg per bicycle sharing user per year. However, in the work of Zhang and Mi [15], bicycle sharing in Hongkou district, Shanghai resulted in a decrease of 2.9 kg CO2 emissions per resident in 2016. The gap between these results is quite significant, and it can be explained by the following three reasons. First, the research scopes are different: only users of shared bicycles are included in this work, while the work of Zhang and Mi [15] covered all residents in Hongkou district, Shanghai, including both bicycle sharing users and non-users. Second, Zhang and Mi [15] only considered that shared bicycles are used to replace taxis, while this study tends to include all traveling means that can be replaced by the use of shared bicycles, such as subway and bus-taking. Third, the frequency of shared bicycle use is increasing.
The decomposition of the LCA results into the processes that belong to the studied system is displayed in Figure 5a. It shows that the environment impacts of each traveling process can be ranked in a descending order: taking a private car/taxi and bus, taking subway, using a shared bicycle, and using an electric bicycle. This result is inconsistent with the sequence of traveling means ranked according to annual greenhouse gas emissions [79]; the order was: car taking, bus-taking, and subway-taking. The reason behind this difference lies in the different coverages of the two works; this study explores the travel of Chinese residents of all ages, while Czepkiewicz et al. [79] studied the travelling behaviors of Dutch residents aged 25-40. People of different ages in different regions might have distinctively different traveling patterns. This order proposed in this work indicates that replacing buses and private car/taxi by shared bicycles can bring are more environmental benefits, mainly attributing to the longer distances traveled by these means, see Table 4.
In Figure 5b, the LCA results are displayed according to the individual processes that belong to each life cycle of shared bicycle. It is shown that the overall life cycle of shared bicycles is a burden to the environment, and the producing process accounts for almost 50% of the overall normalized impact values. This is probably due to the consumption of 7.53 kg aluminum and 6.49 kg steel. The environmental impacts of the recycling process are minor but yet positive, because the recycling process does not include the reuse of recycled materials. Remarkably, the environmental impact of leaving a shared bicycle without disposal options is nearly ten times that of the recycling process, although they make up a small proportion of the entire cycle of a shared bicycle. However, it is necessary to increase the recycling rate of shared bicycles since it is significant for the sum of 23 million vehicles, although increasing the recycling rate has little impact on the life cycle environmental impact of one bicycle.
Figure 5c,d shows that the LCA results are displayed according to age. It’s interesting to note that the contribution of users between 12–24 years to the bicycle sharing’s environmental friendliness is less than that of users between 25–35 years and 36–45 years, although the number of users between 12–24 years is the highest. Combined with Table 4, users between 25–35 years have the highest average mileages using shared bicycles to replace other traveling means, followed by those between 36–45 years. This shows that opening up the 25–35 year old user market and increasing its user stickiness would bring more environmental benefits to bicycle sharing.
The end-point environmental impacts of all studied processes are displayed in Figure 6. Figure 6a shows that compared to the original traveling modes, using shared bicycles can improve 8.46 points in term of ecological quality, 16.60 points in human health, saves 17.84 points in resources, and brings a total of 42.90 points of environmental benefits through the life cycle of a shared bicycle. In Figure 6b, the descending order of environmental impact of each process in the end-point results are consistent with those of mid-point results in Figure 5a. The results suggest that replacing electric bicycles by shared bicycles would not bring noticeable environmental benefits. Reducing the impacts from the production and using process can significantly diminish the overall life cycle environmental impacts of shared bicycles.

3.3. Results of Sensitivity Analysis

By adjusting the assumptions of input parameters according to Section 2.2.4, the percentage changes of LCA results relative to the base scenario are obtained, which are shown in Figure 7. The results of sensitivity analysis show that the increases in the aged population, rental fee rising, and volume of shared bicycles increasing would impart negative impacts on the environmental performance, while prolonging the service life has a positive impact on the overall environmental performance.
The processes affected by selected sensitivity factors are sorted into two categories: one is the usage of various traveling modes, assuming the sum of these traveling processes’ environmental impacts is k; the other is the producing, maintaining and recycling shared bicycles, assuming the sum of these life cycle processes’ environmental impacts is b. The four studied variables impart their most significant impacts on the category of MDP, where the ratio of k to b is close to −1. For the other ten categories, the ratio of k to b is between −8 to −2. In other words, the values of MDP are more sensitive to the changes in the selected factors.

3.3.1. Effects of Population Structure

It can be seen from Figure 7a that the environmental benefits of all the categories decrease with the aging population. This is attributed to that older residents use bicycles at a much lower frequency; as the proportion of older residents increases, the replaced mileages will decrease. Figure 7a shows that from 2015 to 2035, the values of all the categories except MDP will drop by 12.12%, 3.17%, −0.31%, and 2.88% relative to the LCA results of the base scenario from the previous period, and the value of MDP would be decreased by an average extent of 87.05%, 26.23%, 0.87%, and 28.75% of the base scenario. The fastest decreases of the environmental benefits during 2015–2020 can be attributed to the rapid decline in the proportion of residents aged 12–24, who are the major users of shared bicycles. The results indicate that the aging population is negative for the environmental benefits of shared bicycles. Combining the results presented in Section 3.2., increasing the number and stickiness of users aged 25–45 can offset the negative impact of aging to some extent.

3.3.2. Effects of Rental Fees

Figure 7b shows that the environmental benefits would be decreased with the increasing rental fee. It is for this reason that higher rental fees will lead to fewer users, and the mileages of other traveling means that are replaced by shared bicycles will be reduced, resulting in lower environmental benefits. In terms of the 10 categories other than MDP, every 10% increase in the rental fee would reduce the environmental benefits by 2.40% relative to those of the base scenario. For MDP, every 10% increase in the rental fee reduces the value of MDP by 18.61% relative to the LCA results of the base scenario; the negative correlation is much more significant than the other 10 indicators. This section shows that raising the rental fee has little impacts on the environment but will undoubtedly increase the income.

3.3.3. Effects of Service Life

Figure 7c shows that the longer service life of shared bicycles generally brings more categorized environmental benefits, due to that the increased replaced mileages. When the service life of shared bicycles is one year (52 weeks), most of the selected factors, such as FETP, FEP, HTP, and METP, have positive environmental impact values, indicating that bicycle sharing is environmentally unfriendly. When the service life of shared bicycle is assumed to be two years (104 weeks), the environmental impacts of all categories except MDP are negative, indicating that bicycle sharing is environmentally favorable when the service life is two years. Bicycle sharing is an environmental practice in terms of metal consumption, provided that the service life of a shared bicycle is no less than four years (208 weeks). However, the MTC stipulates that shared bicycles must be scrapped for three years [80].

3.3.4. Effects of Volume

It can be seen from Figure 7d that a decrease in the volume of shared bicycles generally brings more categorized environmental benefits. This is attributed to the idea that the reduction of idle shared bicycles will not affect people’s travel choices; it greatly reduces the environmental impact caused by the production of shared bicycles. The changes in the environmental benefits become increasingly obvious when the volume of shared bicycles is reduced from 150% to 50%. In particular, the environmental benefits are basically increased by 100% when the quantity drops from 75% to 50%. This suggests that reducing the current volume of shared bicycles can lead to significant environmental improvements. When the volume of shared bicycles is assumed to be 75% of the current volume, the environmental impacts of all categories are negative; the use of shared bicycles is still an environmentally friendly traveling mode.

4. Discussion

To maximize the environmental benefits of sharing bicycles, recommendations for business practitioners and administrators are proposed as follows:
For business practitioners, first, the use of environmentally-friendly materials in shared bicycles should be encouraged. The LCA results show that a significant proportion of the environmental impacts of shared bicycles are attributed to the materials used (Section 3.2). Therefore, the use of more environmentally friendly materials can be a feasible measure to further reduce the environmental burdens. Currently, bicycle sharing companies are taking actions to adopt more environmental materials in their bicycles. Mobike, for example, changed to the body of shared bicycles from 25 kg of aluminum to 18 kg of steel [81]. According to the EI databases, this change in material and weight reduces 0.91 kg CO2 eq, 0.47 kg 1,4-DB eq, and 0.02 kg Fe eq. Second, bicycle sharing enterprises can relieve their financial pressure by appropriately increasing rent fee, without impart any significant impacts on the overall life cycle environmental performance. Third, business practitioners can achieve greater environmental benefits by encouraging young customers to use shared bicycles for long distances and tapping into potential customers aged 25–45. Various methods of making bicycle sharing more available can be found in Gleason’s report [82] and Nair’s report [83].
For administrator, first, the implementation of legislative measures such as Extended Producer Responsibility (EPR) should be supervised. EPR requires a throughout life cycle management of products or services, a regulatory measure that has been proposed in many countries [84]. According to the results that are presented in Section 3.2, without recycling, the environmental burdens would be significantly increased. Second, the administrator needs to control the volume of shared bicycles. Bicycle sharing companies and their venture capitalists believe in a winner-takes-all model [85,86], therefore, they always oversupply shared bicycles without bearing any necessary administrative costs, significantly reducing the environmental benefits of bicycle sharing. The administrator should set up a proper range for the number of available shared bicycles [87] to reduce the environmental impacts and the administrative expenses simultaneously.

5. Conclusions

To seek the answer to the question of “whether the bicycle sharing is an environmental practice”, this study obtains the changes in traveling modes after the introduction of bicycle sharing through a questionnaire-based online survey. The LCA results confirm that bicycle sharing is an environment practice in ten selected ReCiPe impact categories, except MDP, at the mid-point level and the end-point level; 80% of the environment savings are associated with the replaced traveling processes of taking bus and private car or taxi attributing to the longer distances. Recycling would also alleviate the environmental burdens of shared bicycles. The sensitivity analysis suggests that bicycle sharing enterprises should increase the attraction and stickiness to people aged 25–45, because these users bring more environmental benefits than younger generation due to higher average mileages using shared bicycles to replace other traveling means. The results imply that the increase the rental fees can ensure the sustainability of economic performance without compromising the overall environmental performance. Further, the service life of shared bicycle should more than two year, to ensure the environmental friendliness of this emerging “sustainable” traveling mode. Moreover, reducing the current volume of shared bicycle by half can lead to significant environmental improvements.
Future research can be carried out in accordance with the following directions. First, new methods can be employed to acquire shared bicycle users’ detailed traveling behaviors, offering a more comprehensive view that includes all urban traveling means. Another aspect of interest is to combine the economic and environmental data to quantitatively analyze its equilibrium status and influencing factors. The models should also consider quantitative indicators, such as the volume of shared bicycles on usage in future study efforts.

Author Contributions

Conceptualization, F.G., J.G. and F.Z.; Data curation, W.Z.; Formal analysis, F.Z. and W.Z.; Funding acquisition, J.G.; Investigation, F.Z.; Methodology, F.G.; Project administration, F.G.; Software, W.Z.; Supervision, J.G.; Visualization, W.Z.; Writing—original draft, F.Z. and F.G.; Writing—review & editing, F.G.

Funding

This research received no external funding.

Acknowledgments

This research was funded by Chinese Key Research Plan Project (2017YFB1400302), National Natural Science Foundation of China (nos. 71832013, 71671180, 71834006 and 51775493), and Fundamental Research Funds for the Central Universities (no. 2018QNA4007). And the APC was funded by Chinese Key Research Plan Project (2017YFB1400302).

Conflicts of Interest

The author declares no conflict of interest.

Nomenclature

Abbreviations
EIEco-Invent
EPRExtended Producer Responsibility
FDPFossil Depletion Potential
FEPFreshwater Eutrophication Potential
FETPFreshwater Ecotoxicity Potential
FUFunctional unit
GWPGlobal Warming Potential
HTPHuman Toxicity Potential
IPInternet Protocol
IRPIonizing Radiation Potential
LCALife Cycle Assessment
LCILife Cycle Inventory
LCIALife Cycle Impact Assessment
MDPMetal Depletion Potential
MEPMarine Eutrophication Potential
METPMarine Ecotoxicity Potential
MOTMinistry of transport of the residents’ republic of China.
NACTONational association of city transportation officials
PMFPParticulate Matter Formation Potential
POFPPhotochemical Oxidant Formation Potential
PSSProduct service system
SICState Information Center
UNPDUnited Nations Population Division
Symbols
aiThe mileages of one user each week that shared bicycle instead of other traveling modes, which can be obtained by questionnaire, and the median value of the questionnaire option interval serves as the alternative mileage in this case; i can be 1, 2, 3, 4 representing bus, private car/taxi, electric bicycle, or subway, respectively.
BThe environmental impacts associated with the whole life cycle of a shared bicycle.
FThe reduced environmental impacts associated with replacing other traveling means with shared bicycles.
fiThe environment impacts of the corresponding traveling modes that are replaced by bicycle sharing.
MaintThe environment impacts arising from the maintenance of a shared bicycle, which can be obtained from EI dataset.
NThe year, it can be 2020, 2025, 2030, 2035.
NoDThe environment impacts arising from leaving a shared bicycle without disposal options.
ProThe environment impacts arising from the production of a shared bicycle, which can be obtained from EI dataset.
RidThe environment impacts arising from the use of a shared bicycle of one kilometer, which can be obtained from EI dataset.
RecThe environment impacts arising from the recycling of a shared bicycle, which can be obtained from EI dataset.
SThe mid- or end-level indicators.
VoBThe volume of shared bicycle, and the current number of VoB is 23 million [3].
VoUThe volume of active shared bicycle users since it is more representative of the number of users using shared bicycles, and the current number of VoU is 56.53 million [57].
WeeksThe number of weeks during a shared bicycle’s life cycle, which is three years, 156 weeks in this scenario

Appendix A. Supplementary Data and Results

Figure A1. Socioeconomic characteristics of respondents: (a) gender, (b) age, (c) income level (RMB per month), and (d) occupation.
Sustainability 11 01550 g0a1
Table A1. The online questionnaire—the influence of the appearance of shared bicycles on residents’ traveling modes.
SegmentsQuestionsOptions
Socio-economic (demographic) informationGender(a) Male
(b) Female
Age(a) 12–24
(b) 25–35
(c) 36–45
(d) 46–55
(e) >56
Occupation(a) Students
(b) Enterprise Employees
(c) Freelancer
(d) Other
Income level (RMB per month)(a) <3000
(b) 3000–6000
(c) 6000–9000
(d) >9000
(e) If convenient, please fill in___
The traveling mode replaced by bicycle sharingWhat kinds of traveling mode has been replaced by the introduction of bicycle sharing?(a) Bus
(b) Subway
(c) Private car/taxi
(d) Electric bicycle
(e) Private bicycle
(f) On foot
The total number of bus stations replaced by bicycle sharing per week:(a) 1–10 stops
(b) 11–20 stops
(c) 21–30 stops
(d) >30 stops
(e) If remember, please fill in___
The total number of subway stations replaced by bicycle sharing per week:(a) 1–10 stops
(b) 11–20 stops
(c) 21–30 stops
(d) >30 stops
(e) If remember, please fill in___
The total mileage of private car/taxi replaced by bicycle sharing per week:(a)1–10 km
(b) 11–20 km
(c) 21–30 km
(d) >30 km
(e) If remember, please fill in___
The total mileage of electric bicycle replaced by bicycle sharing per week:(a) 1–5 km
(b) 6–10 km
(c) 11–15 km
(d) 16–20 km
(e) If remember, please fill in___
The total mileage of private bicycle replaced by bicycle sharing per week:(a) 1–5 km
(b) 6–10 km
(c) 11–15 km
(d) 16–20 km
(e) If remember, please fill in___
The total walking steps replaced by bicycle sharing daily:(a) 0–5000 steps
(b) 5001–10,000 steps
(c) 10,001–15,000 steps
(d) >15,001 steps
(e) If remember, please fill in___
The perception, attitude, and behaviors towards the bicycle sharingCan you find a shared bicycle every time you want to ride a bicycle?(a) Rarely or never
(b) Quite often
(c) All the time
What do you think of the volume of shared bicycle in your city?(a) Too few
(b) Suitable
(c) Too much
If increase the volume of shared bicycle, would you prefer to choose it to travel?(a) Yes, I will
(b) No, I won’t
Table A2. The inputs from the technosphere of the process.
ProcessInputs from the Technosphere/Inputs from the Technosphere, Wastes *Amount
Producing a shared bicycleInputs from the technospherealuminum, wrought alloy7.53 kg
chromium steel removed by turning, average, conventional0.159 kg
electricity, medium voltage6.89 kWh
heat, district or industrial, natural gas13.6 MJ
heat, district or industrial, other than natural gas0.193 MJ
injection molding1.96 kg
polyethylene, high density, granulate1.96 kg
polyurethane, flexible foa0.03 kg
powder coat, aluminum sheet0.35 m2
road vehicle factory9.37E-10 unit
section bar extrusion, aluminum3.77 kg
steel, chromium steel 18/8, hot rolled1.59 kg
steel, low-alloyed, hot rolled4.9 kg
synthetic rubber0.563 kg
tap water0.744 kg
welding, arc, aluminum0.75 m
wire drawing, steel0.338 kg
Inputs from the technosphere, wastesmunicipal solid waste−4.5 kg
used bicycle−1.0 unit
wastewateraverage −7.44E-04 m3
Using a shared bicycleInputs from the technospherebicycle6.67E-05 unit
road4.92e-5 m × year
Maintaining a shared bicycleInputs from the technospherealuminum alloy, AlMg30.377 kg
chromium steel removed by turning, average, conventional0.228 kg
injection molding0.979 kg
polyethylene, high density, granulate0.979 kg
polyurethane, flexible foam0.03 kg
section bar extrusion, aluminum0.377 kg
steel, low-alloyed, hot rolled0.228 kg
synthetic rubber1.69 kg
tap water0.0744 kg
Inputs from the technosphere, wasteswaste plastic, mixture−1.01 kg
waste rubber, unspecified−0.844 kg
Recycling a shared bicycleInputs from the technospherewaste plastic, mixture−1.99 kg
waste rubber, unspecified−0.281 kg
Leaving a shared bicycle without disposal optionsInputs from the technospherealuminum treatment of waste aluminum, sanitary landfill7.53 kg
Steel treatment of scrap steel, inert material landfill6.987 kg
Polyethylene treatment of waste polyethylene, sanitary landfill1.96 kg
Polyurethane treatment of waste polyurethane, sanitary landfill0.03 kg
Synthetic rubber treatment of waste rubber, unspecified, municipal incineration0.563 kg
Taking bus (fuel)Inputs from the technospherebus7.14E-08 unit
diesel, low-sulfur0.025 kg
maintenance, bus 7.14E-08 unit
road 4.57e-4 m × year4.57E-06 m × year
Emissions to airAcetaldehyde2.99E-06 kg
Ammonia 3.57E-07 kg
Benzene 2.15E-07 kg
Cadmium 2.65E-10 kg
Carbon dioxide, fossil0.0789 kg
Carbon monoxide, fossil2.30E-04 kg
Chromium 1.66E-09 kg
Chromium VI 2.50E-12 kg
Copper 7.04E-08 kg
Dinitrogen monoxide 9.44E-07 kg
Formaldehyde 5.50E-06 kg
Lead 2.02E-09 kg
Mercury5.00E-13 kg
Methane, fossil 1.61E-06 kg
NMVOC, non-methane volatile organic compounds, unspecified origin 5.35E-05 kg
Nickel 2.11E-09 kg
Nitrogen oxides 9.17E-04 kg
PAH, polycyclic aromatic hydrocarbons 2.86E-11 kg
Particulates, <2.5 μm 3.17E-05 kg
Particulates, >10 μm4.05E-06 kg
Particulates, >2.5 μm, and <10 μm 4.40E-06 kg
Selenium 2.50E-10 kg
Sulfur dioxide2.50E-06 kg
Toluene 1.12E-06 kg
Xylene 5.37E-07 kg
Zinc 5.32E-08 kg
Emissions to waterCadmium, ion 1.27E-10 kg
Chromium, ion 6.05E-10 kg
Copper, ion 8.50E-09 kg
Lead 5.22E-09 kg
Nickel, ion 1.64E-09 kg
Zinc, ion 3.58E-07 kg
Emissions to soilCadmium 1.27E-10 kg
Chromium 6.05E-10 kg
Copper 8.50E-10 kg
Lead 5.22E-09 kg
Nickel 1.64E-09 kg
Zinc 3.58E-07 kg
Taking bus (electricity)Inputs from the technospherebus 5.03E-08 unit
electricity, medium voltage 0.117 kWh
maintenance, bus 5.03E-08 unit
road5.30E-04 m × year
Emissions to airCadmium1.62E-10 kg
Chromium 1.46E-09 kg
Chromium VI 2.91E-12 kg
Copper 2.43E-09 kg
Ethane, 1,1,1,2-tetrafluoro-, HFC-134a 4.81E-07 kg
Lead 8.09E-10 kg
Nickel 1.30E-09 kg
Particulates, <2.5 μm 1.15E-06 kg
Particulates, >10 μm 1.63E-05 kg
Particulates, >2.5 μm, and <10 μm 2.73E-06 kg
Zinc 1.30E-07 kg
Emissions to waterCadmium, ion 1.69E-10 kg
Chromium, ion 1.52E-09 kg
Copper, ion 2.54E-09 kg
Lead 8.47E-10 kg
Nickel, ion1.36E-09 kg
Zinc, ion 1.36E-07 kg
Emissions to soilCadmium 1.69E-10 kg
Chromium 1.52E-09 kg
Copper 2.54E-09 kg
Lead 8.47E-10 kg
Nickel 1.36E-09 kg
Zinc 1.36E-07 kg
Table A3. City category (note: CBN 35).
City CategoryCities (Note: CBN, 2018)
First-tier cities and new first-tier citiesShanghai, Beijing, Shenzhen, Guangzhou, Chengdu, Hangzhou, Chongqing, Wuhan, Suzhou, Xi’an, Tianjin, Nanjing, Zhengzhou, Changsha, Shenyang, Qingdao, Ningbo, Dongguan, Wuxi
Second-tier citiesFoshan, Hefei, Kunming, Dalian, Xiamen, Fuzhou, Harbin, Jinan, Wenzhou, Changchun, Shijiazhuang, Changzhou, Quanzhou, Nanning, Guiyang, Nanchang, Nantong, Jinhua, Xuzhou, Taiyuan, Jiaxing, Yantai, Huizhou, Baoding, Taizhou, Zhongshan, Shaoxing, Urumqi, Weifang, Lanzhou
OthersAnkang, Anqing, Anyang, Anshan, Baoji, Benxi, Binzhou, Chengde, Zhangzhou, Datong, Dongying, Fushun, Fuxin, Zhangzhou, Guilin, Haikou, Hechi, Hegang, Huzhou, Huludao, Huaihua, Huai’an, Huangshi, Jiamusi, Jinzhong, Langfang, Leshan, Liaoyang, Linyi, Liuzhou, Luoyang, Meishan, Nanyang, Pingdingshan, Qinhuangdao, Sanya, Shantou, Shangqiu, Shangrao, Shaoguan, Shuangyashan, Zhangzhou, Siping, Tangshan, Xiangyang, Xinyang, Xuchang, Ya’an, Yancheng, Yangzhou, Yangquan, Yichang, Yinchuan, Yulin, Zhangjiakou, Zhenjiang, Zhoukou, Zhuhai, Zhumadian, Zunyi

References

  1. Haider, Z.; Nikolaev, A.; Kang, J.E.; Kwon, C. Inventory rebalancing through pricing in public bicycle sharing systems. Eur. J. Oper. Res. 2018, 270, 103–117. [Google Scholar] [CrossRef]
  2. Bike Share Map. 2018. Available online: http://bikes.oobrien.com/ (accessed on 29 July 2018).
  3. Ministry of Transport of the People’s Republic of China. More Than 23 Million Bicycles Have Been Invested. 2018. Available online: http://www.ec.com.cn/article/otoo/201802/256741.html (accessed on 29 July 2018).
  4. State Information Center (SIC). The Research Report on Bike-sharing Employment. 2017. Available online: http://www.sic.gov.cn/News/568/8452.htm (accessed on 29 July 2018).
  5. Fu, Q. New Sharing, New Future. 2017. Available online: http://www.sohu.com/a/166139825_114885 (accessed on 29 July 2018).
  6. SOHU. OFO Financed 866 M USD, Setting A Record for the Single Highest Financing of the Shared Bicycle Industry. 2018. Available online: http://www.sohu.com/a/225415142_163726 (accessed on 29 July 2018).
  7. National Association of City Transportation Officials (NACTO). Releases Updated Nationwide Bike Share Ridership Data. 2016. Available online: https://nacto.org/2018/05/01/nacto-releases-updated-nationwide-bike-share-ridership-data/ (accessed on 29 July 2018).
  8. CKXX. Japanese Media Look at China’s “Bicycle Graveyard”: Fierce Competition Leads to Bicycle Surplus. 2018. Available online: http://www.cankaoxiaoxi.com/china/20180620/2282214.shtml (accessed on 29 July 2018).
  9. Caggiani, L.; Camporeale, R.; Ottomanelli, M.; Szeto, W.Y. A modeling framework for the dynamic management of free-floating bicycle-sharing systems. Transp. Res. Part C 2018, 87, 159–182. [Google Scholar] [CrossRef]
  10. Shaheen, S.A.; Guzman, S.; Zhang, H. Bicyclesharing in Europe, the Americas, and Asia: Past, Present, and Future. Transp. Res. Rec. J. Transp. Res. Board 2010, 2143, 159–167. [Google Scholar] [CrossRef]
  11. Otero, I.; Nieuwenhuijsen, M.J.; Rojas-Rueda, D. Health impacts of bicycle sharing systems in Europe. Environ. Int. 2018, 115, 387–394. [Google Scholar] [CrossRef] [PubMed]
  12. Cohen, A.; Shaheen, S. Planning for Shared Mobility. 2016. Available online: https://www.planning.org/publications/report/9107556/ (accessed on 29 July 2018).
  13. Amaya, J.; Lelah, A.; Zwolinski, P. Environmental benefits of PSS strategies: A bicycle sharing system case study. In Proceedings of the 4th CIRP International Conference on Industrial Product-Service Systems, Bochum, Germany, 14–15 March 2013; pp. 339–344. [Google Scholar]
  14. Piramuthu, O.B.; Zhou, W. Bicycle Sharing, social media, and environmental sustainability. In Proceedings of the 49th Hawaii International Conference on System Sciences, Koloa, HI, USA, 5–8 January 2016; pp. 2078–2083. [Google Scholar]
  15. Zhang, Y.; Mi, Z. Environmental benefits of bicycle sharing: A big data-based analysis. Appl. Energy 2018, 220, 296–301. [Google Scholar] [CrossRef]
  16. Geng, J.; Long, R.; Chen, H.; Li, W. Exploring the motivation-behavior gap in urban residents’ green travel behavior: A theoretical and empirical study. Resour. Conserv. Recycl. 2017, 125, 282–292. [Google Scholar] [CrossRef]
  17. Yang, Y.; Wang, C.; Liu, W.; Zhou, P. Understanding the determinants of travel mode choice of residents and its carbon mitigation potential. Energy Policy 2018, 115, 486–493. [Google Scholar] [CrossRef]
  18. Meeker, M. Internet Trends 2017. 2017. Available online: http://www.kpcb.com/internet-trends (accessed on 29 July 2018).
  19. Böcker, L.; Meelen, T. Sharing for people, planet or profit? Analyzing motivations for intended sharing economy participation. Environ. Innov. Soc. Transit. 2016, 23, 28–39. [Google Scholar] [CrossRef]
  20. Wang, K.; Akar, G.; Chen, Y.J. Bike sharing differences among Millennials, Gen Xers, and Baby Boomers: Lessons learnt from New York City’s bike share. Transp. Res. Part A 2018, 116, 1–14. [Google Scholar] [CrossRef]
  21. Yang, Y.; Wang, C.; Liu, W. Urban daily travel carbon emissions accounting and mitigation potential analysis using surveyed individual data. J. Clean. Prod. 2018, 192, 821–834. [Google Scholar] [CrossRef]
  22. Kate, H.; Daniel, F.; Scott, A.L. Evaluation of the impact of a public Bicycle Share Program on population bicycling in Vancouver. Prev. Med. Rep. 2018, 12, 176–181. [Google Scholar] [CrossRef]
  23. Yingnan, J.; Fu, H. Association between innovative dockless bicycle sharing programs and adopting cycling in commuting and non-commuting trips. Transp. Res. Part A 2019, 121, 12–21. [Google Scholar] [CrossRef]
  24. Borecki, N.; Darren, B.; Payton, C.; Patricia, H.; Nicholas, K.; Tim, M.; Bradley, R.; Paola, R.; Matthew, S.; Casey, S.; et al. Virginia Tech Capital Bikeshare Study. 2012. Available online: https://ralphbu.files.wordpress.com/2012/01/vt-bike-share-study -final3.pdf (accessed on 29 July 2018).
  25. Ru, X.; Wang, S.; Chen, Q.; Yan, S. Exploring the interaction effects of norms and attitudes on green travel intention: An empirical study in eastern China. J. Clean. Prod. 2018, 197, 1317–1327. [Google Scholar] [CrossRef]
  26. Richardson, J.T.E. Reliability and replicability of the approaches to studying questionnaire. Stud. High. Educ. 1990, 15, 155–168. [Google Scholar] [CrossRef]
  27. Bachand-Marleau, J.; Lee, B.H.Y.; El-Geneidy, A.M. Better understanding of factors influencing likelihood of using shared bicycle systems and frequency of use. Transp. Res. Rec. J. Transp. Res. Board 2012, 2314, 66–71. [Google Scholar] [CrossRef]
  28. Castillo-Manzano, J.I.; Castro-Nuño, M.; López-Valpuesta, L. Analyzing the transition from a public bicycle system to bicycle ownership: A complex relationship. Transp. Res. Part D 2015, 38, 15–26. [Google Scholar] [CrossRef]
  29. Zhang, Y.; Brussel, M.J.G.; Thomas, T.; Maarseveen, M.F.A.M. Mining bicycle-sharing travel behavior data: An investigation into trip chains and transition activities. Comput. Environ. Urban Syst. 2018, 69, 39–50. [Google Scholar] [CrossRef]
  30. Zhang, X.C.; Kuchinke, L.; Woud, M.L.; Velten, J.; Margarf, J. Survey method matters: Online/offline questionnaires and face-to-face or telephone interviews differ. Comput. Hum. Behav. 2017, 71, 172–180. [Google Scholar] [CrossRef]
  31. Statista. Most Popular Mobile Messaging Apps Worldwide as of April 2018, Based on Number of Monthly Active Users (In Millions). 2018. Available online: https://www.statista.com/statistics/258749/most-popular-global-mobile-messenger-apps/ (accessed on 29 July 2018).
  32. MOT. Guidelines on Encouraging and Regulating the Development of Internet Rental Bicycles. 2018. Available online: http://www.mot.gov.cn/zxft2017/yss_0803/ (accessed on 29 July 2018).
  33. Kong, Y.; Seo, Y.S.; Zhai, L. Comparison of reading performance on screen and on paper: A meta-analysis. Comput. Educ. 2018, 123, 138–149. [Google Scholar] [CrossRef]
  34. Gu, F.; Guo, J.; Yao, X.; Summers, P.A.; Widijatmoko, S.D.; Hall, P. An investigation of the current status of recycling spent lithium-ion batteries from consumer electronics in China. J. Clean. Prod. 2017, 161, 765–780. [Google Scholar] [CrossRef]
  35. CBN. China’s Urban Business Glamour Ranking 2018. 2018. Available online: https://www.yicai.com/ (accessed on 29 July 2018).
  36. CAICT. China Shared Cycle Industry Development Report. 2018. Available online: http://wemedia.ifeng.com/66272056/wemedia.shtml (accessed on 29 July 2018).
  37. Shaheen, S.; Elliot, M.; Nelson, C.; Adam, C.; Mike, P. Public Bikesharing in North America During A Period of Rapid Expansion: Understanding Business Models, Industry Trends and User Impacts. 2014. Available online: http://transweb.sjsu.edu/project/1131.html (accessed on 29 July 2018).
  38. Elsharkawy, H.; Rutherford, P. Retrofitting social housing in the UK: Home energy use and performance in a pre-Community Energy Saving Programme (CESP). Energy Build. 2015, 88, 25–33. [Google Scholar] [CrossRef] [Green Version]
  39. BRE. Energy Follow-Up Survey. 2011. Available online: https://www.gov.uk/government/statistics/energy-follow-up-survey-efus-2011 (accessed on 29 July 2018).
  40. Kaza, N. Understanding the spectrum of residential energy consumption: A quantile regression approach. Energy Policy 2010, 38, 6574–6585. [Google Scholar] [CrossRef]
  41. Zhang, Z.; Cai, W.; Feng, X. How do urban households in China respond to increasing block pricing in electricity? Evidence from a fuzzy regression discontinuity approach. Energy Policy 2017, 105, 161–172. [Google Scholar] [CrossRef]
  42. Aerts, D.; Minnen, J.; Glorieux, I. Discrete Occupancy Profiles from Time-Use Data for User Behaviour Modelling In Homes. 2012. Available online: https://www.researchgate.net/publication/264428639_Discrete_occupancy_profiles_from_time-use_data_for_user_behaviour_modelling_in_homes (accessed on 29 July 2018).
  43. Aerts, D.; Minnen, J.; Glorieux, I.; Wouters, I.; Descamps, F. A method for the identification and modelling of realistic domestic occupancy sequences for building energy demand simulations and peer comparison. Build. Environ. 2014, 75, 67–78. [Google Scholar] [CrossRef]
  44. Buttitta, G.; Turner, W.; Finn, D. Clustering of household occupancy profiles for archetype building models. Energy Procedia 2017, 111, 161–170. [Google Scholar] [CrossRef]
  45. Gu, F.; Zheng, Y.; Zhang, W.; Yao, X.; Pan, D.; Wong, A.S.M.; Guo, J.; Hall, P.; Sharmin, N. Can bamboo fibres be an alternative to flax fibres as materials for plastic reinforcement? A comparative life cycle study on polypropylene/flax/bamboo laminates. Ind. Crop. Prod. 2018, 121, 372–387. [Google Scholar] [CrossRef]
  46. Gu, F.; Zhang, W.; Guo, J.; Hall, P. Exploring “Internet+Recycling”: Mass balance and life cycle assessment of a waste management system associated with a mobile application. Sci. Total Environ. 2019, 649, 172–185. [Google Scholar] [CrossRef]
  47. Zhang, W.; Gu, F.; Dai, F.; Gu, X.; Yue, F.; Bao, B. Decision framework for feasibility analysis of introducing the steam turbine unit to recover industrial waste heat based on economic and environmental assessments. J. Clean. Prod. 2016, 137, 1491–1502. [Google Scholar] [CrossRef]
  48. Zhang, W.; Guo, J.; Gu, F.; Gu, X. Coupling life cycle assessment and life cycle costing as an evaluation tool for developing product service system of high energy-consuming equipment. J. Clean. Prod. 2018, 183, 1043–1053. [Google Scholar] [CrossRef]
  49. Filimonau, V.; Dickinson, J.; Robbins, D. The carbon impact of short-haul tourism: A case study of UK travel to Southern France using life cycle analysis. J. Clean. Prod. 2014, 64, 628–638. [Google Scholar] [CrossRef]
  50. Pereira, R.P.T.; Ribeiro, G.M.; Filimonau, V. The carbon footprint appraisal of local visitor travel in Brazil: A case of the Rio de Janeiro-São Paulo itinerary. J. Clean. Prod. 2017, 141, 256–266. [Google Scholar] [CrossRef] [Green Version]
  51. ISO14040. Environmental Management-Life Cycle Assessment-Principles and Framework; British Standards Institution: London, UK, 2006. [Google Scholar]
  52. Gu, F.; Guo, J.; Zhang, W.; Summers, P.A.; Hall, P. From waste plastics to industrial raw materials: A life cycle assessment of mechanical plastic recycling practice based on a real-world case study. Sci. Total Environ. 2017, 601–602, 1192–1207. [Google Scholar] [CrossRef]
  53. Zhao, P.; Rao, C.; Gu, F.; Sharmin, N.; Fu, J. Close-looped recycling of polylactic acid used in 3D printing: An experimental investigation and life cycle assessment. J. Clean. Prod. 2018, 197, 1046–1055. [Google Scholar] [CrossRef]
  54. Cherry, C.R.; Weinert, J.X.; Yang, X. Comparative environmental impacts of electric bikes in China. Transp. Res. Part D 2009, 14, 281–290. [Google Scholar] [CrossRef] [Green Version]
  55. SOHU. Blue Book on New Energy Vehicles. 2017. Available online: https://www.sohu.com/a/162221065157267 (accessed on 29 July 2018).
  56. ASKCI. Bicycle Sharing Data Analysis in May 2018. 2018. Available online: https://baijiahao.baidu.com/s?id=1603940658448830205&wfr=spider&for=pc (accessed on 29 July 2018).
  57. Kliucininkas, L.; Matulevicius, J.; Martuzevicius, D. The life cycle assessment of alternative fuel chains for urban buses and trolleybuses. J. Environ. Manag. 2012, 99, 98–103. [Google Scholar] [CrossRef]
  58. Zhang, W.; Gu, F.; Guo, J. Can smart factory bring environmental benefits to its products? Evidence from a comparative life cycle assessment on refrigerators. J. Ind. Ecol. 2018. in submission. [Google Scholar]
  59. Zhang, C.; Tan, Z. The relationships between population factors and China’s carbon emissions: Does population aging matter? Renew. Sustain. Energy Rev. 2016, 65, 1018–1025. [Google Scholar] [CrossRef]
  60. Szeto, W.Y.; Yang, L.; Wong, R.C.P.; Li, Y.C.; Wong, S.C. Spatio-temporal travel characteristics of the elderly in an ageing society. Travel Behav. Soc. 2017, 9, 10–20. [Google Scholar] [CrossRef]
  61. Rokeach, M. Beliefs, Attitudes, and Values: A Theory of Organization and Change; Jossey-Bass Inc.: San Francisco, CA, USA, 1972. [Google Scholar]
  62. Schade, M.; Hegner, S.; Horstmann, F.; Nora, B. The impact of attitude functions on luxury brand consumption: An age-based group comparison. J. Bus. Res. 2015, 69, 314–322. [Google Scholar] [CrossRef]
  63. United Nations Population Division. World Population Prospects; United Nations Population Division: New York, NY, USA, 2017. [Google Scholar]
  64. Mankiw, N.G. Principles of Economics; Cameron University: Lawton, OK, USA, 2007. [Google Scholar]
  65. Mrcjcn. A Summary of the Charging Standards and Monthly Card Rental Fees of Shared Bicycles in 2018. 2018. Available online: http://www.mrcjcn.com/n/259146.html (accessed on 29 July 2018).
  66. Gillingham, K. Identifying the elasticity of driving: Evidence from a gasoline price. Reg. Sci. Urban Econ. 2014, 47, 13–24. [Google Scholar] [CrossRef]
  67. Gillingham, K.; Munknielsen, A. A tale of two tails: Commuting and the fuel price response in driving. Cesifo Work. Pap. 2016. [Google Scholar] [CrossRef]
  68. Du, M.Y.; Cheng, L. Better understanding the characteristics and influential factors of different travel patterns in free-floating bike sharing: Evidence from Nanjing, China. Sustainability 2018, 4, 1244. [Google Scholar] [CrossRef]
  69. Hazen, B.; Robert, E.O.; Wang, Y. Predicting public bicycle adoption using the technology acceptance model. Sustainability 2015, 11, 14558–14573. [Google Scholar] [CrossRef]
  70. Yahya, B.N. Overall bike effectiveness as a sustainability metric for bike sharing systems. Sustainability 2017, 11, 2070. [Google Scholar] [CrossRef]
  71. XJB. The Idle Rate of Shared Bicycle in Beijing is Close to 50%, the Next Step will Be Reduced Regulation. 2018. Available online: https://baijiahao.baidu.com/s?id=1601404479322594125&wfr=spider&for=pc (accessed on 29 July 2018).
  72. Leedy, P.D.; Ormrod, J.E. Practical Research: Planning and Design; Pearson Education, Inc.: Fort Worth, TX, USA, 2010. [Google Scholar]
  73. ASKCI. Shared Bicycle Delivery Volume PK: The Country has Exceeded 10 Million Vehicles. 2017. Available online: http://www.askci.com/news/chanye/20170524/17575998872.shtml (accessed on 29 July 2018).
  74. Wang, N.; Yan, R.L. Research on Consumers’ use willingness and opinions of electric vehicle sharing: An empirical study in Shanghai. Sustainability 2015, 8, 7. [Google Scholar] [CrossRef]
  75. Shaheen, S.; Elliot, M.; Adam, C. Public bikesharing and modal shift behavior: A comparative study of early bikesharing systems in north America. Transp. LETT 2013, 1, 35–54. Available online: https://escholarship.org/uc/item/7010k9p3 (accessed on 29 July 2018). [CrossRef]
  76. Fishman, E.; Washington, S.; Haworth, N. Bicycle share’s impact on car use: Evidence from the United States, Great Britain, and Australia. Transp. Res. Part D 2015, 2, 135–142. [Google Scholar] [CrossRef]
  77. Chen, P.; Jiao, J.; Xu, M.; Gao, X.; Bischak, C. Promoting active student travel: A longitudinal study. J. Transp. Geogr. 2018, 70, 265–274. [Google Scholar] [CrossRef]
  78. JCDecaux. Research Report on Passenger Characteristics of Nanjing Subway. 2017. Available online: https://max.book118.com/html/2017/0525/109052421.shtm (accessed on 29 July 2018).
  79. Czepkiewicz, M.; Ottelin, J.; Ala-Mantila, S.; Heinonen, J.; Hasanzadeh, K.; Kyttä, M. Urban structural and socioeconomic effects on local, national and international travel patterns and greenhouse gas emissions of young adults. J. Transp. Geogr. 2018, 68, 130–141. [Google Scholar] [CrossRef]
  80. MTC. The Period of Scrapping A Shared Bicycle is Three Years. 2017. Available online: http://news.youth.cn/jsxw/201703/t20170324_9342402.htm (accessed on 29 July 2018).
  81. Pconline. Experience Mobby-Lite: Low Cost and Comfortable. 2018. Available online: http://www.pconline.com.cn/autotech/852/8520760.html (accessed on 29 July 2018).
  82. Gleason, R.; Laurie, M. Exploring Bicycle Options for Federal Lands: Bike Sharing, Rentals and Employee Fleets. 2012. Available online: www.nps.gov/transportation/pdfs/FHWA_bicycle_options.pdf (accessed on 29 July 2018).
  83. Nair, R.; Elise, M.H.; Robert, H.; Ana, B. Large-Scale Vehicle Sharing Systems: An Analysis of Vélib. Int. J. Sustain. Transp. 2013, 7, 85–106. [Google Scholar] [CrossRef]
  84. Gu, F.; Guo, J.; Hall, P.; Gu, X. An integrated architecture for implementing Extended Producer Responsibility in the context of Industry 4.0. Int. J. Prod. Res. 2018, 1, 1–20. [Google Scholar] [CrossRef]
  85. Gu, F.; Ma, B.; Guo, J.; Summers, P.A.; Hall, P. Internet of things and Big Data as potential solutions to the problems in waste electrical and electronic equipment management: An exploratory study. Waste Manag. 2017, 68, 434–448. [Google Scholar] [CrossRef]
  86. Murillo, D.; Buckland, H.; Val, E. When the sharing economy becomes neoliberalism on steroids: Unravelling the controversies. Technol. Forecast. Soc. Chang. 2017, 125, 66–76. [Google Scholar] [CrossRef]
  87. Institute for Transportation and Development Policy. Riding the Bike-Share Boom: The Top Five Components of a Successful System. 2013. Available online: www.itdp.org/riding -the-bike-share-boom-the-top-five-components-of-a -successful-system/ (accessed on 29 July 2018).
Figure 1. System boundaries of the life cycle assessment for bicycle sharing.
Sustainability 11 01550 g001
Figure 2. Cross analysis of respondents’ socioeconomic characteristics: (a) gender and age, and (b) income level (RMB per month) and age.
Sustainability 11 01550 g002
Figure 3. Socioeconomic characteristics related to the changes in traveling modes after the introduction of bicycle sharing: (a) gender, (b) age, and (c) income.
Sustainability 11 01550 g003
Figure 4. The attitude towards bicycle sharing measured by the following questions: (a) Can you find a shared bicycle every time you want to ride it? (b) What do you think of the volume of bicycles in your city? (c) Perception and attitude towards shared bicycle, and (d) if the volume of shared bicycles increased, would you prefer to choose it to travel?
Sustainability 11 01550 g004
Figure 5. Split the LCA results into the individual processes: (a) the processes that belong to the studied system, (b) the processes that belong to each life cycle of shared bicycle, (c) age (one customer), and (d) age (age group).
Sustainability 11 01550 g005
Figure 6. End-point environmental impacts of all processes within the bounds of the system: (a) the end-point results of all processes within the bounds of the system, and (b) split of the end-point LCA results into the individual processes.
Sustainability 11 01550 g006
Figure 7. Changes in environmental impacts associated with (a) the aging population, (b) the rental fee of shared bicycle, (c) the service life, and (d) the volume of shared bicycles.
Sustainability 11 01550 g007
Table 1. Data and assumptions for the modelling of the process.
ProcessDescription of Datasets and Assumptions Used
Producing a shared bicycleSmart bicycle locks are the main difference between shared bicycles and ordinary bicycles. Since they are relatively small compared to the whole bicycle and lack of data, the environmental impact of producing a shared bicycle is equal to that of ordinary bicycle here. The EI dataset “Row: bicycle production [unit]” is used. This study assumes that an average shared bicycle weights around 17 kg including accessories like lights and carrier, and the frame material is made of aluminum.
Using a shared bicycleThe EI dataset “Row: transport, passenger, bicycle [person × km]” is used. The dataset reflects the traveling of one person one kilometer on a bicycle. Capacity utilization: 1 person. This dataset includes the operation of a bicycle and the use of road infrastructure. The mileage data of Shared bicycles are derived from the replaced mileage of various alternative vehicles in the questionnaire.
Maintaining a shared bicycleThe EI dataset “GLO: maintenance, bicycle [unit]” is used. This dataset includes the maintaining of a bicycle throughout its life cycle.
Recycling a shared bicycleThe EI dataset “GLO: treatment of used bicycle [unit]” is used. The dataset reflects the disposal of a bicycle of 17 kg. Aluminum and steel parts are fully recycled. The reuse of recycled materials is not considered in this study. Plastics are assumed to be incinerated, though recycling could be more environmentally friendly [53]. This dataset includes the disposal of all remaining parts that are not recycled. Transport for recycled materials is also included. It also assumed that 5% of shared bikes are recycled.
Leaving a shared bicycle without disposal optionsIt is assumed that the 7.53 kg of steel, 6.987 kg of aluminum, 1.96 kg of waste polyethylene and 0.03 kg of waste polyurethane in the shared bicycle material are all naturally degraded, and the 0.563 kg of waste rubber is naturally incinerated. It also assumed that 95% of shared bikes are not recycled. The EI datasets “RoW: aluminum treatment of waste aluminum, sanitary landfill [kg]”, “RoW: steel treatment of scrap steel, inert material landfill [kg]”, “RoW: polyethylene treatment of waste polyethylene, sanitary landfill [kg]”, “RoW: polyurethane treatment of waste polyurethane, sanitary landfill [kg]”, “RoW: synthetic rubber treatment of waste rubber, unspecified, municipal incineration [kg]” are used.
Taking busThe quantitative proportion of the diesel buses to pure electric buses is 7:3 [55], the distance between each station of bus is assumed to be 1.5 km. The EI datasets “GLO: transport, regular bus [person × km]” and “GLO: transport, trolleybus [person × km]” are used. This data includes fuel consumption and emissions, electricity and wears caused by the utilization of tires, brakes, and road.
Taking subwayThe EI dataset “GLO: transport, passenger train [person × km]” is used, the distance between each station of subway is assumed to be 2 km. The dataset reflects the transport of one person on one kilometer on subway. Capacity utilization: one person. The module calls the modules “operation of vehicle”; “production, maintaining and disposal of vehicles”; “construction and maintaining and disposal of railway tracks”.
Taking a private car/taxiThe EI dataset “GLO: transport, passenger car [person × km]” is used. This data includes fuel consumption and emissions as well as wears caused by the utilization of tires, brakes and road.
Using an electric bicycleThe EI dataset “GLO: transport, passenger, electric bicycle [person × km]” is used. The dataset reflects the transport of one person on one kilometer on an electric bicycle. Capacity utilization: 1 person. This data includes the operation, maintaining and disposal of an electric bicycle and the use of road infrastructure.
Table 2. Population-age ratios of China and population-age ratios of shared bicycle users from 2015 to 2035.
GenerationPopulation-Age RatioPopulation-Age Ratio of Shared Bicycle Users
12–2425-49≥5012–2425–4950 and above
201516.4%40.9%42.7%71.00%24.00%5.00% *
202014.6%38.2%47.2%63.21%22.42%5.53%
202514.7%35.0%50.3%63.64%20.54%5.89%
203015.0%33.6%51.4%64.94%19.72%6.02%
203514.6%32.3%53.1%63.21%18.95%6.22%
* The population-age ratio of shared bicycle users in 2015 are obtain from the survey result, see Section 3.1.1 for detail.
Table 3. Research sample cities and the number of valid questionnaires returned.
City CategoryGeographical Distribution of UsersQuantity of Valid QuestionnairesProportion of Valid Questionnaires
First-tier cities and new first-tier cities55.10%30059.17%
Second-tier cities26.80%12825.25%
Others18.10%7915.58%
Total100%507100%
Table 4. The mileages that using shared bicycle instead of taking other traveling means per week of different age groups.
Age GroupBus (km)Private Car/Taxi (km)Electric Bicycle (km)Subway (km)
12–246.281.660.753.26
25–357.203.351.287.19
36–457.892.631.840.53
46–551.501.000.000.00
Average mileage replaced by bicycle sharing6.522.100.924.06
Table 5. The mid-point LCA results of bicycle sharing.
IndicatorValueUnit of Measurement
Global Warming Potential−383.9922kg CO2 eq
Fossil Depletion Potential−150.4658kg oil eq
Freshwater Ecotoxicity Potential−7.4629kg 1,4 DB eq
Freshwater Eutrophication Potential−0.0707kg P eq
Human Toxicity Potential−79.1909kg 1,4-DB eq
Ionizing Radiation Potential−49.9196kg U235 eq
Marine Ecotoxicity Potential−6.3071kg 1,4-DCB-eq
Marine Eutrophication Potential−0.9213kg N-eq
Metal Depletion Potential2.5644kg Fe eq
Particulate Matter Formation Potential−0.9141kg PM10-eq
Photochemical Oxidant Formation Potential−2.8881kg NMVOC

