1. Introduction
A dairy farmer’s decision to adopt organic farming practices can be considered in the following way: a dairy farmer chooses to adopt organic practices if the expected profits from organic farming less cost of conversion exceed the expected profits from conventional dairy farming. If this is not true, the dairy farmer will continue conventional dairy production or close up shop, if expected profits are not sufficiently high. The profit-maximizing model suggests that the decision is strictly based on economic considerations. Yet conversion to organic farming has been slow in the United States, despite the finding that organic farming is more profitable than conventional farming [
1,
2]. This suggests that other factors are equally important in the decision.
Our underlying hypothesis is that while organic is more profitable, it is not adopted widely for several reasons. First, the method is outside of the social norm in many regions of the country [
3]. Anecdotal evidence suggests that a successful conversion from conventional to organic farming requires changing the way a farmer thinks about agriculture [
4]. The importance of farmer mindset is supported by research indicating that the lack of peer support or existing social norms regarding organic farming are barriers to conversion [
5,
6,
7]. Another contributory factor is the wide differences between organic and conventional farming practices, which may lead an individual farmer to perceive that participating in the organic market is too risky [
8]. The lack of technical knowledge about organic practices may lead farmers to estimate low expected profits. Additionally, the costs of conversion, in terms of reduced yields during the transition period, may be too high for many farmers [
9]. Some of these barriers may be reduced by the presence of either university agricultural extension agents, private sector companies supporting the transition to organic, or certifiers conducting outreach to farmers [
8,
10].
Proximity to other organic farmers may overcome many of these perceived barriers. Knowing or being proximate to one or more certified organic farmers may normalize the production method. Locating near other organic farmers also facilitates sharing of technical information about organic farming practices, as new farmers learn from more experienced farmers. This is supported by theoretical evidence showing that economic growth is based on innovations that “spill over,” which is further supported by empirical evidence showing that geographical proximity and knowledge spillovers are correlated [
11,
12,
13,
14]. This has been documented particularly well in the case of cities [
15].
Theories on information sharing and clustering as determinants for economic growth distinguish between two different forms. The first considers information that spills within companies that belong to the same industry. An example of this is Silicon Valley, where information flows through firms that comprise the technology industry. Second, other work examines information that spills from one industry to another such as from “the brassiere industry which grew out of dressmakers’ innovations rather than the lingerie industry” [
15,
16]. Our work focuses on the flow of information within the organic dairy farm sector and does not consider the second type, where the information spills over to other industries.
The evidence linking geographical proximity and knowledge transmission is particularly important for agricultural and food processing industries, as it finds that knowledge diffusion of plant biotechnology research was facilitated by proximity, particularly for small firms [
17]. Another important factor is proximity to consumers willing to buy organic products, which has been shown to be a key determinant in the retailing of organic products [
18]. Proximity of the farm to buyers of farm-level organic products is another critical aspect, to ensure there is a market for their organic farm production [
19]. Thus, over time, given the influence of these factors, we hypothesize that networks of organic farmers will emerge as more farmers transition to organic farming. We infer spatio-temporal networks [
20] to account for these phenomena. This approach has been used in several domains such as predicting the formation of transportation networks [
21,
22], the diffusion of new words [
23], predicting and recommending actual connections in social networks [
23], and recommending new restaurants to social media users [
24], among others [
25]. This paper starts with a discussion of the literature on social networks with an emphasis on information exchange in the agricultural sector. Next, we discuss the evolution of the organic dairy industry from the inception of the National Organic Standards in 2002 until 2015, tracing changes in the supply and demand of organic milk to identify key moments that are important to the network analysis. After presenting the methodology used, we discuss the results of the network analysis. We conclude with a discussion of the potential for this method, as well as the implications for the organic dairy sector. The research adds to the literature on organic production by analyzing the potential implications of social networking in the decision of farmers to adopt organic dairy production practices, and to the literature on empirical social networks by using a new dataset with information on actors not previously studied analytically.
1.1. Background on Social Network Analysis
We assert that social network analysis is able to demonstrate how hypothesized organic farmer networks changed over time in the United States. Social network analysis is a methodology that reflects the relational nature of the object of study. This methodology has been used by social scientists since 1945 [
26], and has contributed to an understanding of varied social phenomena, such as the identification of ‘persons of interest’ by law enforcement agents [
27]. More specifically, in food related research it has been used to study food vendor–supplier networks [
28], the spread of obesity [
29], food recipes and ingredient pairings [
30,
31], food choice by socially connected individuals, such as spouses and friends, [
32], the role of food retailers in the formation of cohesive local food supply networks [
33], and the relationship between country obesity rates and food recipes [
34], among others.
Furthermore, social networks methodology has been used in agriculture to study the relationship between belonging to a network and the adoption of agricultural technology [
35,
36] and knowledge exchange [
37,
38,
39]. Empirical studies demonstrate that “farmers do not act unilaterally; instead they collaborate, consult and negotiate. Embedded in these interactions is a flow of knowledge, ideas and information (…)” [
36]. It is important to note that these collaborations in the agri-food industry are dependent on geographical proximity [
17]. Hence, if farmers are connected to a greater number of farmers, due to geographical proximity, information flows more efficiently. This will benefit the farmers on a denser network as information on prices, best practices, and the certification process can be shared more efficiently. In fact, lack of knowledge of the benefits derived from converting into organic has been identified as one of the main causes of failure to convert. This lack of information is addressed through the creation of social networks, as observed by researchers using qualitative techniques to study the transition into organic dairy in Southwestern Wisconsin [
40].
Building on the literature on network analysis and knowledge exchange in agriculture, our analysis examines the evolution of the inferred network of certified organic farmers from 2002 to 2015. We assess key network statistics over time, calculated from the simulated networks that are built based on geographical distance. These networks statistics and their development over time allow us to investigate whether the network evidences that new organic dairy operations are closer to other existing operations, in other words, forming geographical clusters, or if the choice of a new location, or the conversion into organic dairy, occurs in geographical areas not associated with existing and incoming organic dairy operations. Our hypothesis is grounded in the fact that geographical clusters bring benefits to new and already established organic farming operations. The benefits may be due to potential cooperation with others, which results in improved access to transportation, as a truck can pick up the dairy from several farmers located in the cluster, especially those that don’t have enough volume to fill up a truck. While outside of the scope of this analysis, cooperation may also lead to establishing new handling facilities.
We use the case of organic dairy to explore the dynamics of organic farmer networks in the United States. The data on certified organic farmers comes from the U.S. Department of Agriculture’s Organic Integrity database, which we used to identify organic dairy farmers by year of receiving organic certification since the inception of the federal organic regulations in 2002. Using this information, we developed a model to infer longitudinal social networks based on geographic coordinates, which are then analyzed using network analysis where organic farmers are represented by nodes and edges to characterize social connections amongst them [
41,
42,
43]. We assumed that producers connected with others located within a 50-mile radius, as in fact theoretical and empirical evidence points out that at least 66% of real world social network connections are correlated with geographical proximity [
44]. The methodology used allows us to infer social networks without data on actual connections. The simulations consider a variety of possibilities and degrees of agent sociabilities within the geographic radius.
1.2. Background on the US Organic Dairy Industry
The organic dairy sector consists of certified organic farms, where fluid milk is produced, and certified organic processors, who bottle fluid milk or create milk-based products such as cheese and yogurt. At the farm level, in 2016, there were 2,559 certified organic dairy farms, with 268 thousand cows at year end [
45]. The organic and conventional markets are connected: the conventional market is the residual market for organic products, where organic milk can be sold as conventional in the absence of an organic buyer. Note that doing so will be costly, because, relative to conventional, organic production costs and prices are higher, with the farm level premiums estimated at 140 percent in 2017 [
46]. Three large processors distribute organic milk nationally: Organic Valley, Horizon Organic and Aurora Dairy. In addition, there are smaller processors who work regionally.
Prior to 2002, organic certification was in the control of multiple private certifiers each with different standards. Since 2002, the National Organic Standards dictate the certification rules, which are regulated by the US Department of Agriculture (USDA) but implemented by third party accredited certifiers. The standards regulate how certified organic cows are raised, and include rules about animal food and access to the outdoors. The organic dairy industry has experienced important milestones and influential events, which are outlined in
Table 1.
Organic Valley, a farmer owned cooperative, began producing and selling organic milk in 1988. Horizon began as an independent company in 1991, and was purchased by Dean Foods in 2004; the purchase was critical to the development of organic dairy market, as Dean Foods had well established distribution channels that opened to Horizon with the sale. Horizon Organic contracts with farmers for their milk. Aurora Dairy’s organic business started later, in 2003, and was developed by one of the founders of Horizon Organic Dairy. Aurora produces lower priced, store brand milk, and owns a handful of large-scale organic dairy farms.
Several changes in the national organic standards influenced the development of the organic dairy farm sector. The first key event was the Harvey case, in which a farmer sued USDA over specific aspects of the initial organic rule; in terms of dairy, the original rule allowed farmers to use a portion of conventional feed during the transition process. One result of the Harvey rule was a shift to 100 percent organic feed during the entire transition process; this change encouraged a bump in transition prior to the rule change in June 2007. In 2005, there were 87 thousand organic dairy cows, which increased to 250 thousand dairy cows in 2008. Between 2008 and 2011, there was a small increase in the number of certified organic dairy cows, to 255 thousand total organic cows [
47]. The second significant event was the 2010 rule, which closed a loophole in the initial organic regulation regarding access to the outdoors for organic livestock. The pasture rule, as it is called, specified that cows must be grazed on pasture for at least 120 days of the year [
48].
Other events, such as changing consumer preferences and increasing input costs, are significant in that they alter incentives to transition as well as increase costs of production. For example, the drought in California made it challenging for organic dairy farmers to meet the grazing requirement in 2014, as the lack of rain prevented the growth of grasses for grazing on the pastureland. Examples of optimal responses to some of these exogenous changes are to transition to organic more quickly, or to give up organic certification.
The organic dairy sector has experienced significant cycles over the past 20 years. While such boom and bust cycles are common for agriculture in general, the organic sector has largely been insulated from price volatility: this is likely due to continued growth of consumer demand for organic products. Shortages of organic milk were common prior to 2007, and empty shelves in the supermarket were not uncommon [
49]. The recession of 2008, combined with the boost in organic milk supply caused by the increased number of farmers (in response to the regulatory changes effective June 2007), had a huge effect on the organic dairy market: consumer demand dropped while supply increased, and organic farm gate dairy prices fell for the first time. Processors bought less organic milk, and some failed to renew contracts with farmers. But by 2015, there were shortages of organic milk again. In 2017, there was a surplus of organic milk again, with processors cutting prices paid to farmers. Producers of organic milk, unable to find buyers, sold some product into the conventional market, at the lower conventional milk price, or just dumped the milk [
50].
2. Materials and Methods
To study the role of peer influence on the distribution and location of certified organic dairy farmers, we analyzed simulated networks of producers. We assumed that buyers (processors such as Organic Valley) were located near existing farmers, and that the market could absorb the production of newly transitioned dairy farmers. These assumptions allowed us to focus on the formation of a farmer network.
The entire process of inferring the network consists of four stages. The analysis of networks began with the collection and processing of the data that forms the basis of the analysis. Next, nodes (farmers) were geolocated using the Google maps API based on the address registered in the certification [
51]. Next, we inferred networks in which farmers connected to other farmers by assuming different levels of sociability and placing restrictions on the geographical distance in which a connection between two farmers may be formed. Next, we used network statistic measures to study the simulated networks in a year to year basis both at the micro and macro level to asses for clustering and connectivity [
52,
53].
2.1. Creation of the Dataset
The data were downloaded from a publicly available dataset of the USDA—the Organic Integrity Database—on June 8 2017. (See
Supplementary Materials for dataset and R code.). This database is the most comprehensive source of information on organic production covering all farms and businesses that are certified to the USDA organic standard. Included information was the address of the certified organic operation, the products grown or processed there, the business name, the scope of activity, the date first certified, and the date certification was revoked or surrendered. Next, the data were filtered so that only certified organic milk and dairy livestock operations, located in the United States, were included. All certification dates prior to 2002 were recoded to 2002, which is the first year of the national organic regulation in the US, which marks the point in time when all farms were certified to the same standard. The final full year of data, at the time of the download, was 2016, but because the 2016 data was incomplete at the time of downloading, that year was excluded from the analysis. Therefore, the analysis covered 2002 to 2015. The final dataset for that time period included 2433 producers, who held 5175 certifications. Producers may hold multiple organic certifications, and because certification is costly, producers usually select ones required by the buyers.
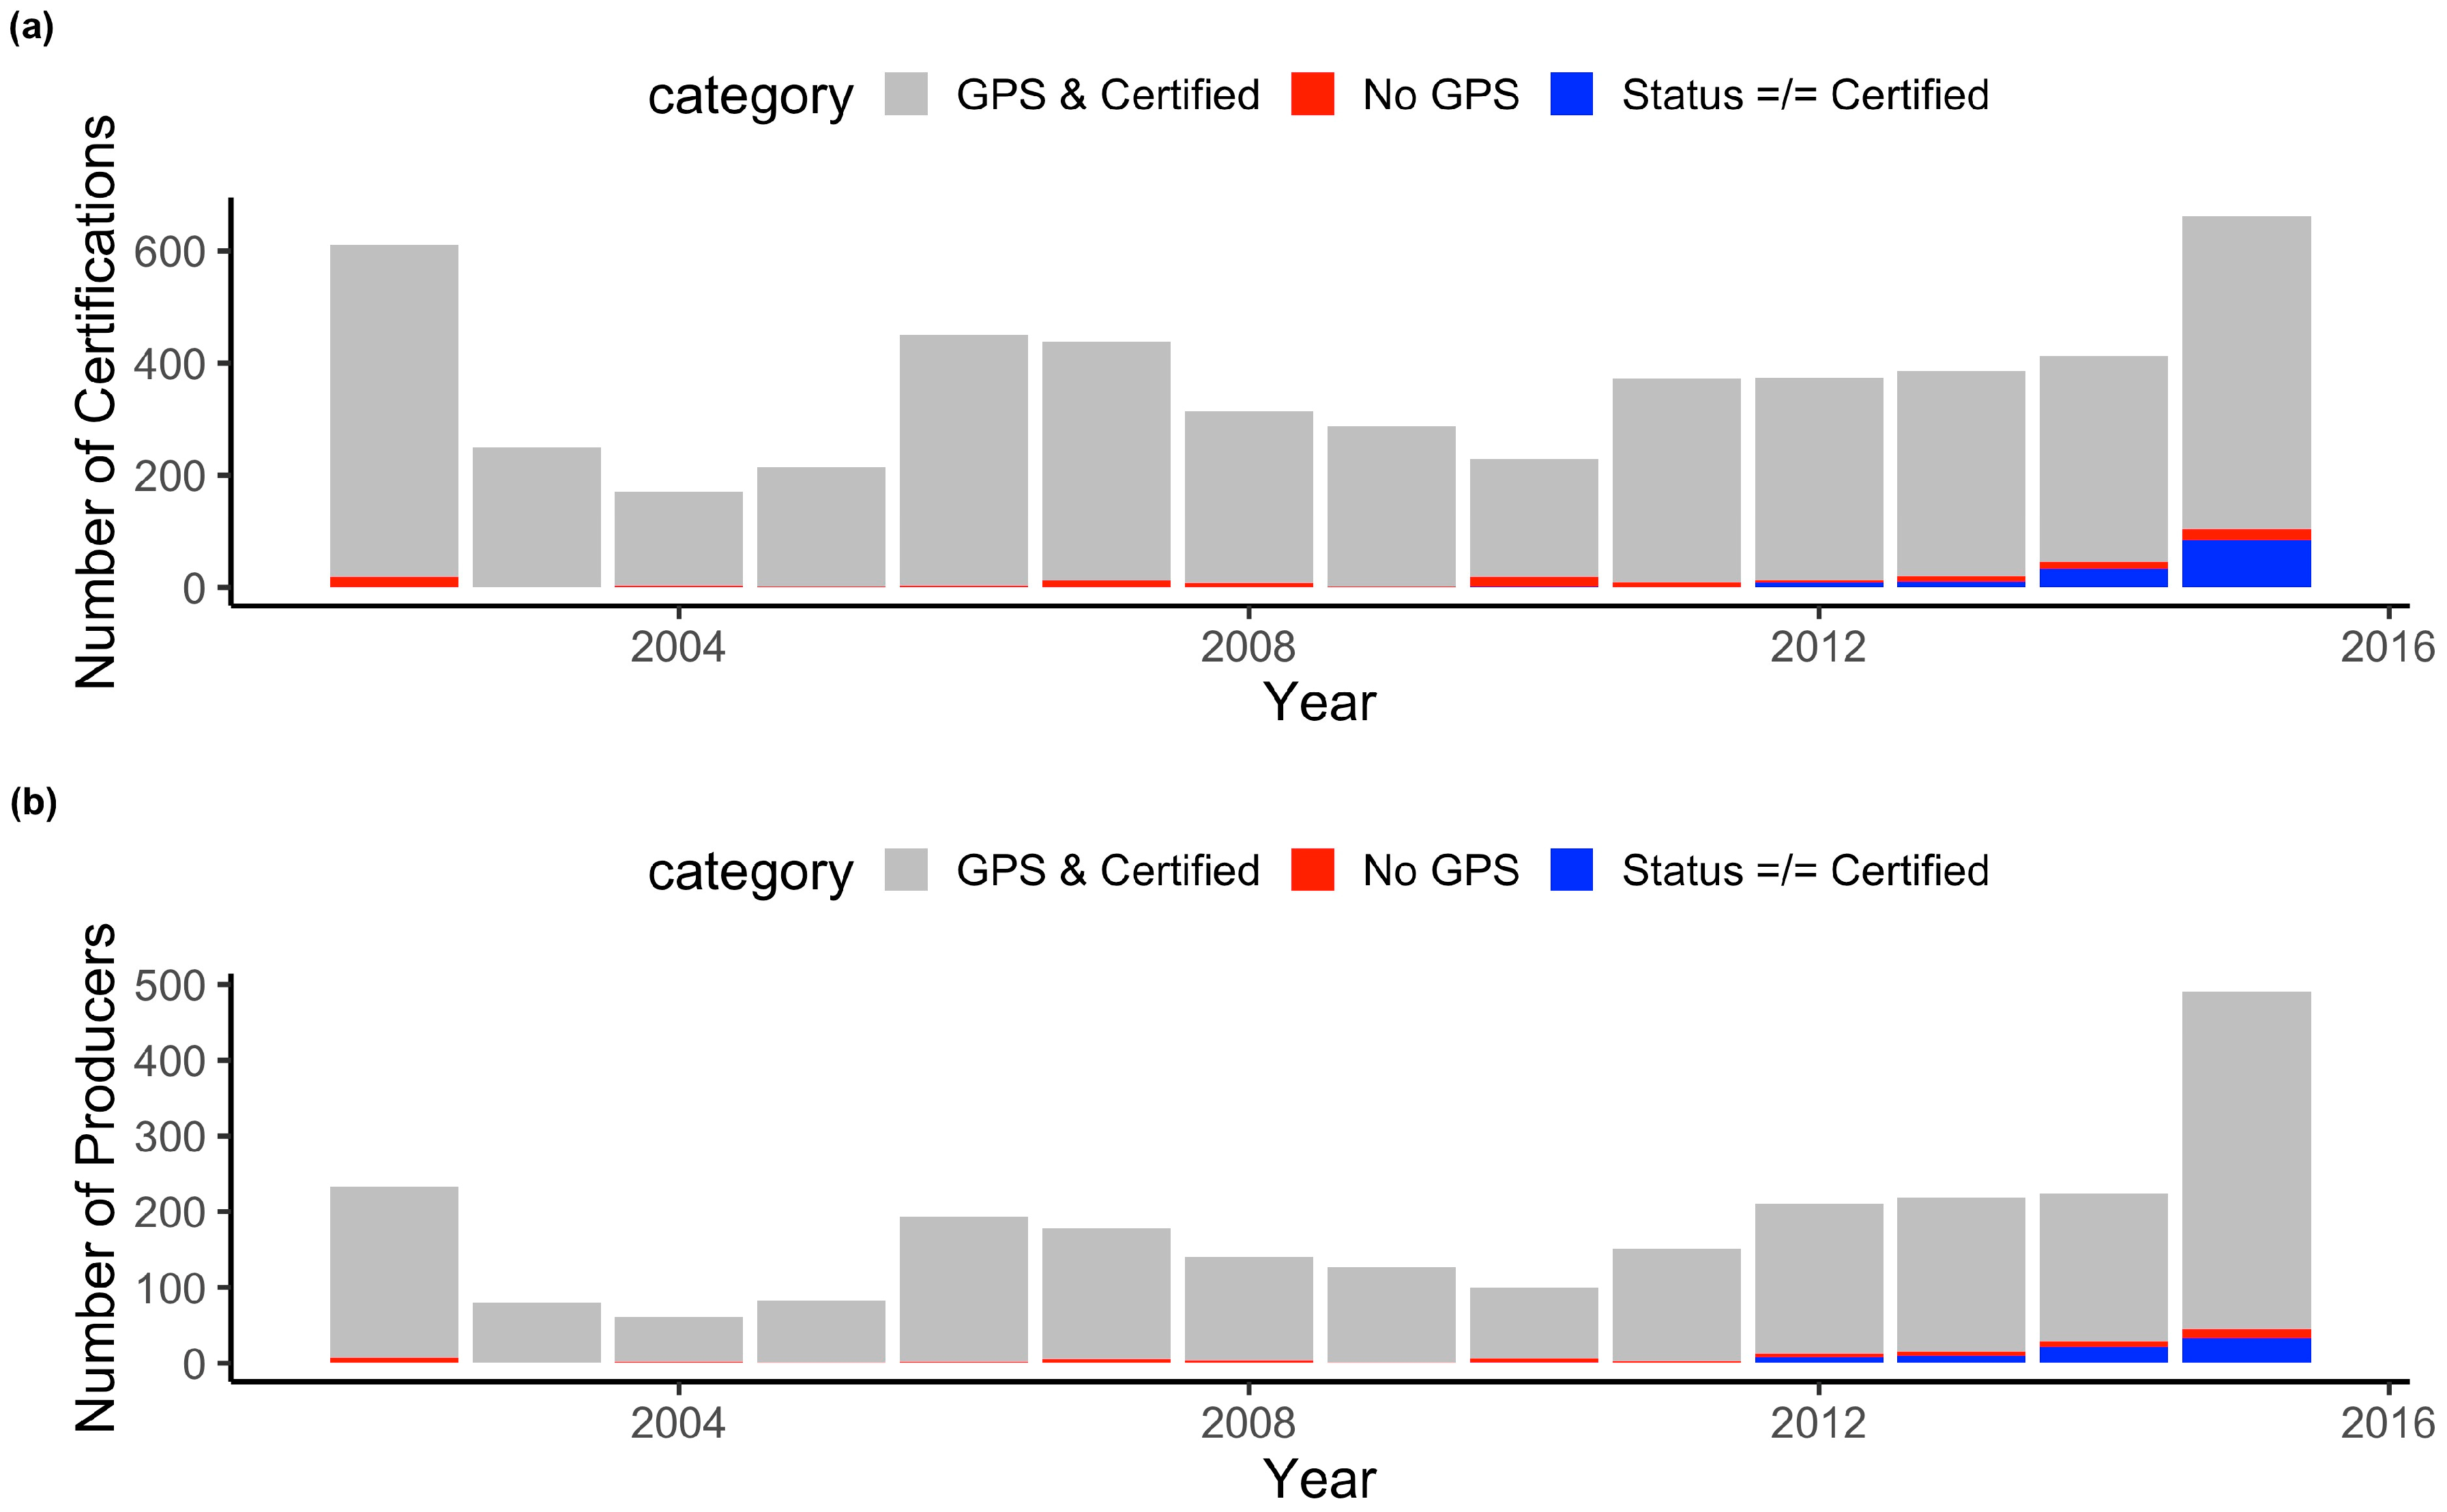
The changes in the number of producers (shown in
Figure 1) over time matched well with the industry shifts discussed in the previous section, reflecting exit and entry in the sector. For example, between 2004 and 2006, the number of producers and certifications increased, while these numbers decreased between 2008 and 2010, before increasing in 2011. The certifications and producers that were considered in the analysis are those represented in gray (
Figure 1). These observations are for producers for whom we were able to obtain a GPS coordinate on using the Google Maps API and who have at least one certification with status in certified. As can be seen here, we have filtered the data losing some information for producers for whom we were unable to obtain GPS coordinates or whose certification status was surrendered or suspended.
2.2. Inferring Social Networks
The next step involved obtaining a pair of longitude and latitude GPS coordinates for the location of each certified dairy operation. The first step in this process was creating a vector concatenating the address fields, and then pushing the vector to Google Maps to retrieve latitude and longitude. Since the address vector contains address lines, city, state, country, and zip code, this minimized errors. The authors manually checked some of the randomly selected GPS coordinates using google maps to further scrutinize the results.
The next step was to infer social networks on the GPS coordinates. We assumed several scenarios of interconnectedness inside a geographical boundary based on a 50-mile radius. Producers were assumed to be connected to other producers located at most 50 miles away (Euclidean distance). Several models were studied, ranging from a random 5% probability of being connected to another farmer in the 50-mile radius to 100% probability of being connected.
Furthermore, those connections have been programmed to be time dependent. For the purpose of the network analysis, the producers were organized into yearly chronological periods, based on the date they were first certified. Thus, we constructed 280 different networks, one for each year between 2002 and 2015, and 20 for each year as we modeled different probabilities of connecting with other farmers in the 50-mile radius, ranging from 5% to 100% using 5% increments. The first years consisted of the early adopters of organic dairy farming, and many of these farmers were in the organic business prior to the implementation of the federal organic program. We assumed that a producer in the first year (2002) would only connect with a producer in that same year. A new entrant producer in the following years would connect with the already established producers in the previous years, or with other new entrants in the same year. The following pseudo-code summarizes the algorithm used to infer the networks:
| Algorithm 1: Pseudo-code to infer networks |
 |
2.3. Network Statistics
We further studied the development of the simulated networks along with the corresponding network analysis statistics. To do so we used measures that described the network at different points in time following Barabási et al. [
54], who examined the development of scientific collaborations in mathematics and neuroscience using co-authorship networks. Their paper shows how information exchange that derives in scientific cooperation is achieved in communities of scientists that form tightly connected clusters Although their analysis has a particular domain focus on scientometrics, its methodologies can be extended to other types of networks. Unlike Barabási et al. [
54], we used a random graph model [
55] instead of a scale-free network model, as our dataset provided no information that allowed us to gauge the importance of a node, such as the size of the operation or its revenue. In this sense we lost the most important component of a scale-free network: real data that would allow us to infer preferential attachment. Thus, we could not identify which nodes had more actual connections or which nodes could attract more connections.
Our analysis looked at five features of the network at the micro and meso levels. At the micro level, that is the node or farmer level, we used three network statistics: average degree, average shortest path, and closeness. These measures revealed statistical properties of the nodes that pointed towards the role of being more connected to other nodes as well as the role that each node plays in the network. At the meso level, that is the mid-level between nodes and network, we studied the clustering coefficient and the relative size of the largest cluster. With these measures, we studied the formation of clusters in the network and the size of the largest cluster.
It is important to note that our inferred network was not directed. Thus, an edge between two farmers lacks a directionality that can be interpreted as a farmer sending a communication or a friend request or an advisory request. Instead, for our undirected network, we assumed two farmers were connected, which could mean that they know each other, that they are friends, or that they collaborate or exchange information.
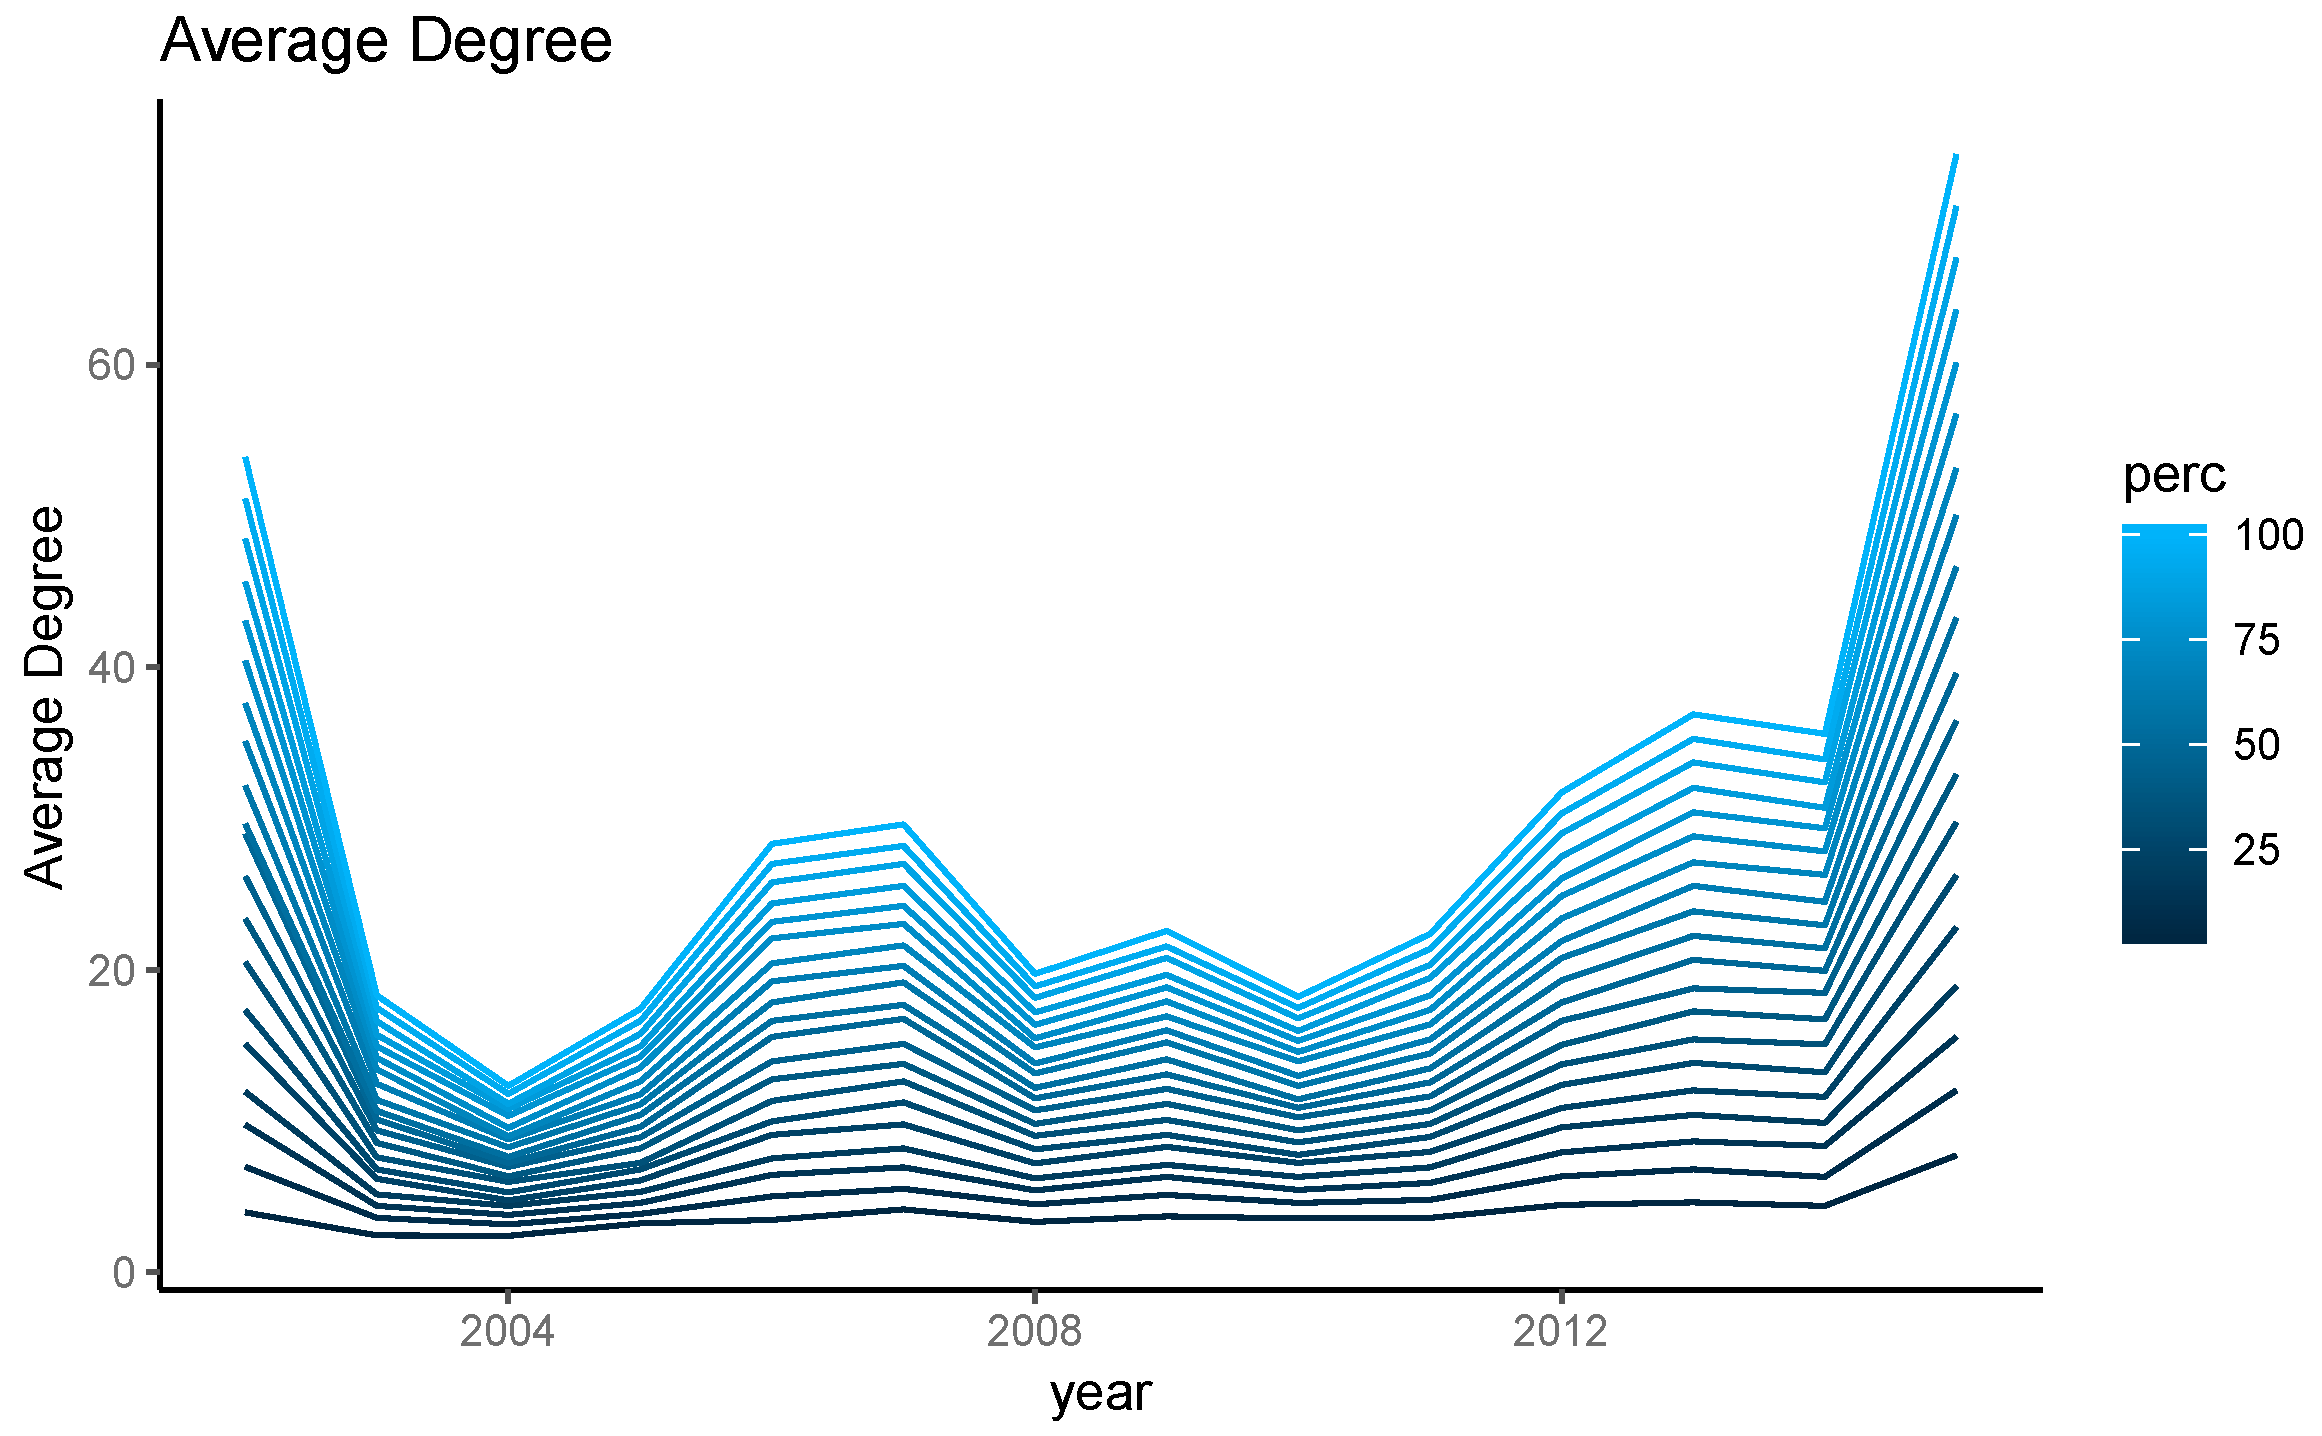
2.3.1. Average Degree
The average degree
is a measure of the average number of connections of each node
[
42]. It is computed in the case of an undirected network as shown in Equation (2). That is, for each node one counts the number of connections it has and then takes the sum of those connections divided by the total number of nodes. As a network becomes more interconnected, each node will have a greater number of connections. In our example, this shows how connections among farmers change over time as the organic dairy industry evolves.
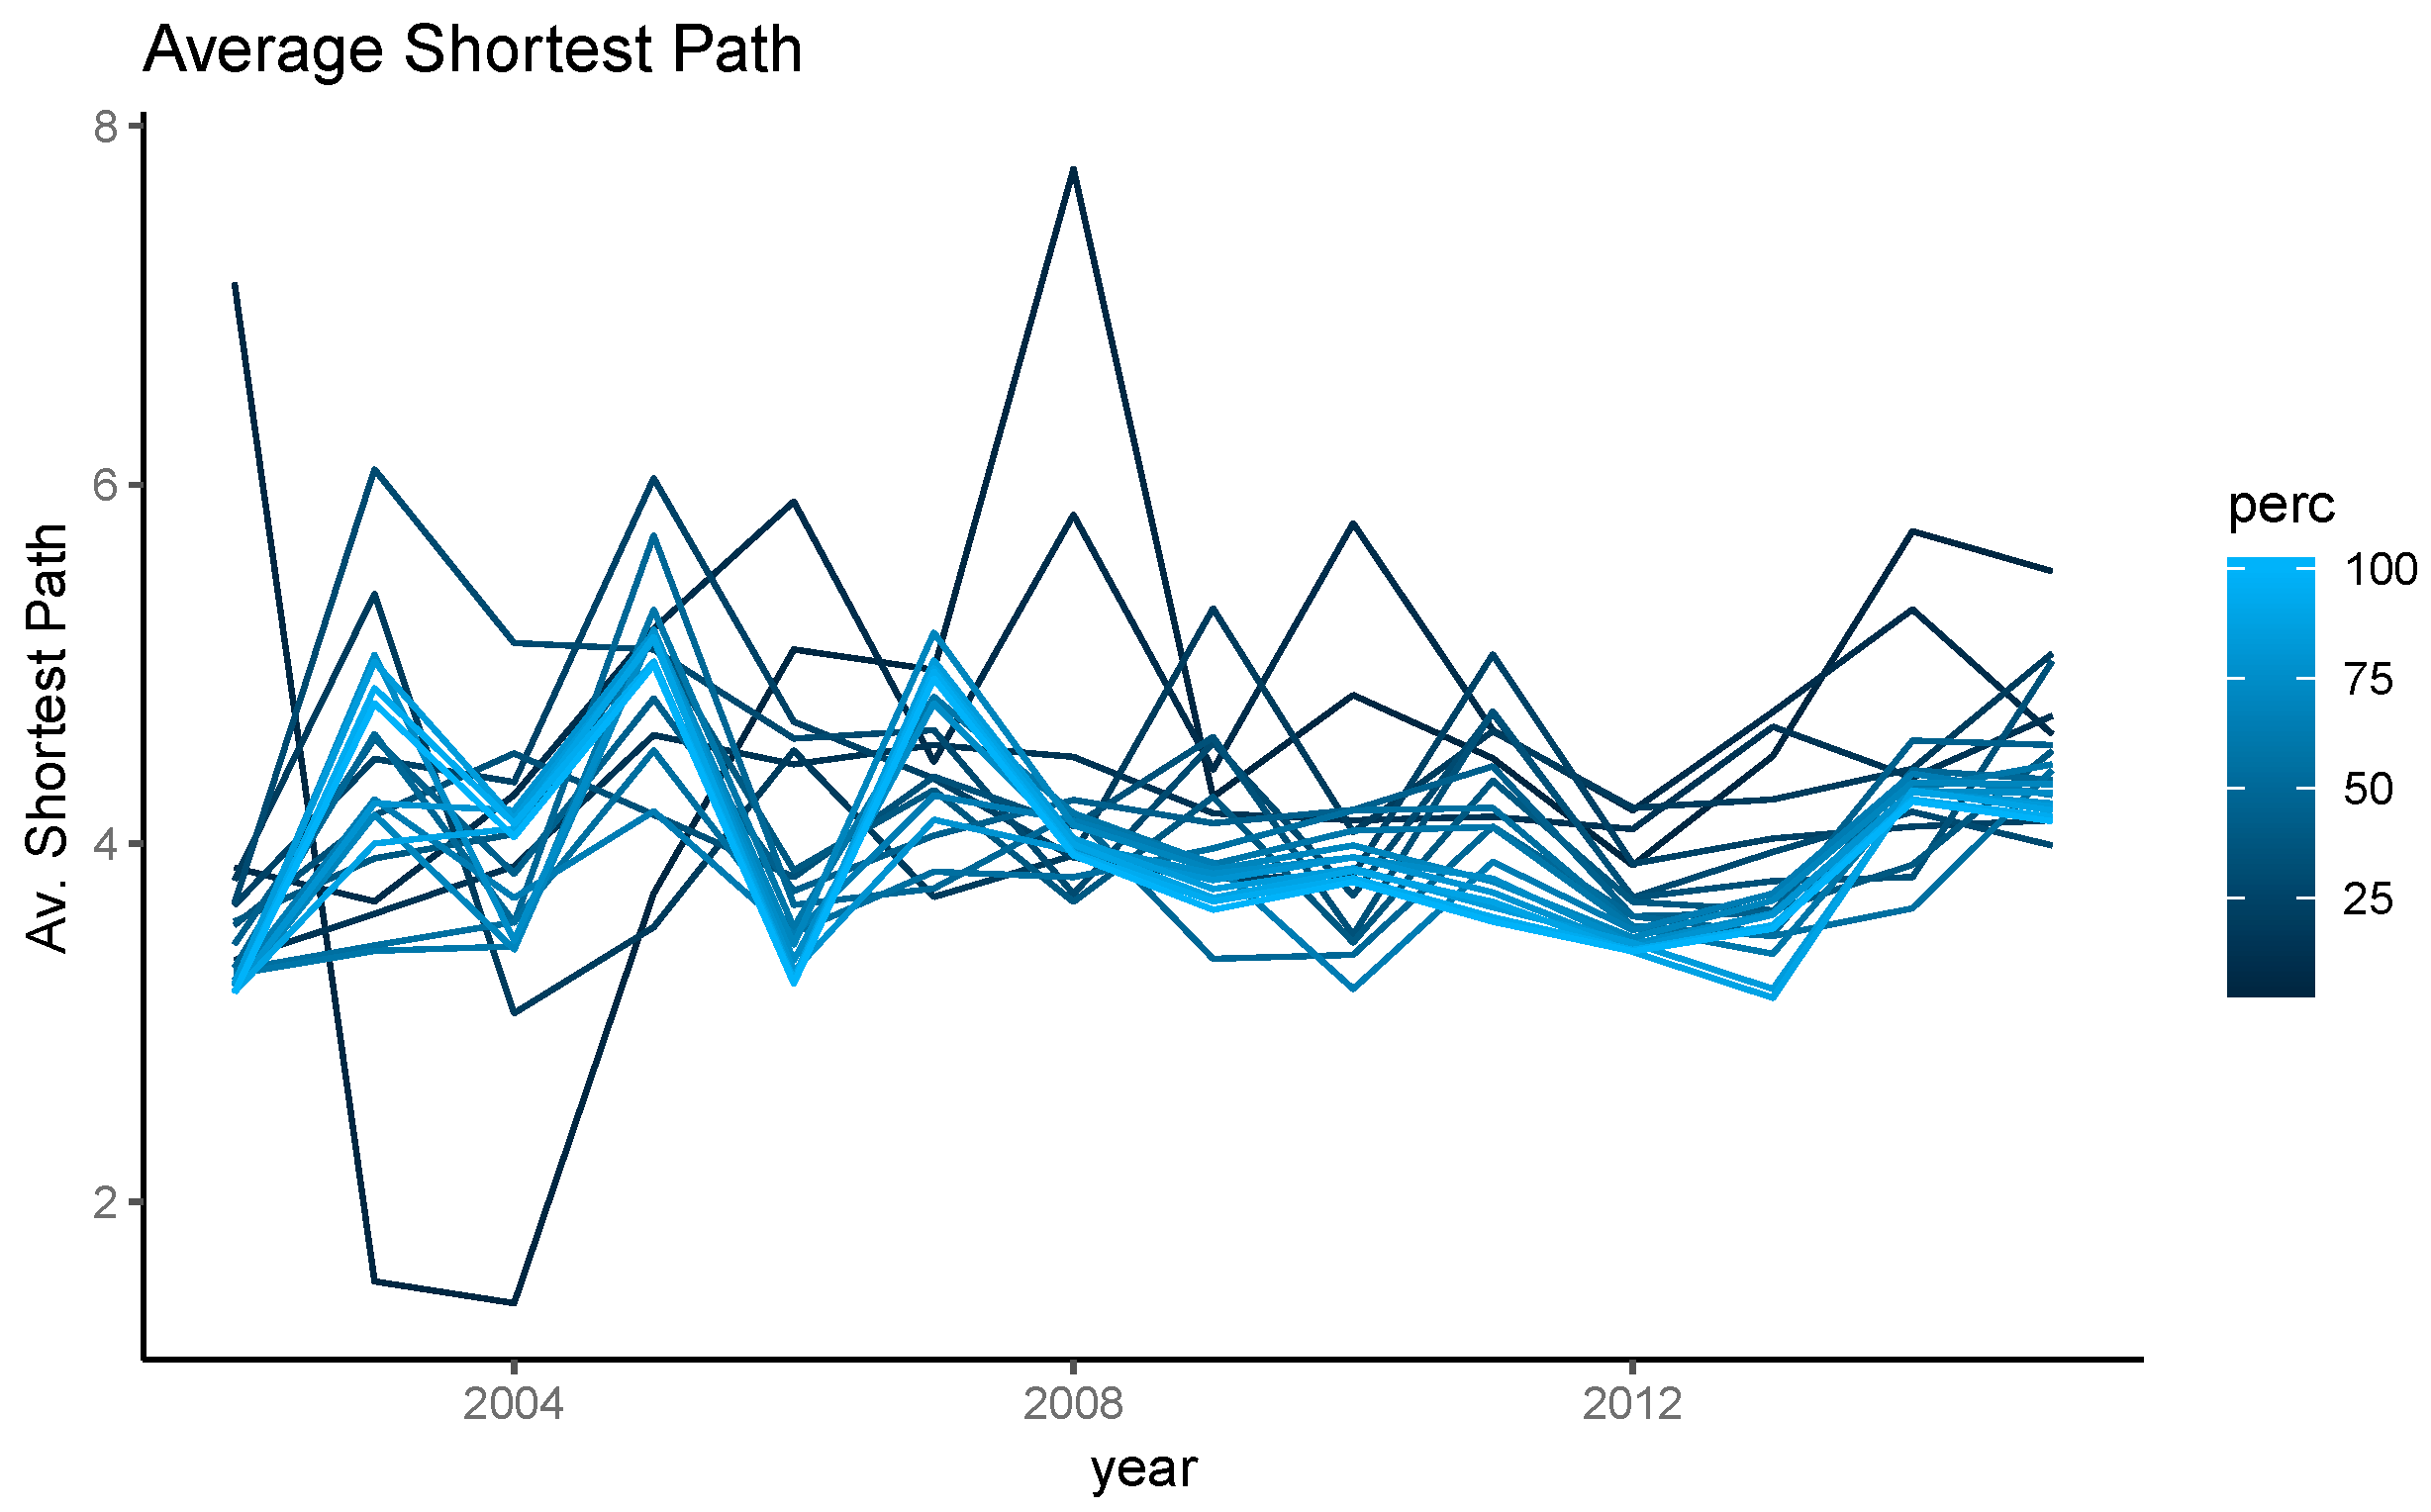
2.3.2. Average Shortest Path
One of the most intuitive statistics of network cohesion is the shortest path, which is a measure of separation between a random pair of nodes in the network. It can be interpreted in this network as the minimum number of farmers that a random farmer (
) who tries to reach another farmer (
) needs to go through. This measure is widely used and well known outside the network analysis community [
56]. The popularized version of this concept, attributed to the writer Frigyes Karinthy, is that any two people in the world can connect to one another by going through only six degrees of separation, that is, if you want to connect with anyone in the world you will need to go, on average, through only six other people asking them to connect you with the person you have in mind. A study that used Facebook data to find out whether this holds true or not found that the actual degree may be smaller, closer to four degrees [
57].
The average separation is formally defined as: “The ability of two nodes,
and
, to communicate with each other (that) depends on the length of the shortest path,
, between them. The average of
over all pairs of nodes is denoted by d =
and we call it the average separation of the network, characterizing the networks interconnectedness” [
54]. The length, in this case is the minimum number of nodes that separate
and
. This measure reflects whether the organic dairy farmer network is becoming more tightly connected, which would result in a declining average shortest path over time. A decline would reflect that new entrants are clustering in the same regions.
Since the simulated networks place a geographical restriction on the connections between two nodes and , the average shortest path does not consider connections between nodes that belong to different connected components. That is, the average shortest path between two nodes is calculated only if those two nodes and have the possibility to connect either directly, or by going through other connected nodes. It is important to note that the length of the shortest path, , is not a measure of geographical distance. For example, the length of the shortest path between and , in which connects to k, and k connects to j is 1 but in the case of the simulated networks the geographical distance between and varies between 0 and 100 miles.
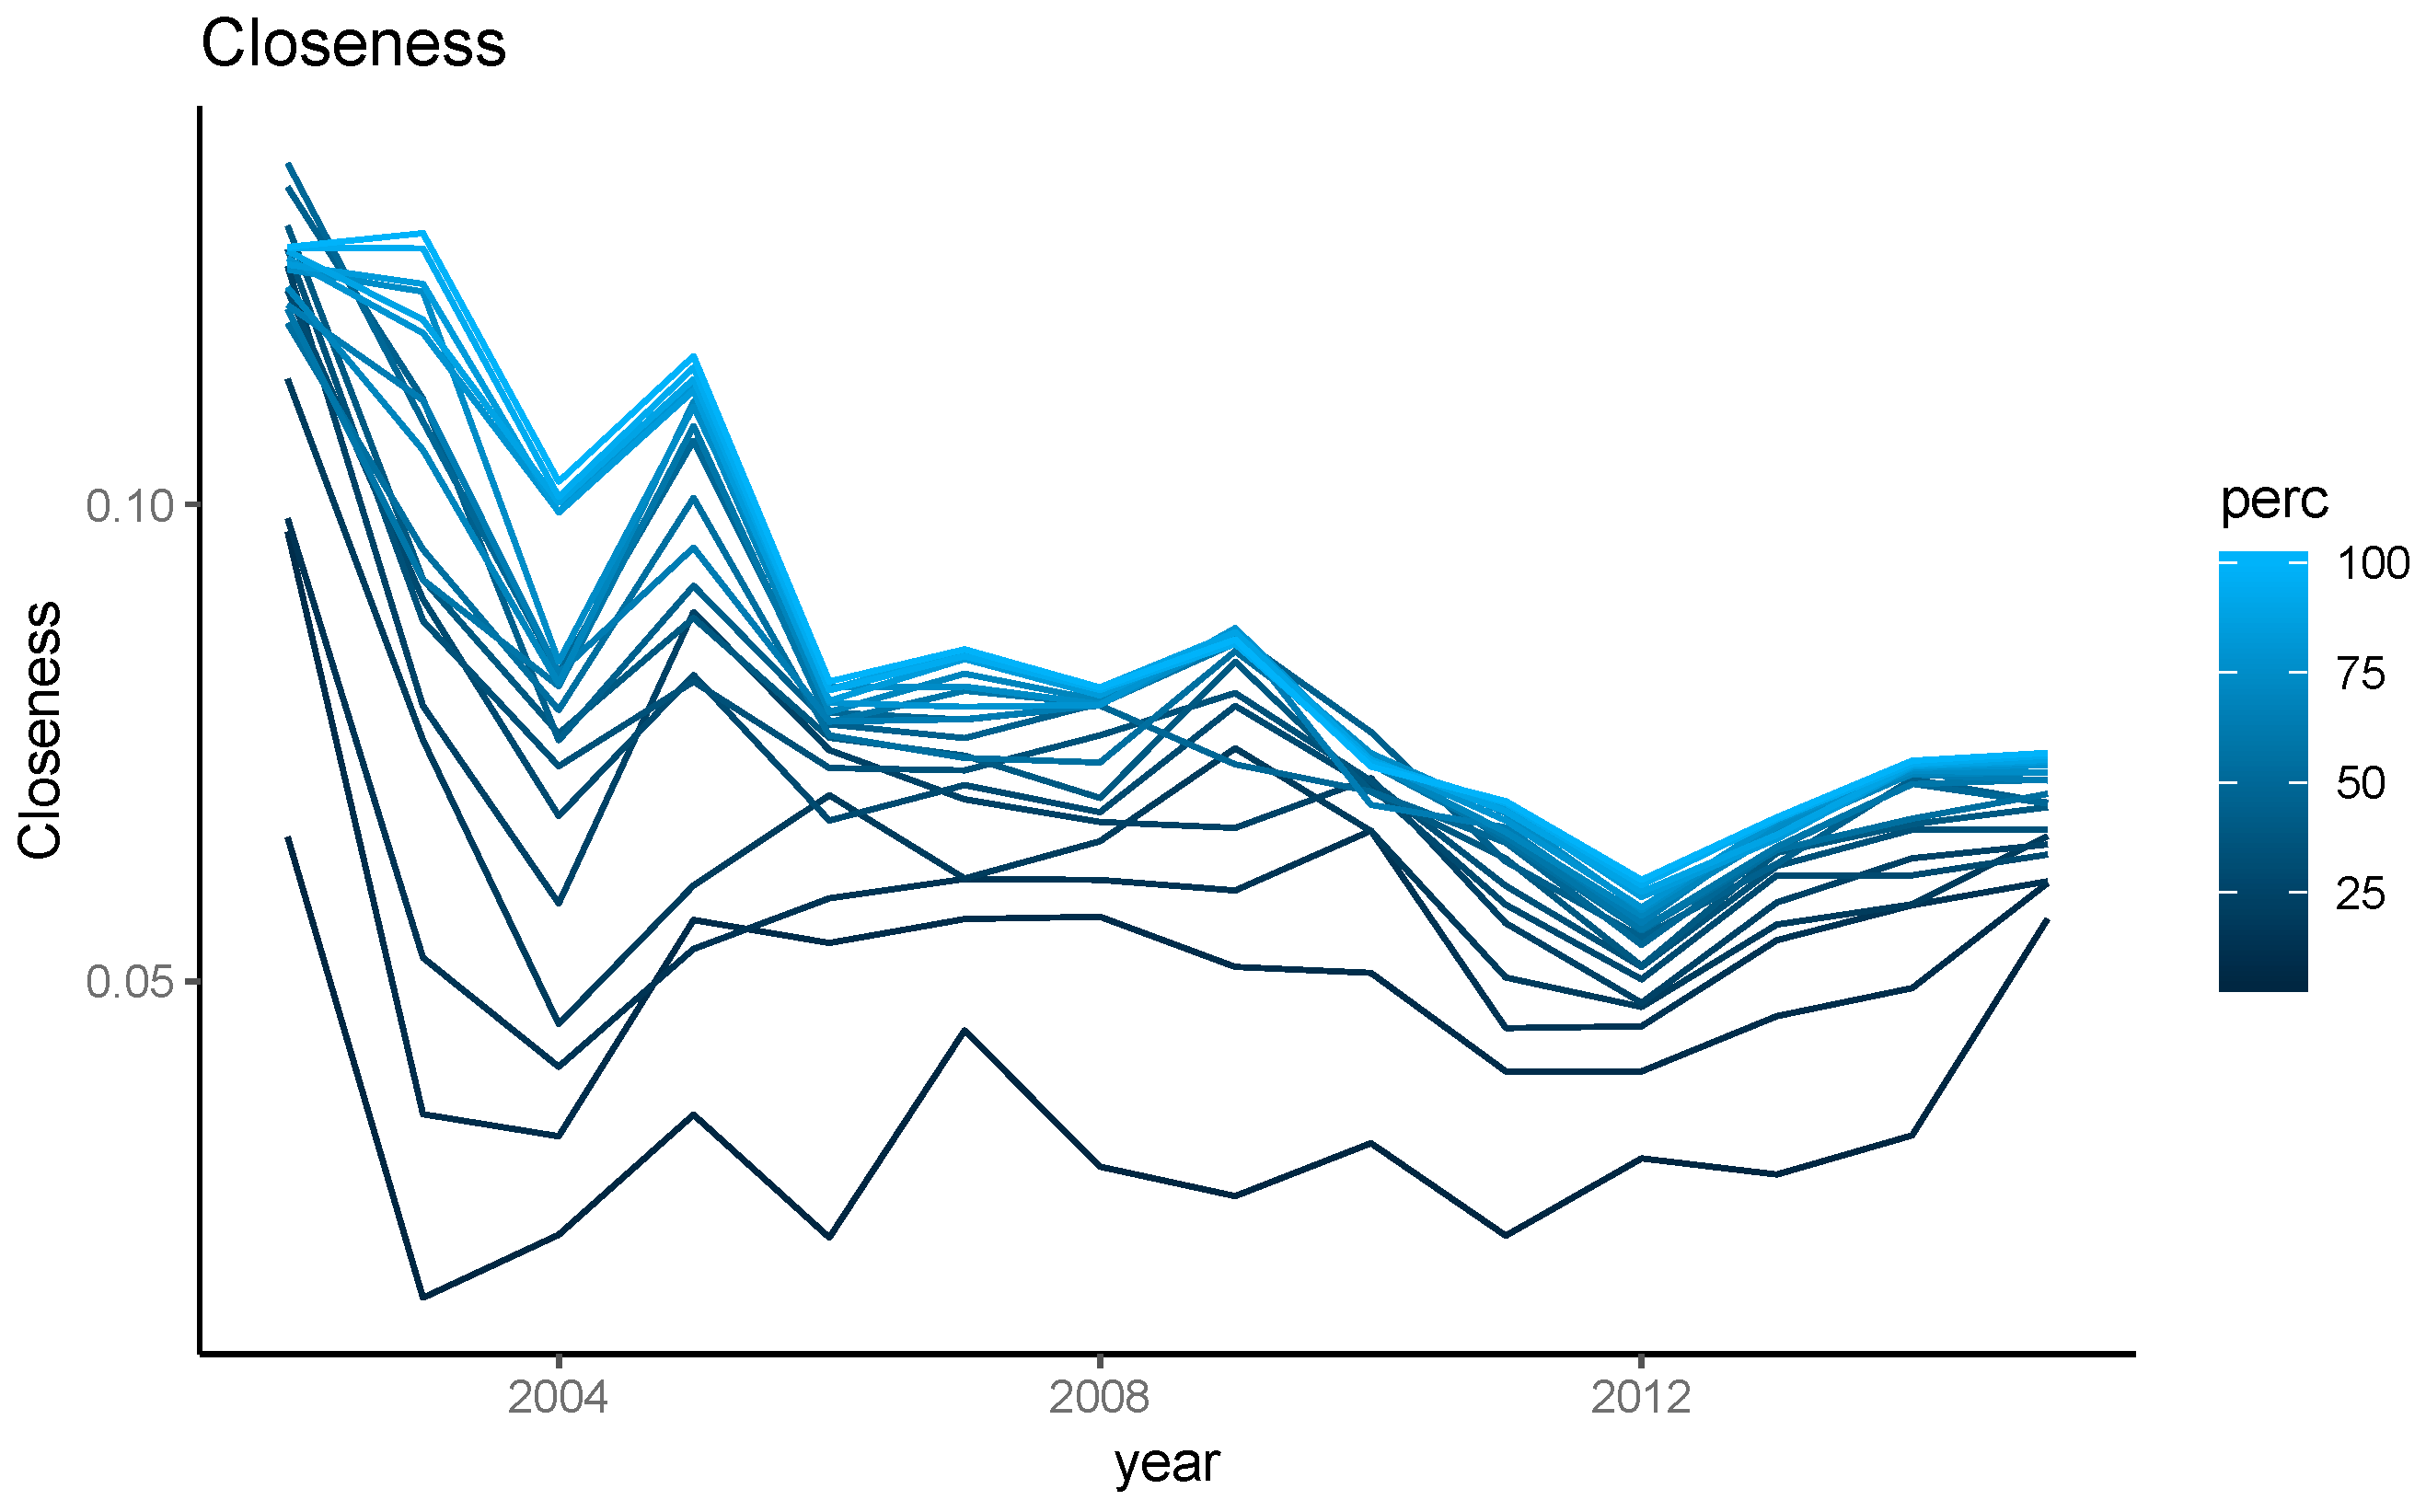
2.3.3. Closeness (Centrality)
Another measure that is derived from the shortest path is closeness. This node level measure counts the number of shortest paths that cross a given node. That is, for every node
we count the number of shortest paths
that go through the given node. This measure is used to infer power or centrality (Equation (3)). The notion behind this is that if one node is on the shortest path between others, it has a privileged position as those two nodes that want to connect will have to go through it, this measure is computed using the following equation:
where “the nodes in a network
N [are] labeled 1...n. For a node
i, let
nk(i) be the number of nodes at distance
k from
i” [
58].
One challenge of this measure is that it assumes that every node is connected to one another, that is, there is no isolated node, which is not the case for our network. For this reason, we used a variation of the closeness measure (Equation (4)) that is correlated with the original one and is fit to study disconnected networks [
58]. This equation calculates a score for each node and then inversely normalizes it to make comparisons among nodes possible:
In this measure, “1 is a most central node in the network. The index can take values between zero and one, with the minimum value zero being obtained when all nodes have the same centrality value, for example if the network is a clique. A highly centralized network is one in which the most central node, 1, has high degree and is connected to relatively distinct groups” [
58].
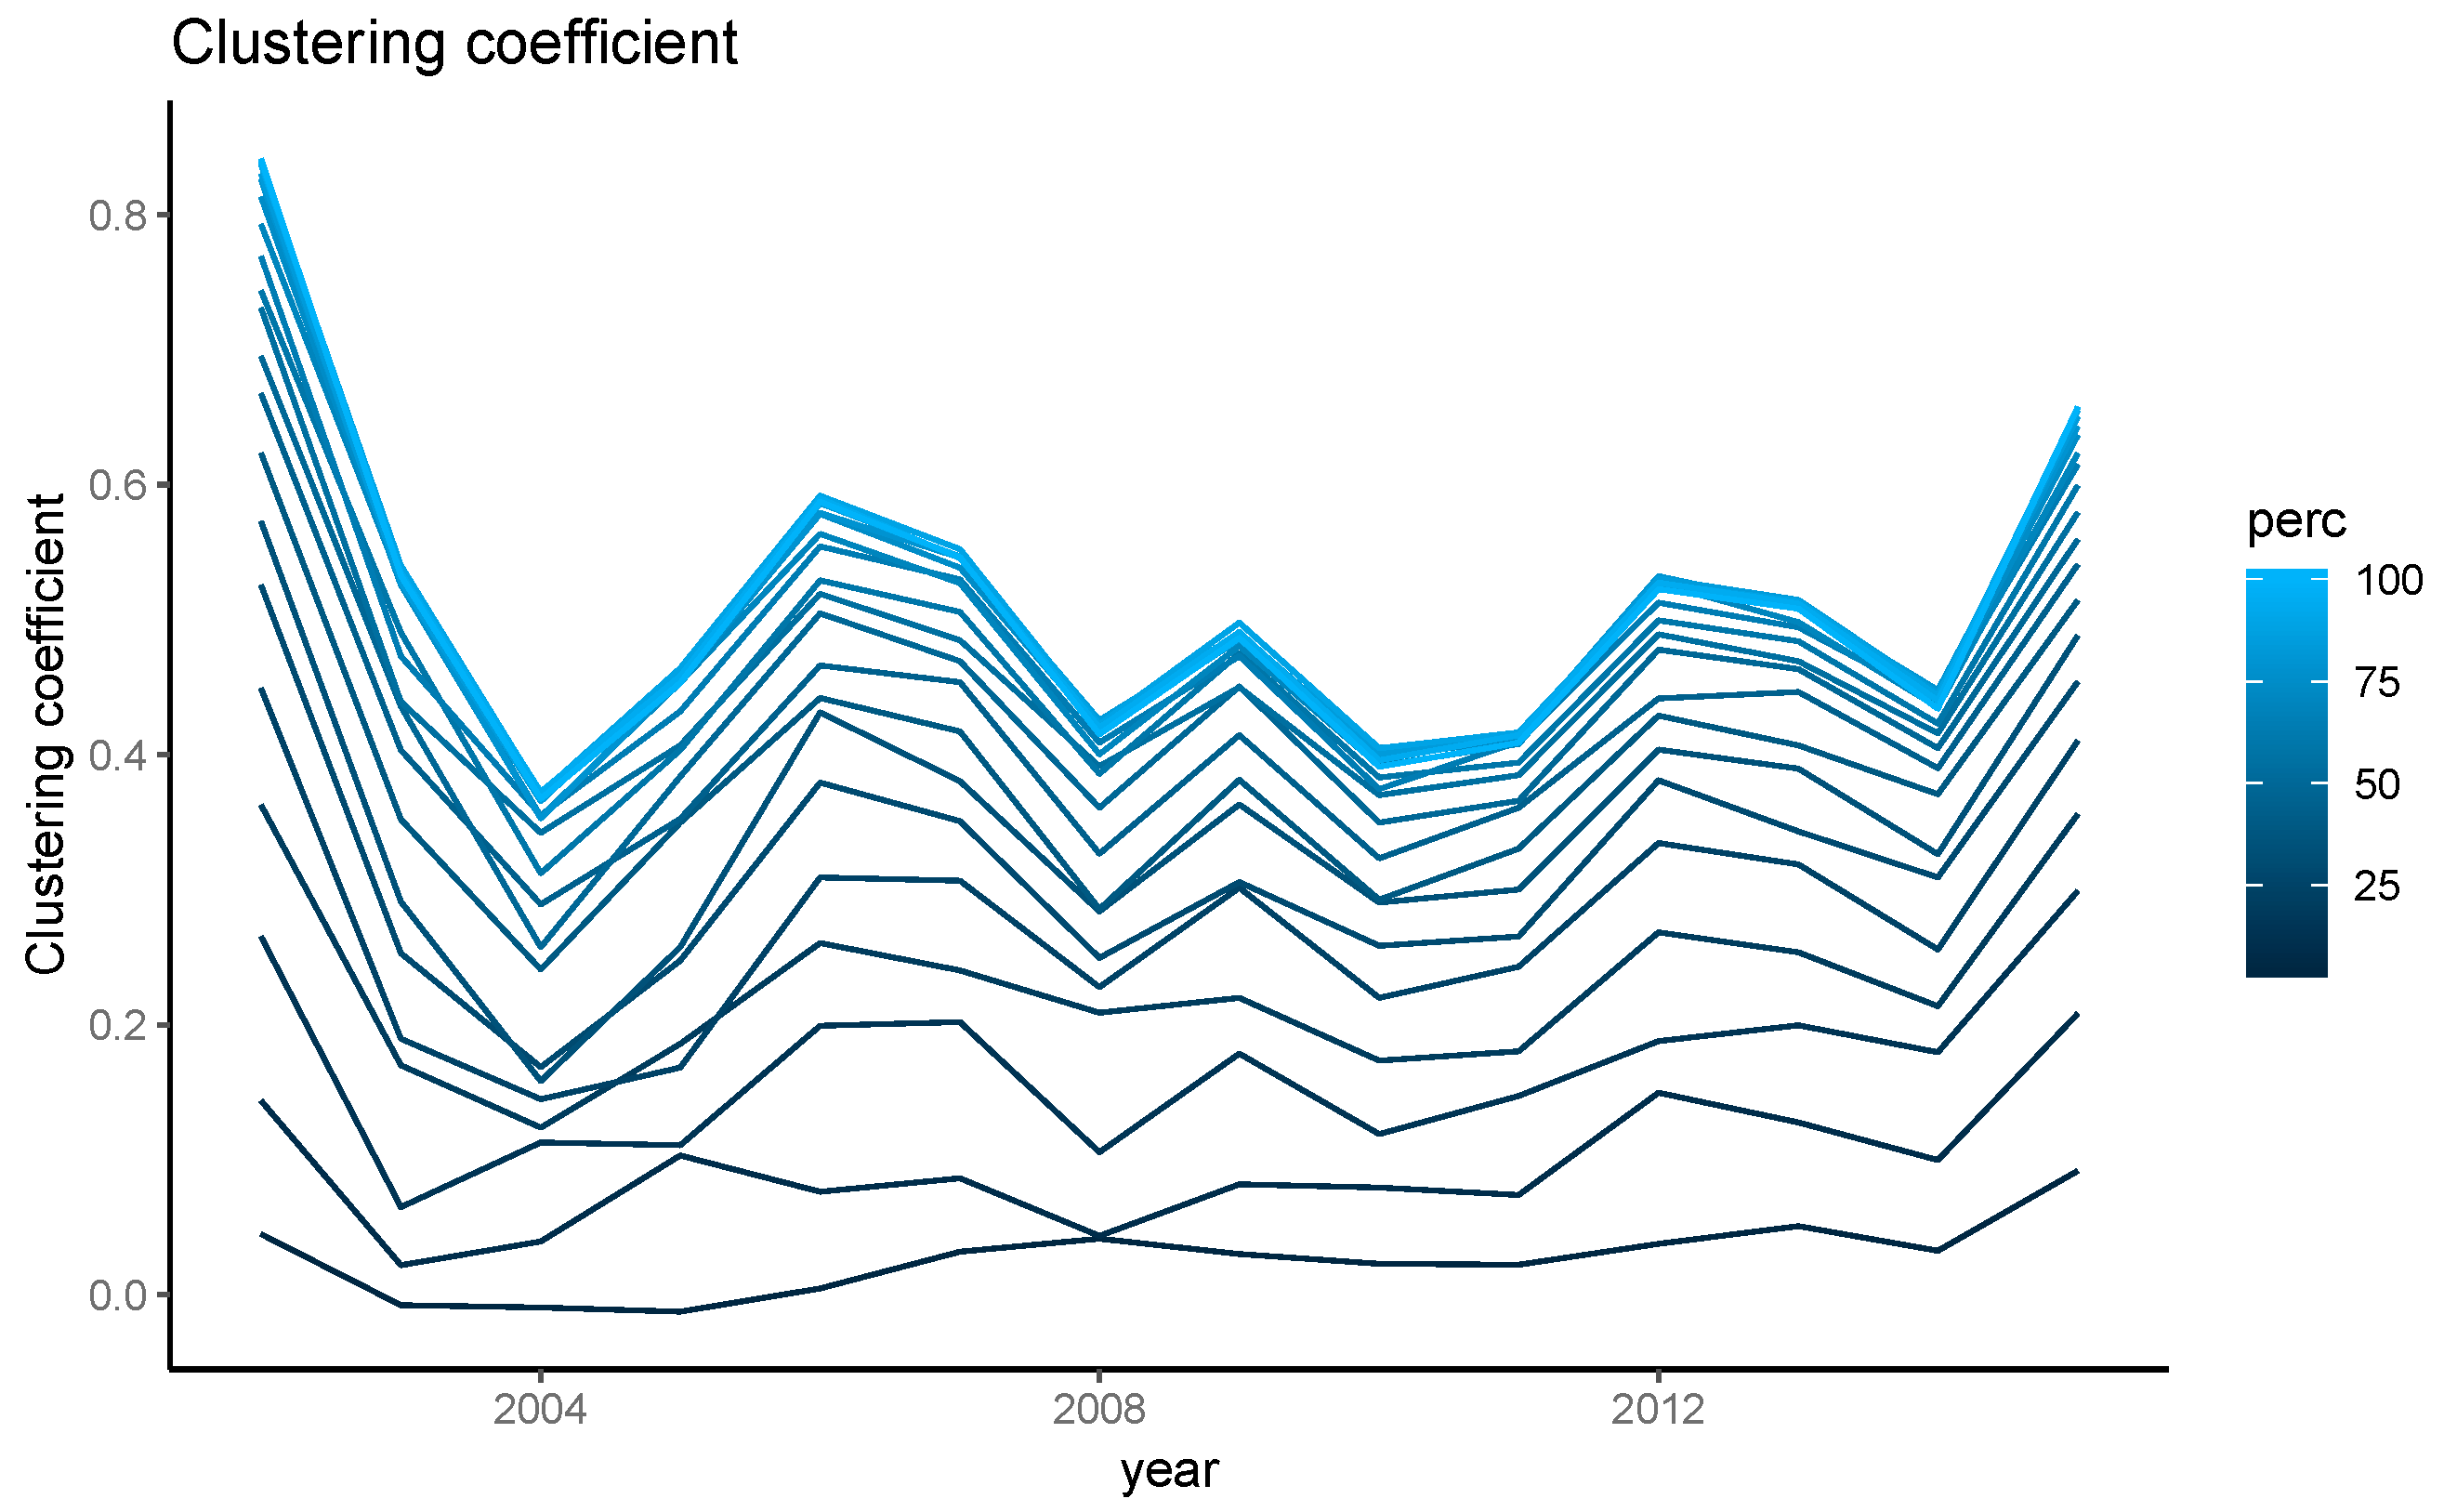
2.3.4. Clustering Coefficient
The clustering coefficient measures the average probability, over the entire network, that the two closest nodes of a nearest neighbor node are connected. In a more intuitive way, it seeks to capture the formation of triads in a network, that is groups of three nodes that are interconnected among them reflecting the fact that communities form as their nodes become more connected with each other. We used a clustering measure that corrected for autocorrelation [
59,
60] with the following equation:
where “
,
,
, [are tie variables] defined as the dichotomous (0/1) indicators of the existence of the ties
, and
respectively.” [
59].
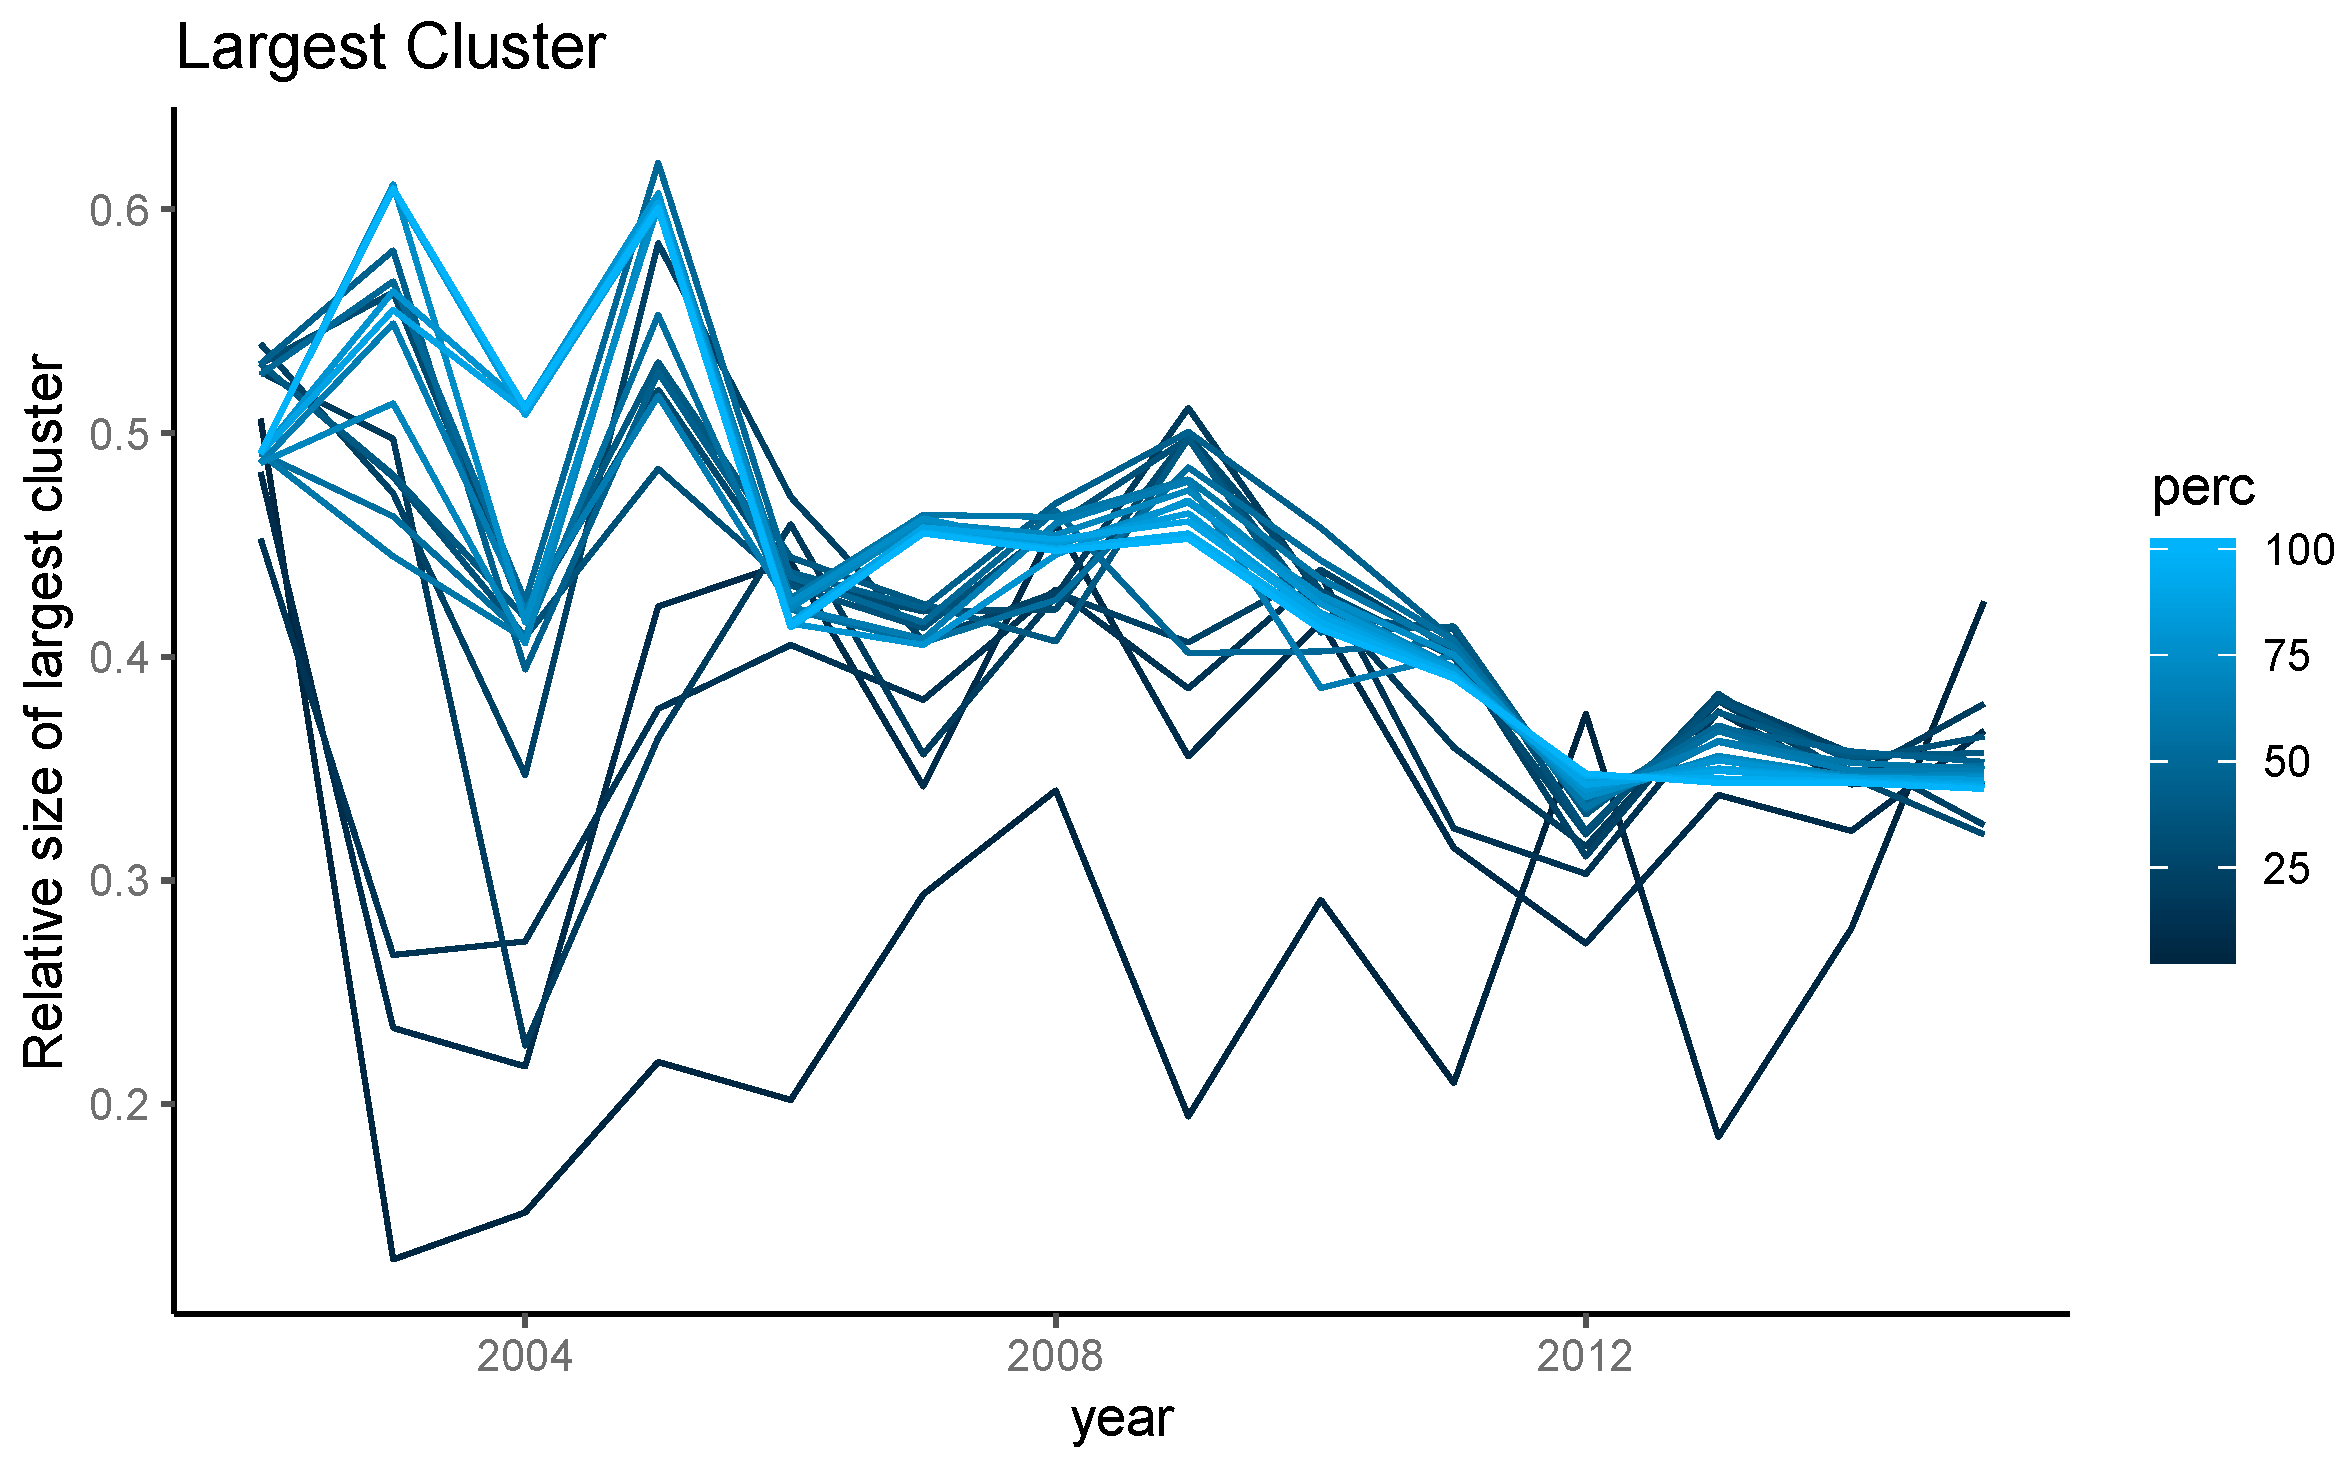
2.3.5. Relative Size of the Largest Cluster
The relative size of the largest cluster is a highly intuitive network statistic that is obtained by dividing the number of nodes that form the largest cluster, a group of connected nodes that has the largest number of nodes, by the total number of nodes in the network. Intuitively, if the relative size of the largest cluster increases, it means that the largest cluster is becoming more important in relation to the network. In a network that becomes more connected over time, one expects this number to increase as the largest cluster gains nodes, further attracting new nodes. The computational estimation of the largest cluster, also known as largest component, is a topic of research in Computer Science as it can take a long time for extremely large graphs, therefore new algorithms are developed in order to make it faster [
61,
62]. This reference [
63] provides the earliest algorithm implementation to find the largest cluster, dating back to 1972. The intuition is to start from a random node and move to another one that is connected to the starting node, one repeats this process and keeps in memory the number of nodes until there are no more nodes to hop on to. One repeats this process starting at every node of the graph and compares the number of nodes with the new one until one reaches the maximum number. Then one divides the largest number of nodes by the total number of nodes in the network.
2.4. Limitations
This study has four main limitations. First, given the limited nature of the dataset, which contains only a list of organic dairy certification with information on the certifier and certified for which an address was provided, our study does not intend to provide an exact estimate of the real connections and cooperation between farmers. We modeled those connections using geographical boundaries which are based on empirical evidence stating that social networks are usually localized [
44,
57] however we are aware that some collaborations may occur in distances beyond 50-mile radiuses, particularly with the use of internet. If data on real world connections among organic dairy farmers is collected, we could test and compare our results, nevertheless we are not aware of the existence of such datasets.
Second, our dataset does not reflect the size or revenue of the operations. Thus, we treated every node equally. This could bias our results towards areas in which there are larger quantities of operations at a smaller scale. Potentially the areas in which there are large operations may not be as attractive for new entrants. Due to the nature of the dataset we could not control for this.
Third, further research is needed to isolate the effect of networking in the adoption of organic dairy production in order to control for the weather, land characteristics, and economic effects such as income. We recognize that there are other characteristics that may attract new farmers to an area, however there is empirical and theoretical evidence that supports that collaborations and knowledge sharing do in fact correlate with geographical distance [
13,
14,
17]. This evidence is also found in studies using network analysis [
64,
65,
66].
Fourth, the inclusion of dairy handler facilities, distribution centers, supermarkets, and consumer density may provide a better understanding of the geo-localization problem of new organic dairy operations as these factors may contribute to this decision, particularly in the case of new operations as opposed to operations that transitioned from conventional into organic.
4. Conclusions
This paper adds both to the applied economics literature that examines how new agricultural markets develop over time and the literature on the organic markets, as well as to the literature on social network theory. The results provide evidence, from both a visual and statistical point of view, that the location of new organic dairy operations reflects advantages from clustering around existing operations. These effects may partially explain the slow adoption of organic dairy in the United States despite it being more profitable than conventional dairy.
Following this idea, in order to further the growth of organic dairy operations we believe that a successful food policy would foster cooperation and information sharing between existing organic dairy farmers and prospective new organic dairy operations. There is some evidence of grassroots organizations and organic certifiers providing a forum for peer mentoring of new and potential organic farmers, but more formal policy or increased funding might facilitate the expansion of peer networks. An example of such a policy is improving the extension services for organic farmers, for example, through the appointment of agents that specialize in organic farming to provide assistance to farmers interested in transitioning to organic. Potential publicly funded policies enhancing peer mentoring and expansion of organic extension would likely be complementary to existing private sector support of the organic sector, such as the current private sector collaboration between General Mills and Organic Valley which aims to increase the supply of organic milk [
68].
This paper provides a new way of examining the evolution of the organic dairy farm sector, as well as presenting a novel application of social network theory. These two contributions to the literature are possible despite the limitation of having no data reflecting real connections among organic dairy farmers. We find that use of geo-location is a reasonable proxy for social phenomena occurring from proximity to other social agents. For applied research examining the evolution of agricultural markets, obtaining a longitudinal dataset of connections among farmers is cost prohibitive, necessitating using an alternative method such as the inferred networks simulated in this paper. We hope that this methodology encourages other researchers to study social networks by modeling relations between actors based on location and thus overcome the common problems arising from lack of data on real world connections between social actors.


