Article

Quantitative Research on Global Terrorist Attacks and Terrorist Attack Classification

1
State Key Laboratory of Mathematical Engineering and Advanced Computing, Zhengzhou 45000, China
2
Chinese Academy of Finance and Development, Central University of Finance and Economics, Beijing 100081, China
3
Faculty of Applied Science, University of Regina, Regina, SK S4S0A2, Canada
4
School of Automation, Northwestern Polytechnical University, Xi’an 710072, China
5
Institute of Guangdong Hong Kong and Macao Development Studies, Sun Yat-sen University, Guangzhou 510275, China
*
Author to whom correspondence should be addressed.
Sustainability 2019, 11(5), 1487; https://doi.org/10.3390/su11051487
Submission received: 25 December 2018 / Revised: 4 March 2019 / Accepted: 4 March 2019 / Published: 11 March 2019
(This article belongs to the Section Sustainability in Geographic Science)

Abstract

:
Terrorist attacks are events which hinder the development of a region. Before the terrorist attacks, we need to conduct a graded evaluation of the terrorist attacks. After getting the level of terrorist attacks, we can fight terrorist organizations more effectively. This paper builds rating models for terrorist attacks, hidden or emerging terrorist organization classification discovery models, terrorist organization alliance network models and more, through quantitative research of the Global Terrorism Database, which solved the event classification. Through studying relevant literature and the variables of the Global Terrorism Database, this paper sorted out 25 observation variables related to the impact level (level of harm) of terrorist attacks. By establishing a mathematical model of factor analysis, 11 factors related to the impact level (level of harm) of terrorist attacks were constructed, and the variance of the contribution of each factor was used as the weight to calculate the comprehensive rate of the impact level of each terrorist attack. Finally, K-means clustering method is used to cluster and analyze the comprehensive rate of impact level, and the top 10 terrorist attacks with the highest impact level in the past two decades were obtained.

1. Introduction

A terrorist attack is an attack that is made by extremists or organizations, and is not limited to civilians and civilian facilities, nor is it in line with international morality. It is not only extremely devastating and destructive, but it also directly causes huge casualties and property losses. It also brings great psychological pressure on people, causing a certain turmoil in society, hindering normal work and life, and thus greatly hindering the development of social economy.
Terrorism is a common threat to people. Combating terrorism is the responsibility of every country and citizen. In-depth studies and analysis of data related to terrorist attacks will help us deepen our understanding of terrorism, and provide valuable information support for counter-terrorism and anti-terrorism.
Criminology has only recently become more open to the study of terrorism and political violence [1]. Some maintain that this hesitancy is partly due to the difficulty in defining terrorism, along with challenges in measuring terrorism [2,3]. However, the field is increasingly embracing the study of terrorism in general, and also the study of specific terrorist tactics. In particular, the environmental criminology and SCP branches are increasingly being applied to terrorism [4]. Grading catastrophic events such as earthquakes, traffic accidents, meteorological disasters, etc. is an important task in social management. The general grading generally adopts a subjective method. The authoritative organization or department, select several main indicators and impose grading standards. For example, the classification standards for traffic accidents specified [5] of “China’s Road Traffic Accident Treatment Measures” are mainly based on casualties and economics. The degree of loss is divided. However, the harmfulness of terrorist attacks depends not only on the two aspects of casualties and economic losses, but also on the timing, geography, targeted objects and other factors [6,7,8]. Therefore, it is difficult to form a unified standard by using the above classification method.
In this paper, we propose a comprehensive method for evaluating the harmfulness of terrorist incidents, and sort and classify the harmfulness of terrorist incidents. Because terrorism affects political, economic, cultural, social, religious and other aspects, its complex nature makes it difficult for us to summarize its harmfulness from a few simple indicators. Although, from the statistics of terrorist attacks and through factor analysis, we can sum up the extent of the danger of terrorist attacks. Therefore, based on the terrorist attack database, this chapter firstly combines the risk assessment system initially established in the relevant literature, and further uses the factor analysis method to design a model for quantitative analysis of damage’s degree of terrorist attacks, and uses a K-means cluster analysis method to the comprehensive score of the degree of a hazard, which is clustered to obtain a rating.

2. Terrorist Attack Analysis

The security issues facing the world today mainly involve traditional security and non-traditional security. Traditional security has always been the focus of national security policies. It involves political security, national defense security, national territorial sovereignty security, regime security and other important contents [9,10,11,12]. Since the 21st century, it has become more urgent to guard against non-traditional security threats, including fighting terrorism, ensuring economic and financial security, combating smuggling and drug trafficking, anti-piracy, and preventing the spread of large-scale transnational infectious diseases [13,14,15,16]. Non-traditional security factors are sometimes intertwined with traditional security factors, making the international security situation more complex. Although the possibility of a world war is small, security problems such as terrorist attacks have led to a decline in the sense of security of many countries, and a rise in the sense of insecurity of many people [16,17,18]. Local areas have been plunged into turmoil and conflicts for a long time due to frequent terrorist activities, which have seriously affected the sustainable development of local society. No responsible government can ignore this worrying situation. How to prevent and combat terrorists in the light of national and regional conditions, the current world situation, as well as how to better build a sustainable and secure environment, and make the earth a home for peaceful development has become a common concern of people of all countries. In response to this practical concern, this paper studies the rules of global terrorist attacks and the distribution of terrorist organizations’ networks through quantitative models, so as to provide effective clues, information and strategies for governments of all countries to jointly combat terrorist organizations and promote the peace, security and sustainable development of the international community.
As shown in Figure 1, the shades of color indicate the number of terrorist attacks in various countries around the world from 1998 to 2017. The darker the color, the more terrorist attacks a country has suffered.
Terrorist attacks are a serious social problem. The greater the harm of a terrorist attack, the greater the social impact. However, the assessment of the level of danger of a terrorist attack is not limited to the property damage and casualties caused by the terrorist attack, but other factors should also be considered. In this paper, we conducted a grade evaluation of the terrorist attacks that have occurred through factor analysis, and then counted the distribution of terrorist attacks in various countries, and provided some assistance for countries to defend national security in response to terrorist attacks. We also provided a safe and stable environment for the development of the country.
Terrorism refers to the idea and behavior of creating social panic, endangering public security, infringing on personal and property, or coercing state organs and international organizations to achieve their political and ideological purposes by means of violence, destruction and intimidation.
For a long time, terrorism, marked by its bloody violence, has caused chaos and social unrest in many parts of the world. Although the number of people engaged in terrorist activities is but a small handful, due to the characteristics of terrorist activities, the harm caused by these activities is far greater than that caused by ordinary criminal violence crimes, as they also affect political, economic, military, diplomatic, international relations and other fields.
The main hazards of terrorism include affecting the security of neighboring countries, seriously undermining national harmony and causing social unrest, greatly hindering the economic development and social progress of countries, affecting the image of secular governments of some countries, causing political instability and social unrest, undermining the peace and development of the world, and so on.

3. Model Establishment

3.1. Factor Analysis Model

The harmfulness of terrorism is affected by different factors, so key evaluation indicators should be identified before conducting a hazard assessment. The harm of terrorist attacks depends not only on the two aspects of casualties and economic losses, but also on the timing, geographical location, targeted targets and many other factors. Therefore, with this research, we want to establish a more objective and complete evaluation index system, which can not only reflect the direct losses caused by terrorist attacks, but also take into account the potential harms caused by terrorist attacks, including politics, religion and society. Lastly, in this section we used the factor analysis and techniques in multivariate statistical analysis to establish a risk assessment model. The results can provide a reference for terrorism hazard assessment.
Factor analysis [19,20] is a multivariate statistical analysis method. The core idea is data transformation and dimensionality reduction. The intricate variables are integrated into a few main factors for problem interpretation or comprehensive evaluation. It can explain most of the original variables with a small number of potential factors. The starting point of factor analysis is the correlation matrix of the original variables. Factor analysis can eliminate the correlation between variables. By mathematically transforming the terrorist attack risk indicators into several factors, the main factor is selected according to certain criteria, and the national terrorist attack risk comprehensive score is obtained. At the same time, the factor does not need to subjectively determine the index weight. Instead, the weights are automatically obtained based on the observations of the sample data, so subjective factors can be eliminated and objective evaluation results can be provided.

3.2. Mathematical Model

Suppose there are p variables: x1, x2, x3, ···, xp. After normalization, the mean value of the variable is 0 and the standard deviation is 1. Each variable can be represented by a linear combination of k (k < p) factors f1, f2, f3, ···, fk. Then the mathematical model can be established as follows [10]:
x 1 = a 11 f 1 + a 12 f 2 + + a 1 k f k x 2 = a 21 f 1 + a 22 f 2 + + a 2 k f k x p = a p 1 f 1 + a p 2 f 2 + + a p k f k
The model can also be represented in matrix form:
A = [ a 11 a 12 a 1 k a 21 a 22 a 2 k a 31 a 32 a 3 k a p 1 a p 2 a p k ]
where F is the common factor, X is the normalized original variable, A is the factor load matrix and (i = 1, 2, …, p; j = 1, 2, …, k), is the covariance of the sum, The larger the absolute value, the greater the dependency.

3.3. Factor Load

The factorization load matrix can be solved by least squares method, maximum likelihood method, main axis factor method, principal component method, etc. The principal component method is used in this paper. The calculation process is as follows:
(1)
Data standardization;
(2)
Calculating the original sample covariance matrix;
(3)
Solving the non-zero eigenvalues of the covariance matrix, and sorting, the corresponding unit orthogonalization eigenvectors e i (i = 1, 2, …, p)
(4)
Calculate the factor load matrix, assuming k < p, then A = ( λ 1 e 1 , λ 2 e 2 , λ 3 e 3 , , λ k e k ) .

3.4. Factor Rotation

After the original variables are combined into a few factors, if the factors are vague, it is not conducive to further explain and evaluate. Therefore, a linear combination of the initial common factors, that is, a factor rotation, gives the composite factor a specific meaning. The factor rotation is divided into orthogonal rotation and non-orthogonal rotation. The factor rotation ensures that the new factor is closer to zero, or farther away from zero. When the load is close to zero, it indicates that the common factor and correlation are weak, and close to 1 indicates a strong correlation. Therefore, after factor rotation, the practical meaning of the common factor is more explicit. Here we used the orthogonal rotation maximum variance method.
The maximum variance method maximizes the variance of the common factor variable load by rotation, so that the load coefficient of some variables on the factor changes toward the maximum or minimum direction, ensuring that there is no or little medium-sized load, thus making the meaning of the factor more specific and convenient.

4. Model Solving

4.1. Establishment of Indicator System

Terrorist attacks are rooted in conflicts brought about by historical, political, economic, cultural and religious conflicts. The network and resources of terrorist organizations and the measurement of the cost-effectiveness of terrorist attacks will affect the choice of terrorist attacks, which in turn will affect the extent of the consequences of terrorist attacks. Therefore, in combination with the terrorism database, the analysis of the factors affecting the extent of terrorist attacks using weapons, regional characteristics, targets, death levels, and using certain methods, can achieve quantitative analysis of the damage caused by terrorist attacks that have occurred. To achieve a more scientific and rational rating of the harm to terrorist incidents, the following principles should be followed in the establishment of a terrorist attack risk assessment indicator system:
1 Representative principle
The harmfulness of terrorist activities is reflected in personal injury, property damage, social impact and so on. In the selection of indicators, the typicality and representativeness of the indicators should be taken into consideration, which can play a key role in assessing the risk of terrorism.
2 Scientific principles
The selected indicators have an intrinsic logical relationship with each other, ensuring that each indicator must be a concrete manifestation of a certain dimension of harm; secondly, the indicators should be coordinated to ensure that they do not overlap each other.
3 Comprehensiveness
The hazards of terrorism include both direct and indirect aspects, and some of the hazards also have lagging and long-term characteristics. Therefore, when selecting indicators, we must consider the various links and continuous impacts of terrorism. The indicators should form a systematic whole, and the indicators should be logically rigorous and coordinated.
Based on the above principles, through the literature and the global terrorism database (GTD) variables, we compiled 25 observation variables to judge the risk of terrorist attacks as a measure of the extent of the terrorist attack:
Workday: The extent of the terrorist attack is related to the date of occurrence (see Supplementary Materials). If the date of the terrorist attack is from Monday to Friday, the degree of harm is greater than that on Saturday and Sunday. Equal to 1 when the terrorist attack date is Monday to Friday, equal to 0 when the terrorist attack date is Saturday or Sunday.
Crtnum: Indicates the number of criteria for terrorist attacks. The more the criteria for inclusion, the greater the harm of the terrorist attack. Crtnum = Crit1 + crit2 + crit3 + doubter. Crit1: Political, economic, religious or social goals, 1 = “Yes” means that the event satisfies the criterion 1, 0 = “No” i.e. the event does not meet the criterion 1 or does not explicitly indicate that the criterion 1 is met Crit2: Intention to coerce, intimidate or incite more people, 1 = “Yes” means that the event satisfies the standard 2, 0 = “No” means that the event does not meet the criterion 2 or does not explicitly indicate that the criterion 2 is met; crit3: Exceeds international humanitarianism Scope of law, 1 = “Yes” means that the event satisfies the standard 3, 0 = “No” means that the event does not meet the criterion 3; doubterr: suspected of terrorism, 1 = “Yes” that the incident is suspected of being a terrorist act, 0 = “No “There is basically no doubt that the incident is a terrorist act. If this variable is not included in the data collection process, the database will be marked as “−9”.
Relatednum: The number of related events. Equal to the number of events contained in the related variable. If the terrorist incident is associated with multiple terrorist incidents, the impact of the terrorist incident is generally more extensive and sustained, and the resulting harmful effects are more profound.
Region_wealth: The extent of the damage caused by a terrorist attack, especially property damage, is highly correlated with the level of local economic development. 1 indicates three developed regions in North America, Western Europe and Oceania, and 0 is other regions.
City_ornot: The city center has the characteristics of concentrated buildings and large traffic. When terrorist attacks occur in the city center, the casualties are often more serious, the number of property losses is huge, and it may also cause a series of problems such as traffic congestion and mass panic. 1 means in the city center, when the nearby area vicinity = 0; 0 is a non-city, when the nearby area vicinity = 1.
Attacktype_level: Classify the damage degree of the attack type, which is divided into 0, 1, 2, 3, and four levels. The higher the level, the greater the damage degree, 0 means unknown and others. Attacktype_level = 1, when attacktype1 = 8; attacktype_level = 2 when attacktype1 = 1, 4, 5, 6; attacktype_level = 3 when attacktype1 = 3, 2 and 7; attacktype_level = 0, when attacktype1 is equal to the other.
Attacktype_num: Indicates the number of types of attacks on the terrorist attack
Weaptype_level: Grading the degree of damage to the weapon type, divided into 0, 1, 2, three levels, the higher the level, the greater the degree of harm, 0 means unknown and others. If the attacktype1 value in the database is 2, 3, 7, we define it as attacktype_level = 3; if the attacktype1 value in the database is 1, 4, 5, 6, we define it as attacktype_level = 3; if the attacktype1 value in the database is 8, we define it as attacktype_level = 1.
Weaptype_num: Indicates the number of weapons used in this terrorist attack
Targtype_level: Divided into 0, 1, 2, 3, four grades, 0 is the other, 1 is the government, 2 is the public utility, and 3 is the goal directly related to the people. The higher the level, the greater the hazard. According to this standard, if the targtype1 value in the database is 2, 3, 4, 7, we define it as targtype_level = 1; if the targtype1 value in the database is 5, 6, 8, 9, 11, 15, 16, 19, 21, We define it as targtype_level = 2; if the value of targtype1 in the database is 1, 14, 18, we define it as targtype_level = 3;
Targtype_num: Indicates the number of targets/victims of the terrorist attack.
Propextent_level: Divided into 0, 1, 2, 3, four levels, the higher the level, the greater the degree of harm. Propextent_level = 0 when propextent is missing or has a value of 4; propextent_level = 1 when propextent = 3; propextent_level = 2 when propextent = 2; propextent_level = 3 when propextent = 1;
Variable extended, variable multiple, attack success success, suicide attack suicide, victimization or kidnapping victim ishostkid, claimed responsibility, property loss property, international logistics INT_LOG, international ideology INT_IDEO, international miscellaneous INT_MISC, international—Any of the above INT_ANY indicators that reflect the extent of the terrorist attack are consistent with the Global Terrorism Database (GTD).
In addition, the definition of the total number of deaths nkill, the total number of injuries nwound, and the total number of hostage/kidnapping victims nhostkid is consistent with the Global Terrorism Database (GTD). Nkill = 0, nwound = 0, nhostkid = 0, when the original data nhostkid is a missing value.
The above indicators, the larger the value, the higher the damage caused by the terrorist attack.

4.2. KMO Inspection and Bartley Ball Test Results

Prior to factor analysis, the raw data should be tested for suitability factor analysis, namely the Bartlett spherical test and the KMO (Kaiser-Meyer-Olkin) test.
The Bartlett spherical test is based on a matrix of correlation coefficients. Its zero-hypothesis correlation coefficient matrix is a unit matrix, that is, all elements of the diagonal of the correlation coefficient matrix are 1, and all elements on the off-diagonal are zero. The Bartlett spherical test statistic is obtained according to the determinant of the correlation coefficient matrix, which approximates the chi-square distribution. If the chi-square value is significant and P is less than or equal to 0.05, the null hypothesis is rejected, and the original variable is suitable for factor analysis. On the contrary, the null hypothesis is established, there is no correlation between the original variables, and the data is not suitable for principal component analysis.
The Kaiser-Meyer-Olkin test (as shown in Table 1) sampling sufficiency measure is also an important indicator for measuring the correlation between variables, and is obtained by comparing the correlation coefficient and the partial correlation coefficient of the two variables. KMO is between 0 and 1. The higher the KMO, the stronger the commonality of the variables. If the partial correlation coefficient is relatively high relative to the correlation coefficient, the KMO is relatively low, and the principal component analysis cannot achieve a good data reduction effect. According to Kaiser (1974), the general criteria are as follows: 0.00–0.49, unacceptable; 0.50–0.59, very poor (miserable); 0.60–0.69, barely accepted (mediocre); 0.70–0.79, acceptable (middling); 0.80–0.89, better (meritorious); 0.90–1.00, very good (marvelous).
As can be seen from Table 1, the Bartlett spherical test results are significant at the 1% level, and the KMO value is 0.617, indicating that the original data is correlated and suitable for factor analysis.
We can establish a terrorist attack hazard factor analysis model as shown in the Appendix Equations (A1)–(A3).

4.3. Result Analysis

4.3.1. Comprehensive Factor Score

Based on the above factor analysis results (as shown in the Table A1, Table A2, Table A3, Table A4 and Table A5 in the Appendix), we calculated the top 10 terrorist attacks in the database (as shown in Table 2). Ranked 1st and 2nd are the “9.11 terrorist attacks”, and the “911” incident is the most serious terrorist attack in the United States. The statistics on the property losses of the incident were mixed. The United Nations issued a report saying that the terrorist attack caused US$200 billion in economic losses, equivalent to 2% of the GDP of the year. The psychological impact of the incident on the American people is extremely far-reaching, and the American people’s sense of economic and political security has been seriously weakened.

4.3.2. K-Means Clustering Method for Grading

The K-means algorithm, also known as k-mean or k-means, is one of the most widely used clustering algorithms. It takes the mean of all data samples in each clustering subset as the representative point of the cluster. The main idea of the algorithm is to divide the data set into different categories through an iterative process, so that the criterion function for evaluating clustering performance reaches the most “Excellent", each cluster generated is compact and independent between classes.
The essence of the K-means algorithm is to calculate the phase difference of two elements. Since the calculated terrorist attack damage degree is scalar, we use the Euclidean distance to measure the phase difference between elements (common measures of scalar heterogeneity include Manhattan distance, Minkowski distance, Pearson coefficient, etc.). Euclidean distance is defined as follows:
d = ( x 1 y 1 ) 2 + ( x 2 y 2 ) 2
Its meaning is the set distance of two elements in Euclidean space, which is widely used to identify the difference between two scalar elements because of its intuitive and explanatory nature.
The specific implementation steps of the K-means algorithm are as follows:
(1)
Determine an initial cluster center for each cluster, so that there are K initial clustering centers.
(2)
The samples in the sample set are allocated to the nearest cluster according to the principle of minimum distance.
(3)
The sample mean of each cluster is used as the new cluster center.
(4)
Repeat steps (2) and (3) until the clustering center no longer changes.
(5)
End, and get K clusters.
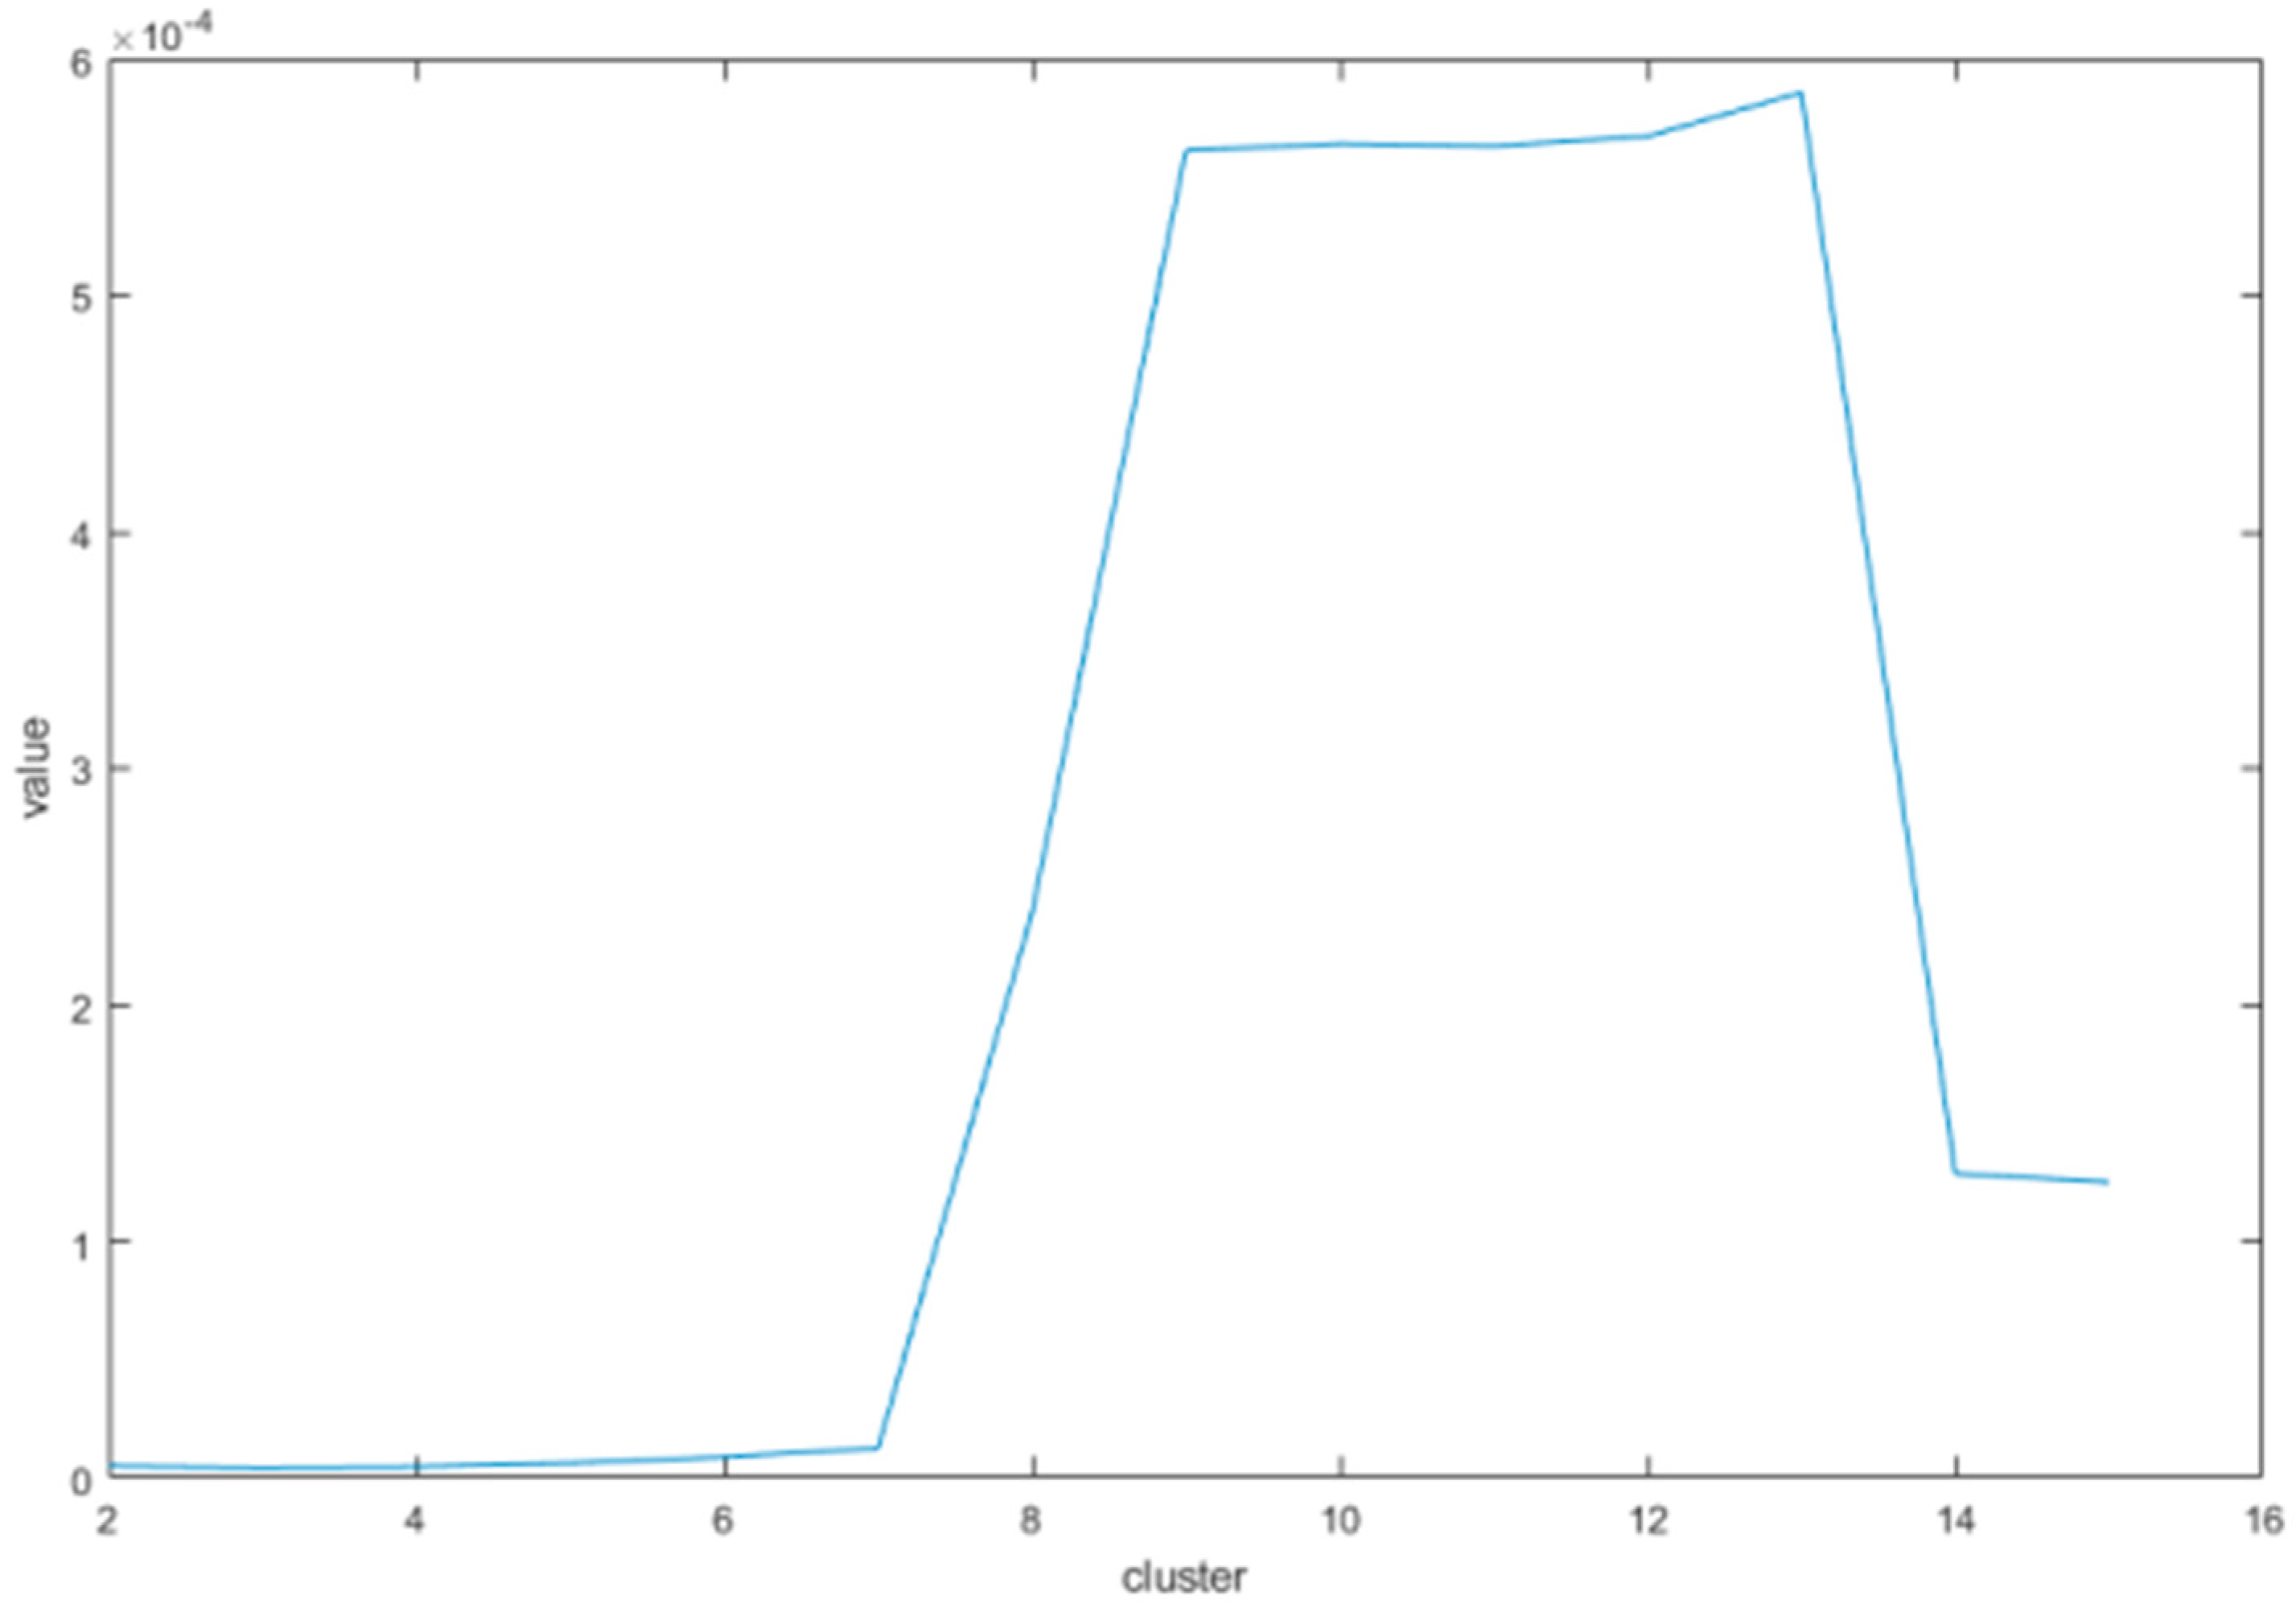
In other graded articles [21], the usual classification level is 5 categories. Therefore, combined with the clustering effect map (as shown in Figure 2), the number of categories we selected is 5.
Here, we use the above K-means algorithm for clustering classification according to the comprehensive score F of risk degree. Then, the index line was established, with the highest level being 1 and the lowest level being 5. The classification results are shown in the following Table 3:
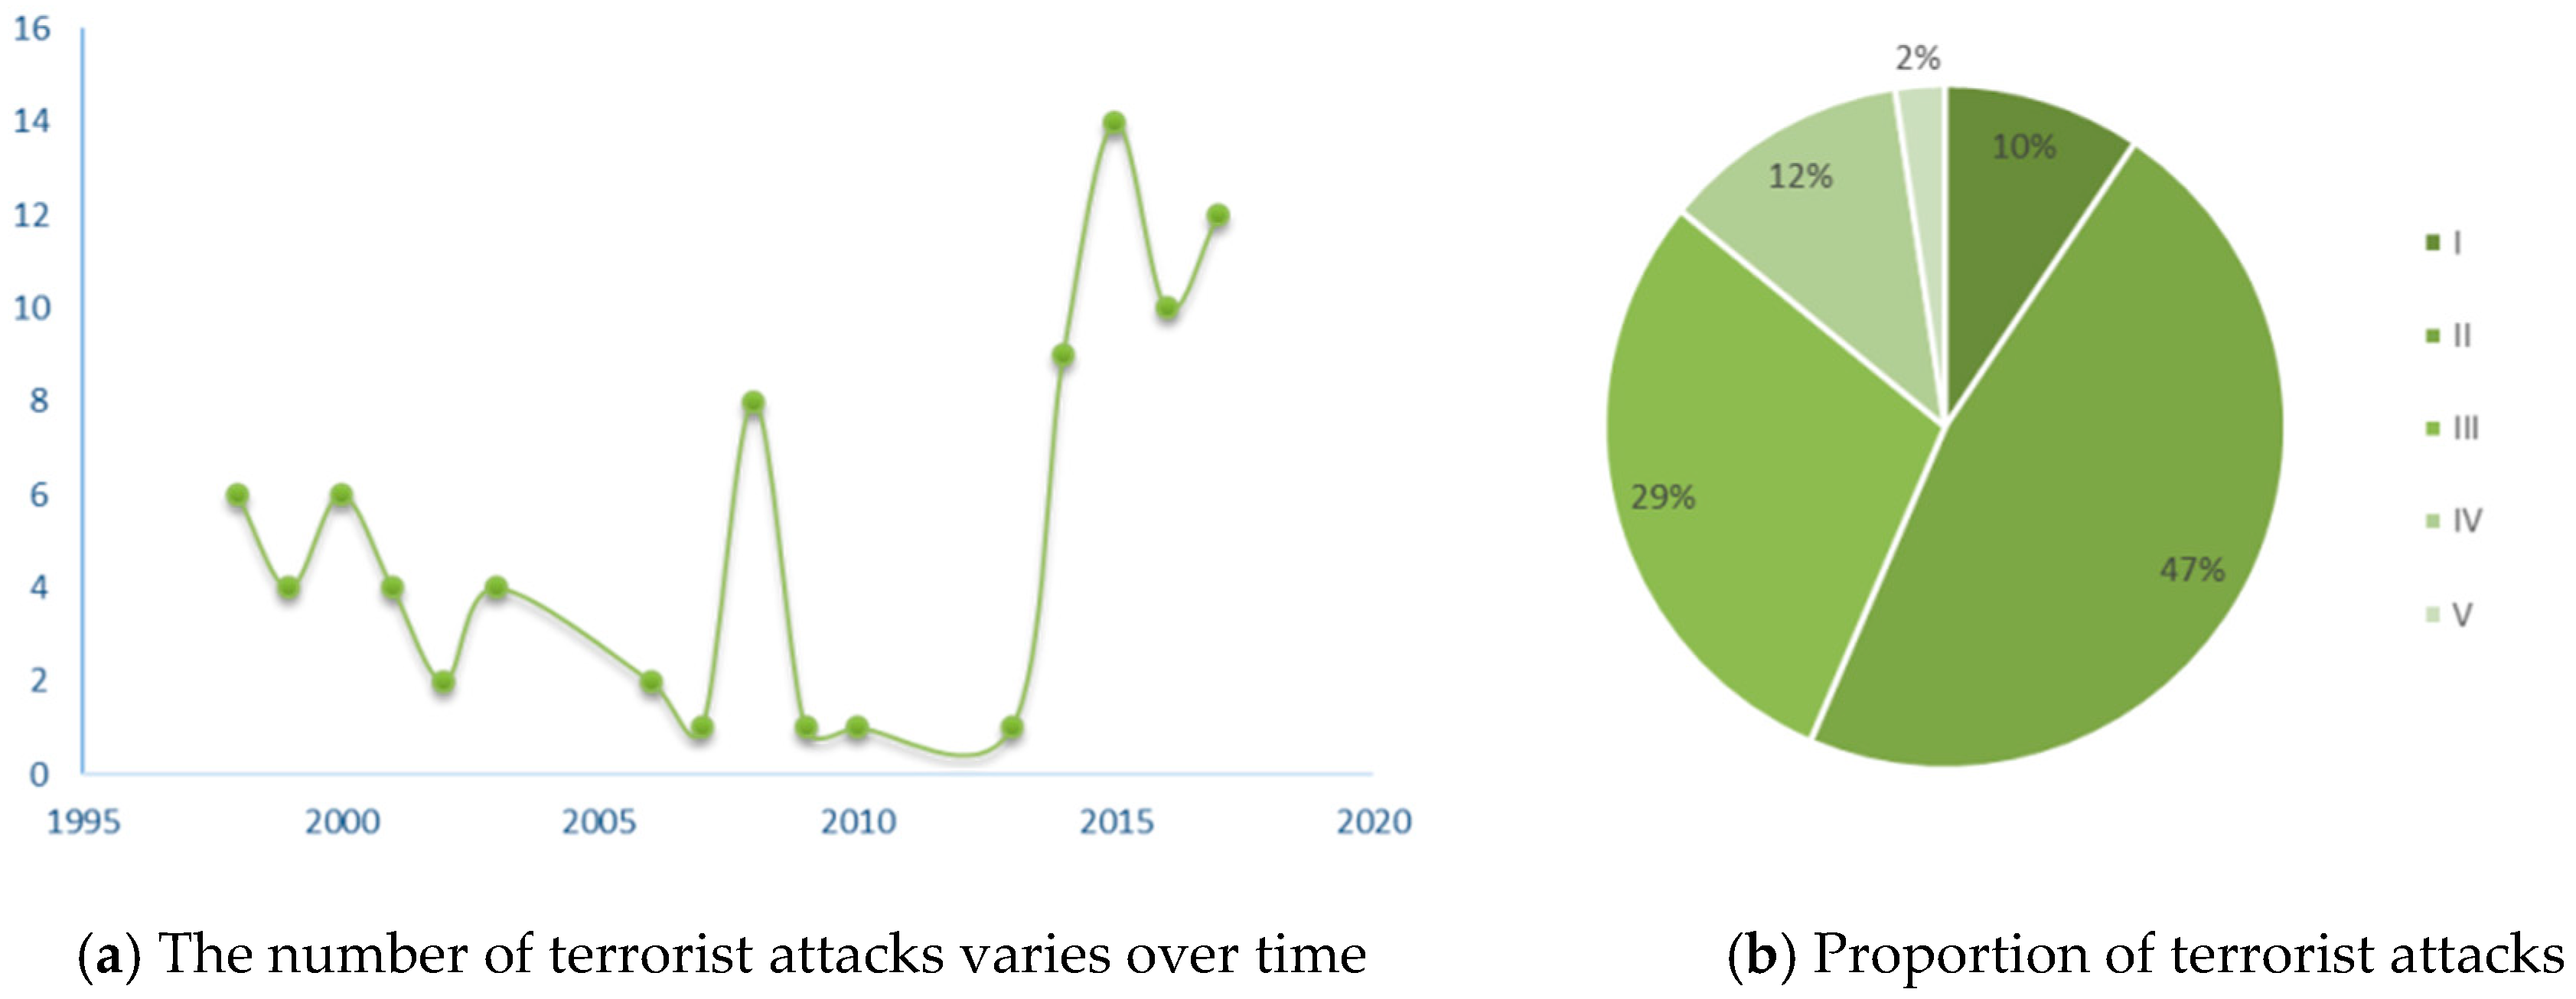
It is easy to see from the Table 3 that the levels of terrorist attacks mainly focus on levels 2, 3 and 4. which means that most terrorist attacks on the levels of II–IV, in Pakistan and India, for example, the large number of terrorist attacks in this two countries, however the grade distribution is concentrated, so is the terrorist attacks still has certain space distribution, the spatial distribution for me when we were doing the prediction. It’s easy for the governments to prevent terrorist attacks and reduce the dangers of terrorist attacks. The distribution of terrorist attacks at all levels around the world is shown in the Figure 3.
Afghanistan and Pakistan are the top two countries which were attacked by a terrorist organization. From Figure 4 and Figure 5, it is easy to find that the most terrorist attacks happen in border areas. The grade I terrorist attacks also happened in these places. These two countries should pay more of their attention to the border areas, and Afghanistan and Pakistan had better to combating terrorist attacks in grade II and III, and grade III and IV respectively, because these two grades occupied over 60% in all terrorist attacks. When terrorist attacks occur frequently, it will give local residents and businesses a sense of crisis, which will cause local enterprises to be reluctant to expand production, thus hindering the local economic development. And the terrorist attacks have seriously damaged the local environment. These two countries should be strengthening the protection of borders, especially power plants, oil wells, factories and residential areas in low-border, thus reducing the incidence of terrorist attacks will improve the security of businesses and residents. These measures will promote local economic development.
As shown in Figure 6a, it is not difficult to find that the total number of terrorist attacks events in Australasia and Oceania is small. From 1998 to 2006, the number of terrorist attacks which happened in Australia and Oceania decreased. However, in the 2006 the events reached a peak and the terrorist attacks increased sharply from 2013 to 2016. From the trend of this terrorist attack, Australasia and Oceania should strengthen the prevention of terrorist attacks in order to ensure the security of the region.
As shown in the Figure 7, Middle East and North Africa are two of the regions which are the most affected by terrorist attacks. The history of the Middle East is a gunpowder barrel in the world. The war is on the rise, and people of all countries suffer from the war. The recent political turmoil may exacerbate the deterioration of the regional situation and make peace unreachable. The Arab-Israeli conflict and the Iranian issue are two major historical problems in the Middle East, and are directly related to peace and stability in the Middle East and North Africa. The stability in the Middle East is the biggest challenge.
Due to political turmoil the economic dilemma will not disappear, and which will be exacerbated. On the contrary, economic structural transformation or economic quality improvement requires a stable political and social environment. Countries of the Middle East and North Africa have long been subject to foreign intervention, have a single economic structure, rely heavily on the international market, and are at the edge of the global division of labor. Modern information and network technology have broken the original deep water flow to a certain extent, making the potential conflicts flammable and difficult to control. So, these regions had better to strengthen national security from the following aspects:
  • Improve the fairness of income distribution and enable the masses to share more development results.
  • Respond to demographic changes and employment pressures, and build an economic development safety net.
  • Promote reforms in various fields and provide strong institutional support for economic development.

5. Conclusions

This problem can be solved by establishing a terrorist attack risk rating system, a factor analysis model, and a clustering algorithm. This paper first selected relevant literature and combed the data to summarize the representative index system. Given the complexity of the terrorist attacks, factor analysis provided us with a good and efficient way to simplify the analysis of problems. Using the factor analysis method, from the dependence relationship within the correlation matrix of the research indicators, some variables with overlapping information and intricate relationships were attributed to a few unrelated comprehensive factors. Then, we calculated each factor score and composite score to get the top 20 terrorist attacks. Next, we used the K-means cluster analysis method to cluster the comprehensive scores of the hazard levels of these terrorist attacks, and rank them according to the comprehensive scores of the five types of terrorist attacks.

Supplementary Materials

The following are available online at https://www.mdpi.com/2071-1050/11/5/1487/s1, date of the terrorist attacks.

Author Contributions

Conceptualization, X.H. and R.Z.; Methodology, F.L.; Software, G.C.; Data Curation, R.Z.; Writing-Original Draft Preparation, X.H. and Q.F.; Writing-Review & Editing, X.H. and Q.F.; Visualization, Q.F.

Funding

This research was funded by Funds for the Central Universities grant number 3102018zy034.

Conflicts of Interest

The authors declare no conflict of interest.

Appendix A

Appendix A.1. Initial Common Factor and Factor Loading Matrix

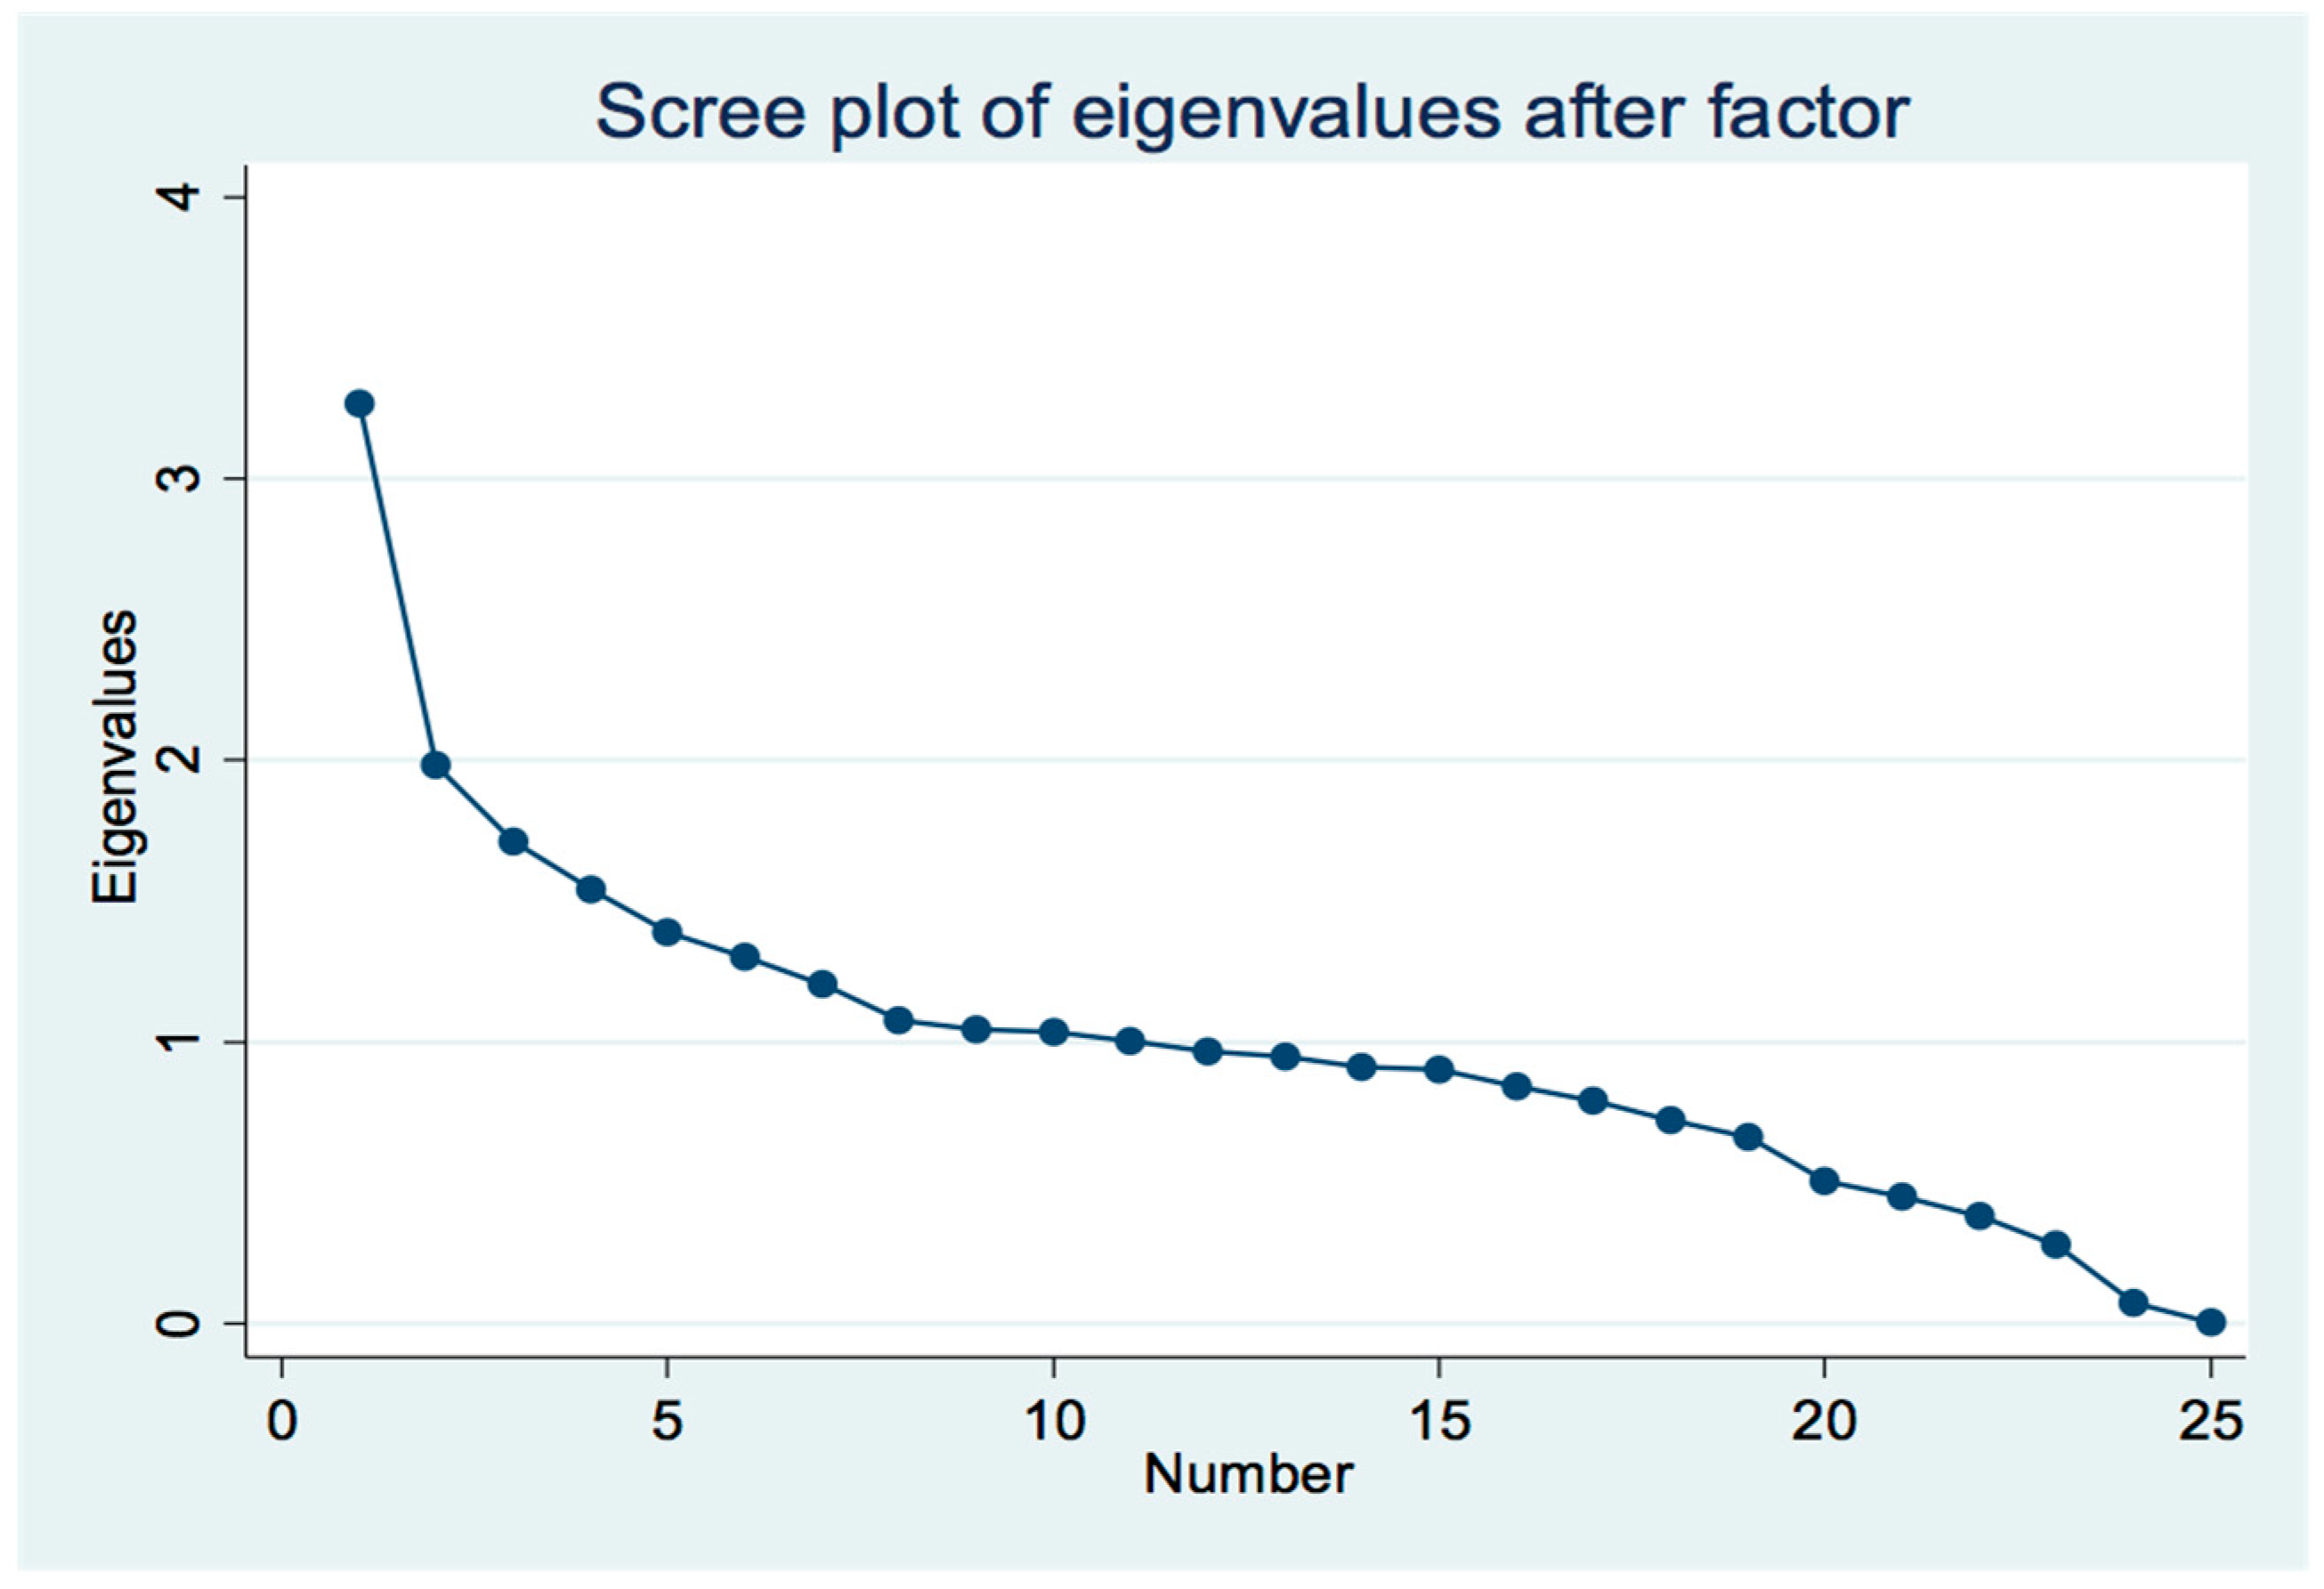
First, we analyzed all the terrorist attacks in the database from 1998 to the end of 2017. The factor load was obtained by principal component method, and then the factor rotation was performed. The principle of determining the number of factors is that the characteristic root is greater than 1. Factor analysis results Table A1, it can be seen that it is appropriate to retain 11 main factors, and the cumulative variance at this time is 66.2%, which achieves the purpose of dimensionality reduction. The gravel map and factor load matrix are shown in Table A2 and Figure A1.
Table A1. The initial common factors to explain the results of the total variance of the original variables.
FactorEigenvalueDifferenceProportionCumulative
13.2681.2860.1310.131
21.9820.2710.07930.210
31.7100.1700.06840.278
41.5400.1520.06160.340
51.3880.08700.05550.396
61.3010.09510.05200.448
71.2060.1310.04820.496
81.0750.03150.04300.539
91.0440.007360.04170.581
101.0360.03330.04150.622
111.0030.03680.04010.662
120.9660.01960.03860.701
130.9470.03340.03790.739
140.9130.01230.03650.775
150.9010.05640.03600.811
160.8450.05510.03380.845
170.7890.06590.03160.877
180.7240.05880.02890.905
190.6650.1560.02660.932
200.5090.05840.02030.952
210.4500.06840.01800.970
220.3820.1000.01530.986
230.2810.2080.01130.997
240.07350.07130.002901.000
250.00219.0.0001001
Figure A1. Gravel map.
Sustainability 11 01487 g0a1

Appendix A.2. Factor Rotation and Factor Score Matrix

Further, we do the factor rotation by the maximum variance, and we get Table A1 and Table A2 to further calculate the factor score matrix.
Table A2. The initial factor loading matrix.
VariableFactor1Factor2Factor3Factor4Factor5Factor6
c Workday−0.01560.01510.0113−0.000220−0.00656−0.0323
c extended0.285−0.4120.3780.301−0.002810.0377
c crtnum−0.0175−0.003470.05000.04980.00815−0.0268
c multiple0.1880.157−0.07830.04660.08580.193
c region w~h−0.02460.106−0.1380.09690.360−0.201
c city ornot−0.04150.0239−0.0163−0.008580.1370.0525
c attackty~l−0.3420.699−0.2020.0484−0.1390.169
c attackty~m0.2450.1940.4500.496−0.365−0.140
c success0.07410.1570.1940.2550.08190.583
c suicide0.1440.3080.105−0.237−0.203−0.189
c weaptype~l−0.3580.708−0.1940.0309−0.1820.0665
c weaptype~m0.2330.3560.3350.362−0.401−0.179
c targtype~l−0.01760.05000.1450.2400.2550.611
c targtype~m0.1680.1530.163−0.0286−0.184−0.224
c claimed0.2260.0936−0.141−0.01510.103−0.0818
c nkill0.1950.2940.626−0.4680.216−0.00829
c nwound0.08250.2830.519−0.4460.265−0.0108
c property0.007230.136−0.01760.3800.533−0.446
c propexte~l−0.06020.3890.02890.4240.539−0.0963
c ishostkid0.144−0.2930.2990.270−0.01930.0185
c nhostkid0.06470.02450.321−0.2310.1710.0354
c INT LOG0.9320.120−0.232−0.04390.007390.110
c INT IDEO0.9360.120−0.231−0.04820.007420.102
c INT MISC0.1610.0281−0.09040.02640.0880−0.307
c INT ANY0.9150.117−0.246−0.03720.03660.00508
VariableFactor8Factor9Factor10Factor11UniquenessVariable
c Workday0.0227−0.1090.0430−0.04410.9540.0713
c extended0.139−0.114−0.01960.218−0.02470.433
c crtnum0.390−0.0305−0.0868−0.590−0.1930.448
c multiple−0.2010.4150.226−0.0842−0.03970.615
c region w~h0.4500.429−0.01300.04780.09180.392
c city ornot0.006710.4160.4070.306−0.06220.540
c attackty~l0.173−0.139−0.1490.195−0.02770.193
c attackty~m−0.05480.224−0.0842−0.03160.03220.239
c success0.145−0.2880.242−0.0319−0.03420.355
c suicide−0.0589−0.1570.3130.0619−0.03180.610
c weaptype~l0.148−0.0849−0.1860.178−0.009840.198
c weaptype~m−0.1210.298−0.0945−0.09670.03970.259
c targtype~l0.1260.1560.0242−0.02780.08510.431
c targtype~m0.186−0.2880.534−0.000300−0.1040.424
c claimed−0.1980.03820.04780.471−0.03190.638
c nkill−0.01270.0375−0.0940−0.01830.008070.207
c nwound−0.002780.02100.101−0.07780.05780.355
c property−0.236−0.210−0.0993−0.0290−0.04130.242
c propexte~l−0.205−0.1810.112−0.116−0.02940.263
c ishostkid0.205−0.221−0.05870.378−0.01700.493
c nhostkid0.08130.0181−0.4770.230−0.09050.512
c INT LOG−0.0541−0.0574−0.0877−0.03520.006890.0333
c INT IDEO−0.0420−0.0562−0.0814−0.03140.006760.0316
c INT MISC0.6620.04920.09400.09600.03150.403
c INT ANY0.136−0.0275−0.0652−0.01690.01270.0609
C workday = 0.0058 F a c t o r 1 0.0054 F a c t o r 2 + 0.0144 F a c t o r 3 + 0.0104 F a c t o r 4 0.0042 F a c t o r 5 + 0.0121 F a c t o r 6 0.0059 F a c t o r 7 + 0.0247 F a c t o r 8 0.0061 F a c t o r 9 + 0.0232 F a c t o r 10 + 0.9628 F a c t o r 11
C I N T A N Y = 0.9527 F a c t o r 1 0.0570 F a c t o r 2 + 0.01477 F a c t o r 3 + 0.0347 F a c t o r 4 0.0090 F a c t o r 5 0.0176 F a c t o r 6 + 0.0393 F a c t o r 7 + 0.1455 F a c t o r 8 + 0.0554 F a c t o r 9 0.0245 F a c t o r 10 + 0.0029 F a c t o r 11
Table A3. Factor rotation.
FactorEigenvalueDifferenceProportionCumulative
Factor13.025241.180550.1210.121
Factor21.844690.178460.07380.1948
Factor31.666240.122630.06660.2614
Factor41.543610.137540.06170.3232
Factor51.406070.078320.05620.3794
Factor61.327750.034060.05310.4325
Factor71.293680.084860.05170.4843
Factor81.208820.059610.04840.5326
Factor91.149220.067320.0460.5786
Factor101.081890.075790.04330.6219
Factor111.0061 0.04020.6621
Table A4. Rotated factor load matrix.
VariableFactor1Factor2Factor3Factor4Factor5Factor6Factor7
c_Workday−0.0058−0.00540.01440.0104−0.00420.0121−0.0059
c_extended0.0804−0.3864−0.02350.1875−0.01890.18270.5814
c_crtnum−0.009−0.05010.01350.0384−0.00530.0846−0.0979
c_multiple0.1764−0.09730.01140.1590.00230.2323−0.438
c_region_w~h−0.01010.04490.0098−0.00730.1191−0.0009−0.0943
c_city_ornot−0.1094−0.09410.01230.0074−0.07080.1695−0.1911
c_attackty~l−0.10880.8839−0.01920.00610.02940.1001−0.0434
c_attackty~m0.0632−0.02480.01640.85410.040.05270.1426
c_success0.07440.12430.026−0.01770.04310.73380.1496
c_suicide0.11610.14530.22720.0734−0.0449−0.1478−0.0889
c_weaptype~l−0.13390.8784−0.00910.06770.0248−0.0106−0.0749
c_weaptype~m0.11060.09730.06060.84060.0165−0.0522−0.0655
c_targtype~l−0.01640.01310.04770.0187−0.00680.6986−0.0117
c_targtype~m0.071−0.00450.07980.07160.00670.01190.0799
c_claimed0.23960.0725−0.0061−0.04610.1145−0.11710.0891
c_nkill0.076−0.01480.88260.0829−0.00850.00850.0217
c_nwound−0.017−0.03510.7785−0.01770.03810.0671−0.1018
c_property0.0043−0.0462−0.0210.01770.8461−0.16740.081
c_propexte~l−0.02670.12610.03810.04540.80290.2374−0.1125
c_ishostkid0.0035−0.1527−0.04380.0923−0.00980.13150.6646
c_nhostkid0.03670.08360.4566−0.0252−0.0486−0.09480.3338
c_INT_LOG0.9768−0.07330.02250.0508−0.00090.0245−0.0128
c_INT_IDEO0.9783−0.07420.02550.0491−0.00460.0209−0.0092
c_INT_MISC0.14440.0615−0.027−0.0503−0.038−0.10010.2166
c_INT_ANY0.9527−0.0570.01470.0347−0.009−0.01760.0393
VariableFactor8Factor9Factor10Factor11Uniqueness
c_Workday0.0247−0.00610.02320.96280.0713
c_extended0.02580.01660.0429−0.03090.433
c_crtnum0.18730.0449−0.688−0.14460.4477
c_multiple0.0721−0.0550.2338−0.10060.6152
c_region_w~h0.747−0.15130.0150.03430.3924
c_city_ornot0.3160.10860.49−0.13080.5399
c_attackty~l0.01750.01690.0142−0.01130.1929
c_attackty~m−0.00890.0348−0.01690.00620.2393
c_success−0.1450.1813−0.0787−0.00250.3553
c_suicide−0.10510.4930.11280.00910.6097
c_weaptype~l0.03410.00310.00910.00280.1983
c_weaptype~m−0.02030.0307−0.01010.00970.2592
c_targtype~l0.0885−0.26040.0190.03820.4313
c_targtype~m0.04070.7415−0.031−0.02880.4236
c_claimed0.01520.00550.5078−0.06940.6375
c_nkill−0.02210.0107−0.0086−0.00510.2067
c_nwound0.02130.13140.0010.0580.3546
c_property0.0489−0.04560.004−0.00810.242
c_propexte~l0.01240.0520.01140.00290.2633
c_ishostkid0.04240.04590.1022−0.01290.4926
c_nhostkid0.0271−0.36140.0135−0.12710.5121
c_INT_LOG−0.05180.00010.025−0.0050.0334
c_INT_IDEO−0.03950.00940.0252−0.00490.0316
c_INT_MISC0.6590.2348−0.14070.040.403
c_INT_ANY0.14550.0554−0.02450.00290.0609
Table A5. Factor score coefficient matrix.
VariableFactor1Factor2Factor3Factor4Factor5Factor6Factor7
c Workday0.00467−0.01370.01100.00952−0.008580.0158−0.00795
c extended−0.0188−0.142−0.02570.0859−0.001720.1170.401
c crtnum0.00835−0.05460.01040.02930.0005400.0678−0.123
c multiple0.0345−0.116−0.004070.125−0.02580.185−0.387
c region w~h−0.01390.001020.02160.02630.0386−0.00254−0.0749
c city ornot−0.0842−0.09980.003870.0256−0.08420.148−0.166
c attackty~l0.02760.505−0.0234−0.0141−0.02610.06220.0961
c attackty~m−0.0365−0.0145−0.03010.562−0.00440−0.004300.0528
c success0.03020.0805−0.0109−0.08360.01740.5570.113
c suicide0.01430.06140.1080.00809−0.0281−0.0970−0.0513
c weaptype~l0.01520.496−0.01600.0382−0.0297−0.02420.0689
c weaptype~m−0.009280.0329−0.002730.565−0.0261−0.0787−0.0954
c targtype~l8.00 × 10−50.001010.02910.000980−0.03920.521−0.0337
c targtype~m−0.0225−0.02210.00860−0.01510.01330.03420.0515
c claimed0.07240.0757−0.0112−0.05200.0740−0.09550.113
c nkill−0.00400−0.01370.5320.0125−0.00642−0.01390.00553
c nwound−0.0367−0.05760.470−0.04860.02730.0475−0.0946
c property0.000700−0.0503−0.00698−0.01600.618−0.1600.0793
c propexte~l−0.006520.009000.0148−0.01310.5640.156−0.0722
c ishostkid−0.02540.00548−0.03620.0158−0.001140.07750.516
c nhostkid0.02490.1190.295−0.0317−0.0360−0.1090.294
c INT LOG0.3370.0293−0.0159−0.02900.004020.0125−0.0268
c INT IDEO0.3370.0291−0.0143−0.03060.001090.0102−0.0239
c INT MISC0.03370.0645−0.0215−0.0514−0.0506−0.06690.180
c INT ANY0.3250.0410−0.0192−0.0384−0.00862−0.01680.0168
VariableFactor8Factor9Factor10Factor11
c Workday0.0245−0.01410.02840.958
c extended0.02670.01980.0596−0.0257
c crtnum0.1420.0346−0.640−0.147
c multiple0.0738−0.04780.196−0.0927
c region w~h0.619−0.1390.02600.0365
c city ornot0.2890.1210.465−0.126
c attackty~l0.00430−0.01240.0205−0.0196
c attackty~m0.0104−0.0289−0.009840.00776
c success−0.1270.185−0.0707−0.000380
c suicide−0.08660.4090.1020.00488
c weaptype~l0.0205−0.03310.0159−0.00626
c weaptype~m0.000780−0.0449−0.01310.0104
c targtype~l0.0832−0.2060.01880.0455
c targtype~m0.02840.652−0.0176−0.0344
c claimed0.00820−0.004250.464−0.0655
c nkill−0.00881−0.0413−0.0160−0.00225
c nwound0.02560.0885−0.005500.0590
c property−0.00718−0.0345−0.0148−0.0109
c propexte~l−0.03070.0617−0.01060.000780
c ishostkid0.03620.04490.123−0.0113
c nhostkid0.0249−0.3570.0167−0.124
c INT LOG−0.0688−0.0520−0.01850.00582
c INT IDEO−0.0585−0.0441−0.01780.00588
c INT MISC0.5380.192−0.1070.0381
c INT ANY0.0939−0.00474−0.05540.0125

Appendix A.3. Factor Score

According to the contribution of each sub-variance, the factor score can be obtained:
F = 0.1210 F a c t o r 1 + 0.0738 F a c t o r 2 + 0.0666 F a c t o r 3 + 0.0617 F a c t o r 4 + 0.0562 F a c t o r 5 + 0.0531 F a c t o r 6 + 0.0517 F a c t o r 7 + 0.0484 F a c t o r 8 + 0.0460 F a c t o r 9 + 0.0433 F a c t o r 10 + 0.0402 F a c t o r 11

References

  1. Freilich, J.D.; LaFree, G. Criminology theory and terrorism: Introduction to the special issue. Terror. Political Violence 2015, 27, 1–18. [Google Scholar] [CrossRef]
  2. Freilich, J.D.; Newman, G. (Eds.) Reducing Terrorism through Situational Crime Prevention; Criminal Justice Press: Monsey, NY, USA, 2009. [Google Scholar]
  3. LaFree, G.; Dugan, L.; Miller, E. Putting Terrorism in Context: Lessons from the Global Terrorism Database; Routledge: London, UK, 2015. [Google Scholar]
  4. Hirschfield, A. Surveillance and Situational Crime Prevention: Lessons for Counter-Terrorism. 2005. Available online: http://eprints.hud.ac.uk/id/eprint/7392/ (accessed on 3 March 2019).
  5. Taamneh, M.; Taamneh, S.; Alkheder, S. Clustering-based classification of road traffic accidents using hierarchical clustering and artificial neural networks. Int. J. Inj. Control Saf. Promot. 2016, 24, 1. [Google Scholar] [CrossRef] [PubMed]
  6. Clarke, R.V.; Newman, G.R. Outsmarting the Terrorists; Praeger: New York, NY, USA, 2006. [Google Scholar]
  7. Clarke, R.V.; Newman, G.R. Situational crime prevention and the control of terrorism. In Understanding and Responding to the Terrorism Phenomenon: A Multidimensional Perspective; Nikbay, O., Hancerli, S., Eds.; IOS Press: Amsterdam, The Netherlands, 2007; pp. 285–297. [Google Scholar]
  8. Cohen, L.E.; Felson, M. Social change and crime rate trends: A routine activities approach. Am. Sociol. Rev. 1979, 44, 588–608. [Google Scholar] [CrossRef]
  9. Dahl, E.J. The plots that failed: Intelligence lessons learned from unsuccessful terrorist attacks against the United States. Stud. Confl. Terror. 2011, 34, 621–648. [Google Scholar] [CrossRef]
  10. Felson, M.; Cohen, L.E. Human ecology and crime: A routine activity approach. Hum. Ecol. 1980, 8, 389–406. [Google Scholar] [CrossRef]
  11. Freilich, J.D.; Chermak, S.M.; Simone, J. Surveying American state police agencies about terrorism threats, terrorism sources, and terrorism definitions. Terror. Political Violence 2009, 21, 450–475. [Google Scholar] [CrossRef]
  12. Galam, S. The September 11 attack: A percolation of individual passive support. Eur. Phys. J. B Condens. Matter Complex Syst. 2002, 26, 269–272. [Google Scholar] [CrossRef]
  13. Keohane, N.O.; Zeckhauser, R.J. The Ecology of Terror Defense. In The Risks of Terrorism; Springer: New York, NY, USA, 2003. [Google Scholar]
  14. RAND Corporation. Deterrence & Influence in Counterterrorism; The Defense Advanced Research Projects Agency: Arlington, VA, USA, 2002. [Google Scholar]
  15. Carly, K.M.; Lee, J.-S.; Krackhardt, D. Destabilizing Networks. Connections 2001, 24, 31–34. [Google Scholar]
  16. Newman, M.E.J.; Girvan, M. Finding and evaluating community structure in networks. Phys. Rev. E Stat. Nonlinear Soft Matter Phys. 2004, 69, 026113. [Google Scholar] [CrossRef] [PubMed]
  17. Zhu, P.; Han, J.; Guo, Y.; Lombardi, F. Reliability and Criticality Analysis of Communication Networks by Stochastic Computation. IEEE Netw. 2016, 30, 70–76. [Google Scholar] [CrossRef]
  18. Zhu, P.; Song, X.; Liu, L.; Wang, Z.; Han, J. Stochastic Analysis of Multiplex Boolean Networks for Understanding Epidemic Propagation. IEEE Access 2018, 6, 35292–35304. [Google Scholar] [CrossRef]
  19. Gorsuch, R.L. Factor analysis. In Handbook of Psychology; Wiley: Hoboken, NJ, USA, 1983. [Google Scholar]
  20. Kaiser, H.F. The Application of Electronic Computers to Factor Analysis. Educ. Psychol. Meas. 1960, 20, 141–151. [Google Scholar] [CrossRef]
  21. Mapa, N.; Jayasinghe, P. The Impact of Terrorist Attacks on Stock Returns and Volatility: Evidence from Colombo Stock Exchange. Soc. Sci. Electron. Publ. 2014, 13. [Google Scholar] [CrossRef]
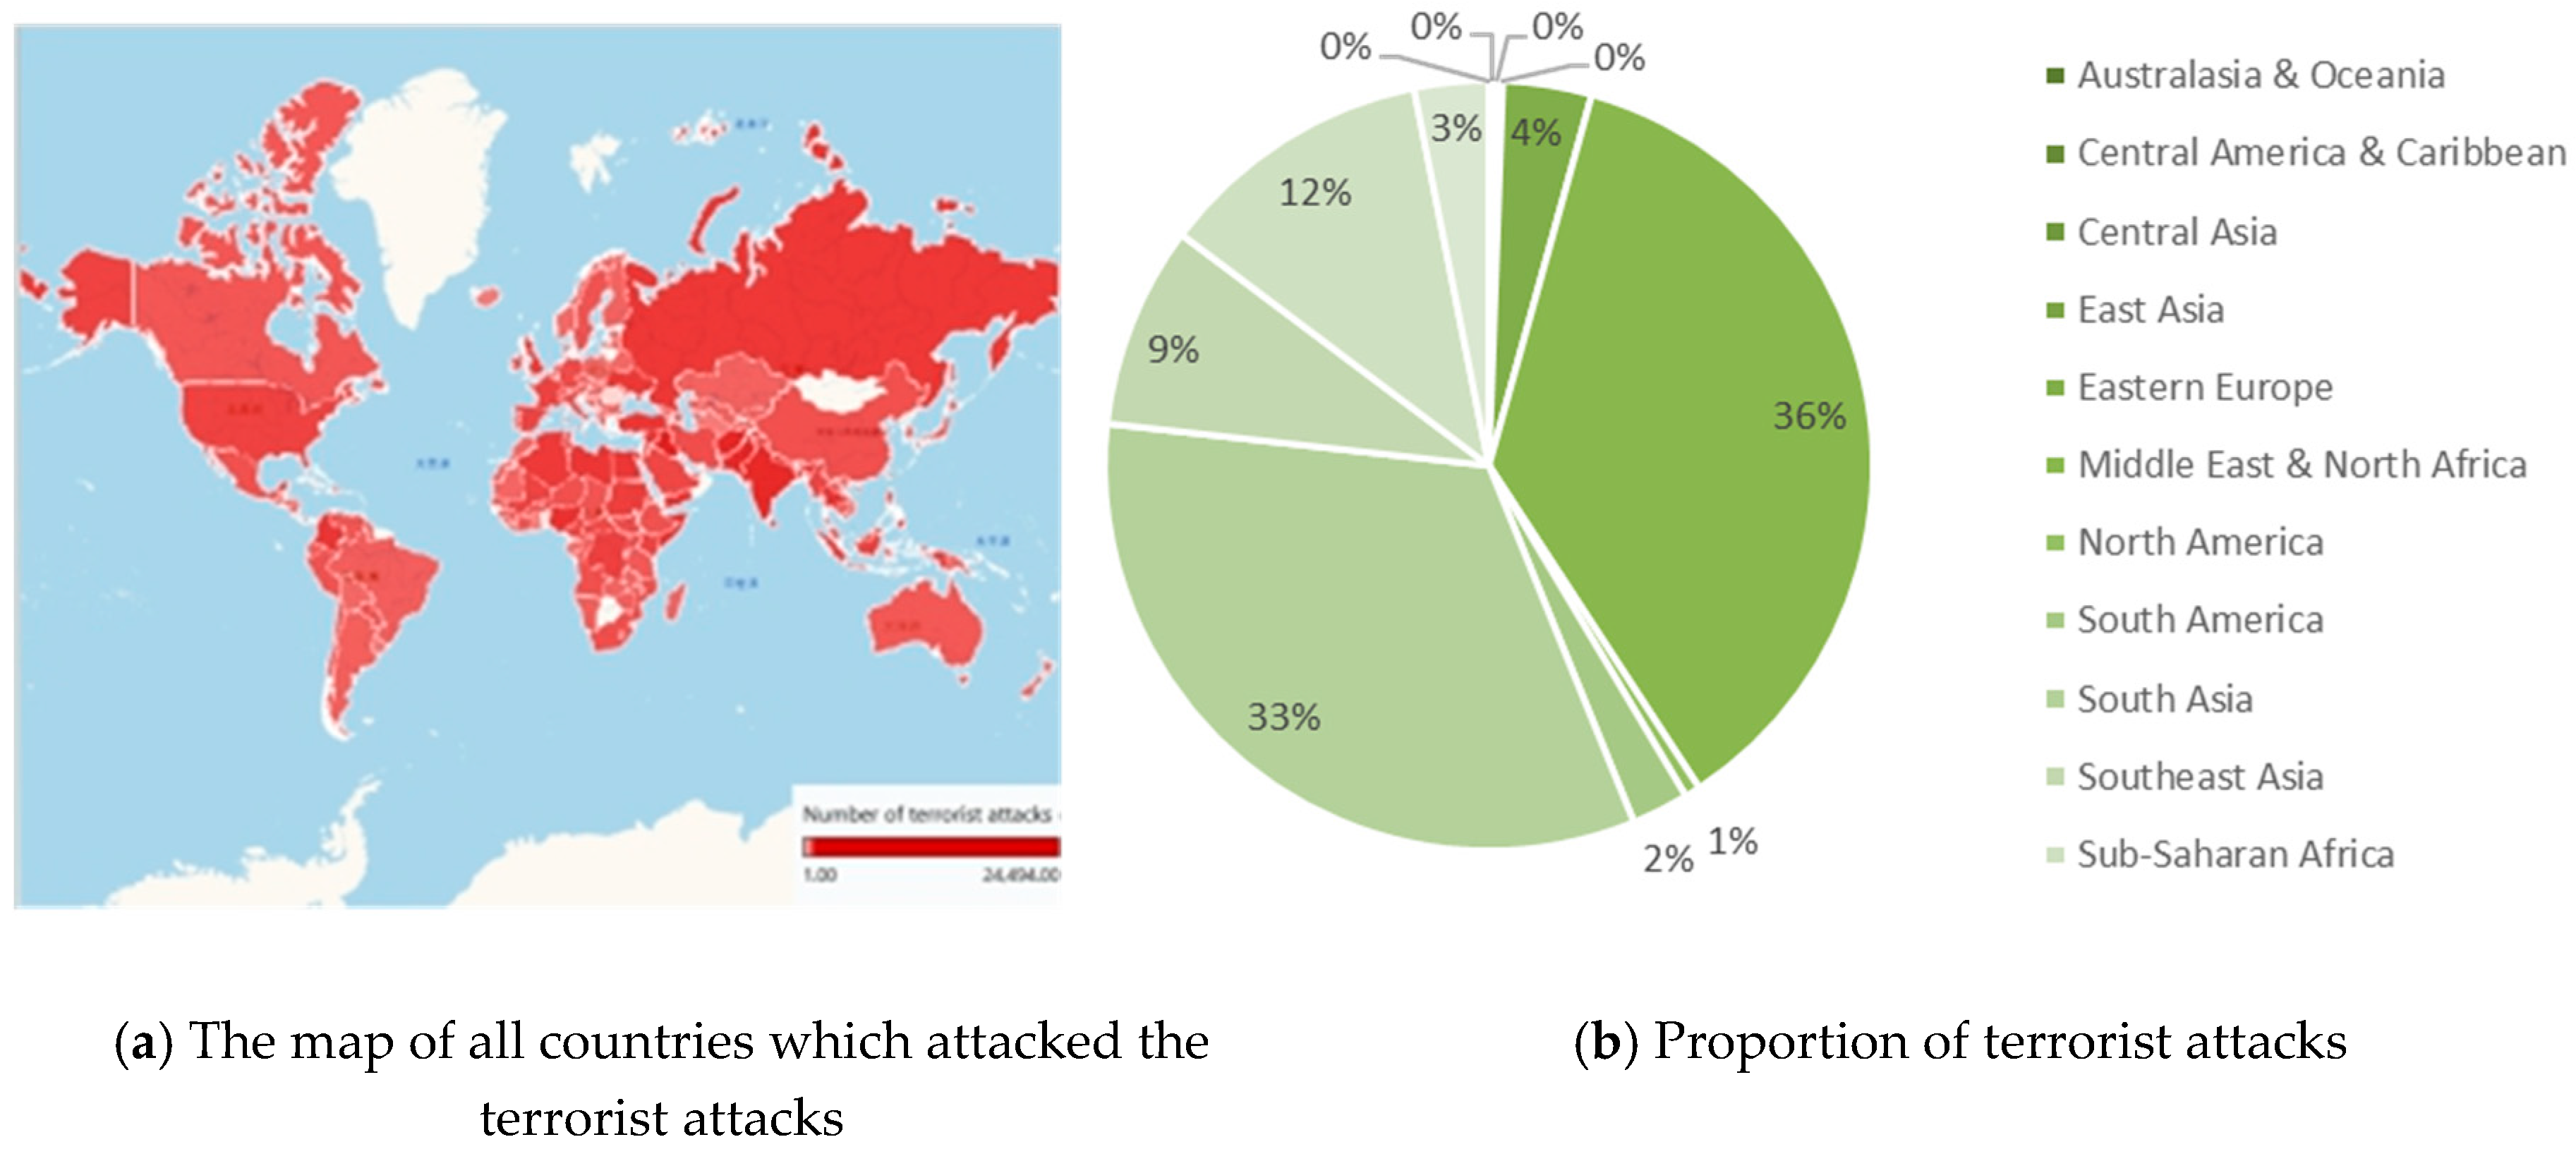
Figure 1. The number of terrorist attacks in all countries from 1998 to 2017.
Sustainability 11 01487 g001
Figure 2. Cluster number and clustering effect: The abscissa is cluster and the ordinate is value. With the increase of cluster, value is getting smaller and smaller, but combined with the actual business, cluster can not take too much, and 5 is the best choose. Where value = (the distance in cluster)/(the distance out cluster).
Sustainability 11 01487 g002
Figure 3. Distribution of terrorist attacks grade in 1998–2017.
Sustainability 11 01487 g003
Figure 4. Distribution of terrorist attacks grade in Afghanistan.
Sustainability 11 01487 g004
Figure 5. Distribution of terrorist attacks grade in Pakistan.
Sustainability 11 01487 g005
Figure 6. Distribution of terrorist attacks grade in Australasia and Oceania
Sustainability 11 01487 g006
Figure 7. Distribution of terrorist attacks grade in Middle East and North Africa.
Sustainability 11 01487 g007
Table 1. KMO and Bartley spherical test results.
KMO (Kaiser Meyer Olkin) 0.617
Bartley spherical testApprox. Chi-Square1.15 × 106
df.300
Sig0.000
Table 2. Top 10 terrorist attacks and ratings.
Attack TimeF
12001091110.17531
22001091110.15382
3201408036.044597
4201406125.470455
5199808073.775518
6200409012.761074
7201608042.653305
8201710142.194661
9201408151.999051
10201406101.992567
Table 3. K-means for the dangers of terrorist attacks grade.
GradeMinMaxNumber
I0.30310.1757617
II0.0890.30329,657
III−0.0790.08934,181
IV−0.267−0.07934,740
V−1.535−0.2677983