Research on the Spatial Network Characteristics and Synergetic Abatement Effect of the Carbon Emissions in Beijing–Tianjin–Hebei Urban Agglomeration


Abstract
1. Introduction
2. Literature Review
3. Research Methods and Sources of Data
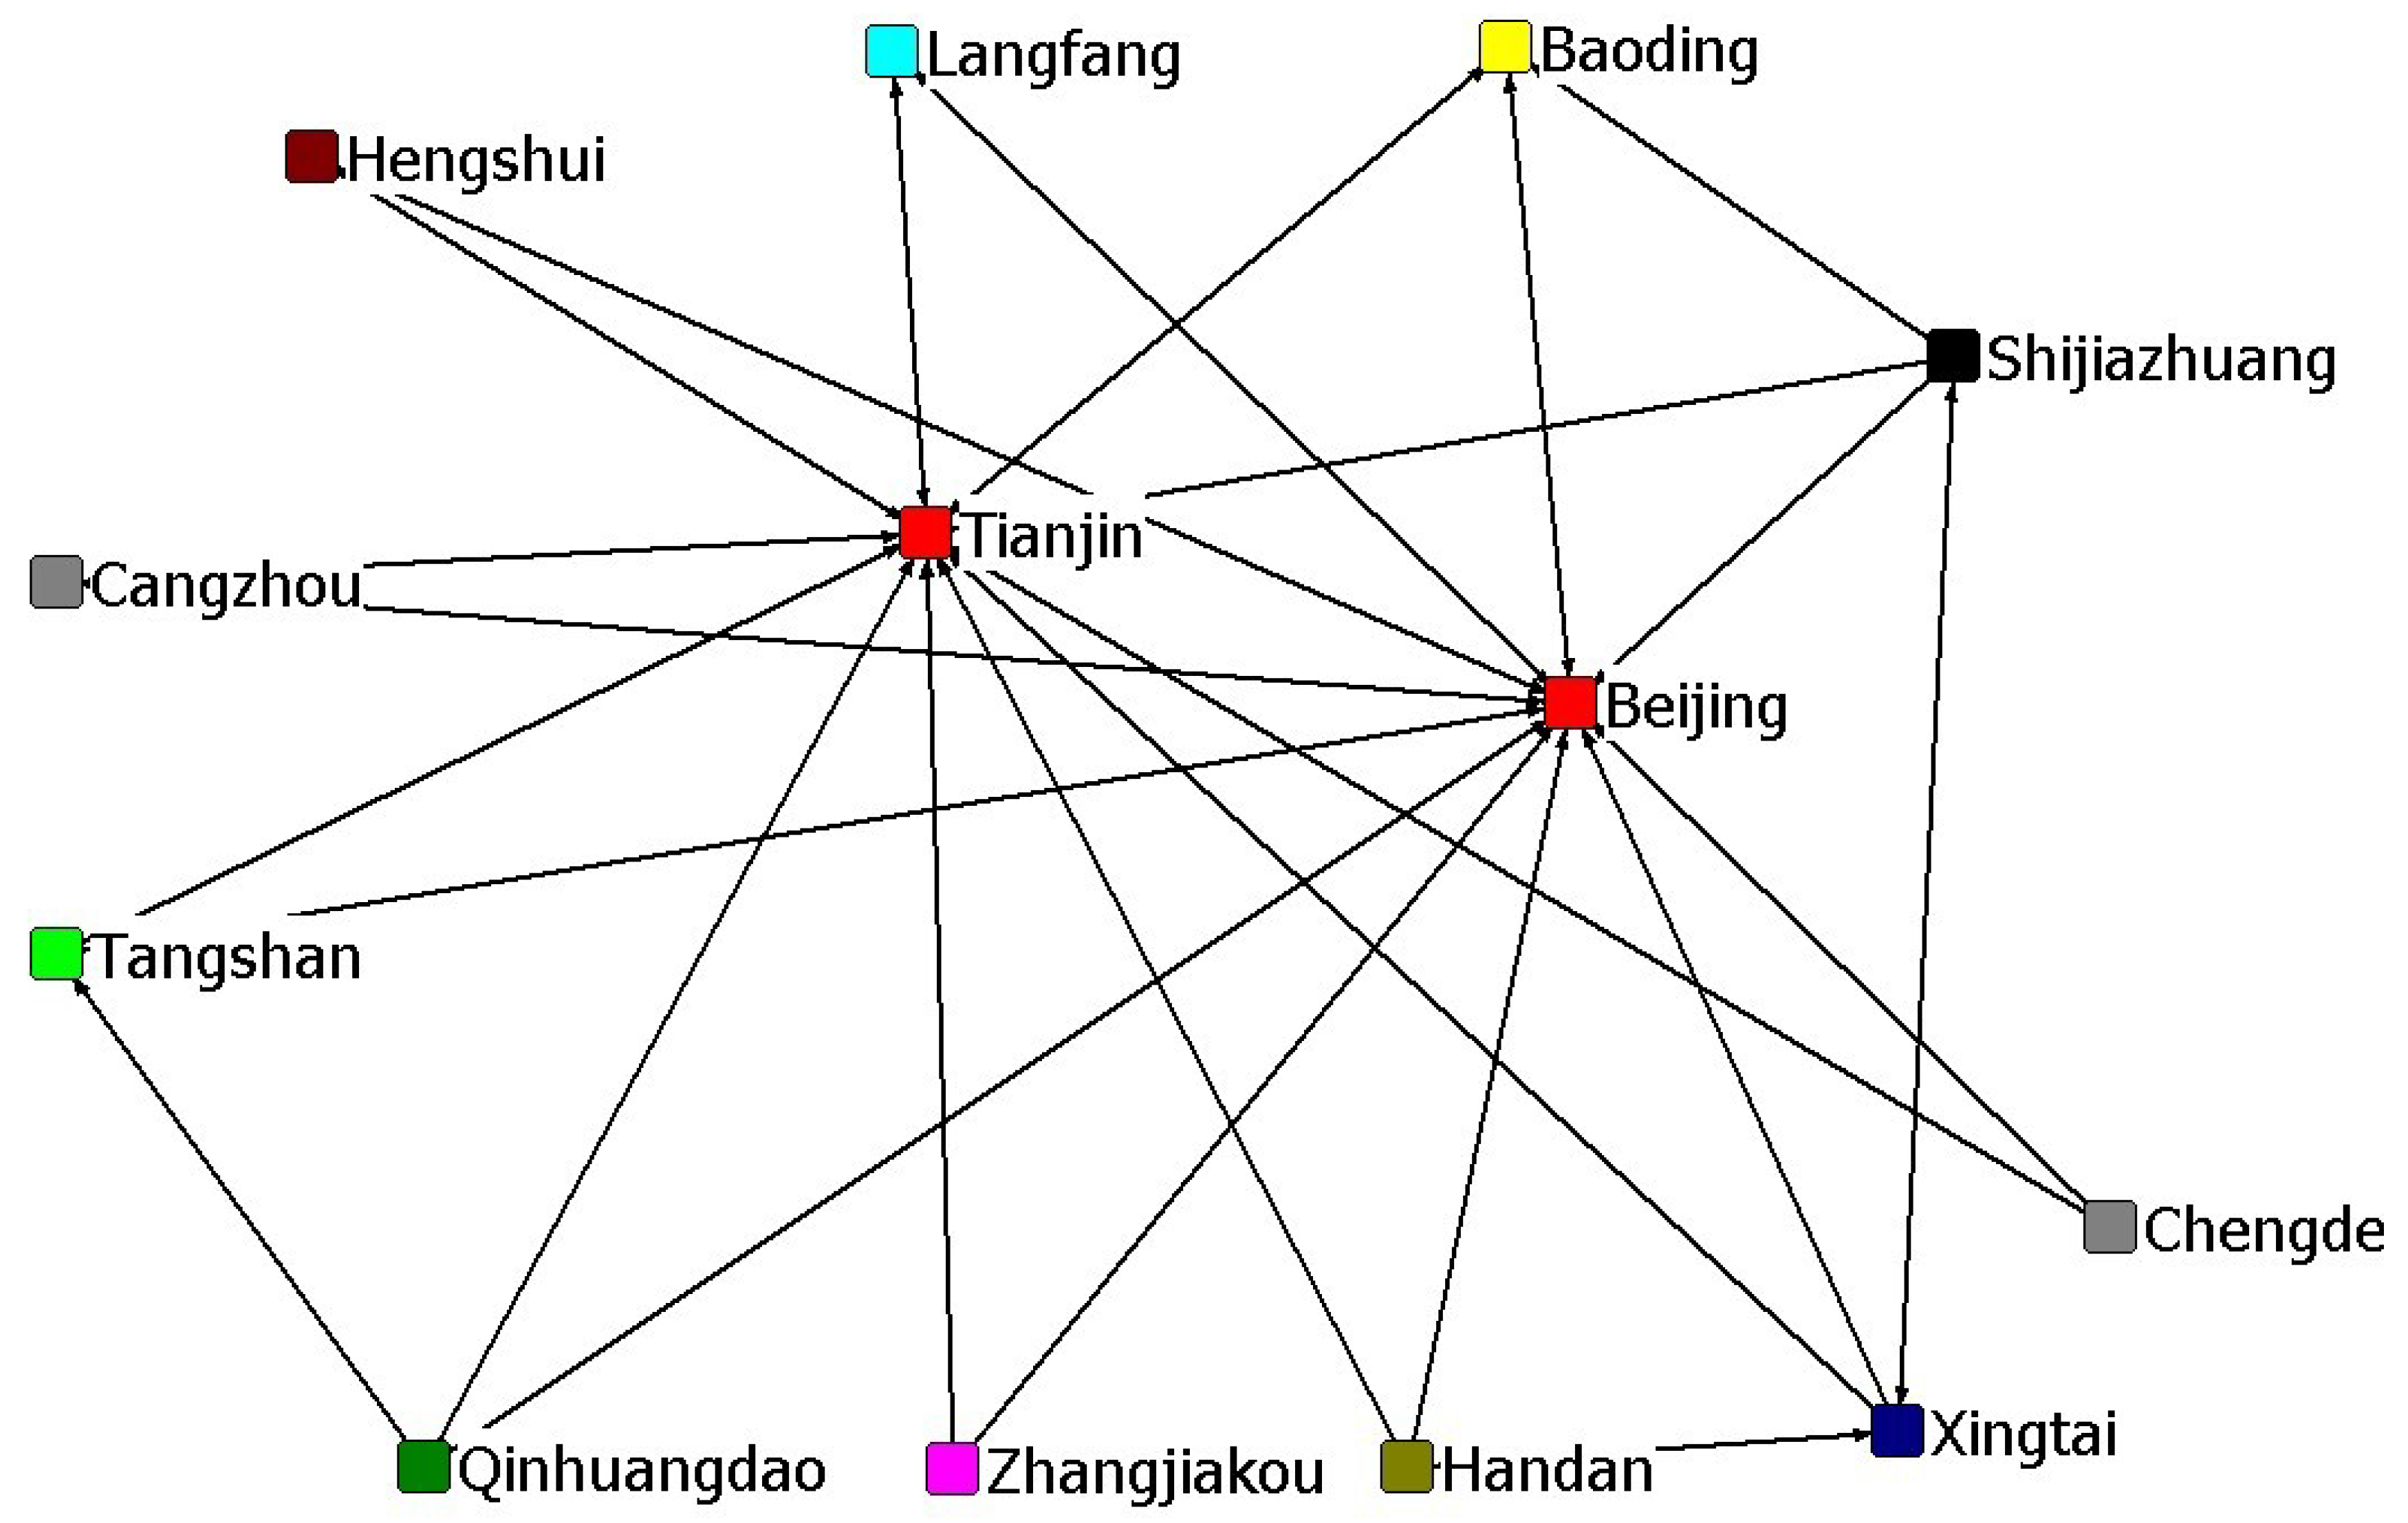
3.1. Construction of a Spatially Relevant Network of Carbon Emissions
3.2. Characteristic Index of the Spatial Network of Carbon Emissions
3.3. Synergetic Effect Model of Carbon Emission Reduction
3.4. Sources of Data
4. Calculation Results and Analysis
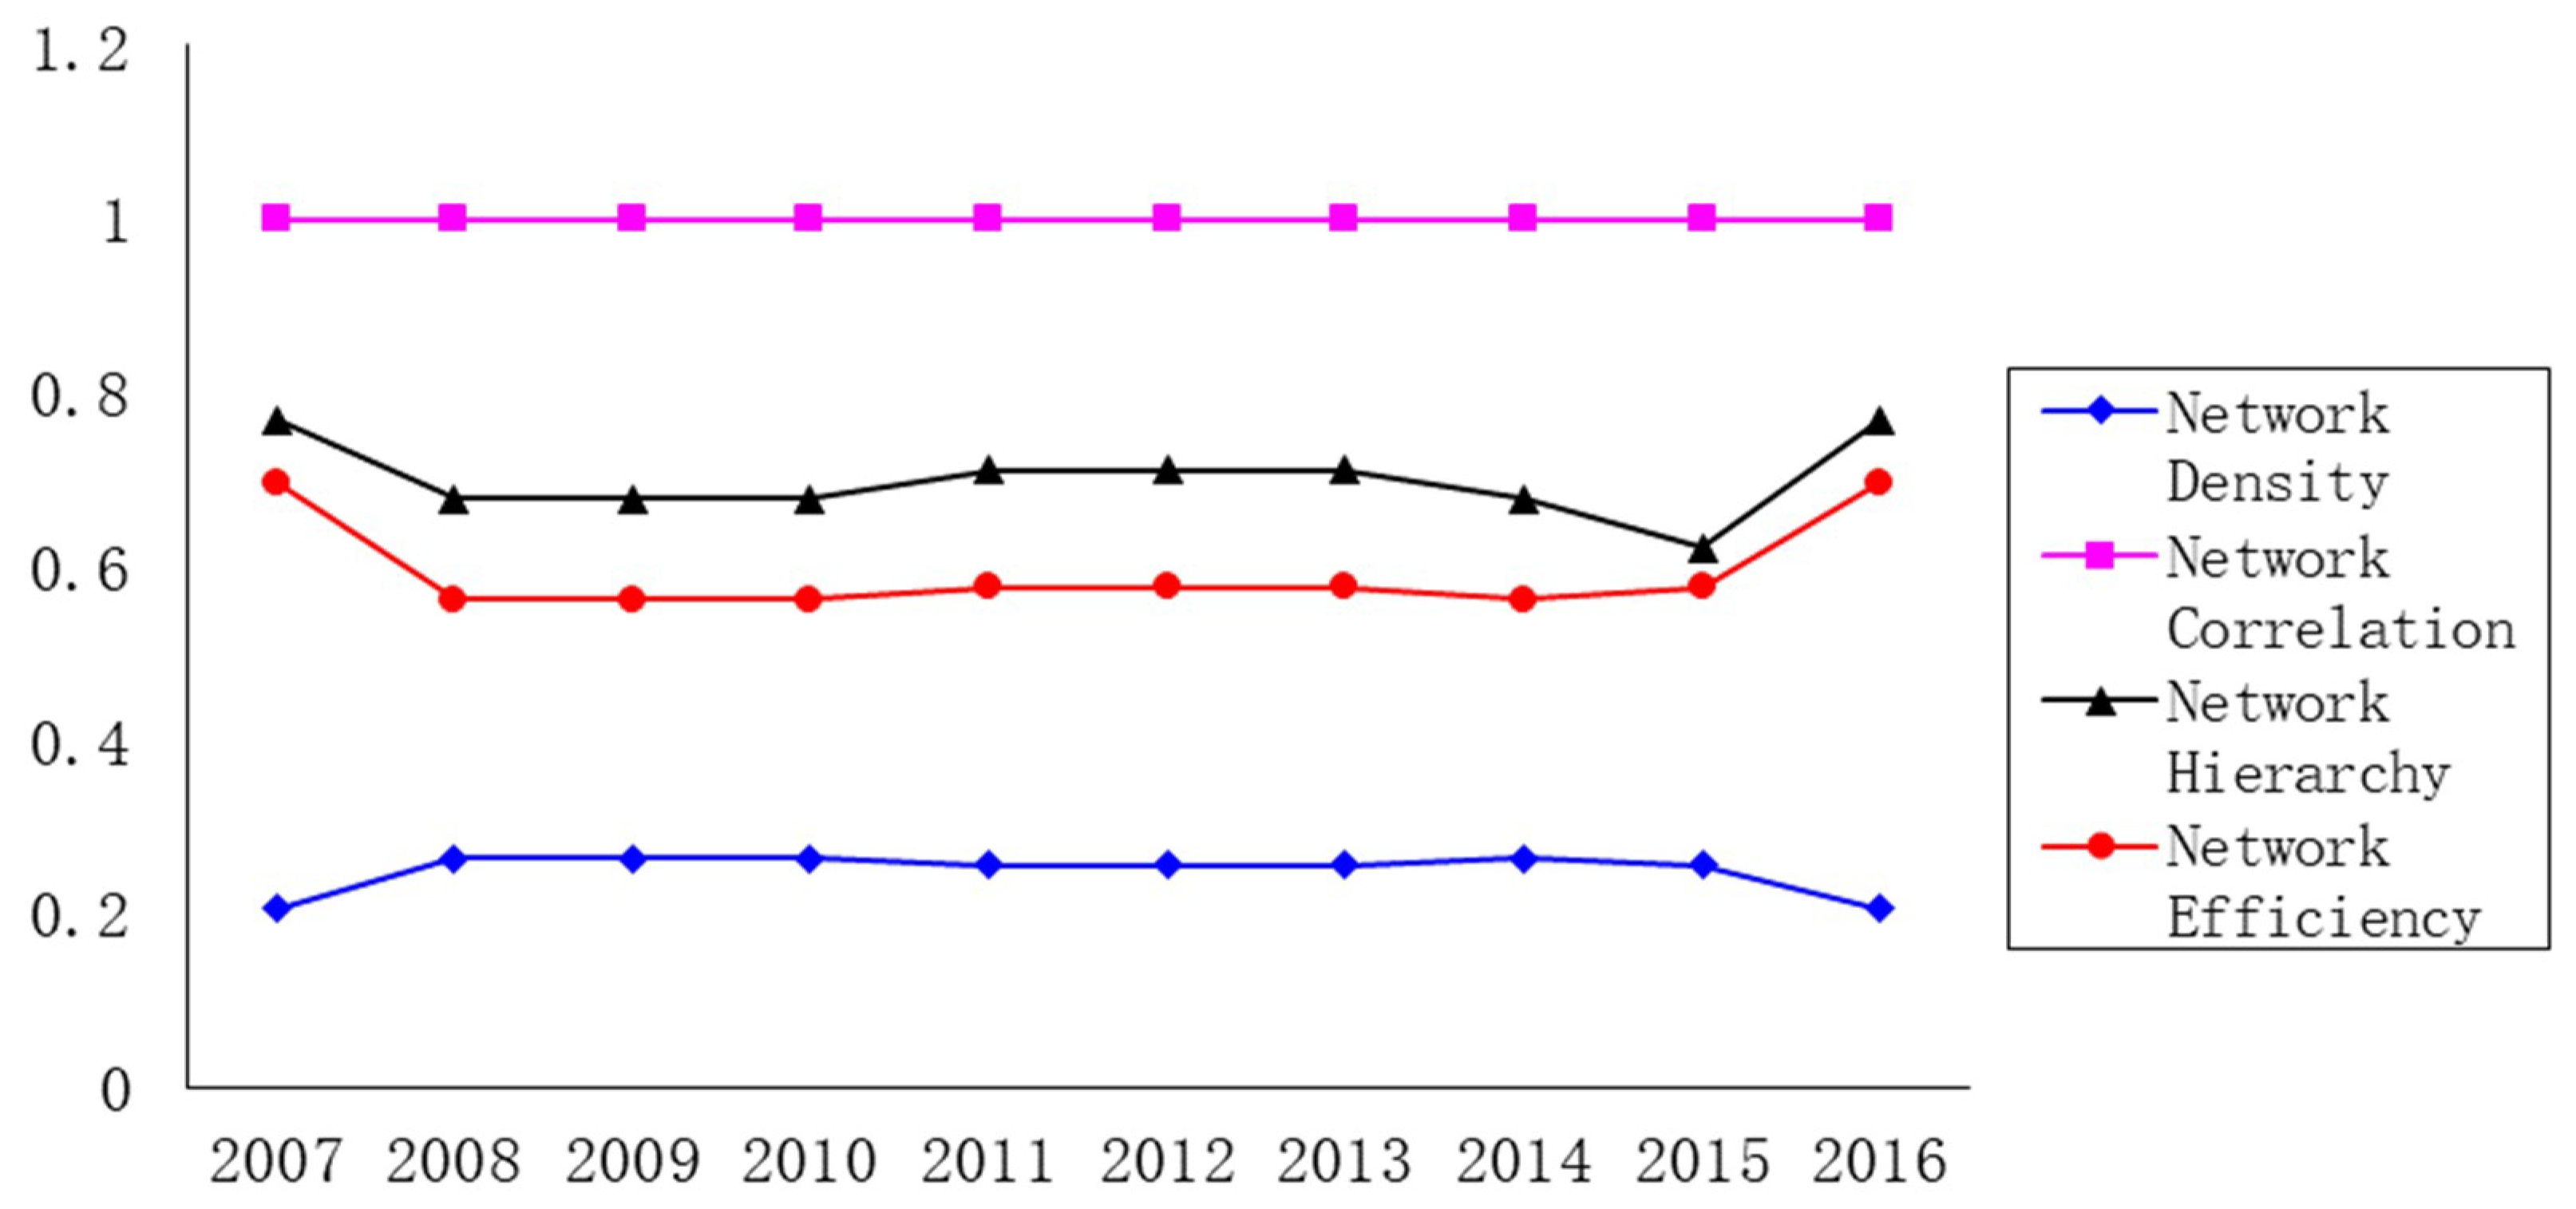
4.1. Characteristic Analysis of the Spatial Network of Carbon Emissions
4.2. Analysis of the Synergetic Effect of Carbon Emission Reduction
5. Conclusions and Policy Implications
5.1. Main Conclusions
5.2. Policy Implications
Author Contributions
Funding
Conflicts of Interest
References
- Li, W.; Wang, W.; Wang, Y.; Ali, M. Historical growth in total factor carbon productivity of the Chinese industry—A comprehensive analysis. J. Clean. Prod. 2018, 170, 471–485. [Google Scholar] [CrossRef]
- People.cn. Greenhouse Gas Bulletin: Global Carbon Dioxide Concentrations Hit a New High in 2016. Available online: http://world.people.com.cn/n1/2017/1031/c1002-29618565.html (accessed on 15 December 2018).
- Tan, X.; Dong, L.; Chen, D.; Gu, B.; Zeng, Y. China’s regional CO2 emissions reduction potential: A study of Chongqing city. Appl. Energy 2016, 162, 1345–1354. [Google Scholar] [CrossRef]
- IEA. CO2 Emissions from Fuel Combustion 2013; IEA: Paris, France, 2014. [Google Scholar]
- Chen, J.D.; Cheng, S.L.; Nikic, V.; Song, M.L. Quo Vadis? Major players in global coal consumption and emissions reduction. Transform. Bus. Econ. 2018, 17, 112–132. [Google Scholar]
- Zhao, Q.R.; Chen, Q.H.; Xiao, Y.T.; Tian, G.Q.; Chu, X.L.; Liu, Q.M. Saving forests through development? Fuelwood consumption and the energy-ladder hypothesis in rural Southern China. Transform. Bus. Econ. 2017, 16, 199–219. [Google Scholar]
- Zhang, C.; Lin, Y. Panel estimation for urbanization energy consumption and CO2 emissions: A regional analysis in China. Energy Policy 2012, 49, 488–498. [Google Scholar] [CrossRef]
- Zhuang, M.; Sheng, J.C.; Webber, M.; Baležentis, T.; Geng, Y.; Zhou, W. Measuring water use performance in the cities along China’s South-North water transfer project. Appl. Geogr. 2018, 98, 184–200. [Google Scholar]
- Zhu, Z.; Liu, Y.; Tian, X.; Wang, Y.; Zhang, Y. CO2 emissions from the industrialization and urbanization processes in the manufacturing center Tianjin in China. J. Clean. Prod. 2017, 168, 867–875. [Google Scholar] [CrossRef]
- Yamaji, K.; Matsuhashi, R.; Nagata, Y.; Kaya, Y. A study on economic measures for CO2 reduction in Japan. Energy Policy 1993, 21, 123–132. [Google Scholar] [CrossRef]
- Ang, B.W. Is the energy intensity being a less useful indicator than the carbon factor in the study of climate change? Energy Policy 1999, 27, 943–946. [Google Scholar] [CrossRef]
- Bohm, P.; Larsen, B. Fairness in a tradable permit treaty for carbon emission reductions in Europe and the former Soviet Union. Environ. Resour. Econ. 1994, 4, 219–239. [Google Scholar] [CrossRef]
- Janssen, M.; Rotmans, J. Allocation of fossil CO2 emission rights quantifying cultural perspectives. Ecol. Econ. 1995, 13, 65–79. [Google Scholar] [CrossRef]
- Zhao, G.M.; Zhao, G.Q.; Chen, L.Z.; Sun, H.P. Research on spatial and temporal evolution of carbon emission intensity and its transition mechanism. China Popul. Resour. Environ. 2017, 27, 84–93. (In Chinese) [Google Scholar]
- Jiang, J.J.; Ye, B.; Xie, D.J.; Tang, J. Provincial-level carbon emission drivers and emission reduction strategies in China: Combining multi-layer LMDI decomposition with hierarchical clustering. J. Clean. Prod. 2017, 169, 178–190. [Google Scholar] [CrossRef]
- Jorgenson, A.; Schor, J. Income Inequality and Carbon Emissions in the United States: A State-level Analysis, 1997–2012. Ecol. Econ. 2017, 134, 40–48. [Google Scholar] [CrossRef]
- Zhao, R.; Min, N.; Gen, Y. Allocation of carbon emissions among industries/sectors: Emissions intensity reduction constrained approach. J. Clean. Prod. 2017, 142, 3083–3094. [Google Scholar] [CrossRef]
- Grunewald, N.; Jakob, M.; Mouratiadou, I. Decomposing inequality in CO2 emissions: The role of primary energy carriers and economic sectors. Ecol. Econ. 2014, 100, 183–194. [Google Scholar] [CrossRef]
- Marbuah, G.; Amuakwa-Mensah, F. Spatial analysis of emissions in Sweden. Energy Econ. 2017, 68, 383–394. [Google Scholar] [CrossRef]
- Wu, H. Analysis on Chinese Provincial Carbon Emission Reduction: Spatial-temporal Patterns, Evolution Mechanisms and Policy Recommendations: Based on the Theory and Method of Spatial Econometrics. Manag. World 2015, 11, 3–10. (In Chinese) [Google Scholar]
- Wang, B.; Sun, Y.F.; Wang, Z.H. Agglomeration effect of CO2 emissions and emissions reduction effect of technology: A spatial econometric perspective based on China’s province-level data. J. Clean. Prod. 2018, 204, 96–106. [Google Scholar] [CrossRef]
- Yan, D.; Lei, Y.L.; Li, L.; Song, W. Carbon emission efficiency and spatial clustering analyses in China’s thermal power industry: Evidence from the provincial level. J. Clean. Prod. 2017, 156, 518–527. [Google Scholar] [CrossRef]
- You, W.H.; Lv, Z.K. Spillover effects of economic globalization on CO2 emissions: A spatial panel approach. Energy Econ. 2018, 73, 248–257. [Google Scholar] [CrossRef]
- Sun, H.; Liu, Y. Analysis on inter-regional differences of carbon emissions loss and profit deviation in China. Manag. Rrev. 2016, 10, 89–96. (In Chinese) [Google Scholar]
- Wang, Y.; Zhao, T.; Wang, J.; Guo, F.; Kan, X.; Yuan, R. Spatial analysis on carbon emission abatement capacity at provincial level in China from 1997 to 2014: An empirical study based on SDM model. Atmos. Pollut. Res. 2019, 10, 97–104. [Google Scholar] [CrossRef]
- Zhang, Y.; Wua, Q.; Zhao, X.; Hao, Y.; Liu, R.; Yang, Z.; Lu, Z. Study of carbon metabolic processes and their spatial distribution in the Beijing-Tianjin-Hebei urban agglomeration. Sci. Total Environ. 2018, 7, 1630–1642. [Google Scholar] [CrossRef] [PubMed]
- Wang, F.; Gao, M.N.; Liu, J.; Fan, W.N. The spatial network structure of China’s regional carbon emissions and its network effect. Energies 2018, 11, 2076. [Google Scholar] [CrossRef]
- Sun, Y.; Liu, H.; Liu, C. Research on spatial association of provinces carbon emissions and its effects in China. Shanghai Econ. Res. 2016, 2, 82–92. (In Chinese) [Google Scholar]
- Yang, G.Y.; Wu, Q.; Xu, Y. Researches of China’s regional carbon emission spatial correlation and its determinants: Based on the method of social network analysis. J. Bus. Econ. 2016, 4, 56–78. (In Chinese) [Google Scholar]
- Chen, J.; Zhao, A.; Zhao, Q.; Song, M.; Baležentis, T.; Streimikiene, D. Estimation and factor decomposition of carbon emissions in China’s tourism sector. Probl. Ekorozw. 2018, 13, 91–101. [Google Scholar]
- Li, J.C.; Xiang, Y.W.; Jia, H.Y.; Chen, L. Analysis of total factor energy efficiency and its influencing factors on key energy-intensive industries in the Beijing-Tianjin-Hebei region. Sustainability 2018, 10, 111. [Google Scholar] [CrossRef]
- Yang, Q.; Wang, X.Z.; Ma, H.M. Assessing green development efficiency of municipalities and provinces in China integrating models of super-efficiency DEA and Malmquist index. Sustainability 2015, 7, 4492–4510. [Google Scholar] [CrossRef]
- Li, J.; Chen, S.; Wan, G.H.; Fu, C.M. Study on the spatial correlation and explanation of regional economic growth in China-Based on analytic network process. Econ. Res. 2014, 11, 4–16. (In Chinese) [Google Scholar]
- Schröter, B.; Hauck, J.; Hackenberg, I.; Matzdorf, B. Bringing transparency into the process: Social network analysis as a tool to support the participatory design and implementation process of Payments for Ecosystem Services. Ecosyst. Serv. 2018, 34 Pt B, 206–217. [Google Scholar] [CrossRef]
- Rödder, W.; Brenner, D.; Kulmann, F. Entropy based evaluation of net structures—Deployed in Social Network Analysis. Expert Syst Appl. 2014, 41, 7968–7979. [Google Scholar] [CrossRef]
- Zhang, G.L.; Zhang, N.; Liao, W.M. How do population and land urbanization affect CO2 emissions under gravity center change? A spatial econometric analysis. J. Clean. Prod. 2018, 202, 510–523. [Google Scholar] [CrossRef]
- Maharani, W.; Gozali, A.A. Collaborative Social Network Analysis and Content-based Approach to Improve the Marketing Strategy of SMEs in Indonesia. Procedia Comput. Sci. 2015, 59, 373–381. [Google Scholar] [CrossRef]
- Rios, V.; Gianmoena, L. Convergence in CO2 emissions: A spatial economic analysis with cross-country interactions. Energy Econ. 2018, 75, 222–238. [Google Scholar] [CrossRef]
- Balado-Naves, R.; Baños-Pino, J.F.; Mayor, M. Do countries influence neighbouring pollution? A spatial analysis of the EKC for CO2 emissions. Energy Policy 2018, 123, 266–279. [Google Scholar] [CrossRef]
- Badi, S.; Wang, L.S.; Pryke, S. Relationship marketing in Guanxi networks: A social network analysis study of Chinese construction small and medium-sized enterprises. Ind. Mark. Manag. 2017, 60, 204–218. [Google Scholar] [CrossRef]
- Brooks, B.; Hogan, B.; Ellison, N.; Lampe, C.; Vitak, J. Assessing structural correlates to social capital in Facebook ego networks. Soc. Networks 2014, 38, 1–15. [Google Scholar] [CrossRef]
- Zhang, L.L.; Xiong, L.C.; Cheng, B.D.; Yu, C. How does foreign trade influence China’s carbon productivity? Based on panel spatial lag model analysis. Struct. Chang. Econ. Dyn. 2018, 47, 171–179. [Google Scholar] [CrossRef]
- Warner, J.; Zawahri, N. Hegemony and Asymmetry: Multiple-chessboard Games on Transboundary Rivers. Int. Environ. Agreem. 2012, 12, 215–229. [Google Scholar] [CrossRef]
- Zhang, L.J.; Rong, P.J.; Qin, Y.C.; Ji, Y.Y. Does Industrial Agglomeration Mitigate Fossil CO2 Emissions? An Empirical Study with Spatial Panel Regression model. Energy Procedia 2018, 152, 731–737. [Google Scholar] [CrossRef]
- Li, W.C.; Yan, Y.H.; Tian, L.X. Spatial Spillover Effects of Industrial Carbon Emissions in China. Energy Procedia 2018, 152, 679–684. [Google Scholar]
- Cerqueira, P.; Martins, R. Measuring the Determinants of Business Cycle Synchronization Using a Panel Approach. Econ. Lett. 2009, 102, 106–108. [Google Scholar] [CrossRef]
- Can, M.; Gozgor, G. The impact of economic complexity on carbon emissions: Evidence from France. Environ. Sci. Pollut. Res. 2017, 24, 16364–16370. [Google Scholar] [CrossRef] [PubMed]
- Han, Y.M.; Long, C.; Geng, Z.Q. Carbon emission analysis and evaluation of industrial departments in China: An improved environmental DEA cross model based on information entropy. J. Environ. Manag. 2018, 205, 298–307. [Google Scholar] [CrossRef] [PubMed]
- Ikeda, K.; Murota, K.; Takayama, Y. Stable economic agglomeration patterns in two dimensions: Beyond the scope of central place theory. J. Reg. Sci. 2017, 57, 132–172. [Google Scholar] [CrossRef]
- Neves, S.A.; Marques, A.C.; Fuinhas, J.A. Is energy consumption in the trans-port sector hampering both economic growth and the reduction of CO2 emissions? A disaggregated energy consumption analysis. Transp. Policy 2017, 59, 64–70. [Google Scholar] [CrossRef]
- Riti, J.S.; Song, D.Y.; Shu, Y. Decoupling CO2 emission and economic growth in China: Is there consistency in estimation results in analyzing environmental Kuznets curve? J. Clean. Prod. 2017, 166, 1448–1461. [Google Scholar] [CrossRef]
- Zhang, Z.; Craft, C.B.; Xue, Z.; Tong, S.; Lu, X. Regulating effects of climate, net primary productivity, and nitrogen on carbon sequestration rates in temperate wet-lands, Northeast China. Ecol. Indic. 2016, 70, 114–124. [Google Scholar] [CrossRef]
- Tao, Y.; Li, F.; Wang, R.; Zhao, D. Effects of land use and cover change on terrestrial carbon stocks in urbanized areas: A study from Changzhou, China. J. Clean. Prod. 2015, 103, 651–657. [Google Scholar] [CrossRef]
- Criado, C.O.; Grether, J.M. Convergence in per capita CO2 emissions: A robust distributional approach. Resour. Energy Econ. 2011, 33, 637–665. [Google Scholar] [CrossRef]
- Aichele, R.; Felbermayr, G. Kyoto and carbon leakage: An empirical analysis of the carbon content of bilateral trade. Rev. Econ. Stat. 2015, 97, 104–115. [Google Scholar] [CrossRef]


| City | Out Degree | In Degree | Degree Centrality (%) | Rank | Betweenness Centrality (%) | Rank |
|---|---|---|---|---|---|---|
| Beijing | 2 | 9 | 91.667 | 1 | 7.071 | 2 |
| Tianjin | 3 | 9 | 91.667 | 1 | 15.404 | 1 |
| Shijiazhuang | 4 | 1 | 33.333 | 3 | 0.253 | 6 |
| Chengde | 2 | 0 | 16.667 | 9 | 0.000 | 8 |
| Zhangjiakou | 2 | 0 | 16.667 | 9 | 0.000 | 8 |
| Qinhuangdao | 3 | 0 | 25.000 | 5 | 0.000 | 8 |
| Tangshan | 2 | 1 | 25.000 | 5 | 0.000 | 8 |
| Langfang | 2 | 2 | 16.667 | 9 | 1.010 | 3 |
| Baoding | 2 | 3 | 25.000 | 5 | 1.010 | 3 |
| Cangzhou | 2 | 1 | 16.667 | 9 | 0.253 | 6 |
| Hengshui | 2 | 0 | 16.667 | 9 | 0.000 | 8 |
| Xingtai | 3 | 2 | 33.333 | 3 | 0.758 | 5 |
| Handan | 3 | 0 | 25.000 | 5 | 0.000 | 8 |
| City | 2007 | 2008 | 2009 | 2010 | 2011 | 2012 | 2013 | 2014 | 2015 | 2016 | Mean |
|---|---|---|---|---|---|---|---|---|---|---|---|
| Tianjin | −2.404 | −2.071 | −1.100 | 0.705 | 0.827 | 0.711 | −0.457 | 0.047 | −0.424 | −0.550 | −0.466 |
| Shijiazhuang | −2.562 | −1.728 | −0.277 | 0.033 | 0.862 | 0.619 | −1.025 | 0.135 | −0.287 | −0.384 | −0.461 |
| Chengde | −2.682 | −1.031 | −0.922 | −0.326 | 0.995 | 0.998 | 0.514 | −0.996 | −2.040 | −3.021 | −0.869 |
| Zhangjiakou | −3.378 | −1.581 | −0.709 | 0.367 | 0.969 | 0.723 | −0.471 | −0.041 | −0.385 | −1.859 | −0.637 |
| Qinhuangdao | −2.722 | −1.969 | −0.801 | 0.262 | 0.856 | 0.795 | 0.663 | 0.040 | −0.508 | −3.987 | −0.737 |
| Tangshan | −3.116 | −1.107 | −0.246 | 0.515 | 0.613 | 0.440 | −0.483 | 0.330 | 0.598 | −0.569 | −0.302 |
| Langfang | −2.510 | −1.662 | −0.799 | −0.004 | 0.994 | 0.844 | −0.052 | 0.107 | −2.961 | −1.009 | −0.705 |
| Baoding | −2.136 | −2.123 | −0.417 | 0.418 | 0.821 | 0.416 | −0.820 | 0.530 | −0.378 | −0.199 | −0.389 |
| Cangzhou | −2.585 | −2.063 | −0.669 | 0.519 | 0.621 | 0.654 | −0.485 | 0.597 | −0.012 | −1.454 | −0.488 |
| Hengshui | −1.972 | −2.303 | −1.037 | 0.300 | 0.799 | 0.542 | −0.466 | 0.619 | −0.223 | −2.079 | −0.580 |
| Xingtai | −0.803 | −2.985 | −0.753 | 0.165 | 0.532 | 0.464 | −0.184 | 0.876 | 0.093 | −2.126 | −0.472 |
| Handan | −2.513 | −1.614 | −0.697 | 0.365 | 0.706 | 0.380 | −0.230 | 0.626 | 0.523 | −2.421 | −0.488 |
| Mean | −2.449 | −1.849 | −0.702 | 0.277 | 0.800 | 0.632 | −0.290 | 0.239 | −0.500 | −1.653 | −0.550 |
| Explanatory Variables | Model (1) | Model (2) | Model (3) |
|---|---|---|---|
| Constant Term | −8.457 ** | 6.646 * | 7.540 ** |
| Network Density | 31.809 ** | — | — |
| Network Hierarchy | — | −10.283 * | — |
| Network Efficiency | — | — | −13.613 ** |
| R2 | 0.441 | 0.173 | 0.448 |
| F-statistic | 6.312 | 1.671 | 6.480 |
© 2019 by the authors. Licensee MDPI, Basel, Switzerland. This article is an open access article distributed under the terms and conditions of the Creative Commons Attribution (CC BY) license (http://creativecommons.org/licenses/by/4.0/).
Share and Cite
Li, X.; Feng, D.; Li, J.; Zhang, Z. Research on the Spatial Network Characteristics and Synergetic Abatement Effect of the Carbon Emissions in Beijing–Tianjin–Hebei Urban Agglomeration. Sustainability 2019, 11, 1444. https://doi.org/10.3390/su11051444
Li X, Feng D, Li J, Zhang Z. Research on the Spatial Network Characteristics and Synergetic Abatement Effect of the Carbon Emissions in Beijing–Tianjin–Hebei Urban Agglomeration. Sustainability. 2019; 11(5):1444. https://doi.org/10.3390/su11051444
Chicago/Turabian StyleLi, Xintao, Dong Feng, Jian Li, and Zaisheng Zhang. 2019. "Research on the Spatial Network Characteristics and Synergetic Abatement Effect of the Carbon Emissions in Beijing–Tianjin–Hebei Urban Agglomeration" Sustainability 11, no. 5: 1444. https://doi.org/10.3390/su11051444
APA StyleLi, X., Feng, D., Li, J., & Zhang, Z. (2019). Research on the Spatial Network Characteristics and Synergetic Abatement Effect of the Carbon Emissions in Beijing–Tianjin–Hebei Urban Agglomeration. Sustainability, 11(5), 1444. https://doi.org/10.3390/su11051444