Article

Standardization of the Evaluation Index System for Low-Carbon Cities in China: A Case Study of Xiamen

1
Key Laboratory of Urban Environment and Health, Institute of Urban Environment, Chinese Academy of Sciences, 1799 Jimei Road, Xiamen 361021, Fujian, China
2
University of Chinese Academy of Sciences, Beijing 100049, China
*
Author to whom correspondence should be addressed.
Sustainability 2018, 10(10), 3751; https://doi.org/10.3390/su10103751
Submission received: 29 August 2018 / Revised: 22 September 2018 / Accepted: 12 October 2018 / Published: 18 October 2018

Abstract

:
The construction of a reasonable evaluation index system for low-carbon cities is an important part of China’s green development strategy in urban areas. In this study, based on the theoretical framework for the concept of low-carbon cities, the perspectives from three index systems—that is, the Drivers, Pressures, State, Impact, Response model of intervention (DPSIR), a complex ecosystem, and a carbon source/sink process—were integrated to extract common indicators from existing evaluation index systems for low-carbon cities. Subsequently, a standardized evaluation index system for low-carbon cities that contained five indicators—carbon emission, low carbon production, low carbon consumption, low-carbon policy, and social economic development—was established. Thereafter, Xiamen was selected for an empirical analysis by determining the indicator weight with an entropy weight method and by carrying out a comprehensive evaluation using a linear summation model. The results showed that the weights of the five selected primary indicators for the evaluation of low-carbon cities were: low-carbon production > low-carbon consumption > social economic development > carbon emission > low-carbon policy. Among the secondary indicators, the average entropy weight of “pollution emission” was the highest at 0.1591, while the average entropy weight of “urbanization rate” was the lowest at 0.0360. Furthermore, the comprehensive index of low-carbon development in 2015 was higher than that in 2010, while the rate of economic growth was greater than the growth rate of carbon emission, which indicated that the relative decoupling of economic growth from carbon emission was basically achieved.

1. Introduction

In recent years, global warming has led to the gradual adoption of developmental models involving green, low-carbon, and circular economies [1]. China has become the largest energy producer and consumer in the world [2]. In 2016, China’s carbon emissions accounted for 27.3% of the world’s total carbon emissions, making China the world’s largest carbon emitter [3]. Cities are the main contributors to carbon emissions, accounting for 75% of total emissions, and this proportion continues to rise with urbanization [4]. The UN’s publication, “Transforming our World: the 2030 Agenda for Sustainable Development”, contains 17 sustainable development goals, and one of the key objectives is to take urgent action to address climate change and its impacts and promote sustainable development [5]. In the 2015 United Nations Climate Change Conference held in Paris, China submitted the Intended Nationally Determined Contributions (INDC) documents, which stated that China would reach its peak in CO2 emissions around 2030 and would strive to decrease its CO2 emission per unit Gross Domestic Product (GDP) in 2030 by 60–65% compared to that in 2005 [6]. In this context, the low-carbon development model has become the best choice for long-term global development [7]. Scholars have conducted extensive research focused on low-carbon development, and the evaluation of low-carbon cities has become a popular area of research. The study reviewed the four representative international low-carbon indicator systems and 14 representative Chinese low-carbon indicator systems. The primary indicators selected by scholars in constructing the index system are mainly related to energy, economy, society, and environment. The scope of evaluation is extensive, including an evaluation of the low-carbon development level of the world, the country, and the city. The evaluation results provide a realistic basis for city decision makers and managers to formulate and manage low-carbon development of cities, and may have a great role in promoting the low-carbon development of cities (Table 1). However, the lack of adequate standards related to low-carbon cities significantly constrains the strategic development, planning, and construction of low-carbon cities.
Therefore, based on a systematic review of existing index systems for low-carbon cities, this study comprehensively compared the advantages and disadvantages of each index system. In addition, by extracting reasonable common indicators and using relevant standards of urban construction promulgated by the Chinese government as a reference, this study attempted to construct a standardized evaluation index system for low-carbon cities. It is expected that this index system can be used by urban-level management departments to evaluate low-carbon development within cities, as well as by national-level management departments to evaluate and compare low- carbon development among different cities, so that a better path for the development of low-carbon cities can be explored.

2. Construction of the Index System

2.1. Theoretical Basis for Standardization of the Evaluation Index System

We conducted an in-depth comparison and systematic analysis of representative evaluation index systems for low-carbon cities in China and elsewhere. Subsequently, all index systems were classified into three categories according to the perspective from which the index system is constructed, while all indicators in each category of index systems were then summarized according to their frequency and commonality. It was found that the index systems were mainly constructed from the following three perspectives:

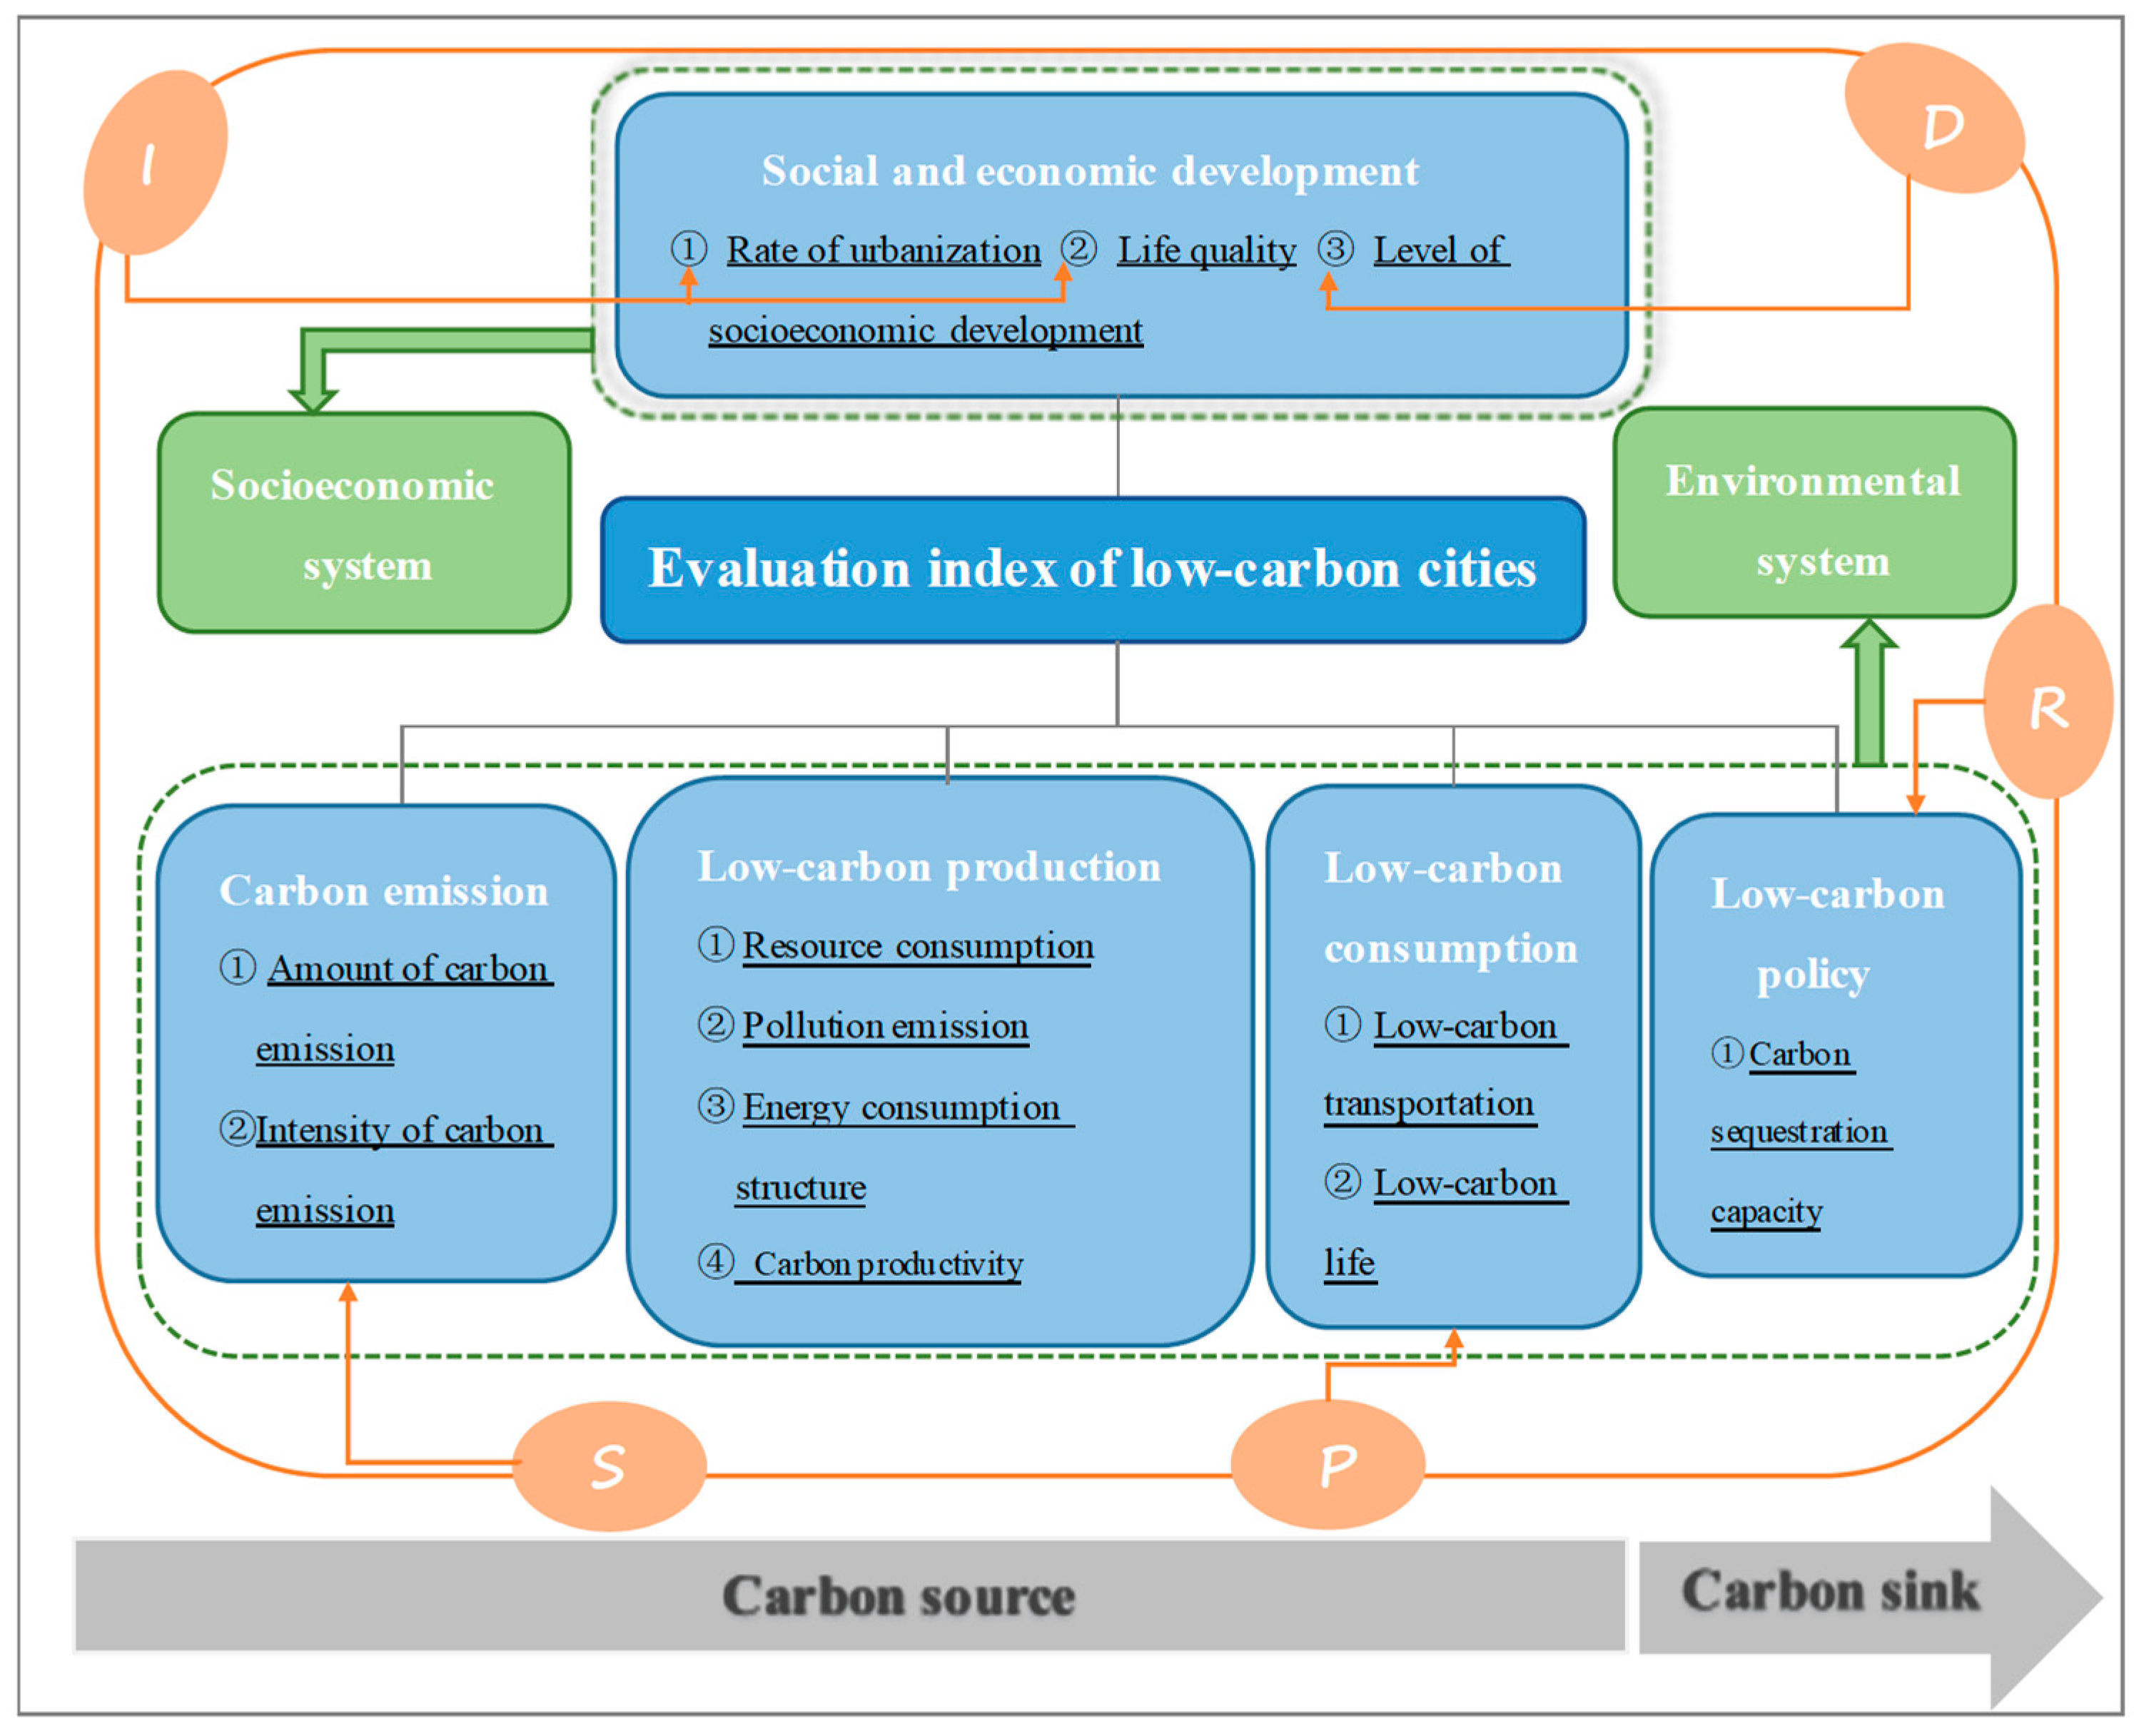
2.1.1. Orientation from the Drivers-Pressures-State-Impact-Response (DPSIR) Model of Intervention

Some evaluation index systems for low-carbon cities were constructed based on the DPSIR model, which emphasizes economic operations and their impact on the environment, as well as the relationships between economic operations and the environment. The DPSIR model is comprehensive, systematic, holistic, and flexible. Most of its “Drivers” are selected from the aspects of GDP, industrial output, and disposable income, while its “Pressures” are mainly selected from the aspects of resource consumption, energy consumption, and the mode of consumption. The “State” of the DPSIR model is mainly selected from the aspects of pollutant discharge and industry/energy structure, the “Impact” is mainly selected from the aspects of social development, ecological environment, and public evaluation, and the “Response” is mainly selected from the aspects of pollution control and carbon sink capacity (Table 2).
The evaluation index systems constructed based on the DPSIR model summarizes the development level of low-carbon cities in terms of Drivers, Pressures, State, Impact, and Response. Such index systems help to facilitate an intuitive understanding of the assuring factors, problems, status quo, and countermeasures required to maintain the development of low-carbon cities. As a result, such index systems can solve the problems faced by decision-makers with regard to developing effective urban management policies, which are difficult to achieve because it is often unclear which departments are responsible for low-carbon development, and the level of low-carbon development in specific sectors can be difficult to determine.

2.1.2. Orientation from the Complex Ecosystem

Based on the concept of the complex ecosystem, the index system for the evaluation of low-carbon cities can be set up by configuring indicators for the three subsystems of a city—that is, the social, economic, and environmental systems.
As a complex ecosystem, the indicators of low-carbon cities mainly characterize low-carbon development in the social, economic, and environmental subsystems. The indicators for the economic system are mainly relevant to total production output and per capita disposable income of urban residents. The indicators for the social system are mainly related to aspects of quality of life, consumption mode, transportation systems, and social security. The indicators for the environmental system are related to aspects of energy consumption structure, resource consumption, pollution emissions, carbon emissions, and ecological environment quality (Table 3).
It is easier for urban managers to understand the specific conditions of various sectors or industries in cities and to divide responsibilities among relevant decision makers if a low-carbon city is treated as a complex ecosystem, so that the level of low-carbon development can be analyzed systematically based on the social, economic, and environmental subsystems. However, such systems are only applicable to the internal evaluation of urban development, and are not applicable to the external evaluation of urban development. From the perspective of existing index systems, the indicators selected by each system and individual departments are not homogeneous, and the nature of such indicators does not consider all aspects of Drivers, Pressures, State, Impact, and Response.

2.1.3. Orientation from the Carbon Source/Sink Process Perspective

The index system for the evaluation of low-carbon cities can be established from the perspective of the carbon source/sink process (resources, production, consumption, emissions, and treatment).
In essence, the construction of an index system from the perspective of a carbon source/sink is an analysis of the level of low-carbon development in cities, with a focus on resources, production, consumption, emissions, and treatment. The process of production using resources and subsequent consumption and emissions can be considered as carbon source generation, and treatment is the carbon sink process. The carbon sources in cities mainly come from the industrial, transportation, and construction sectors, as well as from the household consumption of residents. In previous research, the indicators to characterize carbon sources have mainly been selected from five aspects: energy, industry, transportation, construction, and household consumption of residents. In contrast, the indicators used to represent carbon sinks have mainly been related to aspects of green space (Table 4).
The statuses of resource production and consumption, as well as pollution discharge and treatment, can be more clearly understood if the carbon level in cities is analyzed with a focus on resources, production, consumption, emission, and treatment. Therefore, such an approach is applicable for comparisons of the levels of low-carbon development among different low-carbon cities. However, based on the analysis using the DPSIR model, the index systems constructed from this perspective lack indicators characterizing the Drivers of low-carbon urban development. In addition, the low-carbon development profile of specific urban sectors is not fully reflected in such an approach—that is, indicators applicable to the internal evaluation of cities are not fully reflected.
In summary, the index systems constructed from the three perspectives described above have distinct advantages and disadvantages. Index systems generated from a single perspective can no longer meet the growing demand for more scientific and reasonable evaluation of the low-carbon development of cities. Therefore, we integrated the three perspectives described above to establish an evaluation index system for low-carbon cities that can be used for both internal (i.e., vertical) and external (i.e., horizontal) evaluation.

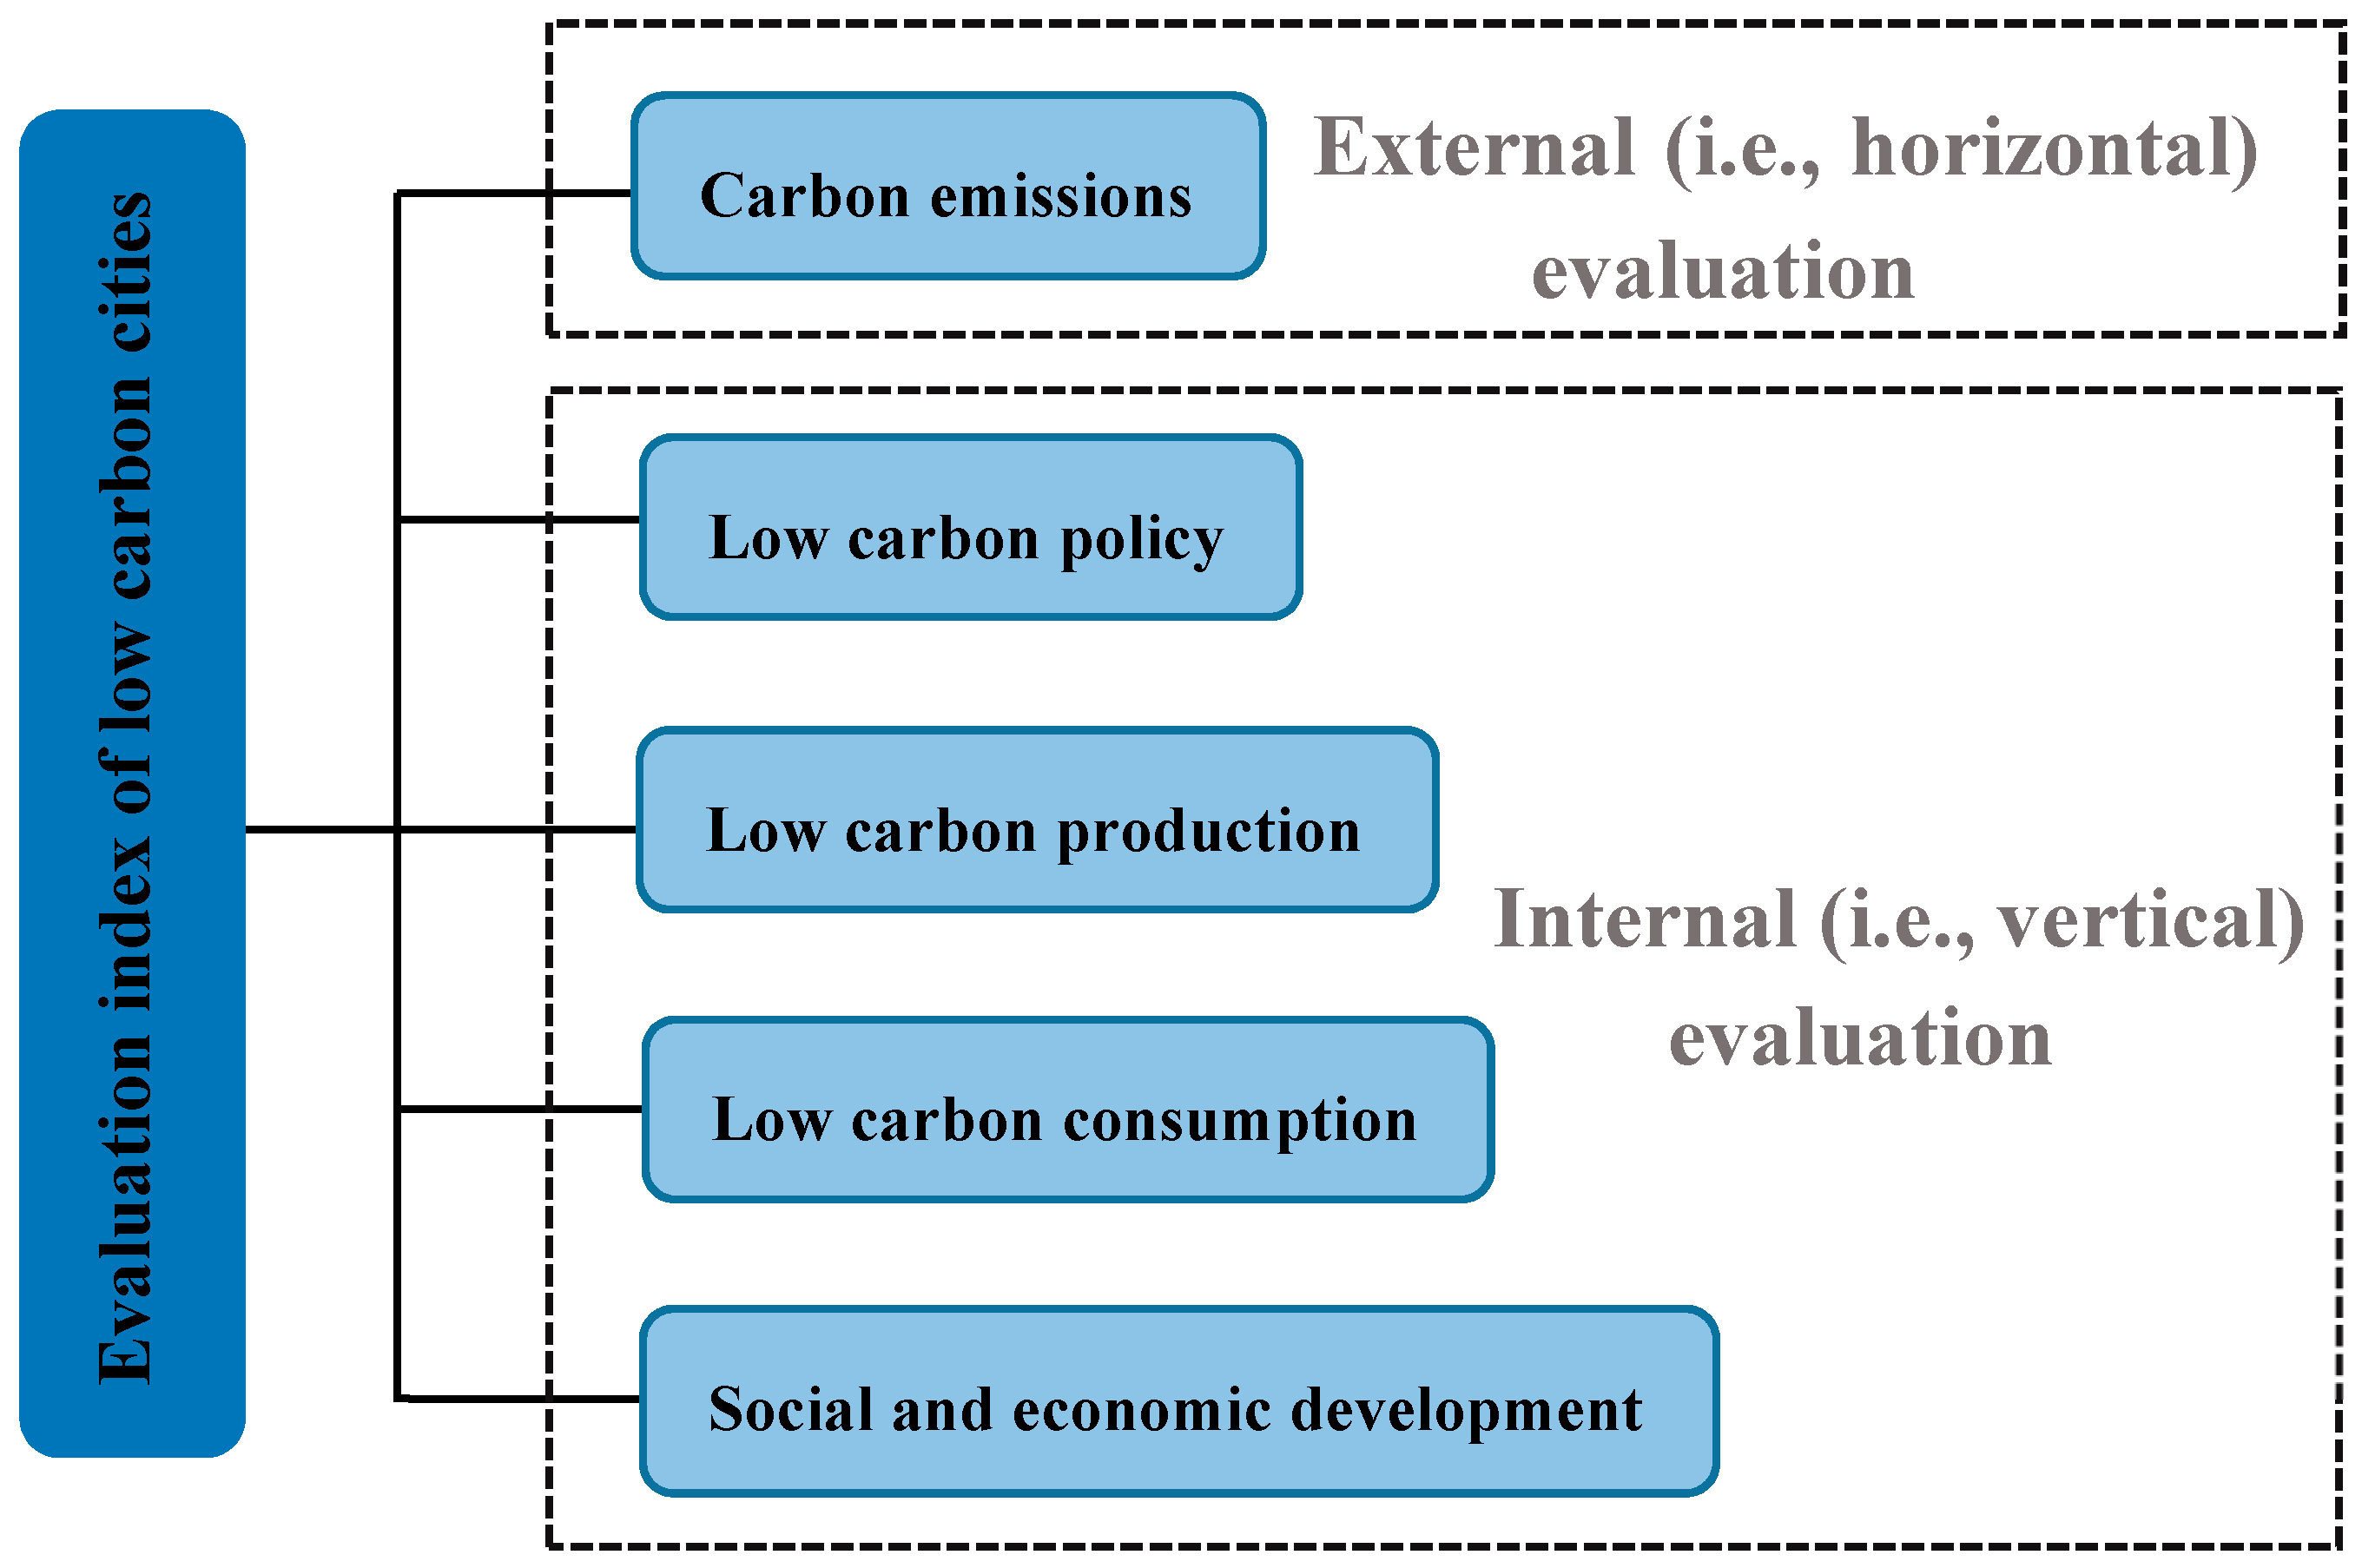
2.2. Low-Carbon Evaluation Index System Constructed from Three Perspectives

Based on our review of current evaluation index systems, and in strict accordance with pertinent scientific, systematic, hierarchical, dynamic, and operable principles, an index system was established from the perspectives of the DPSIR model, the complex ecosystem, and the carbon source/sink process. This model was constructed in reference to recognized index systems in China and elsewhere. The evaluation of the model was focused on low-carbon development, eco-cities, green cities, and sustainable development. After several rounds of systematic comparison, analysis and screening of existing index systems, ISO37120, the “Low-carbon eco-city evaluation tool for China”, the “Plan for low-carbon development in Jilin city”, the “Media alliance standard of China’s low-carbon economy”, the “China Green Development Index”, and the “Index system for the evaluation of low-carbon city construction in China” were selected as the primary references from which common indicators corresponding to low-carbon urban construction were extracted [12,22,27,28,35,36]. Subsequently, individual indicators were adjusted by consulting with experts in this field to construct a final standardized index system for low-carbon evaluation, which included five aspects: carbon emissions, low-carbon production, low-carbon consumption, low-carbon policies, and socio-economic development (Figure 1).
From the range of evaluation indicators, the external evaluation selected carbon emission indicators to evaluate the low-carbon development of different cities, while the internal evaluation selected a set of indicators to reflect the low-carbon construction of different industries and departments within a city. The evaluation conducted with these indicators showed that they reflect the current status of low-carbon development, as well as low-carbon strategies and approaches for further improvement. The attributes of these indicators are also balanced with regard to positive and negative aspects. The positive indicators reflect social and economic development, carbon source and sink capacities, and energy conservation and environmental protection. The negative indicators reflect carbon emissions, pollution emissions, and resource consumption (Table 5).

3. Methodology

The evaluation method is mainly reflected in the two key links of index weight determination and comprehensive evaluation. There are two main methods to determining the weight of indicators: subjective evaluation and objective evaluation. Subjective evaluation mainly focuses on the Analytic Hierarchy Process and the Delphi method. For example, Hua evaluated the low-carbon construction of 13 prefecture-level cities in Jiangsu Province based on an analytic hierarchy process, and the Media Alliance of China’s Low-Carbon Economy used the Delphi method to evaluate the low-carbon development of mainland Chinese cities [20,27]. Objective evaluation methods mainly use the correlation coefficient method, the entropy weight method, and the factor analysis method. Tan used the entropy weight method to evaluate the low-carbon development of 10 domestic and foreign cities, and Yi used the factor analysis method to make an empirical analysis of the development level of low-carbon cities in the six central provincial capitals in 2008 [10,37]. In general, the subjective evaluation method determines the importance of each index according to subjective judgment, which has the advantages of a clear concept, simplicity, and feasibility; however, it is more easily interfered with by subjective factors. According to the standardized data of each index, the objective evaluation method automatically entrust weight according to certain rules. Although its advantages are rigorous calculation and objective evaluation, the results can change along with the data and the stability is poor. Furthermore, the comprehensive evaluation model mainly concentrates on Technology for Order Preference by Similarity to an Ideal Solution (TOPSIS), the Analytic Hierarchy Process (AHP), Fuzzy Comprehensive Evaluation (FCE), the Synthetical Index method, and the Content Analysis method, where comparisons of each method is presented in Table 6. The comprehensive evaluation model and weight-quantifying methods have their own advantages and disadvantages. In the actual evaluation, it is necessary to select the appropriate evaluation method according to the actual conditions.

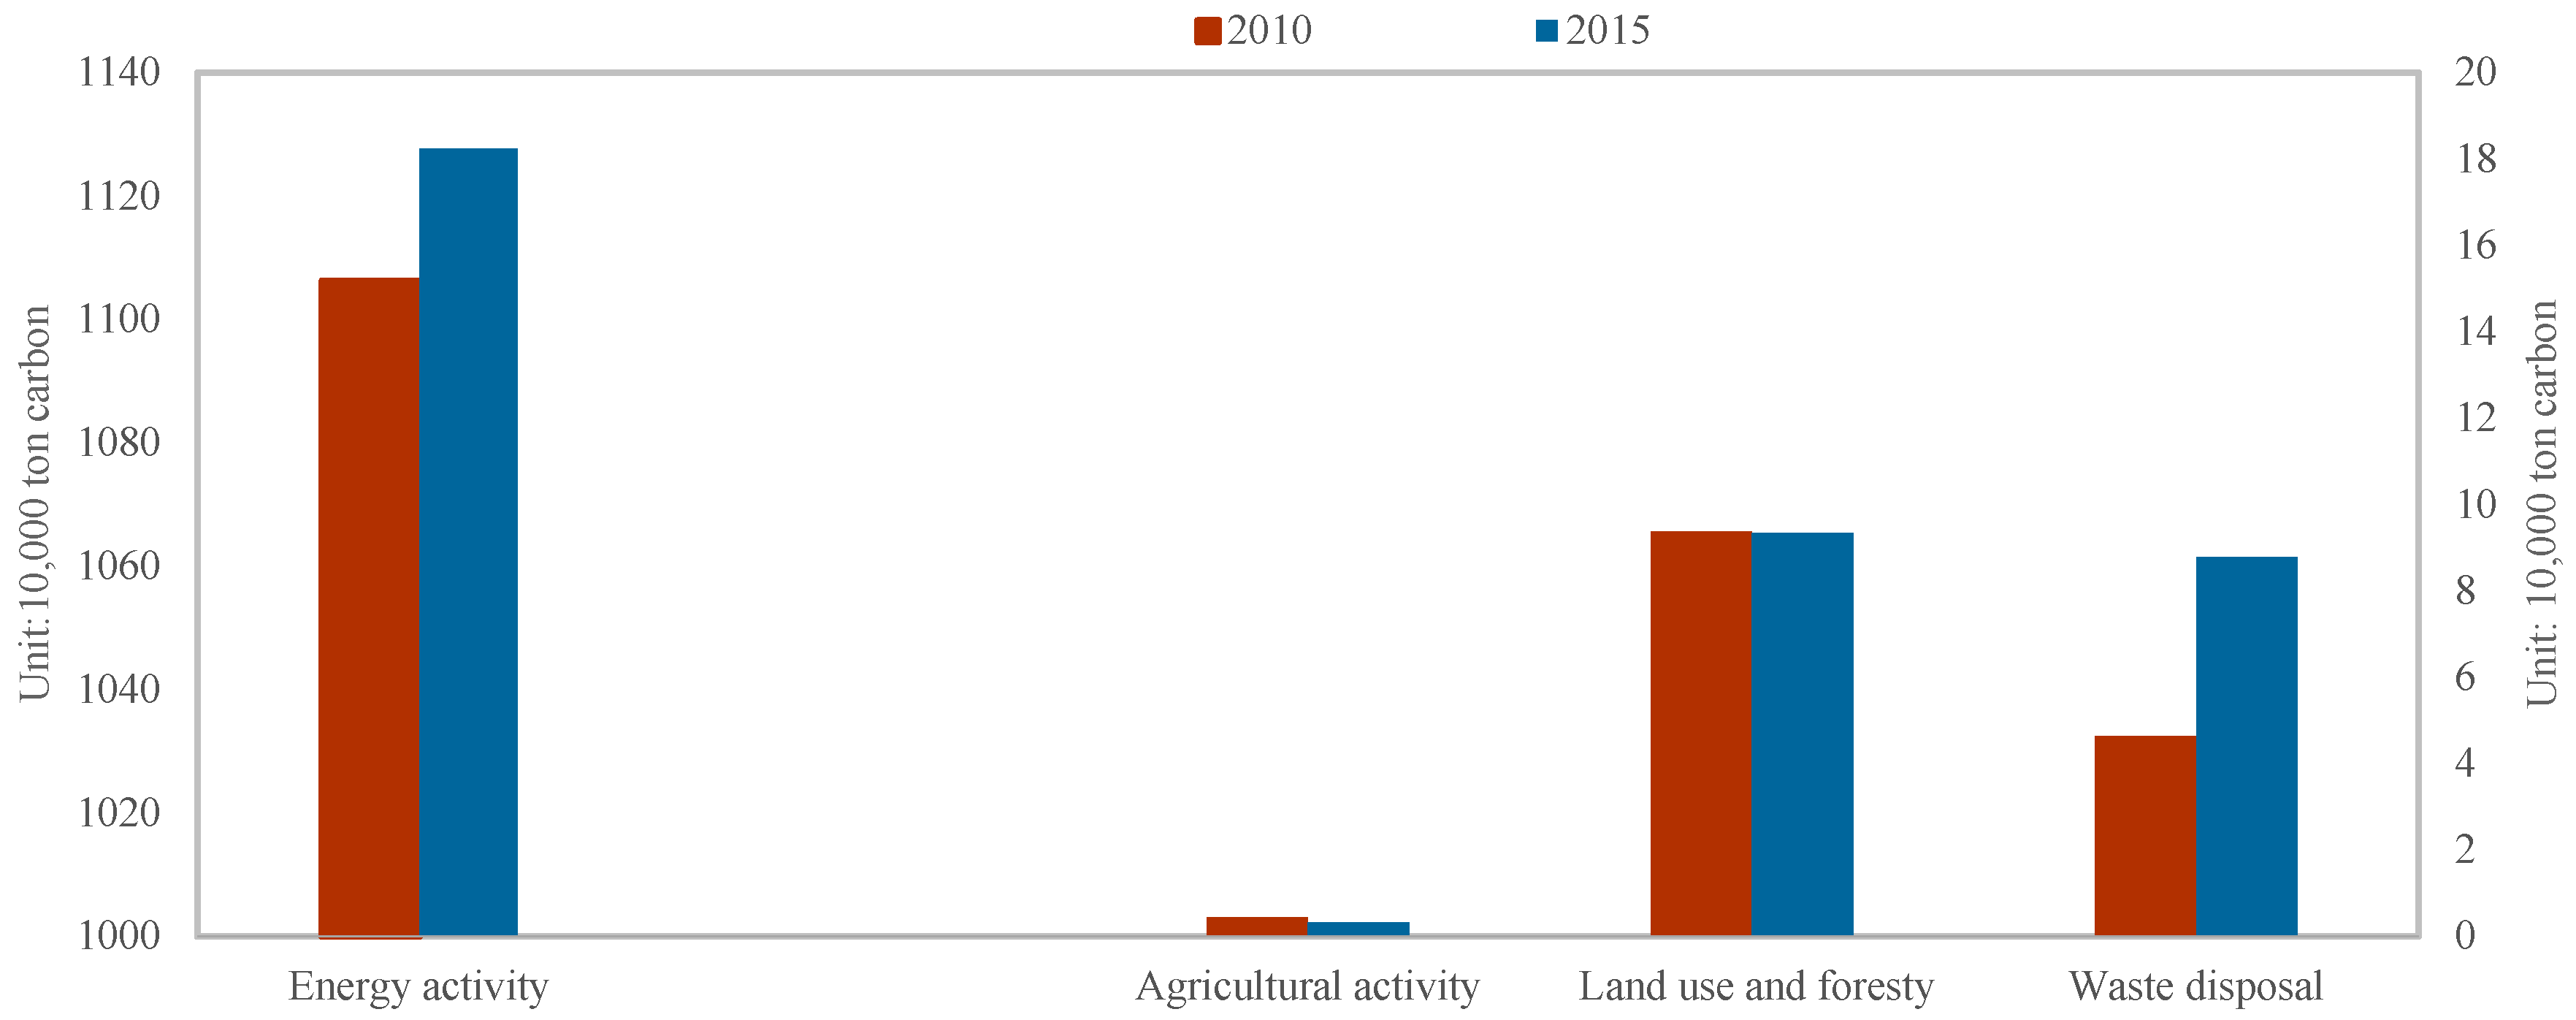
3.1. Carbon Emission Calculated Based on IPCC Assessment

Based on the IPCC Guidelines for Greenhouse Gas Inventories, calculation of urban carbon emissions primarily involves greenhouse gases generated by activities in five areas: energy activities, industrial processes, changes in land use, forestry and agricultural activities, and waste disposal [42]. The calculation principle is:
Emissions = Activity level × Emission factor
The data on activity level were directly obtained or calculated from the statistical yearbook. The emission factor data were mainly obtained according to the “Guidelines for the Accounting Tools of Urban Greenhouse Gas (Test Version 1.0)” and relevant studies [43,44].

3.2. An Entropy Weight Method to Determine the Weight of Different Indicators

The entropy weight method is a mathematical method for calculating a comprehensive index based on the comprehensive consideration of the amount of information provided by various factors [45,46]. As an objective and comprehensive weighting method, the entropy weight method mainly determines the weight according to the amount of information transmitted by each indicator to the decision maker. For a certain indicator Xj, a larger difference in the values of Xij indicates a greater role of this indicator in the comprehensive evaluation. If the values of an indicator are all equal, this indicator does not play a role in the comprehensive evaluation. The specific steps are as follows:
(1)
Establish an original matrix, X
X = [ X 11 X 21 X 12 X 1 n X 22 X 2 n       X m 1 X m 2 X m n ] m × n
where m is the number of objects to be evaluated, n is the number of evaluation indicators, and Xij is the evaluation value of object i under indicator j, i = 1, …, m, j = 1, …, n, m = 2, and n = 27.
(2)
Matrix the indicators according to the same ratio and calculate the weight pij of indicator j in protocol i:
p i j = X i j i = 1 m X i j
(3)
Calculate the entropy value ej of indicator j:
e j = 1 ln ( m ) i = 1 m ( p i j × ln p i j )
Note: If pij = 0, define pij × ln pij = 0.
(4)
Determine the entropy weight wj of indicator j:
w j = 1 e j j = 1 n ( 1 e j )

3.3. Comprehensive Evaluation Using a Linear Summation Model

The so-called linear summation model involves multiplying the weights of indicators by the processed data, followed by a simple summation [38]. It is performed as follows:
Y k = j = 1 n w j X j
where Yk is the comprehensive evaluation level of object k, wj is the weight of object k under indicator j, Xj is the normalized value of object k under indicator j, and n is the number of indicators for the evaluation object.

3.4. Overview of the Study Area

Xiamen is located in the central part of the west bank of the Taiwan Strait, at the center of the Golden Triangle of southern Fujian (north latitude 24°23′ to 24°54′ and east longitude 117°52′ to 118°26′). Xiamen has a tropical monsoon climate with long, hot, humid summers and warm winters. The annual level of precipitation in Xiamen is relatively high, and it receives a relatively large amount of solar radiation. At the end of 2015, Xiamen had a total population of 3.86 million, including an urban population of 1.68 million. In 2010, the National Development and Reform Commission of China issued the “Notice on Launching Pilot Projects for Low-Carbon Provinces and Low-Carbon Cities”, which included Xiamen as one of the “five provinces and eight cities” in the pilot study. Therefore, the analysis of Xiamen’s low-carbon development between 2010 and 2015 has practical guiding significance for the construction of low-carbon cities in Xiamen and across China.

3.5. Data Sources

The data used in this study were either obtained directly from statistical yearbooks, literature, and the websites of relevant departments, or by calculation. The yearbooks used in this study included the “Xiamen Special Economic Zone Yearbook 2011” and “Xiamen Special Economic Zone Yearbook 2016”, the “Fujian Statistical Yearbook 2011” and “Fujian Statistical Yearbook 2016”, and the “Fujian Energy Balance Sheet 2011” and “Fujian Energy Balance Sheet 2016”.

4. Results

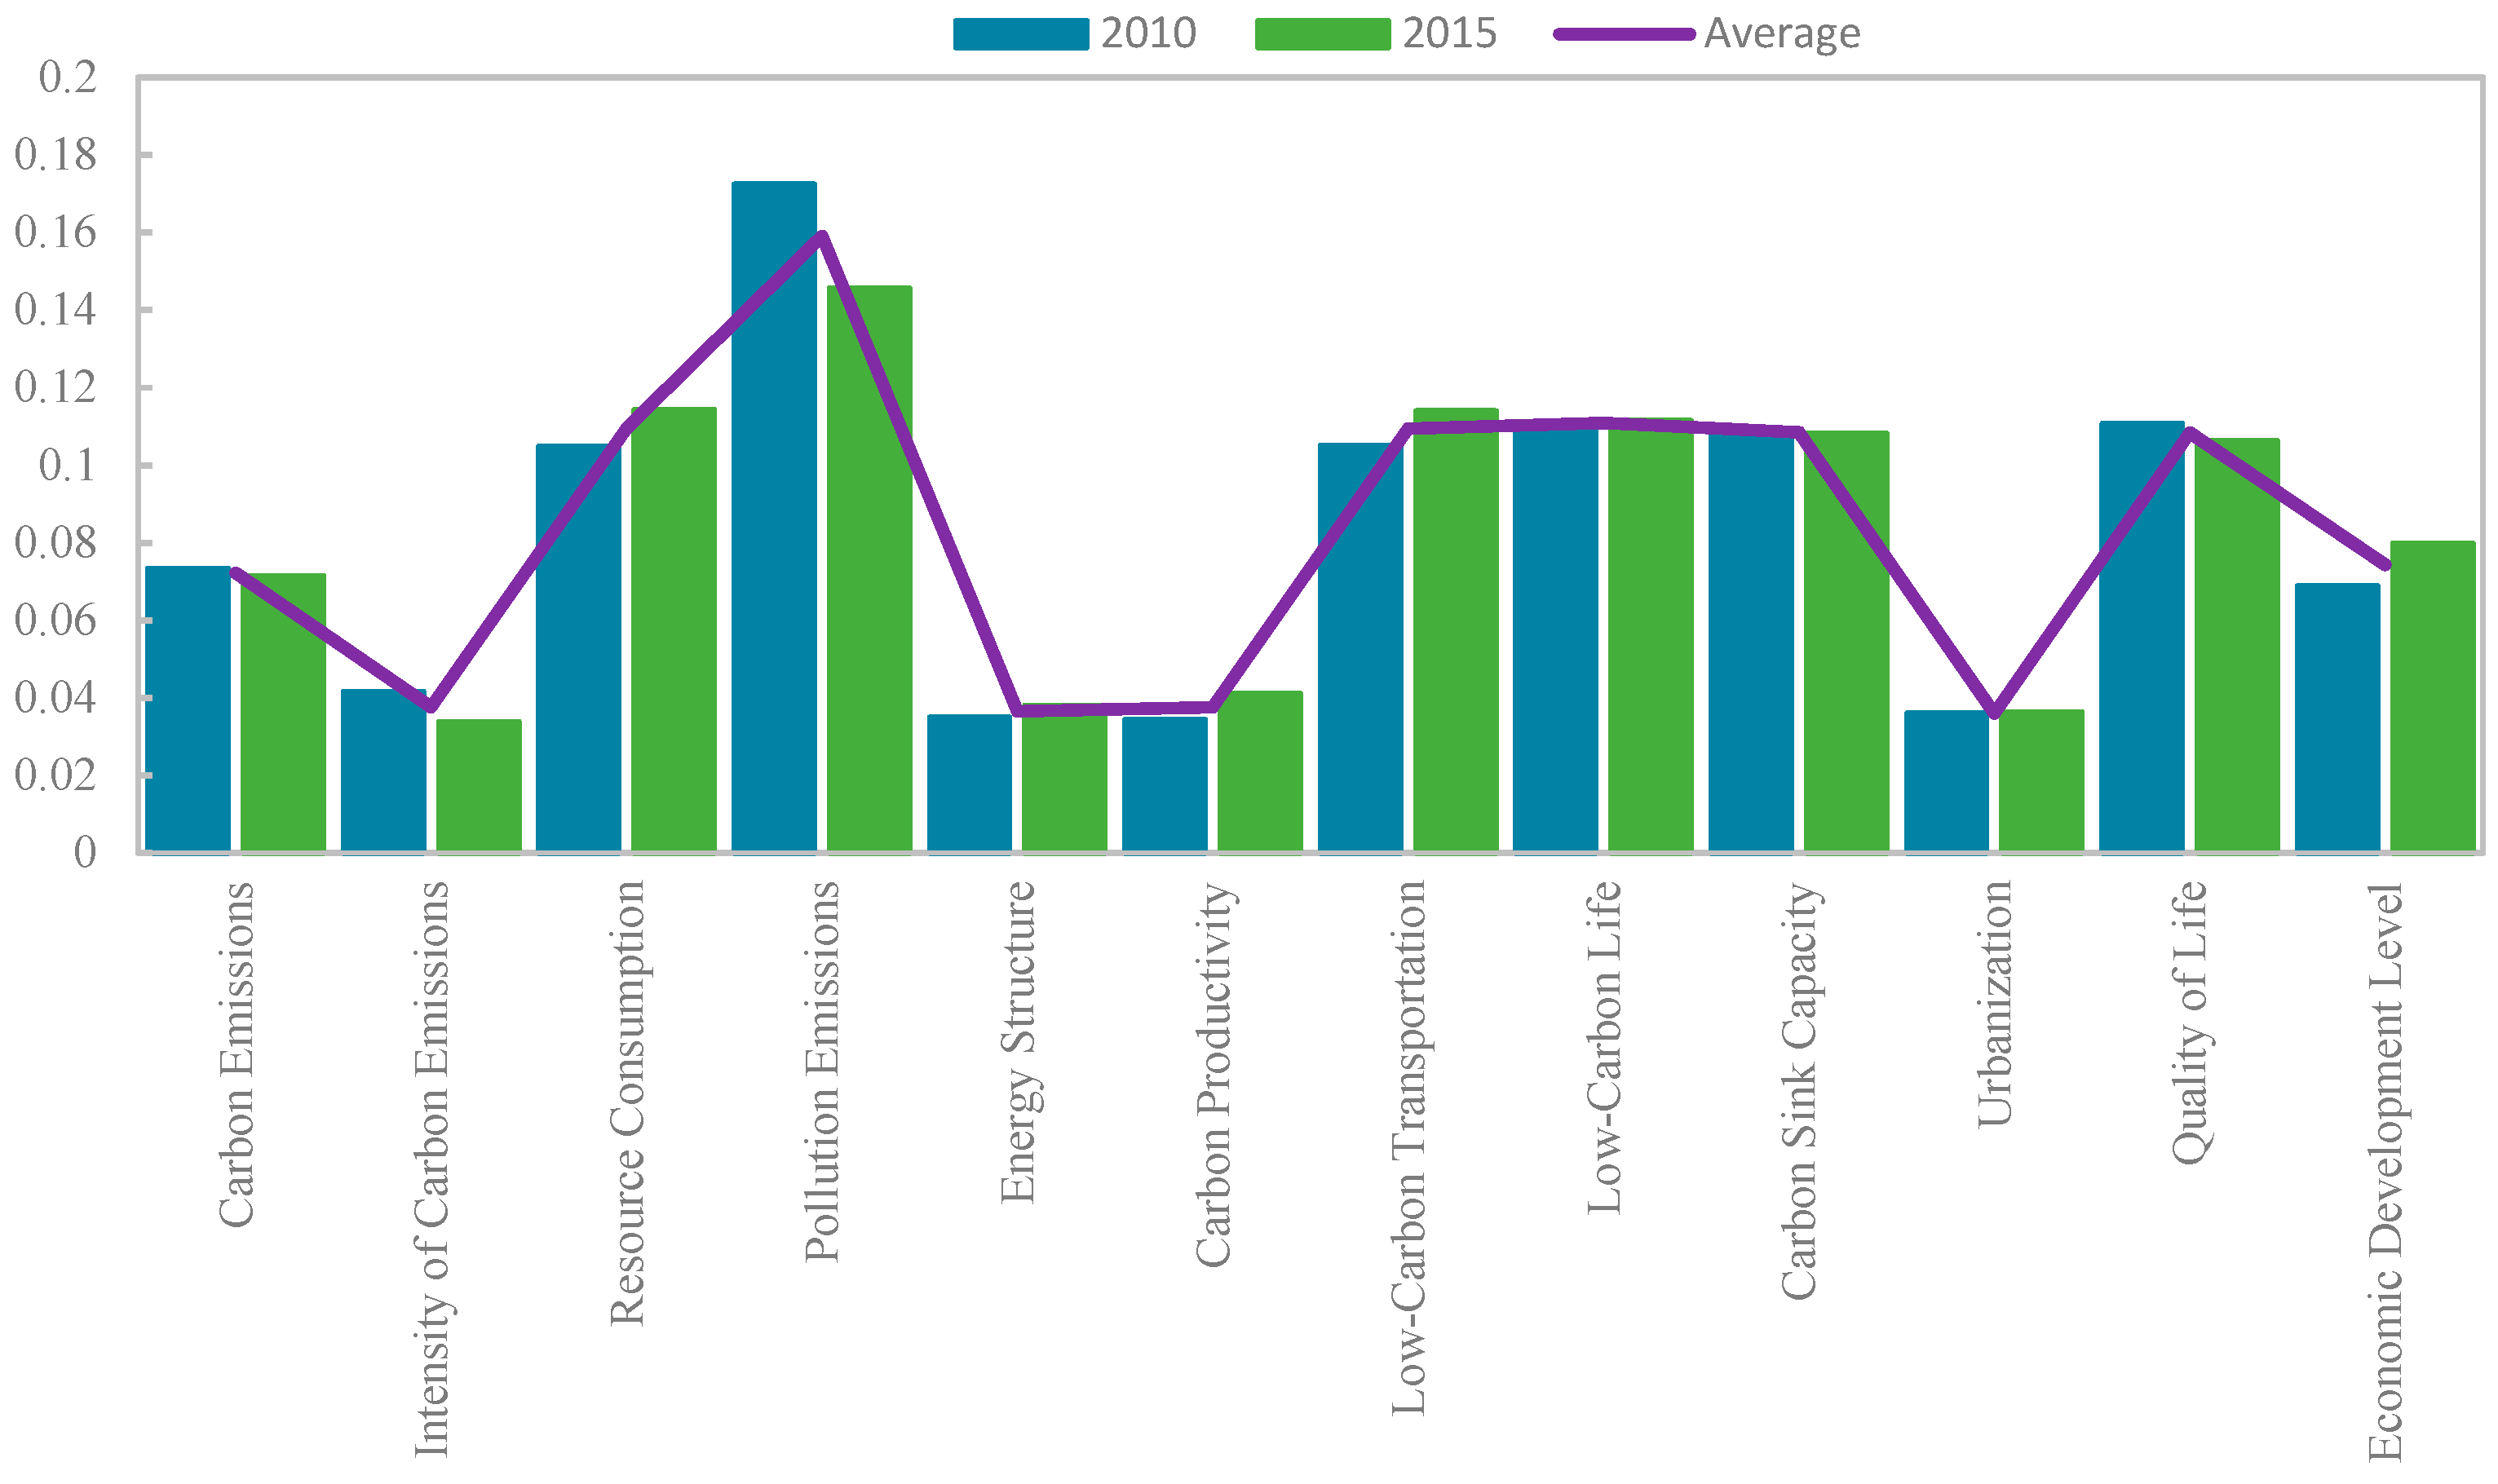
4.1. Entropy Weight of Indicators and Changes in Entropy Weight

By selecting the profile of low-carbon development in Xiamen between 2010 and 2015 as the research object, five primary indicators, 12 secondary indicators, and 27 tertiary indicators were selected, and the weights of secondary indicators in 2010 and 2015 were calculated by the entropy weight method (Table 7). From the overall situation of indicator weights, the weights of indicators for pollution emissions, low-carbon life, and resource consumption were relatively higher than those of other indicators. From the perspective of changes in indicator weights, the weights of indicators for carbon emissions and pollution emissions decreased over time, while the weights of indicators for resource consumption, low-carbon life, and low-carbon transportation increased significantly over time. Among these indicators, the negative indicator “pollution emission” had the highest average entropy weight (0.1591). Therefore, this indicator played the most important role in the comprehensive evaluation of low-carbon development in Xiamen. The indicator “urbanization rate” had the smallest average entropy weight (0.0360).
The entropy weights of the indicators were ranked as follows (largest to smallest): pollution emissions > low-carbon life > resource consumption > low-carbon transportation > carbon sink capacity > quality of life > economic development level > amount of carbon emissions > carbon productivity > intensity of carbon emissions > energy structure > urbanization. The importance of each primary indicator in the comprehensive evaluation of low-carbon development was ranked as follows (most to least important): low-carbon production > low-carbon consumption > social and economic development > carbon emissions > low-carbon policy. In addition, several secondary indicators, including pollution emissions, low-carbon life, and resource consumption, were found to be important factors for the evaluation of the level of low-carbon development in cities, as their entropy weights were relatively high. The entropy weights for the indicators of resource consumption, energy structure, carbon productivity, low-carbon transportation, low-carbon life, urbanization, and economic development level increased from 2010 to 2015, while the entropy weights for the indicators of amount of carbon emissions, intensity of carbon emissions, pollution emissions, carbon sink capacity, and quality of life decreased from 2010 to 2015. In the evaluation of the increase in entropy weight, the entropy weight of the indicator for low-carbon transportation increased the most (by approximately 32.38%), while the entropy weight of the indicator for urbanization increased the least (by approximately 0.83%). Among the indicators with entropy weights that decreased from 2010 to 2015, the entropy weight of the indicator for the intensity of carbon emissions decreased the most (by approximately 18.75%), while the entropy weight of the indicator for carbon sink capacity decreased the least (by approximately 0.55%) (Figure 2).

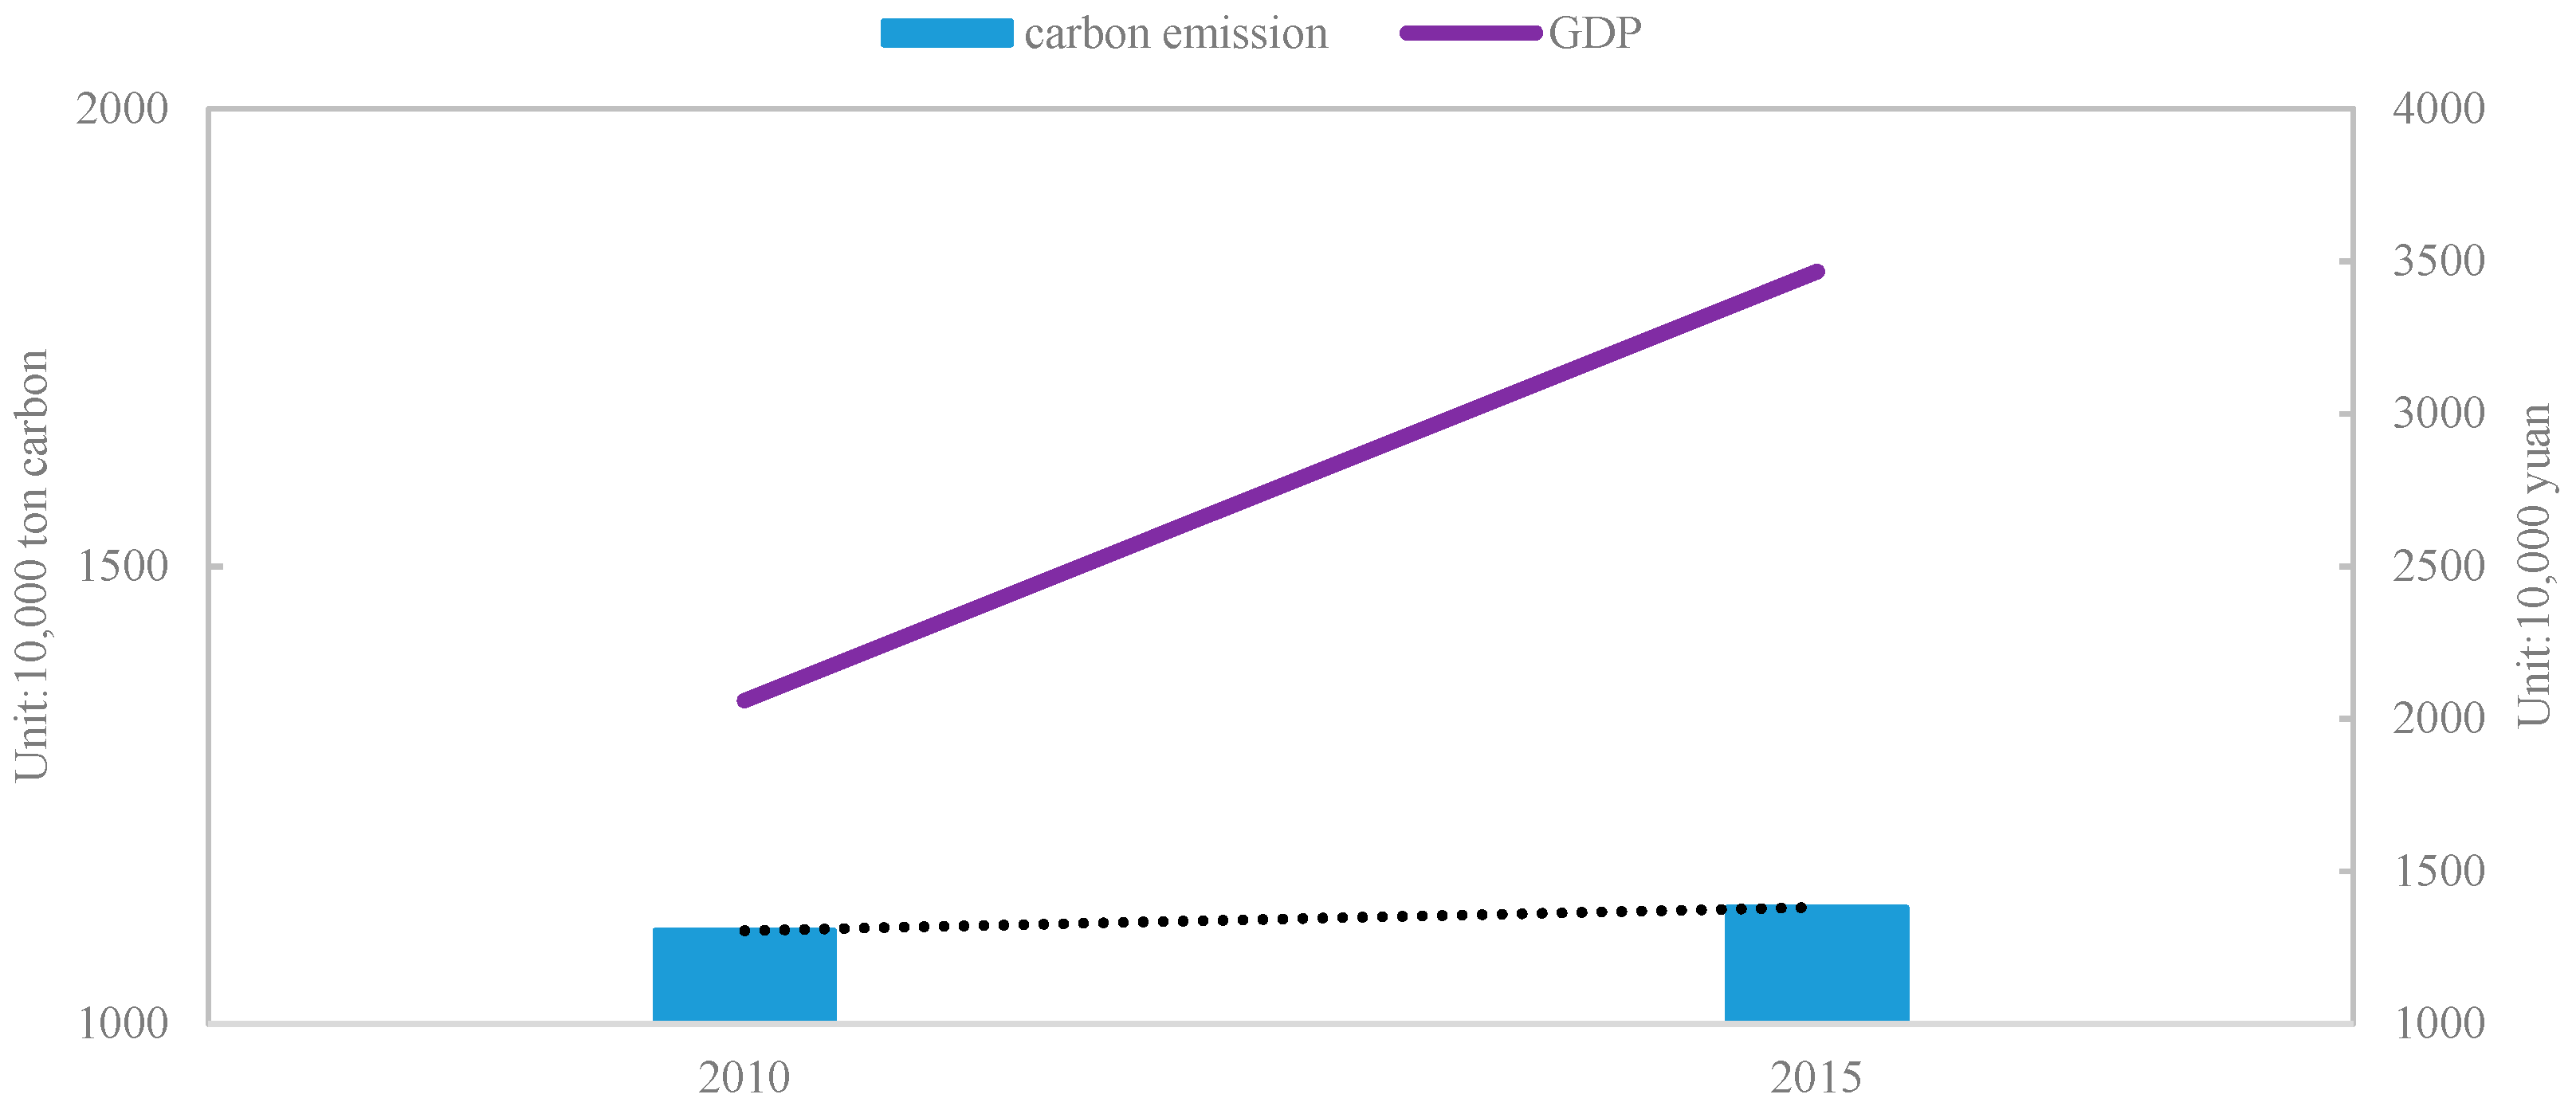
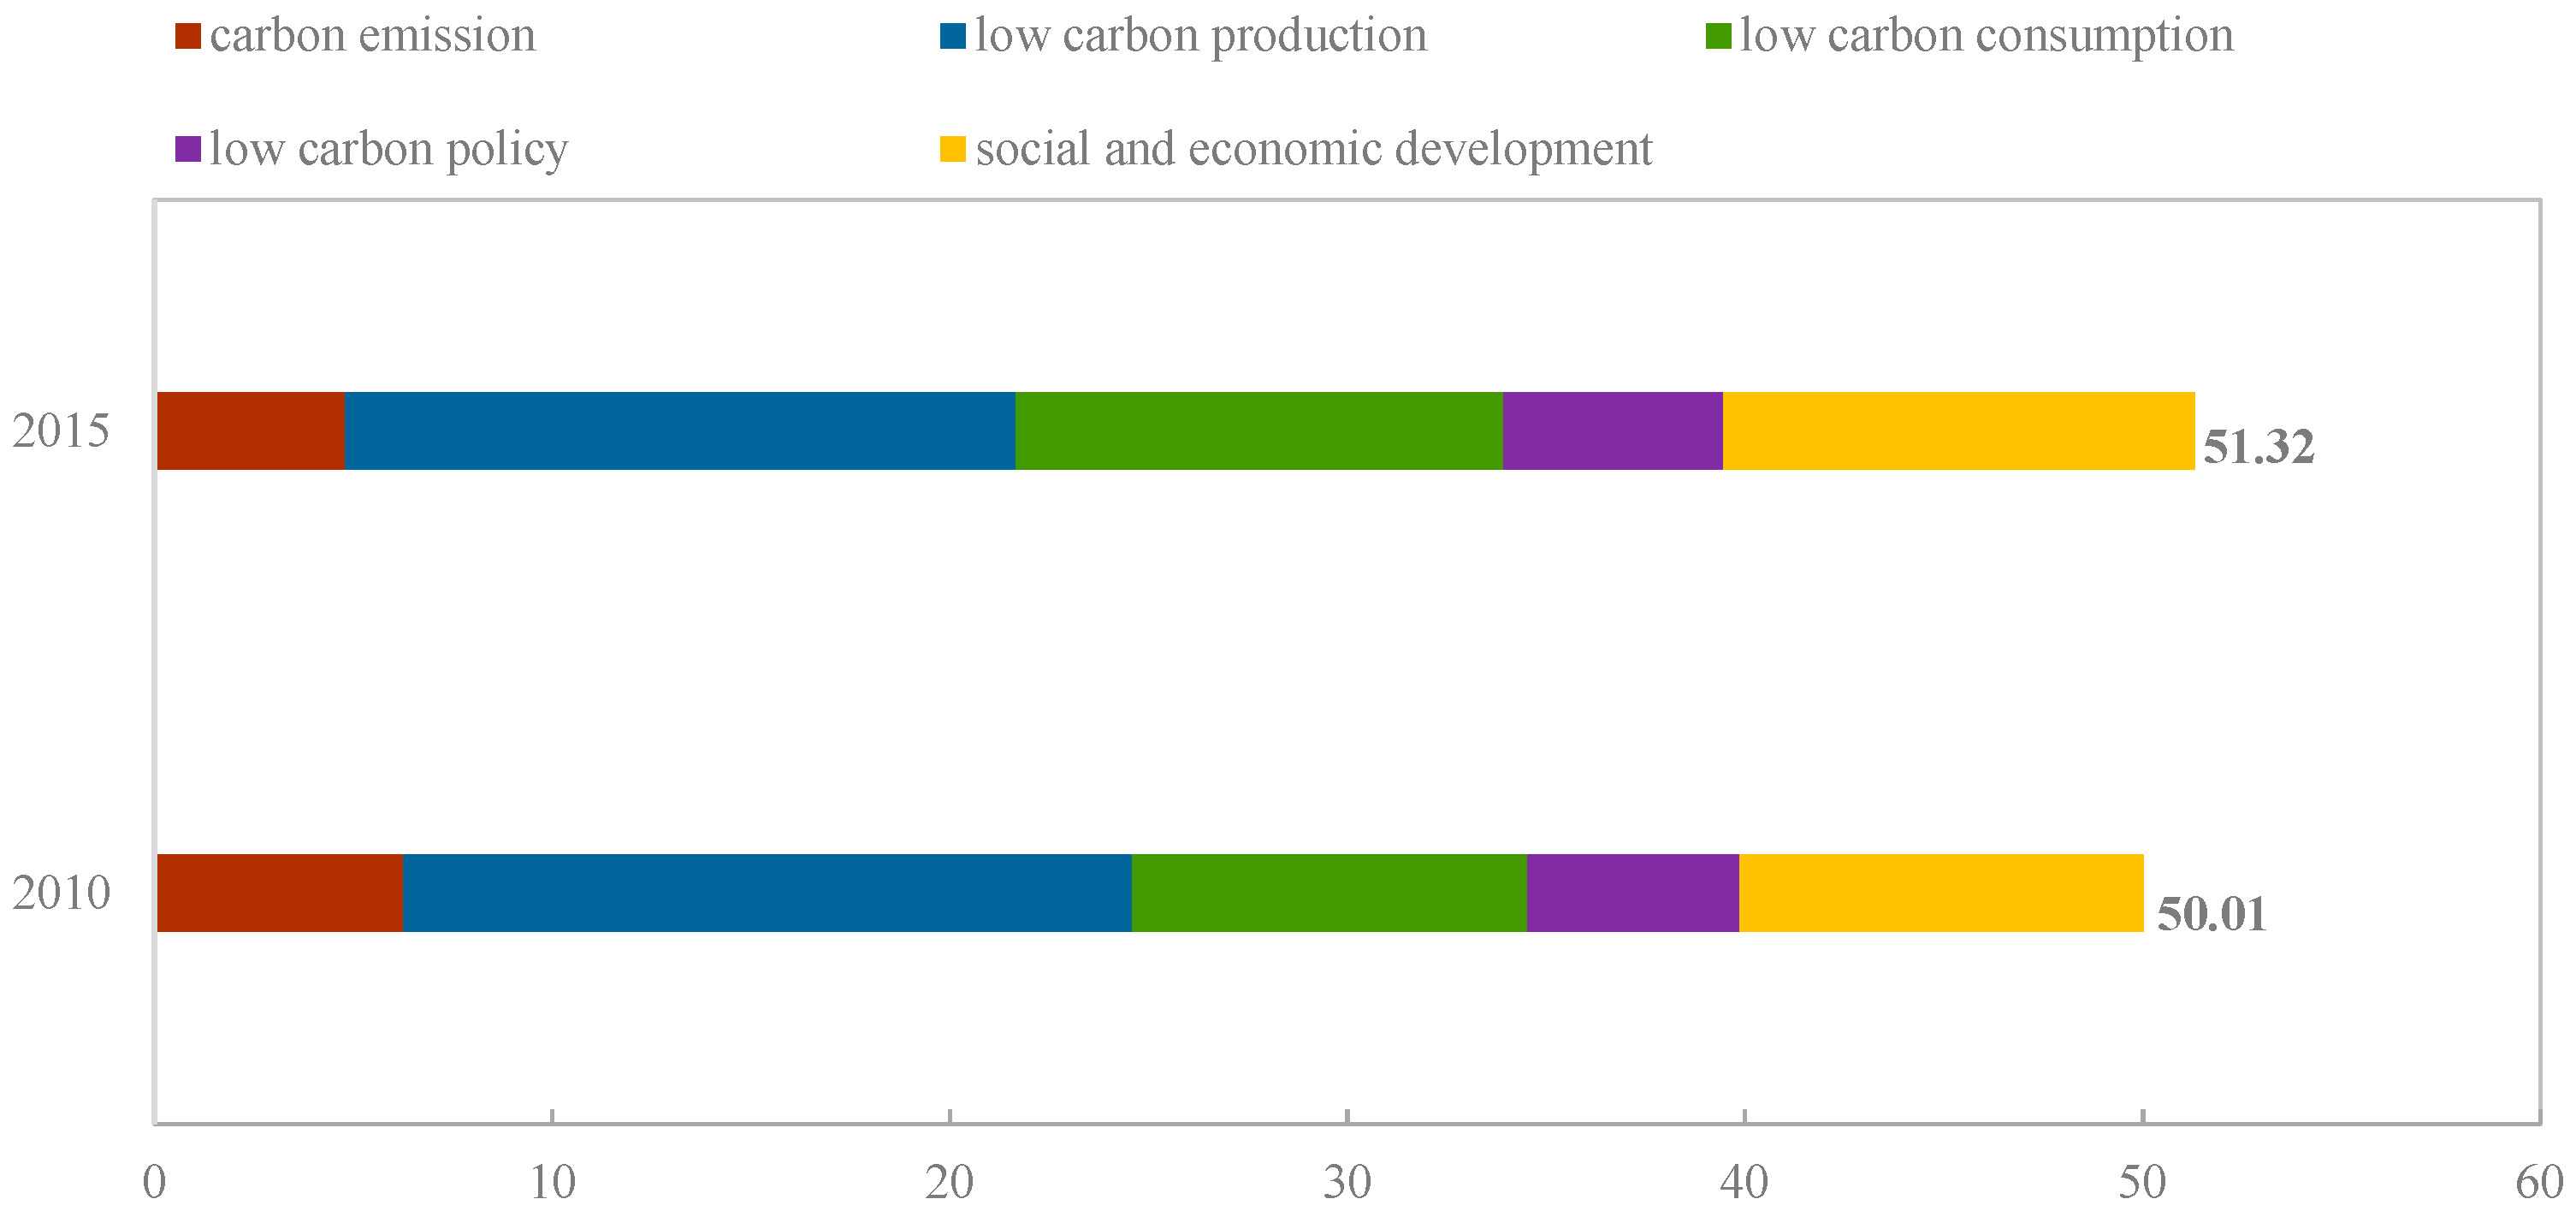
4.2. Comprehensive Status Assessment

Overall, after five years of exploration and practice, low-carbon construction achieved remarkable results by the end of 2015. Based on the IPCC Guidelines for Greenhouse Gas Inventories and relevant research results in China and elsewhere, the carbon emission inventory from different routes (energy consumption, agricultural activities, land use change and forestry, and waste disposal) in Xiamen between 2010 and 2015 was roughly calculated (Figure 3).
In addition, it should be noted that Xiamen has some particular natural geography and resource conditions. For example, steel, cement, and other industrial materials are not produced locally in Xiamen, but are imported from other places. Therefore, the industrial processes in Xiamen produce very little carbon emission, and hence was excluded from this study. From the perspective of carbon emissions, carbon emissions in Xiamen were mainly from energy consumption, followed by changes in land use and forestry, waste disposal, and agricultural activities. In 2015, after five years of low-carbon development in Xiamen, the carbon emissions generated by agricultural activities, and changes in land use and forestry were significantly reduced to levels lower than those in 2010. In addition, as compared to 2010, although the amount of carbon emission generated by energy consumption and waste disposal in 2015 increased and led to the increase in total carbon emissions, the growth rate of carbon emissions had slowed.
At the same time, compared with 2010, GDP in 2015 increased significantly. According to the decoupling theory [44], the relationship between carbon emissions and economic development showed that GDP increased, and carbon emissions also increased; however, the economic growth rate was higher than the growth rate of carbon emissions. Therefore, while economic growth was achieved, energy consumption was gradually reduced and decoupled from economic growth, to a relative decoupling state (Figure 4). In addition, the intensity of energy consumption for each unit of carbon emissions increased, and the efficiency of resource utilization gradually increased. In addition, pollutant emissions for each unit of carbon emissions decreased, thus improving the quality of the local air and environment to some extent.
The values of positive evaluation indicators of low-carbon cities in Xiamen all increased from 2010 to 2015. The indicators of urbanization rate, energy consumption structure, low-carbon transportation, and carbon sink capacity changed the most. The values of the most negative evaluation indicators were reduced, with the exceptions of electricity consumption and waste generation. The increase in electricity consumption and waste generation is closely related to the large influx of residents into the city and the nature of the city itself. In 2015, the indicators of low-carbon development were significantly higher than those in 2010, in terms of low-carbon consumption, low-carbon policy, and social and economic development, while low-carbon development in terms of carbon emissions and low-carbon production require further improvement. However, in general, the comprehensive index of low-carbon development in Xiamen increased from 2010 to 2015, indicating that, after five years of construction and practice, the level of low-carbon development in Xiamen has increased (Figure 5).

5. Discussion

The major innovation of this study was the assessment of representative index systems in China and elsewhere to select a set of indicators for index standardization and construction of an index system for low-carbon cities. By combining the perspectives of three types of index systems, this study avoided the incompleteness of prior index systems constructed from a single perspective and fully integrated the advantages of each perspective, thus allowing us to build a more scientific and reasonable evaluation index system for low-carbon cities. In order to ensure the objectivity of the results, the indicators were all quantitative indicators, which reduced the impact of human subjective factors. At the same time, this approach ensured that the data for the selected indicators were easy to obtain, which made the evaluation protocol realistic and feasible. Another innovation of this research was the selection of an objective weighting method and the entropy weight method, which directly determines the importance of indicators according to changes in indicator data in order to assign weights to the indicators. As a result, fair evaluations can be ensured when different types of cities are compared. In the past, most of the relevant studies adopted qualitative weighting methods, such as the analytic hierarchy process. The shortcoming of this method is that it is too subjective, which makes the results of the evaluation less convincing. Based on the two innovations described above, this study established an evaluation index system for low-carbon cities that consisted of five primary indicators: carbon emissions, low-carbon production, low-carbon consumption, low-carbon policies, and socio-economic development. In addition, evaluations of low-carbon development in cities can be divided into two categories: internal evaluations and external evaluations. Internal evaluations mainly focus on vertical comparison within cities and evaluate the low-carbon development of cities by selecting indicators relevant to five aspects: carbon emissions, low-carbon production, low-carbon consumption, low-carbon policies, and social and economic development. In this way, low-carbon development, related to all the different aspects of cities, can be evaluated. External evaluations mainly involve horizontal comparisons of low-carbon development among all provincial capital cities and municipalities directly under the central government of China. By comparing the overall low-carbon development among these cities in terms of indicators related to carbon emissions, a comprehensive index ranking can be determined to reflect the real level of low-carbon development in these cities. At the same time, the relevant government administrations can also scientifically and reasonably evaluate the level of low-carbon development among similar cities using external evaluation, so that the cities can develop various improvement measures that are conducive to low-carbon development (Figure 6).
There are some shortcomings of this study. Due to limited data availability, some indicators were discarded despite their usefulness for evaluating low-carbon cities. For example, indicators for low-carbon buildings (proportion of energy-saving buildings, and energy consumption per unit building area), low-carbon technologies (capture and storage ratio of carbon dioxide), and low-carbon policies (completeness of low-carbon policies and regulations, public satisfaction with low-carbon cities) were excluded from this study. At the same time, when the carbon emissions of Xiamen were calculated according to the IPCC Guidelines for Greenhouse Gas Inventories, carbon emissions generated by industrial production were ignored because Xiamen has a particular natural geography and resource conditions. For example, steel, cement, glass, and other industrial products with high carbon emissions are not produced locally in Xiamen, but are instead imported from other places.
In future studies, we will explore a weighting method that utilizes qualitative and quantitative indicators, try to find an alternative for necessary indicators with limited data availability, and study the level of low-carbon development in cities with a longer time scale, while simultaneously considering the spatial scale of the analysis. At the same time, as this research is aimed at the standardization of indicators, we need to refer to the relevant standards of domestic and foreign cities to set the benchmark indicators. It is necessary to expand to a wider range of cities for comparison, such as at the global, regional, and national level.

6. Conclusions

Based on the results of previous studies, this study integrated three perspectives used to construct evaluation index systems for low-carbon cities. By extracting common indicators and adjusting individual indicators, a standardized evaluation index system for low-carbon cities was established. The established evaluation index system can be used to horizontally compare the levels of low-carbon development among different cities, as well as to evaluate the levels of low-carbon development in specific sectors or industries within a city. The content of these indicators reflects current problems and routes to improve low-carbon development. The newly developed index system uses a balanced configuration of positive and negative indicators, including five primary indicators for carbon emissions, low-carbon production, low-carbon consumption, low-carbon policies, and social and economic development. In addition, all indicators in the index system are quantitative indicators, and the relevant data can be obtained directly or calculated from statistical yearbooks. Therefore, in the future, quantitative comparisons of the levels of low-carbon development among different cities can avoid the uncertainty caused by human subjective factors, and the results of such evaluations will be more objective and comparable than the results of evaluations conducted using current index systems. Moreover, in comparison with current index systems, the newly developed index system can be used in a broader range of applications.
Using the entropy weight method, low-carbon development in Xiamen from 2010 to 2015 was evaluated quantitatively and comprehensively. Pollution emissions had the greatest impact on low-carbon development in Xiamen, while urbanization had the least impact. In terms of the comprehensive index of low-carbon development in Xiamen, the level of low-carbon development in 2015 was better than that in 2010 due to efforts at promoting energy conservation, emission reduction, and green development. In addition, in terms of carbon emissions, the growth rate of carbon emissions from energy activities, agricultural activities, changes in land use and forestry, and waste treatment slowed significantly in 2015 compared with that in 2010. In addition, the amount of carbon emission generated from agricultural activities, and changes in land use and forestry in 2015 was less than that in 2010. These changes were closely related to efforts at increasing afforestation and improving forest resource management. At the same time, the growth rate of carbon emissions was slower than the growth rate of economic development, and these rates were decoupled. Although the growth rate of carbon emissions slowed from 2010 to 2015, the total amount of carbon emission in 2015 was higher than that in 2010, mainly because energy activities were still the main source of urban carbon emissions. Furthermore, the amount of carbon emission generated by waste disposal was still high, mainly because of Xiamen’s large population, which generated a large amount of household waste. Moreover, most of the waste produced in Xiamen was destroyed by incineration, which also acted as an important contributor to carbon emissions.

Author Contributions

L.S. and X.X. conceived and designed the structure and case study of paper, and they processed data and wrote original draft; W.Z. collected data and information; L.G. did the statistics work and supervised research.

Acknowledgments

This research was supported by the National Key Research & Development Program of China (2018YFC0704703, 2017YFF0207302). We would like to thank Jianyi Lin at Institute of Urban Environment, Chinese Academy of Sciences for his advice on the study.

Conflicts of Interest

The authors declare no conflict of interest. The founding sponsors had no role in the design of the study; in the collection, analyses, or interpretation of data; in the writing of the manuscript, and in the decision to publish the results.

References

  1. Tu, C.; Li, F.D. Responses of greenhouse gas fluxes to experimental warming in wheat season under conventional tillage and no-tillage fields. J. Environ. Sci. 2017, 54, 314–327. [Google Scholar] [CrossRef] [PubMed]
  2. Zhou, Y.; Hao, F.H.; Meng, W.; Fu, J.F. Scenario analysis of energy-based low-carbon development in China. J. Environ. Sci. 2014, 26, 1631–1640. [Google Scholar] [CrossRef] [PubMed]
  3. BP (British Petroleum). BP World Energy Statistics. Available online: https://www.bp.com/en/global/corporate/media/speeches/bp-statistical-review-of-world-energy-2017.html,2017-07-13/2018-08-15 (accessed on 15 August 2018).
  4. Jiang, J.J.; Ye, B.; Ma, X.M. The construction of Shenzhen’s carbon emission trading scheme. Energy Policy 2014, 75, 17–21. [Google Scholar] [CrossRef]
  5. UN (United Nations). World Urbanization Prospects the United Nations, New York. Available online: https://esa.un.org/unpd/wup/publications/files/wup2014-highlights,2014-07-21/2018-09-20 (accessed on 15 October 2018).
  6. CG (Chinese Government). Enhanced Actions on Climate Change: China’s Intended Nationally Determined Contributions. Available online: http://www.china.org.cn/chinese/2015-07/01/content_35953590.htm,2015-07-01/2018-09-20 (accessed on 20 September 2018).
  7. Du, H.B.; Chen, Z.N.; Mao, G.Z.; Li, R.Y.M.; Cai, L.H. A spatio-temporal analysis of low-carbon development in China’s 30provinces: A perspective on the maximum flux principle. Ecol. Indic. 2018, 90, 54–64. (In Chinese) [Google Scholar] [CrossRef]
  8. Azizalrahman, H.; Hasyimi, V. Towards a generic multi-criteria evaluation model for low carbon cities. Sustain. Cities Soc. 2018, 39, 275–282. [Google Scholar] [CrossRef]
  9. Hak, M.; Matsuoka, Y.; Gomi, K. A qualitative and quantitative design of low-carbon development in Cambodia: Energy policy. Energy Policy 2017, 100, 237–251. [Google Scholar] [CrossRef]
  10. Tan, S.T.; Yang, J.; Yan, J.Y. Development of the Low-carbon City Indicator (LCCI)Framework. Energy Procedia 2015, 75, 2516–2522. [Google Scholar] [CrossRef]
  11. Kalnins, S.N.; Blumberga, D.; Gusca, J. Combined methodology to evaluate transition to low-carbon society. Energy Procedia 2015, 72, 11–18. [Google Scholar] [CrossRef]
  12. Zhou, N.; He, G.; Williams, C.; Fridley, D. ELITE cities: A low-carbon eco-city evaluation tool for China. Ecol. Indic. 2015, 48, 448–456. [Google Scholar] [CrossRef] [Green Version]
  13. Lu, Q. DGNB of Germany-the World’s Second Generation Green Building Assessment System. Available online: https://wenku.baidu.com/view/d31e3358312b3169a451a4ca.html,2012-08-22/2018-09-20 (accessed on 20 September 2018).
  14. Pamlin, D. Low Carbon City Index. Available online: http://www.pamlin.net.2009 (accessed on 15 January 2015).
  15. Zhang, L.P.; Zhou, P. A non-compensatory composite indicator approach to assessing low-carbon performance. Eur. J. Oper. Res. 2018, 270, 352–361. [Google Scholar] [CrossRef]
  16. Yang, X.; Wang, X.C.; Zhou, Z.Y. Development path of Chinese low-carbon cities based on index evaluation. Adv. Clim. Chang. Res. 2018, 9, 144–153. [Google Scholar] [CrossRef]
  17. Ohshita, S.; Zhang, J.; Yang, L.; Hu, M.; Khanna, N.; Fridley, D.; Liu, S.; Chen, L.Y.; Li, A.; Sun, M.; et al. China Green Low-Carbon City Index. Available online: https://escholarship.org/uc/item/6m30b8×7,2017-08-15/2018-09-20 (accessed on 20 September 2018).
  18. Price, L.; Zhou, N.; Fridley, D. Development of a low-carbon indicator system for China. Habitat Int. 2013, 37, 4–21. [Google Scholar] [CrossRef] [Green Version]
  19. Fu, Y.; Liu, Y.J.; Wang, Y.L. Research on the evaluation method and support system of low carbon cities. China Population. Resour. Environ. 2010, 20, 44–47. (In Chinese) [Google Scholar]
  20. Hua, J.; Ren, J. Research on the evaluation of low carbon cities based on ANP. Sci. Technol. Econ. 2011, 24, 101–105. (In Chinese) [Google Scholar]
  21. Xin, L. Construction of evaluation index system for low carbon cities. Stat. Decis. 2011, 7, 78–80. (In Chinese) [Google Scholar]
  22. Zhu, J.; Liu, X.M.; Zhang, Y. Establishment of an index system for the evaluation of low carbon city construction in China. Ecol. Econ. 2017, 33, 52–56. (In Chinese) [Google Scholar]
  23. Shao, C.F.; Ju, M.T. Research on the index systems of low carbon cities based on the DPSIR model. Ecol. Econ. 2010, 10, 95–99. (In Chinese) [Google Scholar]
  24. Zhang, X.P.; Liu, J.; Fang, T. Evaluation of low carbon city development in Lanzhou based on the DPSIR model. J. Northwest Normal Univ. (Nat. Sci. Ed.) 2012, 48, 112–115. (In Chinese) [Google Scholar]
  25. Zhang, L.; Chen, K.L.; Cao, S.K. Construction of an evaluation index system of low carbon cities from the perspective of carbon source/sink. Energy Environ. Prot. 2011, 25, 8–11. (In Chinese) [Google Scholar]
  26. Chu, C.L.; Ju, M.T.; Wang, Y.N.; Wang, Y.S. Discussion on the ideas and technical framework for the planning of low carbon city development in China. Ecol. Econ. 2011, 45–48. (In Chinese) [Google Scholar]
  27. Media Alliance of China Low-Carbon Economy. China’s Low Carbon City Evaluation System. Available online: http://www.chinanews.com/ny/2011/01-20/2799909.html,2011-01-20/2018-09-20 (accessed on 20 September 2018). (In Chinese).
  28. Chatham House; Chinese Academy of Social Sciences; Energy Research Institute of National Development and Reform Commission. Plan for Low Carbon Development in Jilin City. Available online: http://www.doc88.com/p-382770423918.html.2010-03-31/2018-09-20 (accessed on 20 September 2018). (In Chinese).
  29. Zhou, G.H.; Singh, J.; Wu, J.C.; Sinha, R.; Laurenti, R.; Frostell, B. Evaluating low-carbon city initiatives from the DPSIR framework perspective. Habitat Int. 2015, 50, 289–299. [Google Scholar] [CrossRef]
  30. Du, D.; Wang, T. Comprehensive evaluation of the improvement and development of the evaluation index system for low-carbon cities. Chin. J. Environ. Manag. 2011, 3, 8–11, 14. (In Chinese) [Google Scholar]
  31. Tan, S.T.; Yang, J.; Yan, J.Y.; Lee, C.; Hashim, H.; Chen, B. A holistic low carbon city indicator framework for sustainable development. Appl. Energy 2017, 185, 1919–1930. [Google Scholar] [CrossRef]
  32. Tan, Q. Construction of a low carbon city evaluation index system: A case study of dynamic comparison between Nanjing and Shanghai. Ecol. Econ. 2011, 12, 81–84, 96. [Google Scholar]
  33. Li, B.H.; Xu, L. Measurement of the development level of low carbon cities and its countermeasures: A case study of Changsha, Zhuzhou and Xiangtan. J. Anhui Agric. Sci. 2011, 39, 1180–1183. (In Chinese) [Google Scholar]
  34. Lian, Y.M. Urban value and the evaluation index system of low carbon cities. Urban Probl. 2012, 1, 15–21. (In Chinese) [Google Scholar]
  35. International Organization for Standardization. Sustainable Development of Communities—Indicators for City Services and Quality of Life. Available online: https://www.iso.org/standard/62436.html.2014-05-15/2018-09-20 (accessed on 20 September 2018).
  36. BNU (Beijing Normal University). China Green Development Index; Beijing Normal University Press: Beijing, China, 2016. (In Chinese) [Google Scholar]
  37. Yi, D.J. Evaluation of Low Carbon Cities in Central Provincial Capital. Master’s Thesis, Central South University, Changsha, China, 2010. (In Chinese). [Google Scholar]
  38. Zhang, X.L. Research on TOPSIS-Based Evaluation of Low Carbon Cities in China. Master’s Thesis, Jilin University, Changchun, China, 2017. (In Chinese). [Google Scholar]
  39. Yang, Y.F. Study on the Evaluation System of Low Carbon City Development-Taking Beijing as an Example. Anhui Agric. Sci. 2012, 40, 344–351. [Google Scholar]
  40. Ma, L.; Liu, X.G.; Liu, Z.W. Study on the Evaluation Index System and Model Construction of Low-carbon Cities. J. Jinan Univ. (Soc. Sci. Ed.) 2014, 24, 55–59. [Google Scholar]
  41. Wang, Y.Z.; Zhou, Y.Y.; Deng, X.Y. Construction and Empirical Analysis of Evaluation Index System for Low-carbon Cities. Stat. Sci. Pract. 2011, 1, 48–50. (In Chinese) [Google Scholar]
  42. IPCC. IPCC Guidelines for National Greenhouse Gas Inventories. Available online: https://wenku.baidu.com/view/da92d91dc5da50e2524d7fcd.html,2011-11-21/2018-09-20 (accessed on 20 September 2018).
  43. Cai, B.F. Research on the list of urban greenhouse gas in China. China Population. Resour. Environ. 2012, 22, 21–27. (In Chinese) [Google Scholar]
  44. Zhao, R.Q. Study on the Carbon Cycle of Urban ECO-economic System and ITS Land Regulation Mechanism. Ph.D. Thesis, Nanjing University, Nanjing, China, 2011. (In Chinese). [Google Scholar]
  45. Shannon, C.E. A mathematical theory of communications. Bell Syst. Tech. J. 1948, 27, 623–666. [Google Scholar] [CrossRef]
  46. Yang, Z.H.; Zhang, C.L.; Ge, L.; Gong, D.C.; Gu, Y.F.; Huang, T.h. Comprehensive fuzzy evaluation of insulator flashover state based on an entropy weight method. Electr. Power Autom. Equip. 2014, 34, 90–94. [Google Scholar]
Figure 1. Framework for the evaluation index system of low-carbon cities.
Sustainability 10 03751 g001
Figure 2. Entropy weights of the evaluation indicators.
Sustainability 10 03751 g002
Figure 3. Carbon emissions in Xiamen in 2010 and 2015.
Sustainability 10 03751 g003
Figure 4. Changes in carbon emissions and GDP.
Sustainability 10 03751 g004
Figure 5. Level of low-carbon development in Xiamen.
Sustainability 10 03751 g005
Figure 6. Method for selecting low-carbon evaluation index.
Sustainability 10 03751 g006
Table 1. The low-carbon evaluation index system at home and abroad.
CountryYearSourceIndicator CategorySpecific Evaluation Aspect
Saudi Arabia2018Azizalrahman, H.; Hasyimi, V. [8]Economy, energy, land use, carbon and environment, transportation, waste and waterEvaluate the low-carbon development of ten low-carbon pilot cities at home and abroad.
Cambodia2017Hak, M.; Matsuoka, Y.; Gomi, K. [9]Demography, economy, energy, transportation and cross sectorCollect information from these sectors in Cambodia and formulate strategies for low-carbon development.
Malaysia2015Tan, S.T.; Yang, J.; Yan, J.Y. [10]Economic, energy pattern, technology, social and living, carbon and environment, urban accessibility and wasteIt is used to evaluate the low-carbon development level of 10 major domestic and foreign cities.
Latvia2015Kalnins, S.N.; Blumberga, D.; Gusca, J. [11]Technological, economic, social, environmental, climate
America2012Zhou, N.; He, G.; Williams, C.; Fridley, D. [12]Energy/climate, water, air quality, waste, mobility, economic health, land use and social health
Germany2010Lu, Q. [13]Environment, economy, social culture and function, technology and processEvaluating the overall performance of urban areas.
Global2009Pamlin, D. [14]direct emissions, embedded emissions and global solutionsLCCI (Low-Carbon City Index): Evaluating the low-carbon development of global cities.
China2018Zhang, L.P.; Zhou, P. [15]Economic, living quality, environment, consumer behaviorThe low-carbon development level of 40 cities in China is evaluated and it is found that the low-carbon development of coastal cities in China is generally superior to other regions.
2018Yang, X.; Wang, X.C.;
Zhou, Z.Y. [16]
Carbon emission per capita, carbon emission per unit of Gross Domestic Product (GDP), GDP per capita, population, urbanization rate, proportion of tertiary industry, main functional zoneGDP per Capita and Carbon emission per capita are used to evaluate the low-carbon development of 36 low-carbon pilot cities in the country and divide them into four types: Leading Cities, Developing Cities, Latecomer Cities and Exploring Cities.
2018Du, H.B.; Chen, Z.N.; Mao, G.Z.; Li, R.Y.M.; Chai, L.H. [7]Society, economy, energy, environmentEvaluate the low-carbon development of 30 provinces in the country from 2003 to 2013, and divide these cities into the highest, middle, and lowest three levels.
2017Ohshita, S.; Zhang, J.; Yang, L.;
et al. [17]
CGLCI (China Green Low-Carbon City Index): economy, energy & carbon, environment & land use, policy & outreachEvaluating the status of green and low-carbon development for a large number of Chinese cities.
2013Price, L.; Zhou, N.; Fridley, D.; Ohshita, S.; Lu, H.Y.; Zheng, N.; Fino-Chen, C. [18]Residential buildings sector, commercial buildings sector, industry sector, transport sector, power sectorEvaluation of low-carbon development of provincial and municipal cities from the perspective of a variety of sectors.
2010Fu, Y.; Liu, Y.J.; Wang, Y.L. [19]Economy, society, environment
2011Hua, J.; Ren, J. [20]; Xin, L. [21]
2017Zhu, J.; Liu, X.M.; Zhang, Y. [22]DPSIR model (involving energy consumption, carbon emissions, industry, transportation, construction, waste disposal)
2010Shao, C.F.; Ju, M.T. [23]
2012Zhang, X.P.; Liu, J.; Fang, T. [24]
2011Zhang, L.; Chen, K.L.;
Cao, S.K. [25]
Carbon source (energy, industry, construction, transportation), carbon sink (land, green space)
2011Chu, C.L.; Ju, M.T.; Wang, Y.N.; Wang, Y.S. [26]
2011The Media Alliance of China Low-Carbon Economy. [27]Low-carbon development planning media communication, new and renewable sources of energy, low-carbon product application rate, percentage of greenery coverage, low-carbon commuting, low-carbon buildings, air quality, urban direct carbon reduction, public satisfaction and support rate, veto powerChinese mainland cities.
2010Chatham House; Chinese Academy of Social Sciences; Energy Research Institute; Jilin University; E3G. [28]Low-carbon productivity, low-carbon consumption, low-carbon resources, low-carbon policyEvaluating and managing the city’s low-carbon construction, which is used in Jilin’s low-carbon development plan.
Table 2. Evaluation indicators of low-carbon cities, established based on the DPSIR model.
CategoryMost Frequently Selected Indicator
DriversGross regional product/per capita gross regional product, per capita disposable income of urban residents, urbanization rate
PressuresUnit GDP energy/electricity/water consumption, per capita energy/water/electricity consumption, energy/electricity/water consumption per unit of industrial added value, public transportation vehicles per 10,000 people
StateUnit GDP carbon emissions, per capita carbon emissions, percentage of tertiary industry in GDP
ImpactNumber of days with good or adequate ambient air quality, Engel coefficient, public perception of low-carbon cities
ResponseForest coverage, green coverage of built-up areas, per capita public green space
Source Index: [22,23,24,29].
Table 3. Evaluation indicators of low-carbon cities, established based on the complex ecosystem perspective.
CategoryMost Frequently Selected Indicator
Economic systemGDP per capita, per capita disposable income of urban residents
Social systemUrbanization rate, Engel coefficient, number of public transportation vehicles per 10,000 people, proportion of clean energy vehicles, share of travel by public transportation, registered urban unemployment rate
Environmental systemProportion of non-fossil energy consumption in total primary energy consumption, per capita energy/electricity/water consumption, sulfur dioxide, ammonia nitrogen and nitrogen oxide emissions and chemical oxygen demand, total carbon emissions, per capita carbon emissions, carbon emission intensity, forest coverage, green coverage in built-up areas, per capita public green space
Source index: [19,20,21,30,31,32,33,34].
Table 4. Evaluation indicators of low-carbon cities, established based on the carbon source/sink process.
CategoryMost Frequently Selected Indicator
Carbon sourceEnergy consumption per unit of GDP, proportion of clean energy vehicles, number of public transport vehicles owned by 10,000 people, share of travel via public transportation, proportion of energy-saving buildings, carbon emissions per unit of building area, carbon emissions per capita, per capita disposable income of urban residents, Engel coefficient, per capita water/electricity consumption of residents, and per capita energy consumption
Carbon sinkPer capita green public area, green area coverage of built-up area, forest coverage
Source index: [25,26].
Table 5. Evaluation index system for low-carbon cities.
Indicator NameIndicator Attribute
Primary IndicatorSecondary IndicatorTertiary Indicator
Carbon emissionsAmount of carbon emissionsTotal carbon emissions
Per capita carbon emissions
Intensity of carbon emissionsCarbon emissions per unit of GDP
Low-carbon productionResource consumptionEnergy consumption per unit carbon emissions
Water consumption per unit carbon emissions
Electricity consumption per unit carbon emissions
Pollution emissionsAmmonia nitrogen emissions per unit of carbon emissions
Chemical oxygen demand per unit of carbon emissions
Nitrogen oxide emissions per unit of carbon emissions
Sulfur dioxide emissions per unit of carbon emissions
Energy consumption structureProportion of non-fossil energy in primary energy consumption+
Carbon productivityGDP per unit carbon emissions+
Low-carbon consumptionLow carbon transportationProportion of clean energy vehicles+
Share of travel via public transportation+
Public transportation vehicles owned by every 10,000 people+
Low carbon lifePer capita household water consumption
Per capita household electricity consumption
Per capita production of household garbage
Low-carbon policyCarbon sink capacityPer capita green public space+
Green coverage in built-up areas+
Forest coverage+
Social and economic developmentUrbanizationUrbanization rate
Quality of lifeEngel coefficient
Average life expectancy+
Registered urban unemployment rate+
Level of economic developmentPer capita GDP+
Annual per capita disposable income of urban residents+
Note: (+) in the table indicates a positive indicator and (−) indicates a negative indicator.
Table 6. Comparison of various low-carbon evaluation models.
MethodMethod DescriptionAdvantagesLimitationsReference
TOPSISAccording to the approaching degree of limited evaluation objects and idealized goals, the relative merits of existing objects are evaluated.Making full use of the original information, the results are likely to be consistent with reality; is able to sort out the merits and faults of each evaluation object.Low sensitivityZhang, X.L. [38]
AHPThis refers to the decision-making method which decomposes the elements related to the decision in regard to goals, criteria, schemes, and so on, and facilitates qualitative and quantitative analysis on this basis.Systematic; results are simple and clear; less quantitative data neededThere are less quantitative data, more qualitative components, and is less convincing.Yang, Y.F. [39]
FCEAccording to the membership degree theory of fuzzy mathematics, qualitative evaluation is transformed into quantitative evaluation—that is, fuzzy mathematics makes an overall evaluation of things or objects restricted by various factors.Good for solving fuzzy and difficult problems; is also suitable for solving various non-deterministic problems; strong systematicness.Evaluation subjectivity is obvious, and the evaluation results are not comprehensive enoughMa, L.; Liu, X.G.; Liu, Z.W. [40]
Synthetical Index This is done through the comparison of two comprehensive total amounts to comprehensively reflect the total change degree of multiple individuals.The evaluation process is systematic and comprehensive, the calculation is simple, and the data can be fully utilized.The original data needs to be complete and the reliance on comparative standards is too strong;
evaluation result lacks certain intuition
Wang, Y.Z.; Zhou, Y.Y.;
Deng, X.Y. [41]
Content Analysis Non-quantitative literature materials are converted into quantitative data, the content of the literature is quantitatively analyzed, and judgement and inference about the facts are made according to these data.Systematic, objective, and quantitativeThe classification and the operation is complicatedZhou, G.H.; Singh, J.; Wu, J.C.; Sinha, R.; Laurenti, R.; Frostell, B. [29]
Table 7. Entropy weight of evaluation indicators.
Year20102015Average
Carbon Emissions0.07330.07140.0722
Intensity of Carbon Emissions0.04160.03380.0376
Resource Consumption0.10480.11430.1095
Pollution Emissions0.17240.14560.1591
Energy Structure0.03490.0380.0365
Carbon Productivity0.03430.0410.0376
Low-Carbon Transportation0.1050.11390.1094
Low-Carbon Life0.10940.11140.1109
Carbon Sink Capacity0.10880.10820.1085
Urbanization0.0360.03630.036
Quality of Life0.11070.10630.1084
Economic Development Level0.06880.07980.0743

