Article

Competition and Cooperation between Shared Bicycles and Public Transit: A Case Study of Beijing

1
Institute of Geographic Sciences and Natural Resources Research, Chinese Academy of Sciences, Beijing 110101, China
2
University of Chinese Academy of Sciences, Beijing 10049, China
3
Beijing Transportation Information Center, Beijing 100073, China
4
Beijing Haidian Public Security Bureau, Beijing 100089, China
*
Author to whom correspondence should be addressed.
Sustainability 2019, 11(5), 1323; https://doi.org/10.3390/su11051323
Submission received: 23 January 2019 / Revised: 25 February 2019 / Accepted: 27 February 2019 / Published: 3 March 2019
(This article belongs to the Special Issue Toward Sustainability: Transport Geography and Mobility)

Abstract

:
As an eco-friendly transportation mode, shared bicycles provide a new option for public transit users in urban areas. China’s bicycle-sharing market began flourishing in July 2016 and reached a plateau in 2017. How shared bicycles influenced public transit systems during this period is an interesting topic. A case study of Beijing is conducted. This study aims to identify the competitive and cooperative influences of shared bicycles on public transit by exploring the changes in public transit trip distances before and after the upsurge in bicycle-sharing. A histogram shifting method is introduced to examine the influences of shared bicycles on public transit services from a travel distance perspective. A spatial correlation of bicycling usage and public transit changes is calculated using units of gridded cell spaces. The results show: (1) overall transit usage continued growing after the shared bicycles market reached a plateau; (2) short public transits within 2 km decreased while transfers within 2 km increased; and (3) the decrease of short transits and increase of transfers within 3 km were spatially highly correlated to the usage of shared bicycles. Hence, the role of bicycle-sharing systems is competitive for existing public transit systems during short trips and cooperative for connecting transits.

1. Introduction

Bicycling is encouraged for urban sustainability, public health, and traffic congestion alleviation [1]. However, a method to evaluate the influences of shared bicycles on public transit is very important for urban and transport planners. This study aimed to investigate the competition and cooperation between bicycle-sharing and public transit, using Beijing as a case study. A bicycle-sharing system is a service through which bicycles are publicly accessible for shared use to individuals on a short-term basis for a small charge, and it has become popular in cities all over the world [2]. With the emergence of bicycle-sharing in China in 2014, the market has been flourishing since July 2016 (led by companies like Ofo and Mobike). There has seen a substantial rise in bicycle use with significant influences on urban transportation [3]. In 2017, the number of shared bicycle users reached 70 million in China (Source: AVIC Securities, 2017).
The main advantages of a bicycle-sharing system are the low-cost, flexible mobility, and capability to alleviate the urban traffic congestion problem [4]. Bicycling is a non-motorized and low-emission transport mode. The wide use of cycling can reduce energy consumption and carbon emissions, thus improving the urban environment [5]. The bicycle-sharing system is revolutionizing urban transportation systems and mobility modes [6]. Furthermore, urban residents enjoy riding shared bicycles for short commutes, tourism, and exercise [5]. In the last few years, millions of shared bicycles purchased by companies have quickly flooded into urban areas; therefore, how and to what extent the shared-bicycle system will influence existing public transit systems has become a concern for researchers [7]. How to manage and distribute shared bicycles in urban areas is a challenging problem for city governments and planners, if they do not know the potential impacts of shared bicycles on existing public transits [8]. The distribution and usage of shared bicycles require guidance from both urban planners and traffic management departments; however, they first need to understand the competitive and cooperative interactions between shared bicycles and public transit systems, especially how shared bicycles affect public transit usage [9]. Because the upsurge in shared bicycles in cities has been a new phenomenon in the last few years, the influences of shared bicycles on the public transit system are not clearly defined in existing studies [10]. As such, analysis concerning the substitution of shared bicycles in public transit would be helpful to policy-makers in city governments, as well as bicycle companies.
In this study, we designed a model to evaluate the substitution of shared bicycle usage on public transit using the operating data of shared schemes and transit data. In a case study, data from 2016 and 2017 were employed to evaluate the influence of bicycle sharing on the public transit system in Beijing. The findings hopefully may explain how bicycle-sharing schemes should be regulated in the future. The organization of this paper is as follows. Section 2 presents a literature review. Section 3 introduces the methodology employed, followed by the data description in Section 4. Section 5 presents the results, and Section 6 presents the research conclusions and discussions.

2. Literature Review

2.1. Controversies over Impacts of Shared Bicycles on Public Transit

Generally, bicycling is perceived as a short- and medium-range travel mode, while public transit is a medium- and long-range travel mode. A bicycle-sharing system could be a substitute for a pre-existing public transport network, because an individual could use a shared bicycle instead of other public transit, and this kind of substitution would result in a loss of transit ridership [11]. A bicycle-sharing system could also be a complement to a pre-existing public transport network, as bicycling improves accessibility to public transit stops [11]. Midgley (2009) and Liu et al. (2012) argued that shared bicycles are parts or components of public transportation in urban areas [12,13], while Ma et al. (2015) perceived shared bicycles as complements to urban public transportation [4]. Furthermore, Replogle (1992) argued that benefits could be greater when bicycles and transit systems are better combined [14].
Previous studies of bicycle sharing addressed the influence of bicycles on transit ridership; however, the conclusions regarding whether the influences are positive or negative were controversial. The positive roles that shared bicycles have in complementing public transit systems were noticed by some researchers. Jäppinen et al. (2013) believed that bicycles would increase public transit [11], and Wang et al. (2013) argued that bicycle sharing schemes potentially increased transit use for improved transit facilities by solving the first-and-last-mile problem [15]. Gordon-Koven et al. (2014) suggested that dense bicycle-sharing networks influenced citizens to substitute bicycling for public transit [16], and Campbell et al. (2017) found that every bicycle-sharing dock along New York bus routes was associated with a reduction in bus trips [17]. With respect to the relationship between bicycles and public transit systems, a disruption in London’s tube service increased bicycle sharing trips by 85% and increased trip durations by 88% [18].

2.2. Study Approaches

Existing studies focus too much on the overall influences of bicycle usage on public transit, neglecting the differences owing to short distance and long distance transits. In addition to solving the first-and-last-mile problem, bicycling may also assume a positive role in connecting transit activities. The role of connecting transits is generally omitted in studies on shared bicycles [15]. Bus and metro transits are often not considered as an integrated transit system in existing research [3,15], making it difficult to evaluate whether bicycling is helpful in connecting transits between bus and metro lines.
In general, the reasons behind the competitive and cooperative influences of shared bicycles on public transit systems are not explored with consideration for travel distances. The statistics on travel distances between the two modes, transit distance changes, and transfer distances have not been examined thoroughly. Service distance histograms of transits and bicycling were seldom used in evaluating the potential effects of bicycling on public transit. Furthermore, most of the studies reported that bicycling distances were short without providing detailed differences between route distances and OD (origin–destination) distances.

2.3. Data and Methods in Existing Studies

Some studies use survey data that are limited in scale; few studies use the operating data of large-scale share schemes [19]. Shared bicycles are usually tracked by scheme operators, and the data collected by the operators have generated new study material for urban researchers and planners [20], especially in cities where bicycle-sharing schemes have attracted increased attention [21]. Studies on shared bicycles were usually difficult owing to poor accessibility to operating data [22], and studies on bicycle–transit integration are more difficult when combining cycling and transit data because of different user identifications [23]. Although some researchers have recognized that travel distance is a key element for the traveler when choosing a transport mode, the threshold distance between bicycling and public transit service remains uncertain owing to limited data access [2].
With respect to the study methods, comparison methods are usually made between bicycle usages in different conditions [24]. Saberi et al. (2018) conducted a study on the impact of public transit disruption on bicycle-sharing mobility patterns using bicycling data from a tube strike that occurred in London, and they adopted a combined geo-statistical approach to explore the mobility patterns of bicycle-sharing interactions with public transit [18]. Zhao et al. (2018) surveyed 307 bicycle users to probe how the cyclists would shift to transit in Beijing where air pollution was thought to be a problem [25]. Shared bicycle ridership and public transit activities are seldom compared from an accurate spatial perspective. Data mining on both bicycling and transit data are rare; most studies are based on bicycling data only.

3. Approaches and Methodology

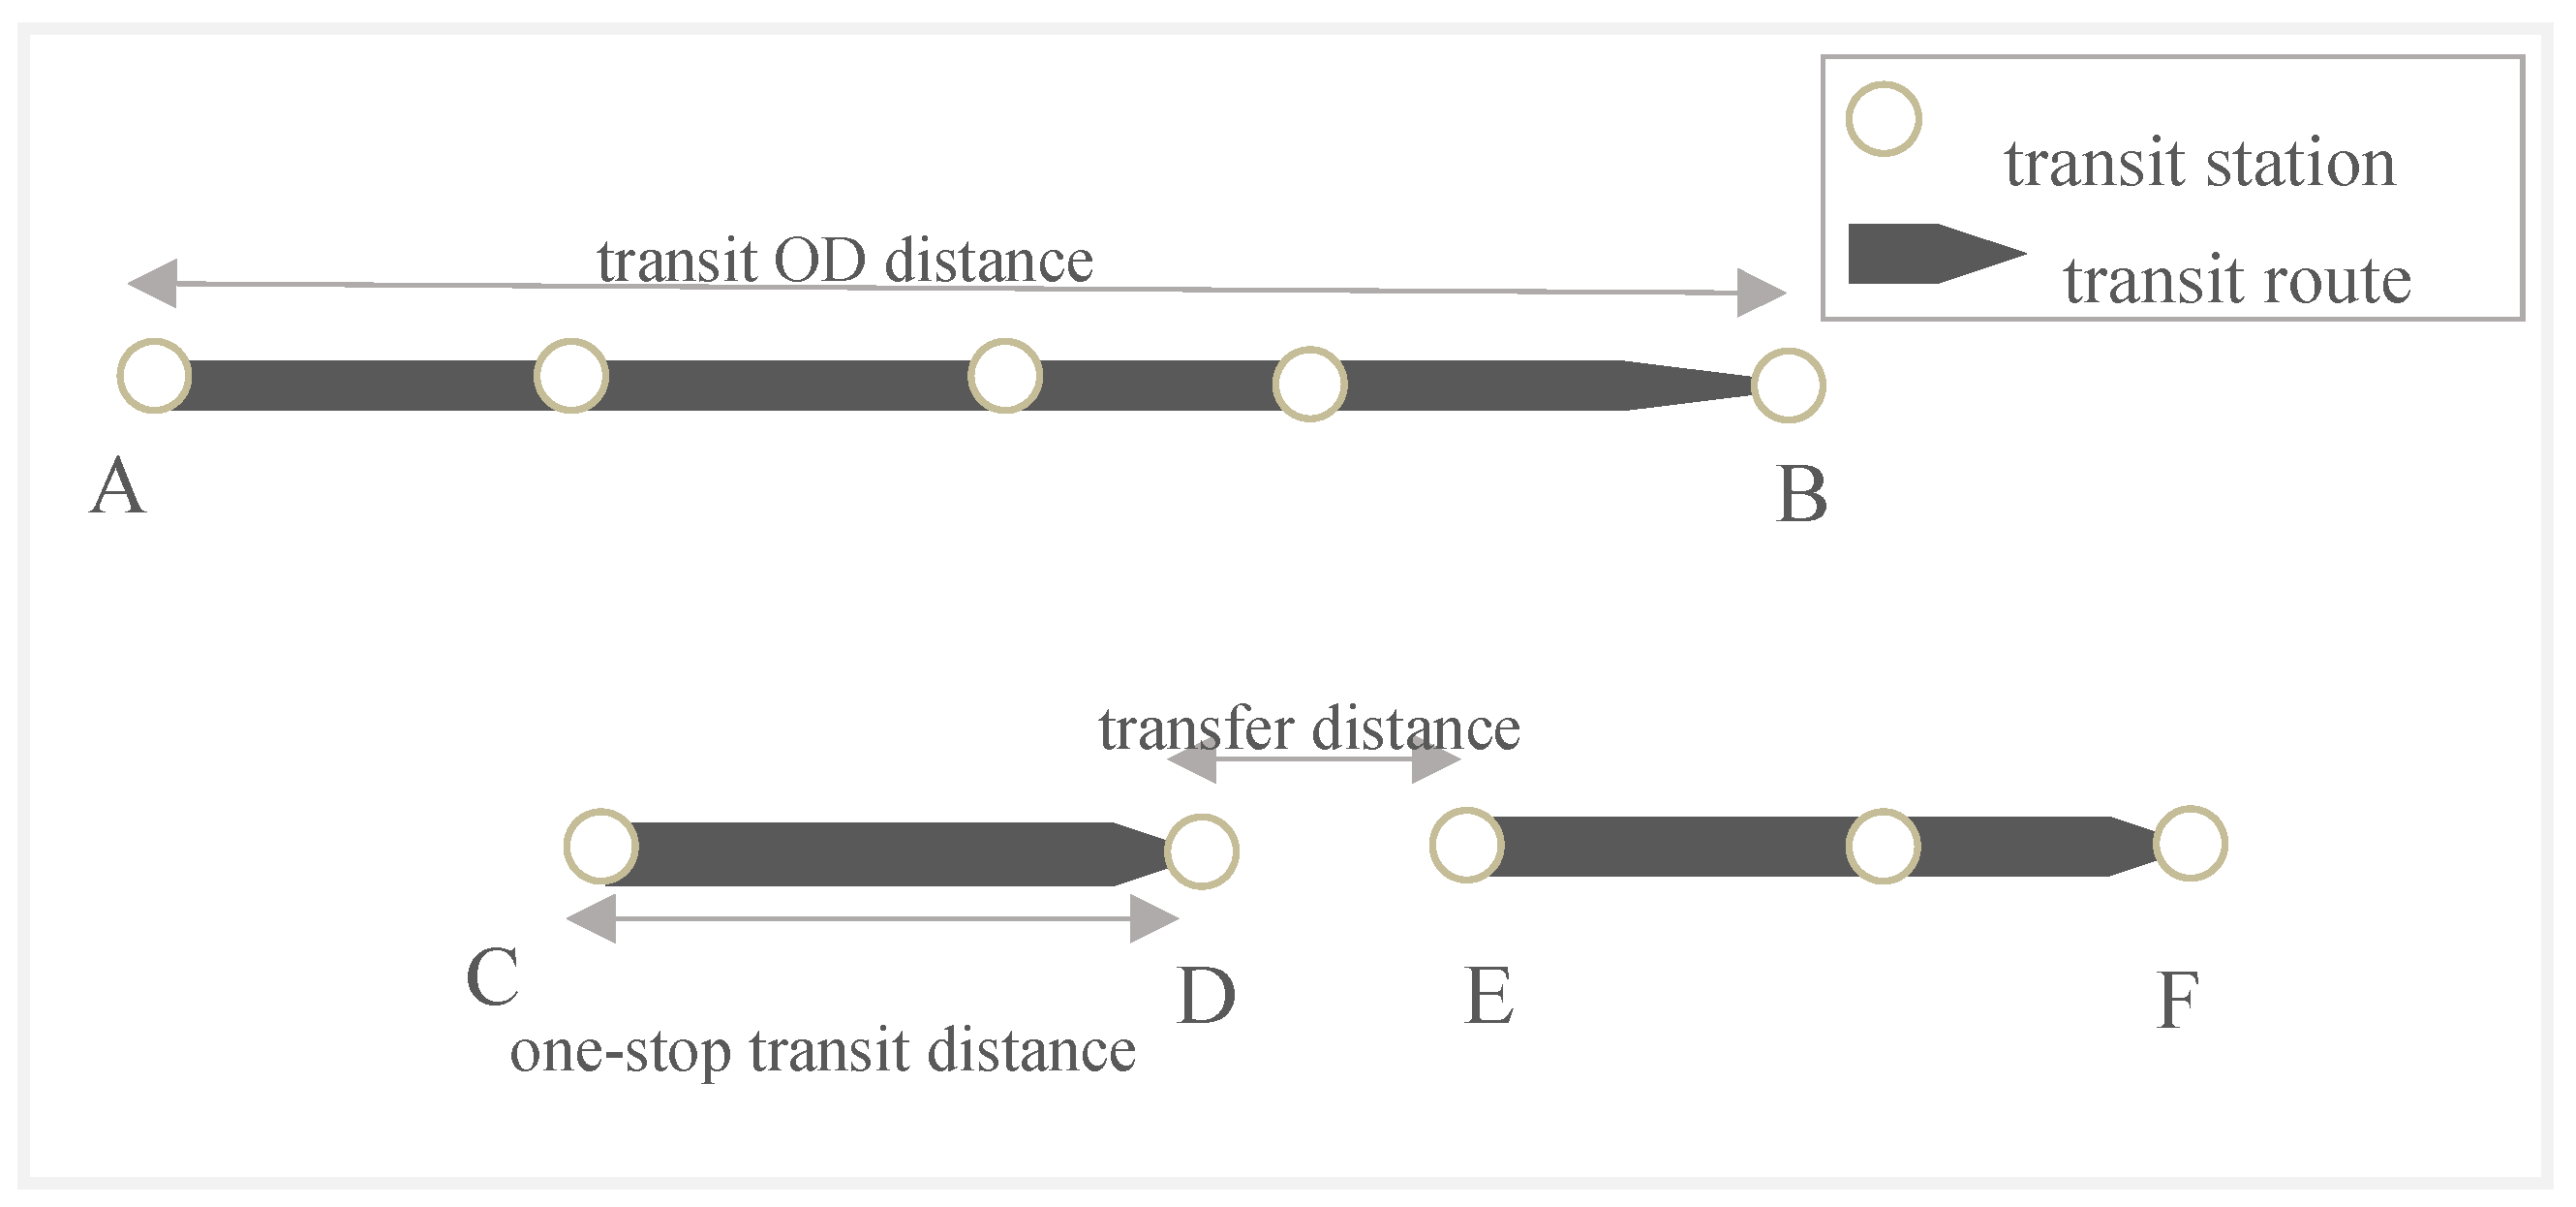
3.1. Bicycling and Transit Trip Distances

As mentioned in Section 2.2, the interaction between shared bicycles and public transit systems might depend on differences in travel distances. Bicycling and transit travel distances are key study objectives in this paper. This paper refers to five different distances as follows:
  • Transit OD distance;
  • One-stop transit distance;
  • Transfer distance;
  • Bicycling OD distance;
  • Bicycling trip distance.
To explain the first three distances, Figure 1 shows a transit from point A to point B in a single line, and another trip from point C to F comprises two single transits via two transit lines. The distance between A and B is the transit OD distance, and is the distance between C and D, and E and F. The transit OD distance is the Euclidean distance between a boarding station and an alighting station. If a transit rider exits the transit line at the next stop, the transit OD distance is called a one-stop transit distance. One-stop transit distances need to be examined to evaluate their vulnerability to be replaced by bicycles. There might be competition between one-stop transits and shared bicycle usage. Cooperation between shared bicycles and public transits might also occur in transit transferring when individuals exit the transit system and use shared bicycles to travel to another transit line, like the connection between points D and E in Figure 1. The distance between D and E is the transfer distance. Smartcard records could be used to monitor transfers when the transit riders exit and return to the transit system. It should be noticed that transferring not only includes intended transferring between transit lines, it also includes situations where riders finish their travel activities after making a transit to point D, and then exit at point E through transit systems. Transfer distances need to be examined because there are areas where shared bicycles could interact with public transit systems in a cooperative manner.
The distances are calculated by the geographical latitudes and longitudes of the OD pairs, and the dist between point A and point B is calculated by the haversine formula:
d i s t = r · a r c c o s ( s i n ϕ 1 s i n ϕ 2 + c o s ϕ 1 c o s ϕ 2 c o s ( Δ λ ) )
where ϕ1, λ1, and ϕ2, λ2 are the geographical latitudes and longitudes in radians of point A and point B, Δλ is the absolute differences between λ1 and λ, and r is the radius of the Earth.
The bicycling OD distance is the Euclidean distance between bicycling origin and destination, and the bicycling trip distances are the lengths of a real bicycling route. Because sometimes only bicycling OD data are available, the bicycling trip distances are simulated by the Google Maps Directions application program interface (API). The Google Maps Directions API is a service that calculates trip distances and travel durations between locations using a web service request. The mode of transport is specified to be bicycling. When a uniform resource locator (URL) contains OD latitudes and longitudes, the response is in JavaScript object notation (JSON) or extensible markup language (XML) format, and the element of “distance” indicates the total meters covered by the bicycling route. The differences between bicycling OD distances and bicycling trip distances are used to measure the potential effects of shared bicycles on public transits. It is speculated that both shared bicycles trip distances and OD distances are short compared to public transit trips.

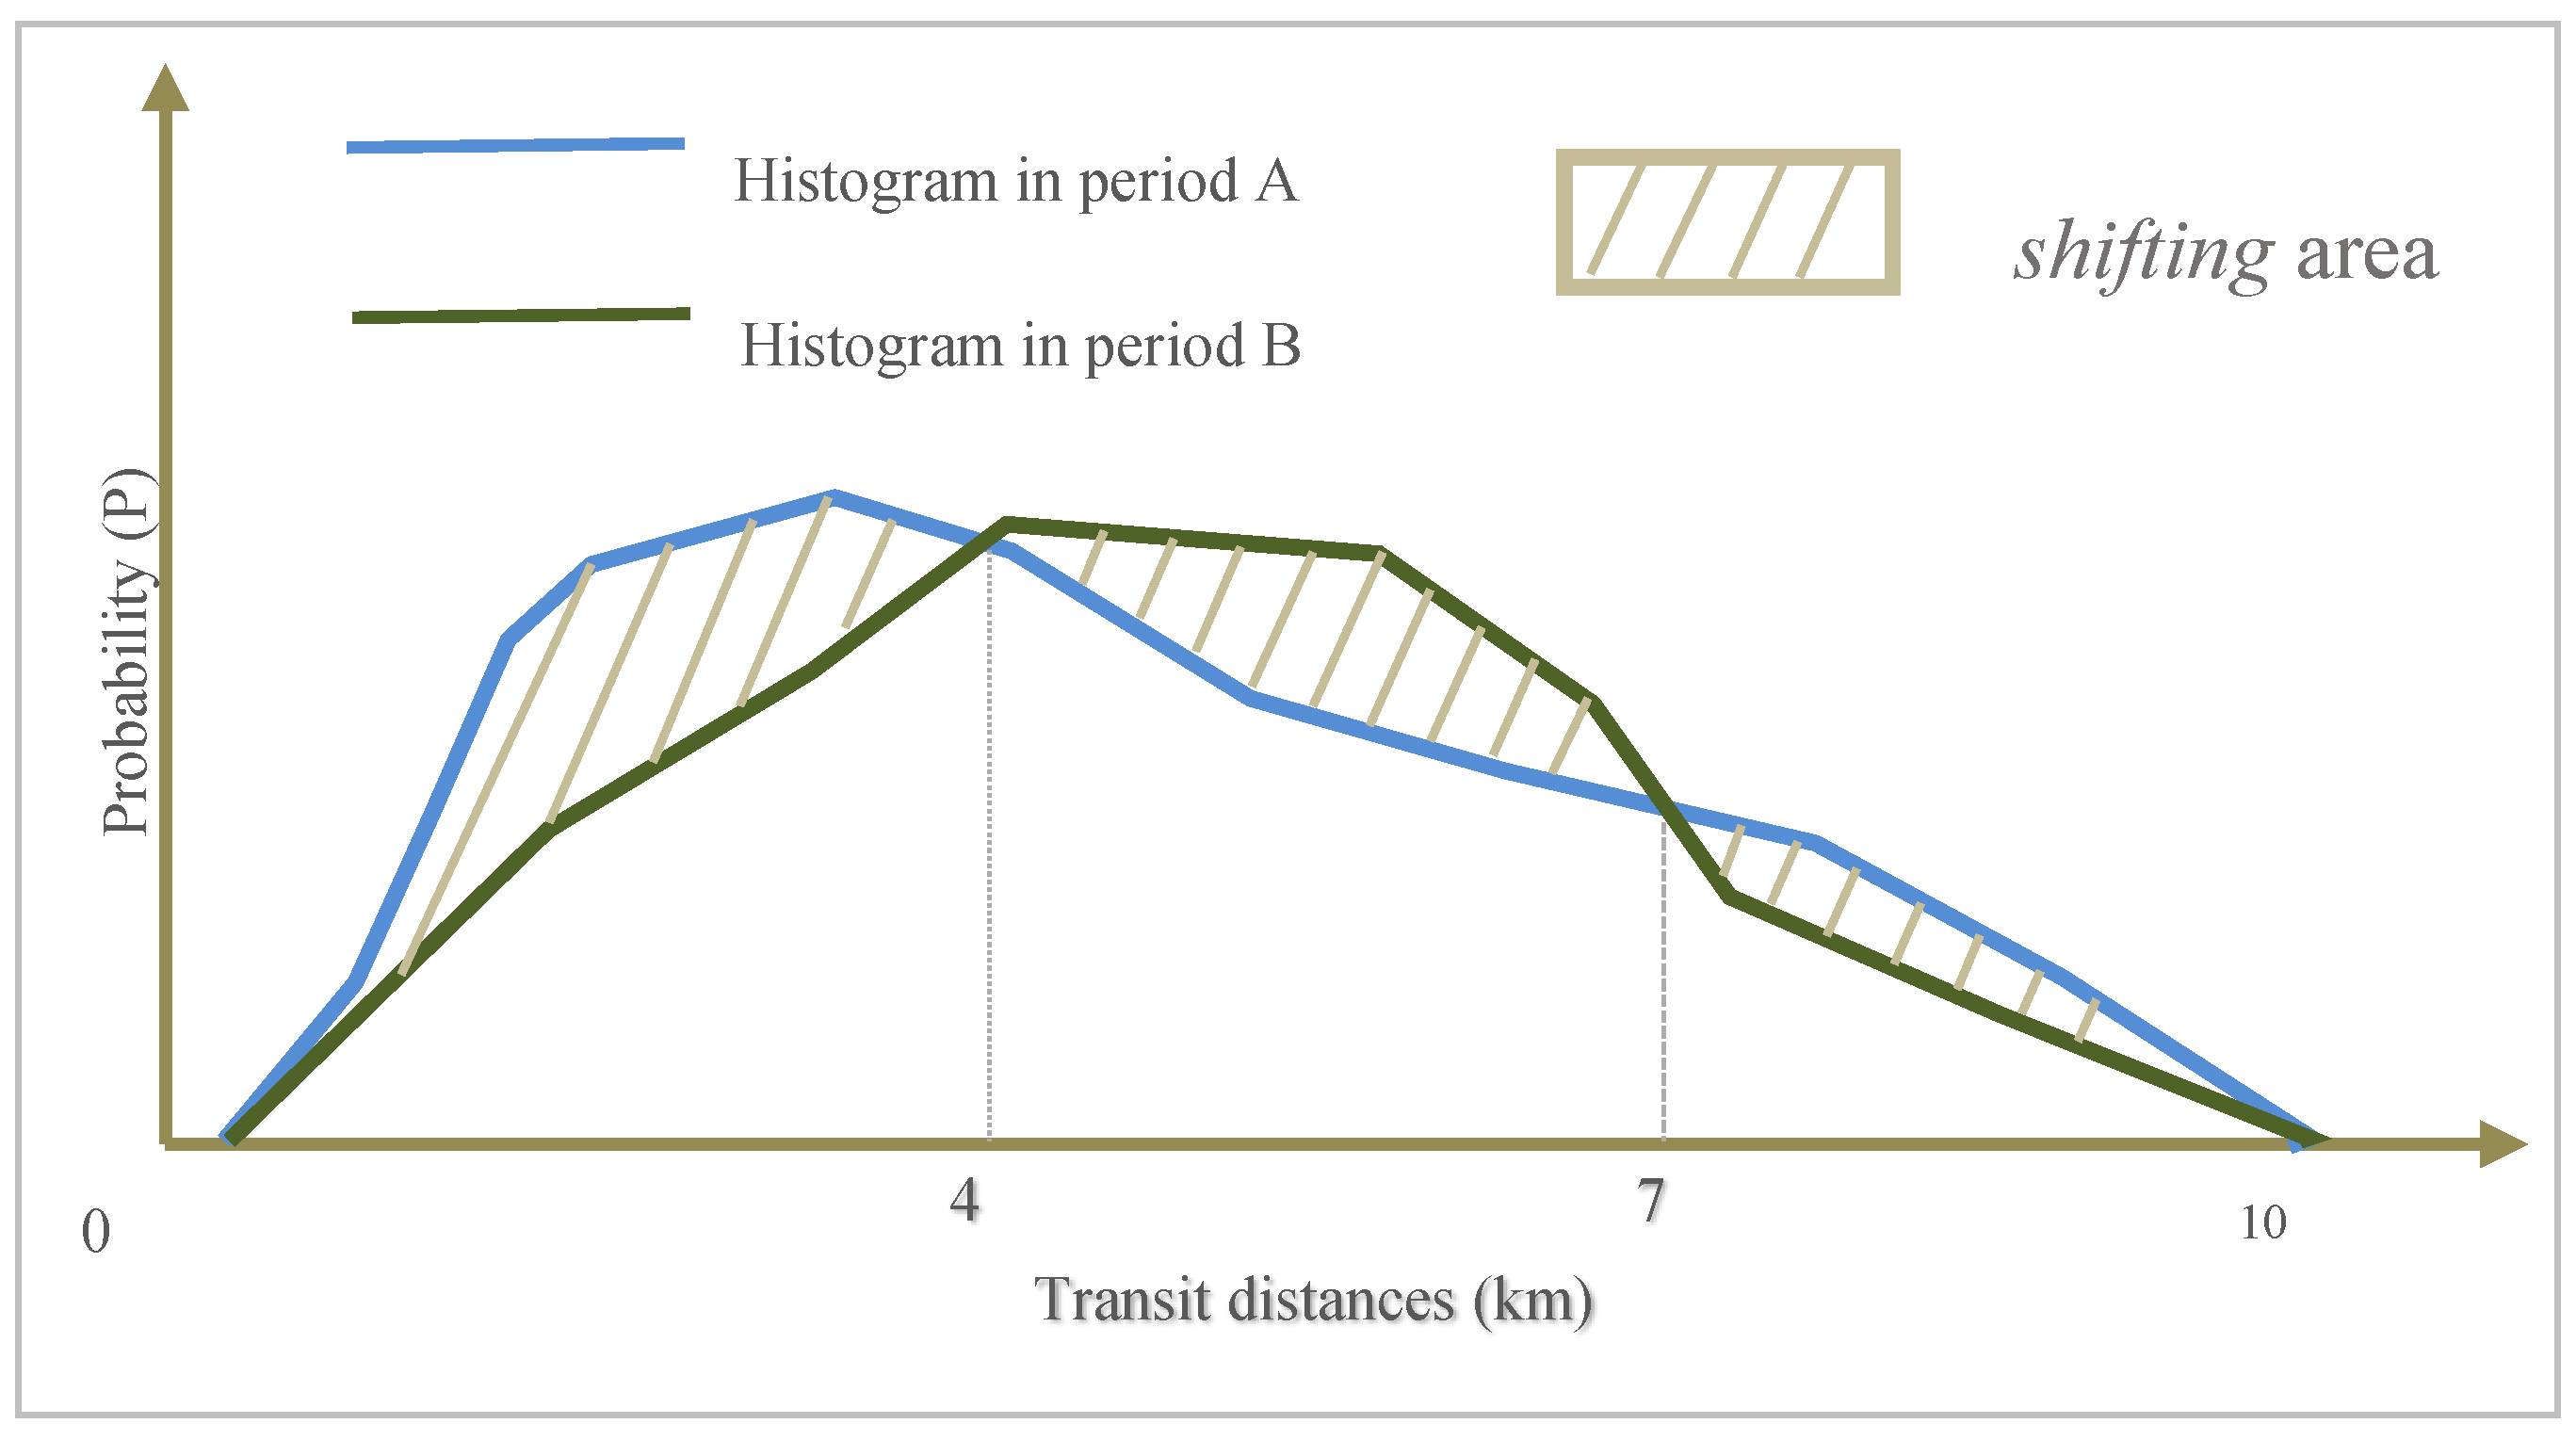
3.2. Histogram-Shifting Method

Transit trips with different OD distances might be affected differently by shared bicycles. A histogram-shifting method is designed to examine the influence of bicycle sharing on public transit service distances. The histogram method is an estimate of the probability distribution of the distances. Histograms are used to evaluate the distributions of transit OD distance in different distance intervals. Transit OD distances over 10 km are excluded because transit trips longer than that are less likely to be affected by bicycling. The range of 10 km is divided into 50 intervals, and then a count is taken of how many transits fall into each interval (Figure 2). If the area shifting of the service distance distribution shifts more than a given criterion, the service of the public transit system is affected by certain factors. The area of shifting can be calculated by:
s h i f t i n g = 0 10 | f A ( x ) f B ( x ) | d x
where fA(x) and fB(x) are the distributions (histograms) of service distances. The area of shifting ∈[0,2], and lower numbers near 0 mean the service distance change is minimal, while higher numbers near 2 mean the service distance change is substantial. A criterion of 0.2 (10% of the maximum) is set as the threshold; namely, when the area of shifting is greater than 0.2, we consider that the transit OD distances are affected by certain factors. As shown in Figure 2, the histograms of transit distances during period A and period B are to be compared, and P is the probability of the transit trip distance. Period A could be a time when shared bicycle usage is low, and period B may be the time when shared bicycle usage is high. If the two lines overlap, the area shifting is zero. When this happens, we know that the same proportion of transit riders travel in a certain distance range. If the two histograms do not overlap, we know that more people travel within trip distances of less than 4 km in time period B than those in period A, and more riders travel trip ranges between 4 and 7 km in time period B than period A.

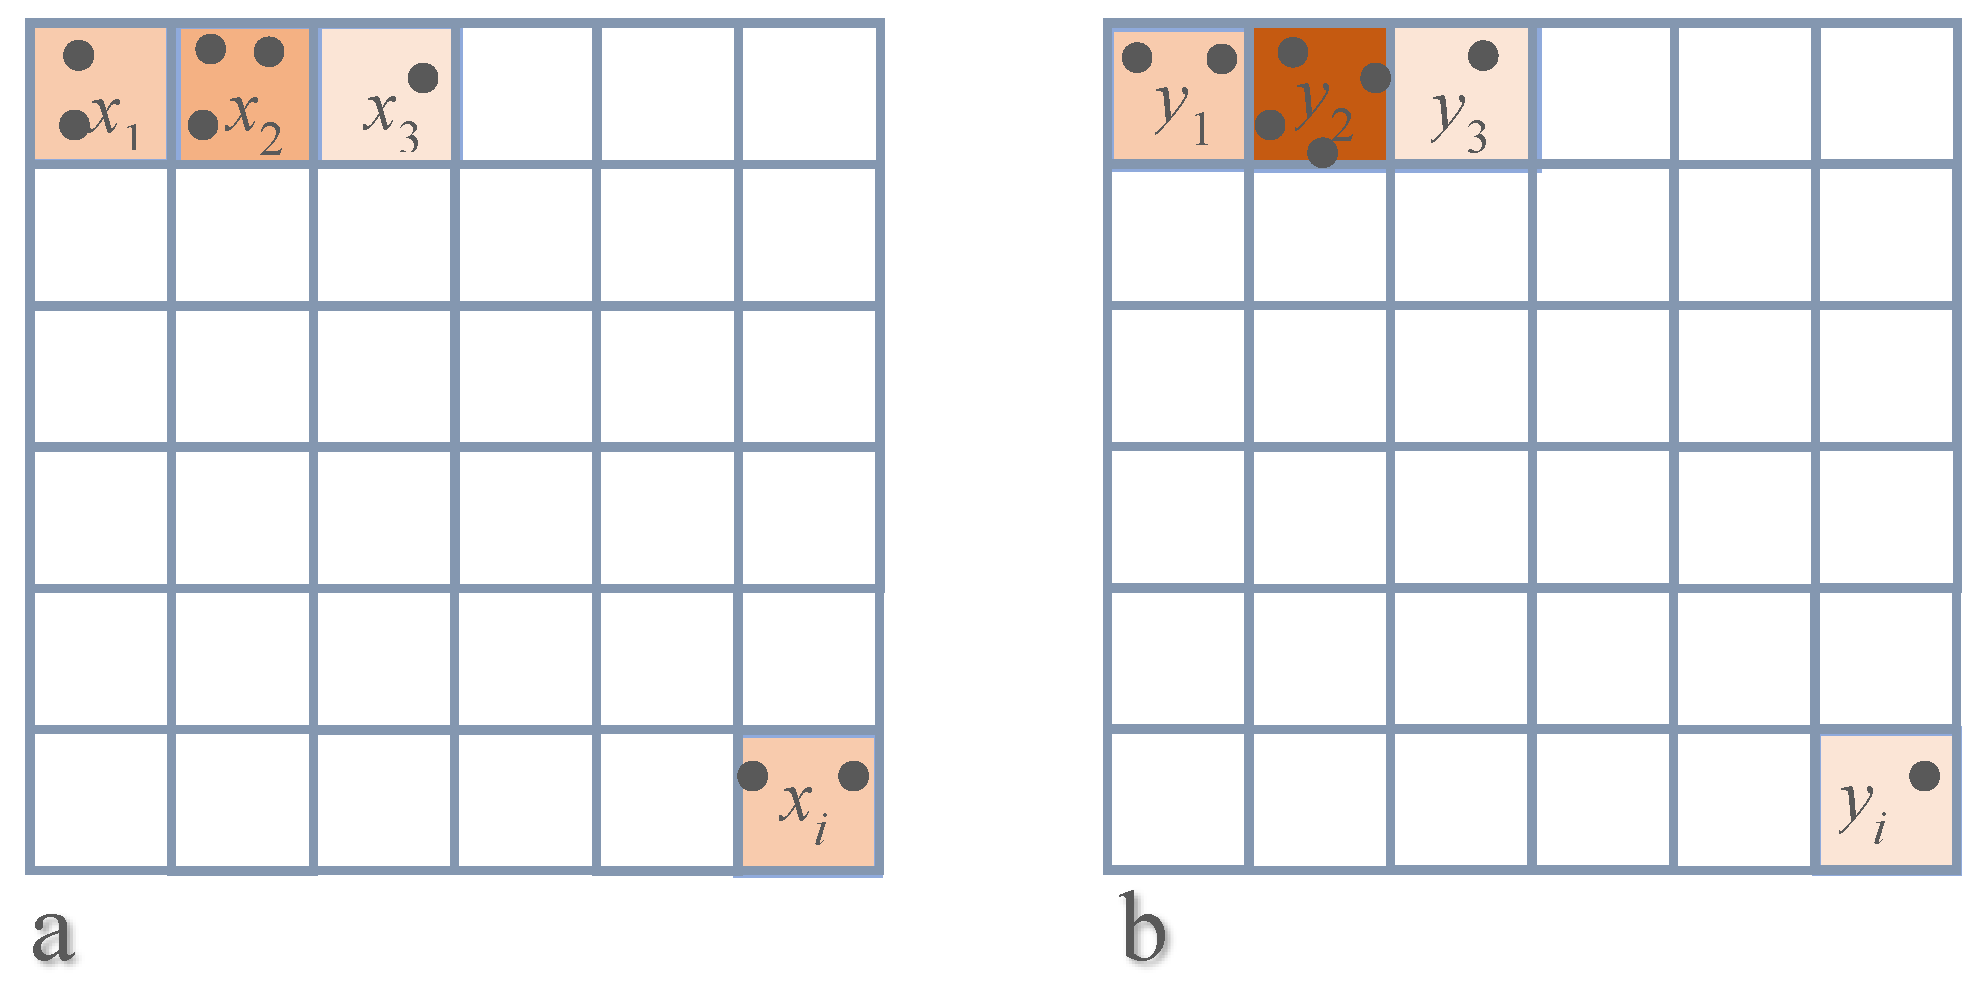
3.3. Spatial Correlation of Bicycle Usage and Transit Changes

If ridership within certain OD distance intervals changes proportionally, it must be determined whether the change has a spatial relationship with shared bicycle usage. Hence, a spatial correlation mechanism was designed. Transit changes are projected into gridded cell areas to examine the spatial relationship between bicycle usage and transit changes. The transit changes include one-stop transit and transferring. The spatial distribution of shared bicycle usages is also projected onto gridded cell areas to examine the relationship between bicycle sharing and public transit usages. If the proportional change in transit ridership within certain OD distances is accompanied by a change in bicycle usage, then they are correlated. Bicycle usage probably resulted in changes to the transit OD distance and transfer distance. The study area is converted into gridded cell areas A1, A2, A3, … An, with each cell area given an index number n. The counts of bicycling origins are projected into cell areas An based on whether the latitudes and longitudes of the bicycling start points are located in areas An.
In this mechanism, the grids are not perfect rectangles because the earth is a sphere. The area of a grid cell within the range of longitude ∈[λ1, λ2] and latitude ∈[ϕ1, ϕ2,] is calculated by the formula:
a r e a = 2 π r 2 ϕ 2 ϕ 1 s i n λ 1 s i n λ 2
where ϕ1, λ1, and ϕ2, λ2 are the geographical latitudes and longitudes in radians of the grid boundaries, respectively, and r is the radius of the earth. If a grid is small, the error ε of the area of the grid can be approximated by:
ε = 1 c o s ϕ 1 s i n ϕ 2
where ϕ1 and ϕ2 are the latitude limits of the study area. In Beijing, for example, a grid of 1 km by 1 km has an error 𝜀 = 0.0237, compared to a rectangle. In this situation, it is acceptable to consider grids based on latitudes and longitudes to be the same size as rectangles.
The number of bicycling riderships constitute an array X = [x1, x2, x3xn] (Figure 3a). Likewise, the transit ridership counts in the cell areas An could form an array Y = [y1, y2, y3yn] (Figure 3b). Shared bicycle changes in the cell areas are compared with the public transit changes.
Public transit systems with long, medium, and short service distances are affected differently by shared bicycle usage. If the shared bicycle usage has a spatial correlation with public transit ridership, the two are probably related. The Pearson product–moment correlation coefficients (Pearson) are calculated between short transit traffic changes and shared bicycle usage to evaluate the relationship between shared bicycle usage and transits. The correlation coefficient corr (X, Y) is the measurement of how the two types of traffic are related to each other. The formula for corr (X, Y) is:
c o r r ( X , Y ) = c o v ( X , Y ) σ X σ Y
where cov is the covariance, and σX and σY are the standard deviations of X and Y. The relationship between X and Y is calculated by r:
r =   i = 1 n ( x i x ¯ ) ( y i y ¯ ) i = 1 n ( x i x ¯ ) 2 i = 1 n ( y i y ) 2
where n is the number of gridded areas, xi is the shared bicycle usage in cell area number i, and yi is the public transit numbers in cell area number i.
Accordingly, r is a number within the range of [−1,1], and a higher r means a strong relationship between shared bicycle usage and a certain type of public transit activity. Similarly, R2 is a number within the range of [0,1], and a higher R2 means higher reliability for the study approach.

4. Data Process

4.1. Public Transit Data

The smart card data used in this study include metro and bus transit logs from Beijing’s public transport system. Transit data from the 24th week in 2016 and the 33rd week in 2017 were used, and the transit datasets included boarding stations, boarding time, alighting stations, alighting time. By the end of 2016, there were over 1020 bus lines and 19 subway lines in Beijing, with more than 20,000 bus stops and 345 subway stations (source: www.bjbus.com, www.bjsubway.com). Metro transits and bus transits were treated as equal transits in this paper. Daily bus transit volume or daily metro transit volume is approximately 10 million on a typical working day. The Beijing Municipal Administration and Communication Card (commonly known as the Yikatong, literally one-card pass) is the only type of smart card used in Beijing’s public transport system. The smart card can be used in the bus and metro systems in Beijing. Although passengers can buy the card anonymously, each card has a unique identification number. As such, we could track the travel information of individuals in Beijing’s public transport system and then calculate the user’s transit OD distances and transit transfer distances.

4.2. Shared Bicycle Data

By the end of 2017, roughly 2.35 million shared bicycles from 15 companies were in service in Beijing (source: www.xinhuanet.com). Mobike and Ofo were believed to be the top three largest bicycle-sharing companies by the year 2017 (source: fortune.com), and the two companies shared 31% overlapped users (source: www.questmobile.com.cn) at the beginning of 2017. The top companies might share far more users by the end of 2017 than other competitors. Shared electric bicycles also emerged in 2017, but they are not considered due to their small number. The randomly sampled bicycling daily log of 15 November 2017 is provided by the Ofo company, and each record contains the starting time and starting location, as well as the ending time and ending location. Altogether, 20,000 bicycling records were used in this study in the same area as transit data, and these records were randomly selected from the total dataset. It is important to note that the market share of the bicycle-sharing companies is presumed to be equal in geographical distribution such that the sample data represent the overall shared bicycle usage in Beijing. The number of riders using a shared bicycle in mid-2016 was substantially smaller compared to that in 2017; hence, the increase of shared bicycle usage could be approximately represented by bicycle usage at the end of 2017.

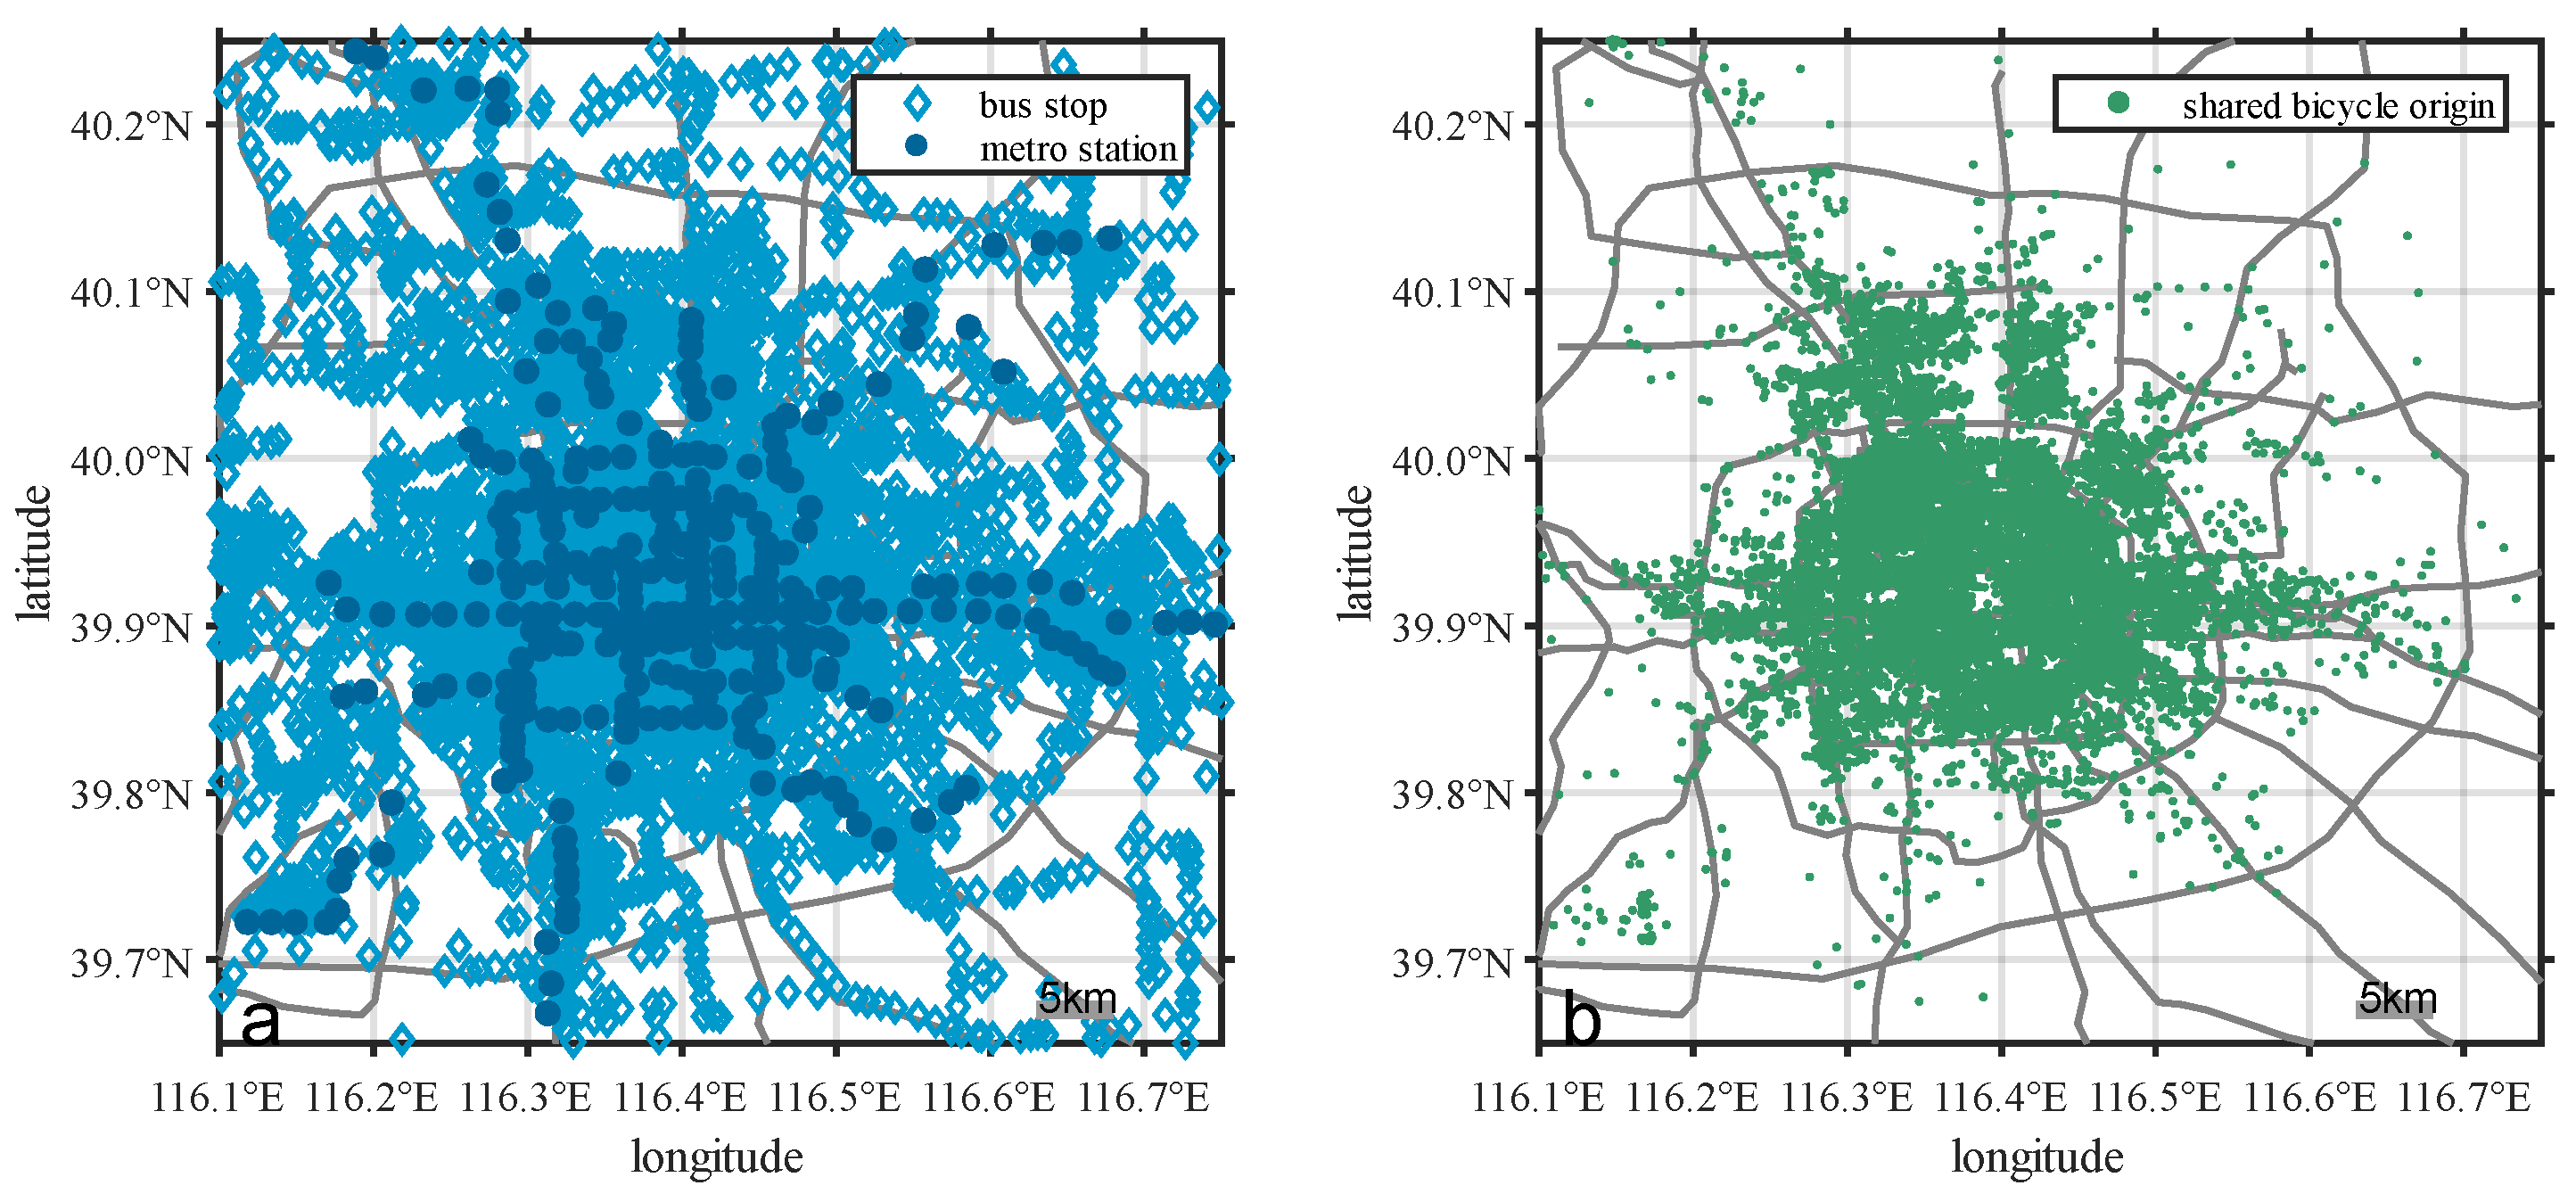
4.3. Visualization of Data

Urban areas in Beijing (as shown in Figure 4) are selected as the main study areas. To make the results significant, rural areas are excluded, because approximately 95% of the transit traffic is located within the range of longitude ∈[116.1,116.8] and latitude ∈[39.6,40.3]. The study area was divided into 400 gridded cell zones, generating arrays A = [A1, A2, A3A400]. Each grid was approximately 3.5 × 3.5 km in dimension.
Bicycling data comprise a sample randomly selected from the entire database; therefore, spatial distribution and service distance statistics are not affected by the sampling method. When the data is visualized, bus stops and metro stations are much more evenly distributed than the bicycling start points (Figure 4a). In the center areas, shared bicycles show patterns similar to transit access points (Figure 4b).

5. Results

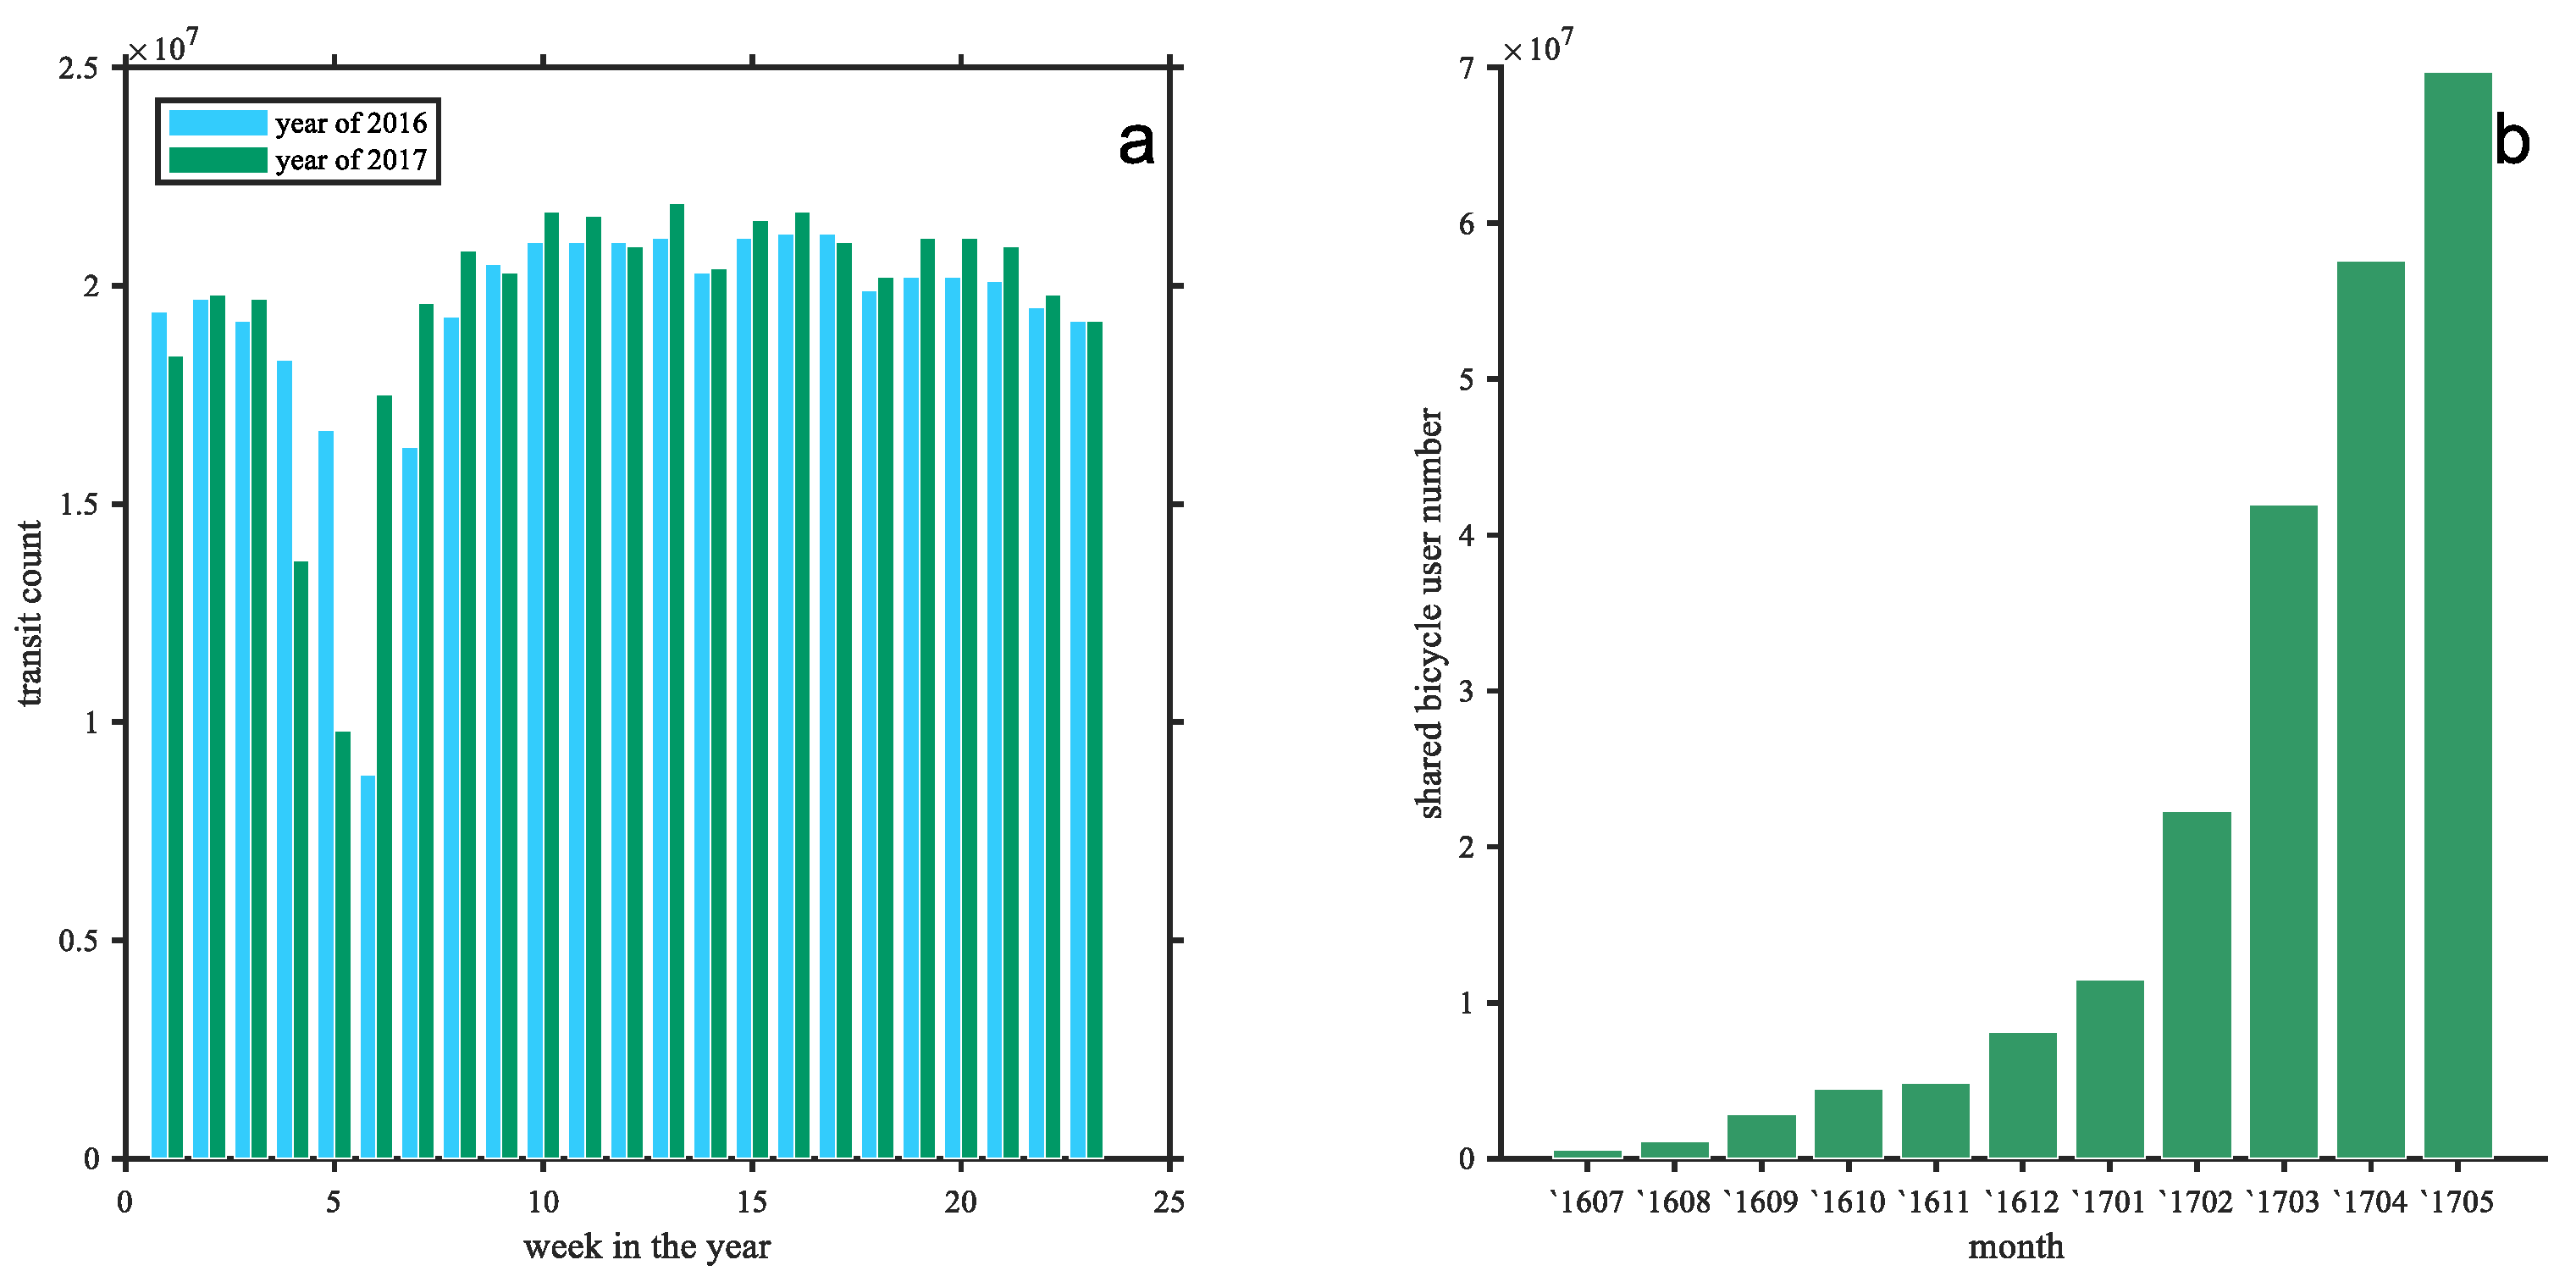
5.1. Comparison of Public Transit and Shared Bicycle Usage in Volumes

Overall, the public transit traffic volumes in Beijing were relatively stable from 2016 to 2017. A sharp drop in transit volume in the 4th and 5th week was due to the Chinese lunar new year holidays. Bus transits and metro transits were equally processed, and they totaled the overall daily transit traffic volumes. In most weeks, transit volumes were moderately higher in 2017 than 2016 (Figure 5a), with a dramatic increase of active shared bicycle users (Figure 5b).
The volume of shared bicycle usages most likely underwent the same increase as the number of active users, although we do not have the usage data that directly show how shared bicycle usage has increased over the period from June 2016 to May 2017. In this case study, the usage of shared bicycles has not likely reduced public transit ridership.

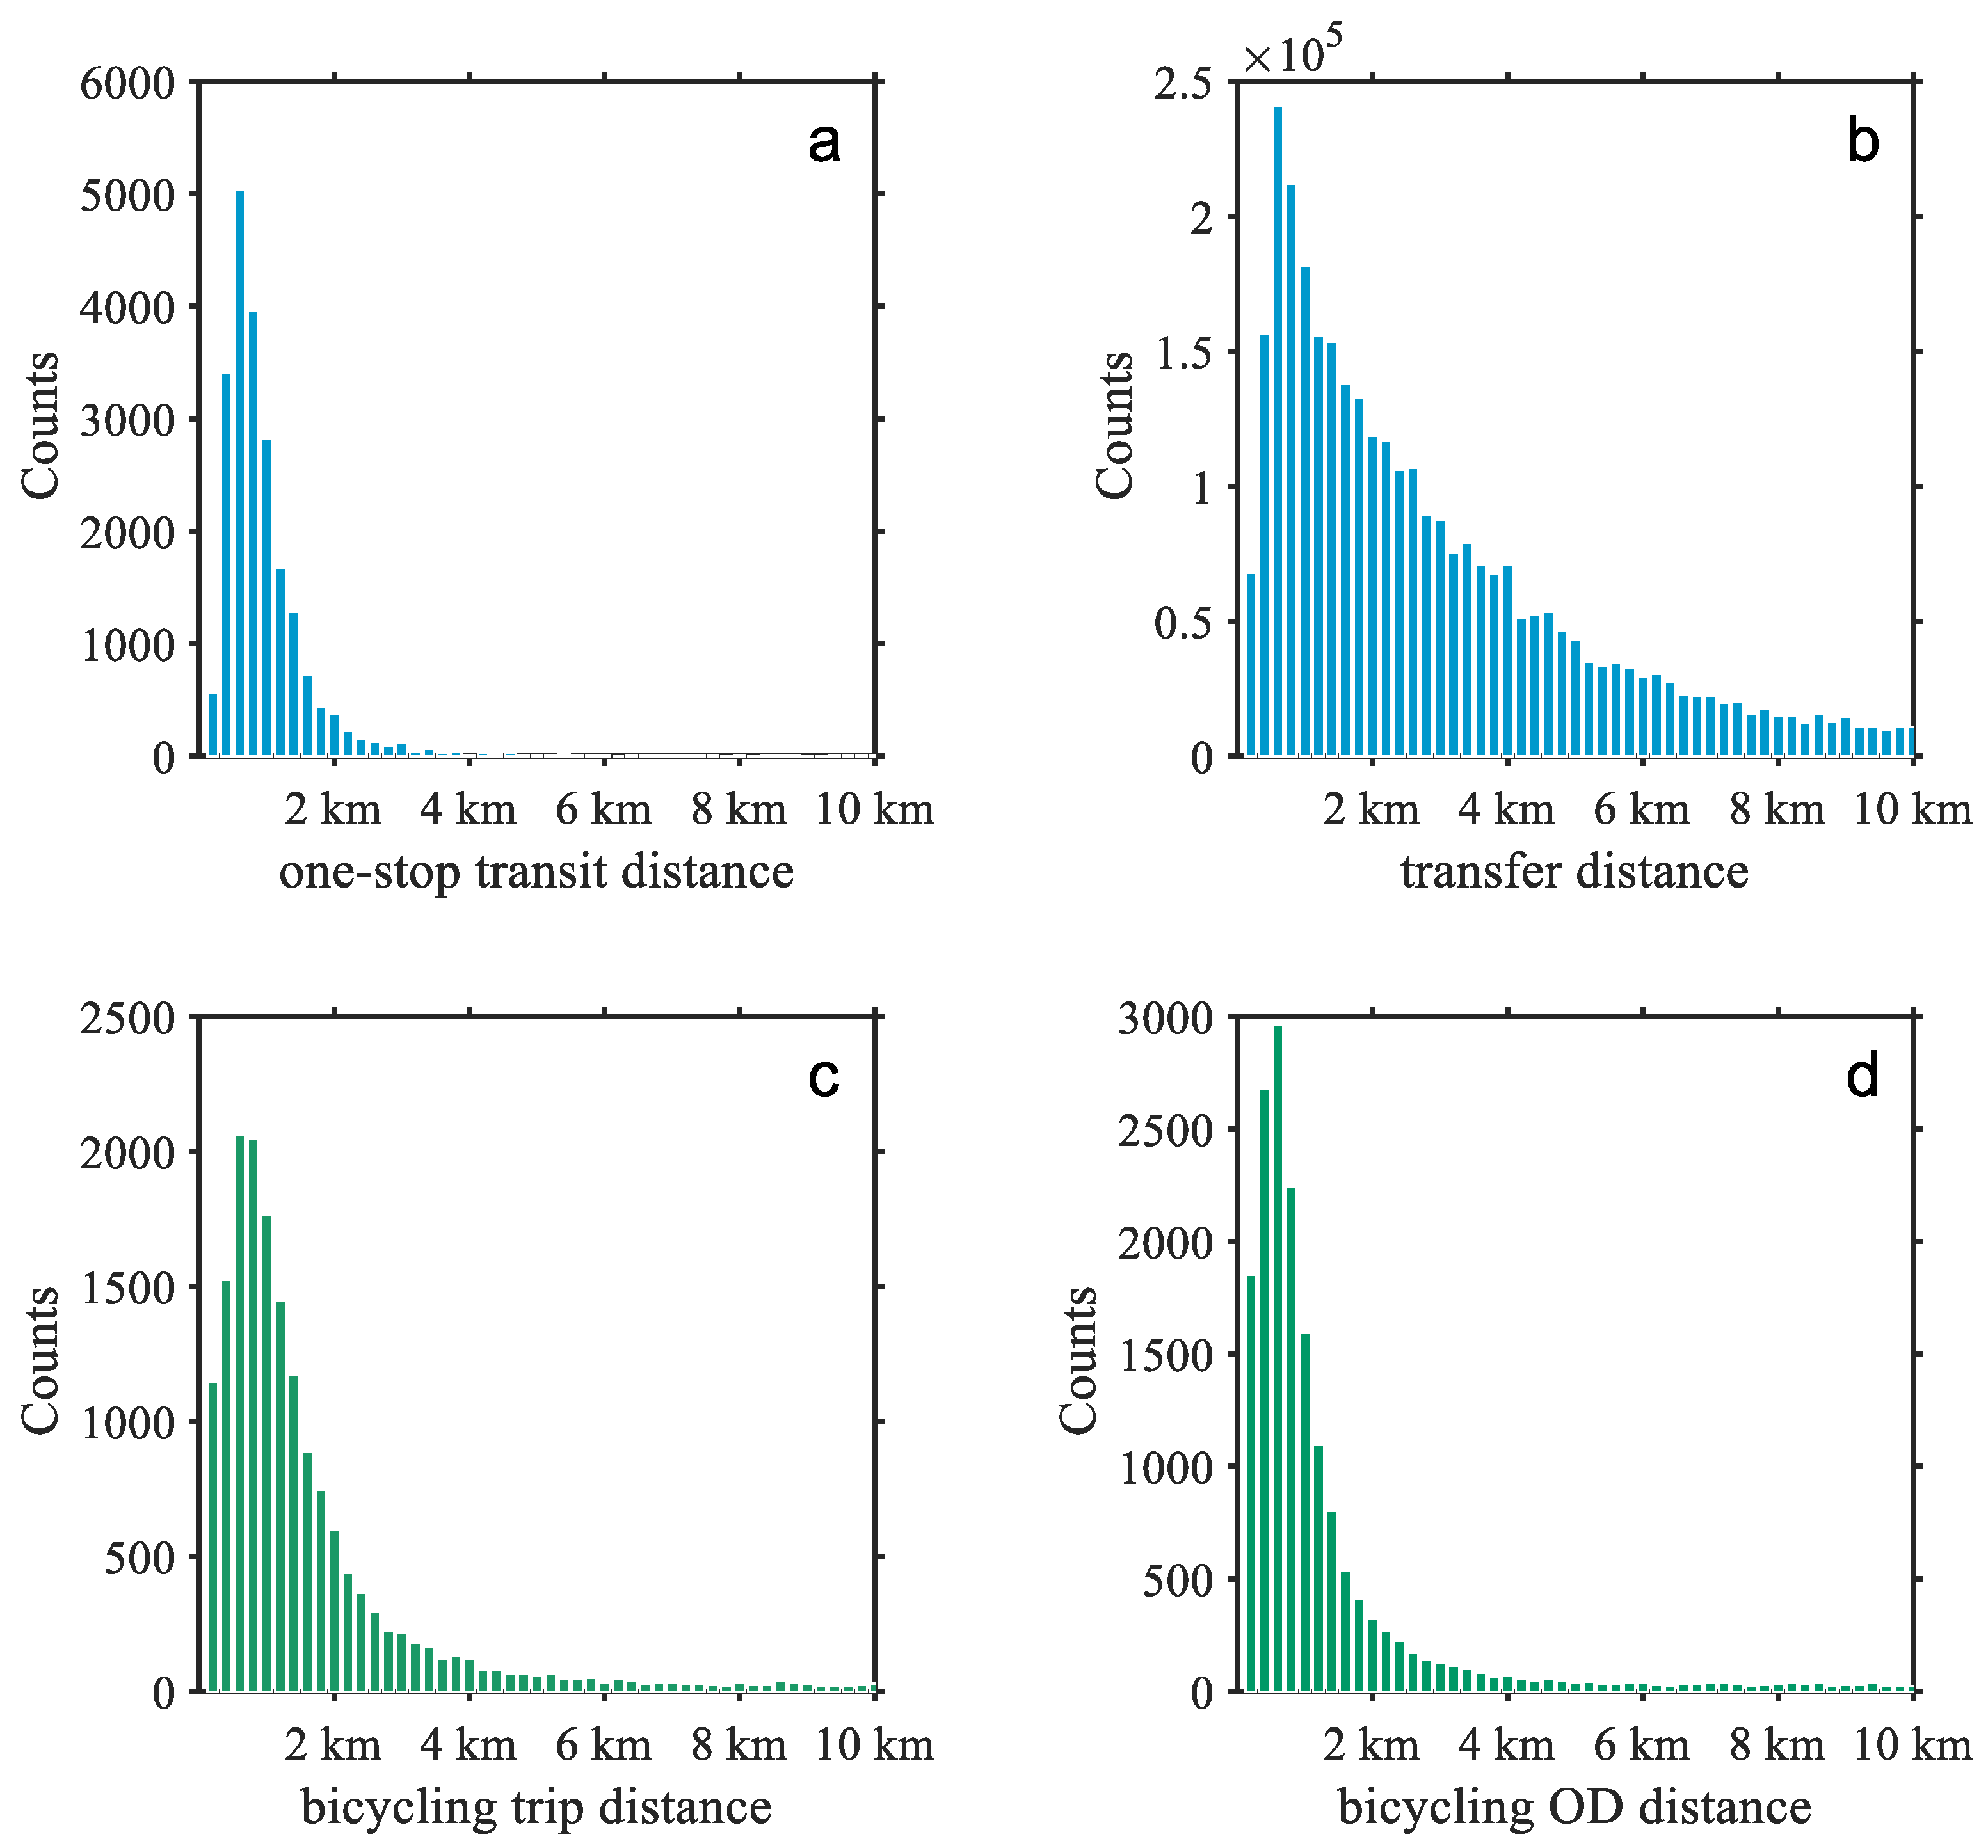
5.2. Histograms of Service Distances for Bicycling and Transits

Public transit smart card data and bicycling data collected on 15 November 2017 were used to develop histograms relating to service distances. One-stop transit distances, transfer transits, bicycling trip distances, and bicycling OD distances were counted and visualized with histograms. The histogram of one-stop transits shows that most one-stop trips are less than 2 km (Figure 6a). The statistics of transit riders travel distances between transits in public transit systems indicate that most people transfer within distances of 2 km (Figure 6b). The histograms indicate that most one-stop transits are less than 2 km (Figure 6c), and most bicyclists travel to destinations within 2 km of their origins (Figure 6d). It was also found that histograms of trip durations were similar to distance histograms. So it was reasonable use only distance information of the data to investigate interaction between bicycling and transits.
These travel distances are detailed in Table 1.
The detailed results show (1) most one-stop transits in Beijing were less than 2 km; (2) half of the public transit transfers were within displacements less than 2 km away; (3) approximately 85% of the bicycling distances were less than 2 km. The travel distances of shared bicycles are rather short; therefore, the possibility of riding shared bicycles as a substitute for long transit is low while the possibility of riding shared bicycles as a substitute for short transit is high. This was a reduction of one-stop transits as shared bicycle usage surged. There is also a great potential of cooperation between sharing bicycles and transit systems, for the results support the assumption that public transit riders using shared bicycles to substitute walking between transit stops.

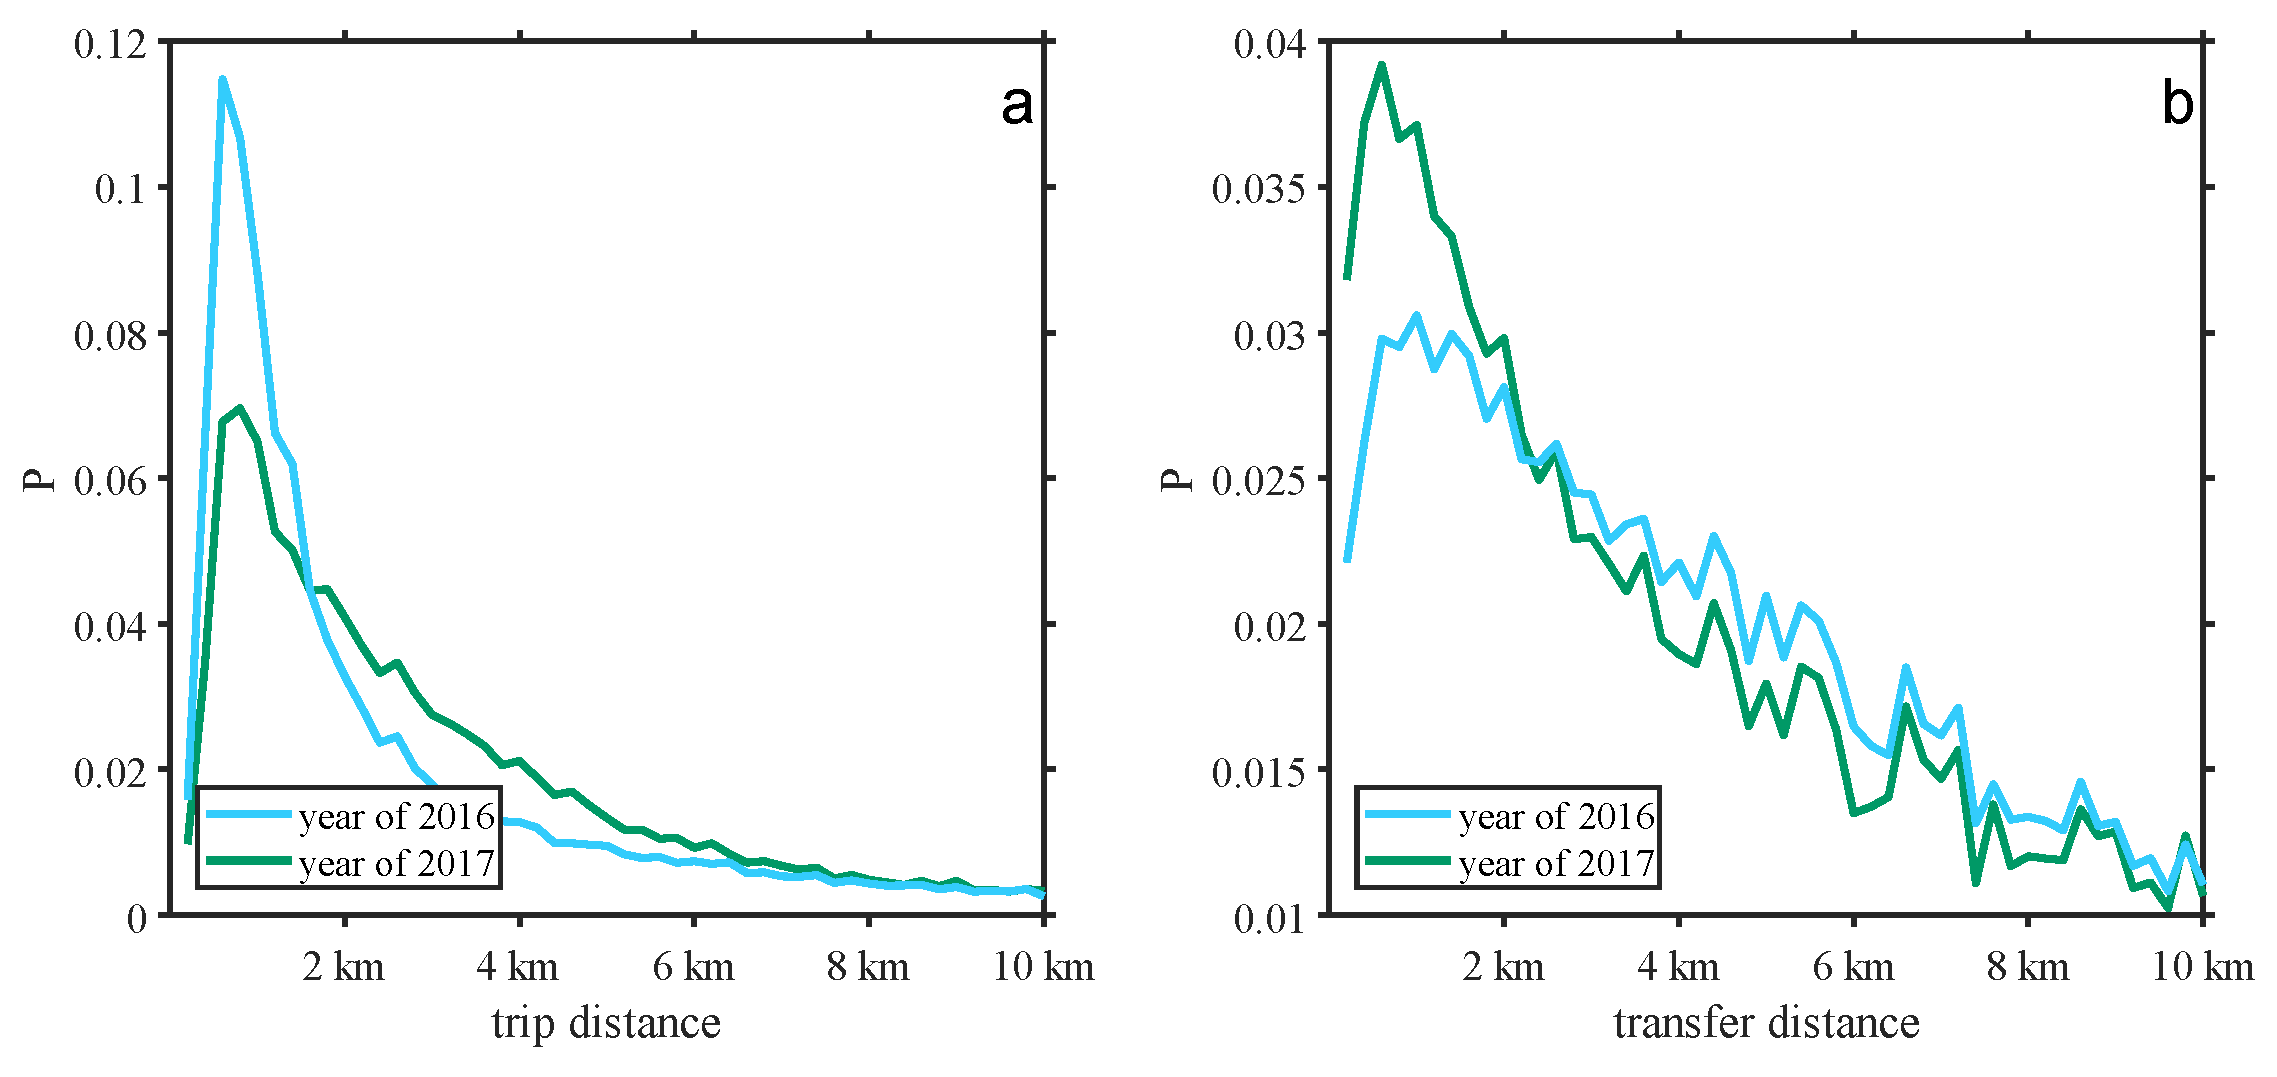
5.3. Public Transit Distance Changes Accompanied by Shared Bicycle Surge

The histograms of transit trip distances show that trip distances less than 2 km decreased; however, trips ranging from 2–6 km increased (Figure 7). The histograms of transit distances show more riders re-enter the transit system if the displacement is less than 2 km. The output of shiftingtransit for transit trip distances on a typical working day in 2017 is 0.3397 (Figure 6a), and the transfer histogram shift change shiftingre-enter is 0.1182 (Figure 6b). Both shiftings are notably larger than the average number calculated from the daily data collected for a week in 2016 (avg(shifting2016) = 0.005). Thus, the public transit service changed in both trip distance and connecting distance over this period. What is the cause of this phenomenon?
Detailed data showed that when the 33rd week of 2016 and the 24th week of 2017 were compared using short transit volumes (one-stop transits), daily short transits dropped from 775,000 to 691,000 on average and short transfers increased from 133,000 to 149,000 on average. The results in Section 5.2 showed the possibility that the usage of shared bicycles might have reduced short public transit ridership and increased public transit connections with displacements of less than 2 km. When transits with distances longer than 10 km were included, the results were similar. Long transits were found to be less likely to be affected by shared bicycles. Further examination could be carried out to measure the interaction of bicycling usage and transit activity changes.

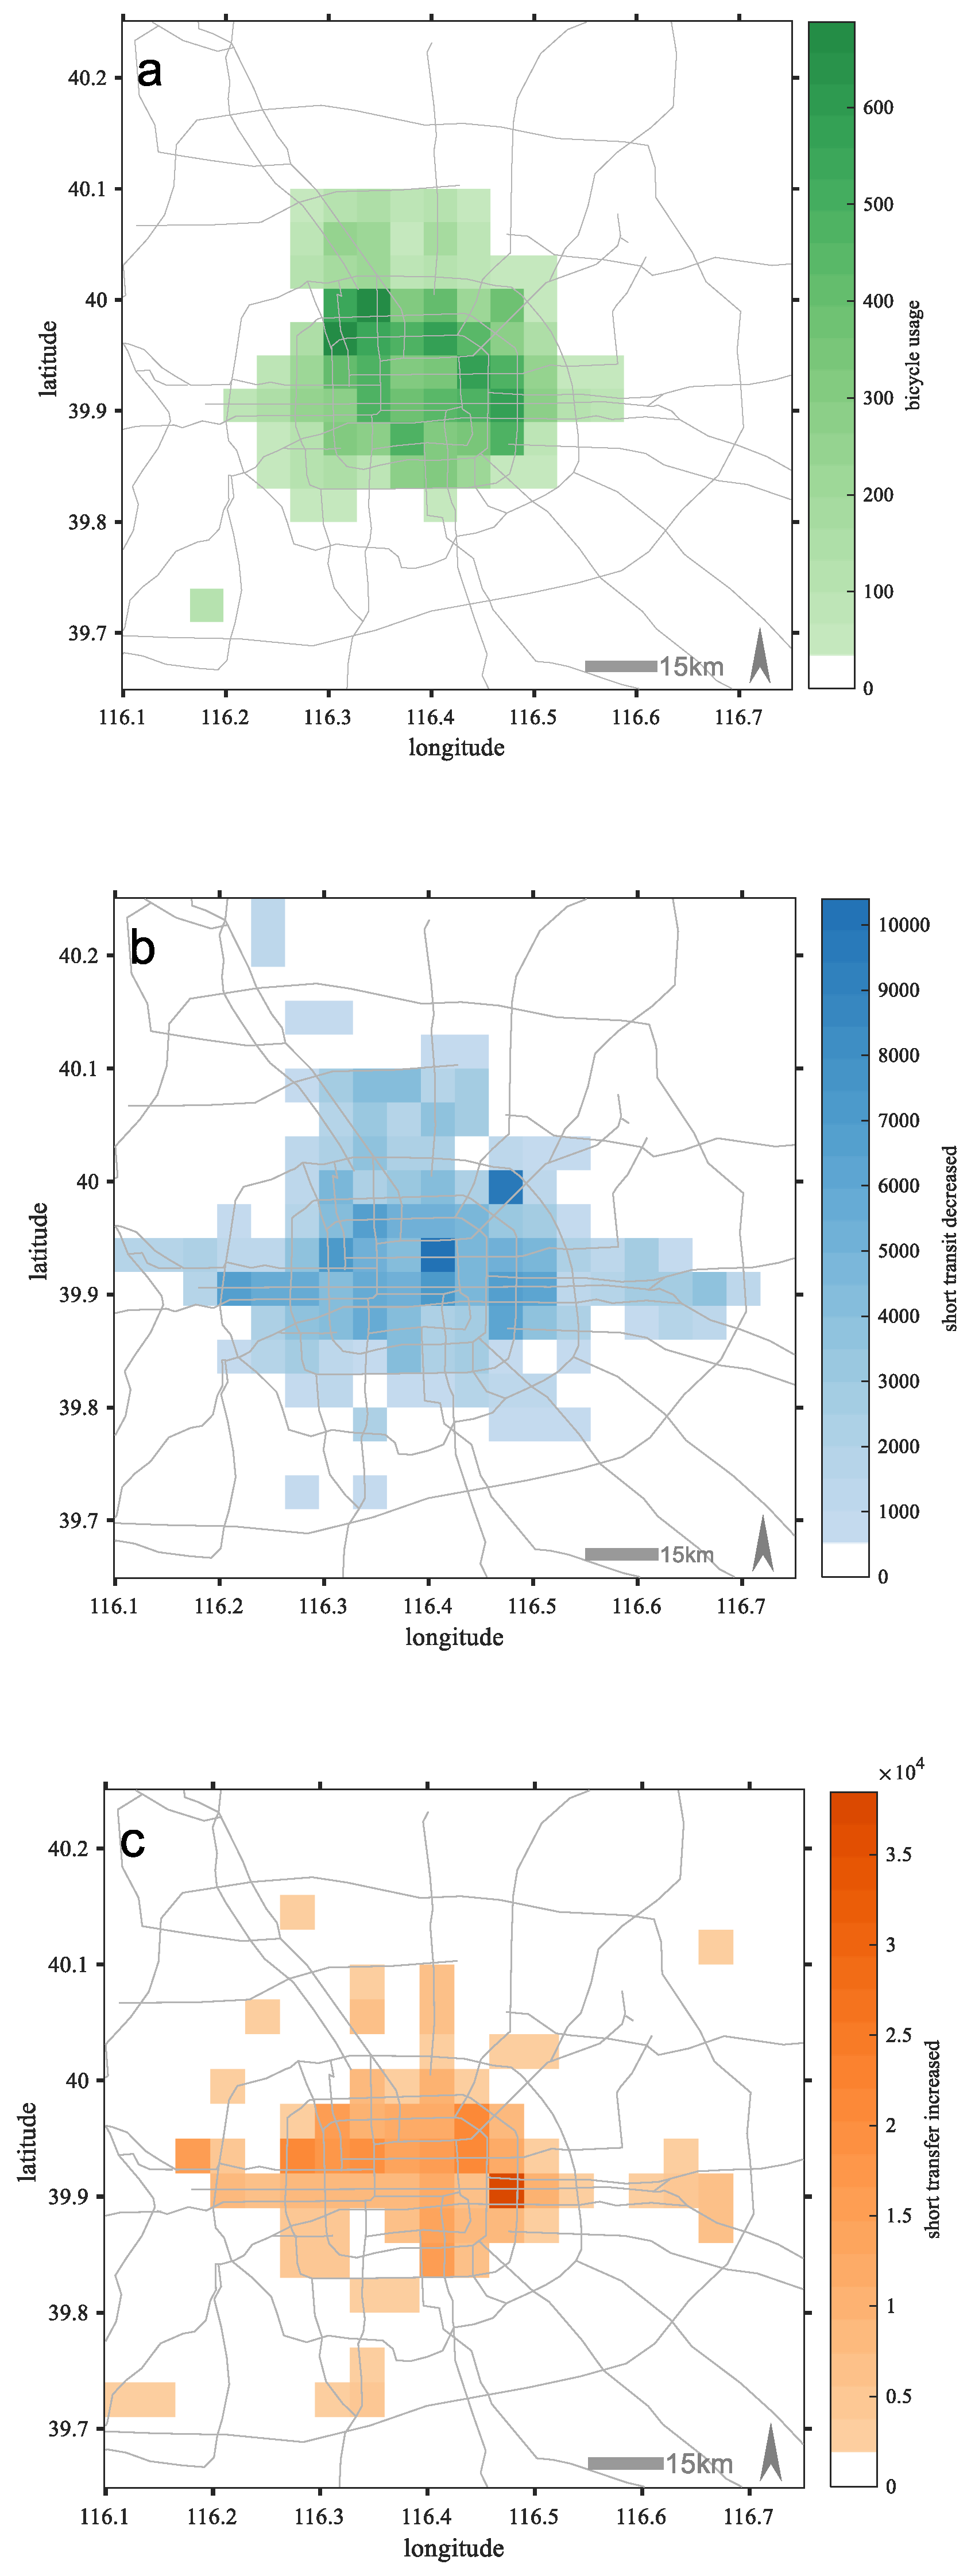
5.4. Spatial Correlation between Shared Bicycle Usage and Transit Service Changes

The results in Section 5.3 suggest that connections between shared bicycle usage, one-stop transits, and short transfers (within 2 km) need to be further examined utilizing a spatial correlation method. The three types of events (shared bicycle usage, one-stop transits, and short transfers) were projected into 400 cell areas according to a method in Section 3.3. The array X = [x1, x2, x3x400] was used to represent shared bicycle usage in 2017. The array Y = [y1, y2, y3y400] was used to represent short public transit reduction, while the array Z = [z1, z2, z3z400] was used to represent transfers within distances less than 2 km. When the arrays were calculated and visualized, each had similar spatial distributions. Figure 8a–c showed the spatial distribution of shared bicycle usage, short transit reduction, and short transfers increase respectively. Although some inconsistencies exist, overall there was a higher distribution of events in central urban zones than in surrounding areas.
The high correlation was explored among X, Y, and Z, with corr(X, Y) = 0.8326 (p = 0.001), corr(X, Z) = 0.7768 (p = 0.001), and corr(Y, Z) = 0.7171 (p = 0.001). The more shared bicycle usage in one cell area, the more short public transits is reduced in that cell area. In addition, more shared bicycle usage was also found to be associated with more public transit re-entries for travel less than 2 km. That is to say, more people might use shared bicycles when connecting with public transits.

6. Conclusions and Discussion

The results show that: (1) the usage of shared bicycles did not result in a reduction in overall transit ridership volume; (2) however, transit ridership volumes for short distances, especially within 2 km, decreased while transfers within 2 km increased with the rise in shared bicycle usage; and (3) the decrease of short transits and increase of near transit transfers were highly correlated to the geographical distribution of shared bicycles
Both cooperation and competition exist between shared bicycles and public transit systems. We need not be too concerned about the negative effects of shared bicycles on public transit ridership. While the use of shared bicycles may not cause an overall reduction in public transit, only short transit volume may be reduced. Researchers and regulators should not neglect that shared bicycles might also have a potentially significant role in connecting public transits. Policymakers could take advantage of this potential for improving existing public transport systems.
Further study is needed to investigate how bicycle-sharing systems influence travel behaviors, because the methods in this study are rather uncomplicated and lack onsite surveys. However, we believe our findings could provide urban planners and public transit policymakers with useful information for future transportation planning decisions. A better understanding of the relationship between sharing bicycles and traditional public transport systems will help to create more integrated transportation systems and enrich our cities.
The results of this study also provide useful information for urban sustainability: public transit systems in metropolitan cities such as Beijing are not sufficiently pedestrian friendly, because a good proportion of transfer distances are much longer than bicycling distances; there should be a strong need to complement the transit system by providing adequate bicycling services at public transit access points and sectors where public transit and bicycle-sharing schemes could work together to make both transport modes appealing. To avoid conflicts between the two transport modes, attention should also be paid to the negative influences of shared bicycles, such as transit access points flooded by shared bicycles.

Author Contributions

J.H.T. and J.F.J. conceived of and designed the research approach for the project. W.J.E. contributed to the development of methods. J.H.T contributed to most of the writing, analysis of the data, the development of figures. D.L.B. contributed to the development of methods primary data collection. S.W. provided support for the grammar correction of the manuscript.

Funding

The work in this paper was supported by the Strategic Priority Research Program of the Chinese Academy of Sciences (Grant No. XDA19040403) and National Natural Science Foundation of China (No. 41771134, 41722103).

Acknowledgments

The authors are thankful to Liang Ye and Dang Hong from the bicycle-sharing company for helping in sharing bicycle data access. The authors are very grateful to colleagues of the Beijing Transport Information Center for their data support.

Conflicts of Interest

The authors declare no conflict of interest.

References

  1. Okraszewska, R.; Romanowska, A.; Wołek, M.; Oskarbski, J.; Birr, K.; Jamroz, K. Integration of a Multilevel Transport System Model into Sustainable Urban Mobility Planning. Sustainability 2018, 10, 479. [Google Scholar] [CrossRef]
  2. Fishman, E. Bikeshare: A review of recent literature. Transp. Rev. 2016, 36, 92–113. [Google Scholar] [CrossRef]
  3. Wu, J.; Wang, L.; Li, W. Usage Patterns and Impact Factors of Public Bicycle Systems: Comparison between City Center and Suburban District in Shenzhen. J. Urban Plan. Dev. 2018, 144, 04018027. [Google Scholar] [CrossRef]
  4. Ma, T.; Liu, C.; Erdoğan, S. Bicycle sharing and public transit: Does Capital Bikeshare affect Metrorail ridership in Washington, DC? Transp. Res. Rec. J. Transp. Res. Board 2015, 2534, 1–9. [Google Scholar] [CrossRef]
  5. Yu, Y.; Yi, W.; Feng, Y.; Liu, J. Understanding the Intention to Use Commercial Bike-sharing Systems: An Integration of TAM and TPB. In Proceedings of the 51st Hawaii International Conference on System Sciences, Waikoloa, HI, USA, 2–6 January 2018. [Google Scholar]
  6. Zhang, Y.; Brussel, M.J.; Thomas, T.; van Maarseveen, M.F. Mining bike-sharing travel behavior data: An investigation into trip chains and transition activities. Comput. Environ. Urban Syst. 2018, 69, 39–50. [Google Scholar] [CrossRef]
  7. Wu, F.; Xue, Y. Innovations of Bike Sharing Industry in China: A Case Study of Mobike’s Station-Less Bike Sharing System. 2017. Available online: http://www.diva-portal.org/smash/record.jsf?pid=diva2%3A1111732&dswid=-9361 (accessed on 10 January 2019).
  8. Guo, Y.; Zhou, J.; Wu, Y.; Li, Z. Identifying the factors affecting bike-sharing usage and degree of satisfaction in Ningbo, China. PLoS ONE 2017, 12, e0185100. [Google Scholar] [CrossRef] [PubMed] [Green Version]
  9. Shaheen, S.A.; Martin, E.W.; Cohen, A.P.; Chan, N.D.; Pogodzinski, M. Public Bikesharing in North America during a Period of Rapid Expansion: Understanding Business Models, Industry Trends & User Impacts, MTI Report 12–29; MTI: New York, NY, USA, 2014. [Google Scholar]
  10. Campbell, A.A.; Cherry, C.R.; Ryerson, M.S.; Yang, X. Factors influencing the choice of shared bicycles and shared electric bikes in Beijing. Transp. Res. Part C Emerg. Technol. 2016, 67, 399–414. [Google Scholar] [CrossRef] [Green Version]
  11. Jäppinen, S.; Toivonen, T.; Salonen, M. Modelling the potential effect of shared bicycles on public transport travel times in Greater Helsinki: An open data approach. Appl. Geogr. 2013, 43, 13–24. [Google Scholar] [CrossRef]
  12. Midgley, P. The role of smart bike-sharing systems in urban mobility. Journeys 2009, 2, 23–31. [Google Scholar]
  13. Liu, Z.; Jia, X.; Cheng, W. Solving the last mile problem: Ensure the success of public bicycle system in Beijing. Procedia-Soc. Behav. Sci. 2012, 43, 73–78. [Google Scholar] [CrossRef]
  14. Replogle, M. Bicycle access to public transportation: Learning from abroad. ITE J. 1992, 62, 15. [Google Scholar]
  15. Wang, R.; Liu, C. Bicycle-transit integration in the United States, 2001–2009. J. Public Transp. 2013, 16, 6. [Google Scholar] [CrossRef]
  16. Gordon-Koven, L.; Levenson, N. Levenson, Citi Bike Takes New York; Rudin Center for Transportation Management and Policy: New York, NY, USA, 2014. [Google Scholar]
  17. Campbell, A.A.; Cherry, C.R.; Ryerson, M.S.; Yang, X. Sharing riders: How bikesharing impacts bus ridership in New York City. Transp. Res. Part A Policy Pract. 2017, 100, 264–282. [Google Scholar] [CrossRef]
  18. Saberi, M.; Ghamami, M.; Gu, Y.; Shojaei, M.H.S.; Fishman, E. Understanding the impacts of a public transit disruption on bicycle sharing mobility patterns: A case of Tube strike in London. J. Transp. Geogr. 2018, 66, 154–166. [Google Scholar] [CrossRef]
  19. Clewlow, R.R. Carsharing and sustainable travel behavior: Results from the San Francisco Bay Area. Transp. Policy 2016, 51, 158–164. [Google Scholar] [CrossRef]
  20. Chang, X.; Shen, J.; Lu, X.; Huang, S. Statistical patterns of human mobility in emerging Bicycle Sharing Systems. PLoS ONE 2018, 13, e0193795. [Google Scholar] [CrossRef] [PubMed]
  21. Fishman, E.; Washington, S.; Haworth, N. Bike share: A synthesis of the literature. Transp. Rev. 2013, 33, 148–165. [Google Scholar] [CrossRef]
  22. Givoni, M.; Rietveld, P. The access journey to the railway station and its role in passengers’ satisfaction with rail travel. Transp. Policy 2007, 14, 357–365. [Google Scholar] [CrossRef]
  23. Bachand-Marleau, J.; Larsen, J.; El-Geneidy, A. Much-anticipated marriage of cycling and transit: How will it work? Transp. Res. Rec. J. Transp. Res. Board 2011, 2247, 109–117. [Google Scholar] [CrossRef]
  24. Fishman, E.; Washington, S.; Haworth, N. Factors influencing bike share membership: An analysis of Melbourne and Brisbane. Transp. Res. Part A Policy Pract. 2015, 71, 17–30. [Google Scholar] [CrossRef]
  25. Zhao, P.; Li, S.; Li, P.; Liu, J.; Long, K. How does air pollution influence cycling behaviour? Evidence from Beijing. Transp. Res. Part D Transp. Environ. 2018, 63, 826–838. [Google Scholar] [CrossRef]
Figure 1. Distances related to transits.
Sustainability 11 01323 g001
Figure 2. Histogram-shifting method for transit distances.
Sustainability 11 01323 g002
Figure 3. (a) Spatial correlation of bicycle usage and (b) public transit ridership changes.
Sustainability 11 01323 g003
Figure 4. (a) Public transit access points, and (b) shared bicycle starting points.
Sustainability 11 01323 g004
Figure 5. (a) Overall daily transit ridership volumes, and (b) number of shared bicycle users volumes.
Sustainability 11 01323 g005
Figure 6. Histograms (a) Origin–destination (OD) distances of one-stop transits, (b) transfer distances, (c) bicycling trip distances, and (d) bicycling OD distances.
Sustainability 11 01323 g006
Figure 7. Histogram shift of (a) transit distances, and (b) transfer distances.
Sustainability 11 01323 g007
Figure 8. Spatial distribution of (a) shared bicycle usage, (b) short transit reduction, and (c) short transfers increase.
Sustainability 11 01323 g008
Table 1. Travel distances statistics.
Distance Type<2 km<4 km
One-stop transits0.94690.9932
Re-entry displacements0.47410.7566
Bicycle route distances0.78420.9297
Bicycle OD distances0.84950.9364

