Article

Forecasting Quarterly Sales Volume of the New Energy Vehicles Industry in China Using a Data Grouping Approach-Based Nonlinear Grey Bernoulli Model

School of Business Administration, Zhejiang University of Finance & Economics, Hangzhou 310018, China
*
Author to whom correspondence should be addressed.
Sustainability 2019, 11(5), 1247; https://doi.org/10.3390/su11051247
Submission received: 29 November 2018 / Revised: 21 February 2019 / Accepted: 22 February 2019 / Published: 27 February 2019
(This article belongs to the Special Issue Transition from China-Made to China-Innovation )

Abstract

:
The new energy vehicles (NEVs) industry has been regarded as the primary industry involving in the transformation of the China automobile industry and environmental pollution control. Based on the quarterly fluctuation characteristics of NEVs’ sales volume in China, this research puts forwards a data grouping approach-based nonlinear grey Bernoulli model (DGA-based NGBM (1,1)). The main ideas of this work are to effectively predict quarterly fluctuation of NEVs industry by introducing a data grouping approach into the NGBM (1,1) model, and then use the particle swarm optimization (PSO) algorithm to optimize the parameters of the model so as to increase forecasting precision. By empirical comparison between the DGA-based NGBM (1,1) and existing data grouping approach-based GM (1,1) model (DGA-based GM (1,1)), DGA-based NGBM (1,1) can effectively reduce the prediction error resulting from quarterly fluctuation of sales volume of the NEVs, and prediction performance are proven to be favorable. The results of out-of-sample forecasting using the model proposed show that the sales volume of NEVs in China will increase by 57% in 2019–2020 with a quarterly fluctuation. In 2020, the sales volume of NEVs will exceeds the target of 2 million in the “13th Five-Year Strategic Development Plan”. Therefore, China needs to pay more attention to infrastructure construction and after-sales service for NEVs.

1. Introduction

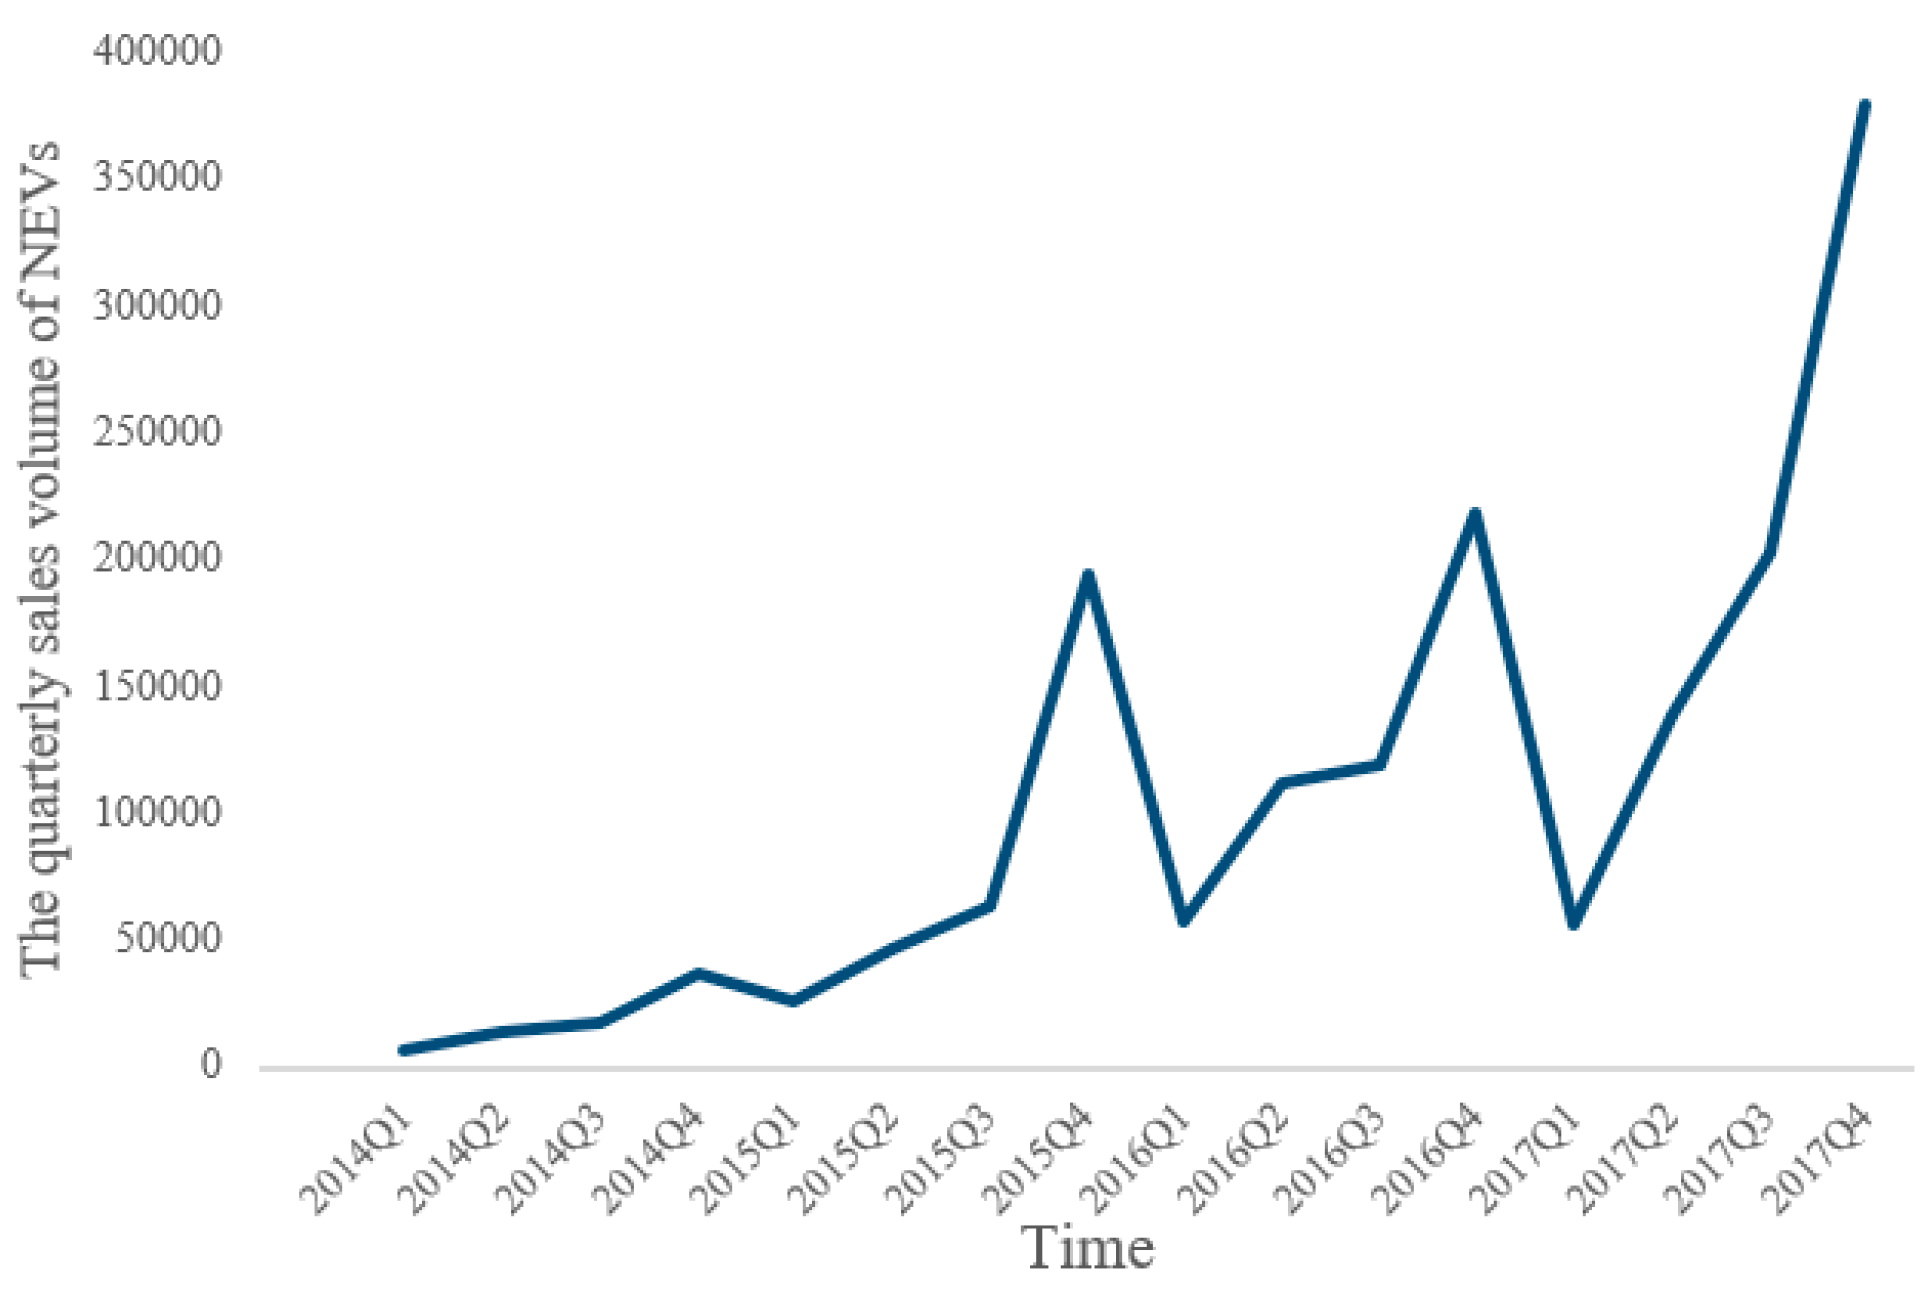
1.1. Background and Motivation

Automobile industry, as a pillar industry in national economy, plays an essential role in the development of economy and society. However, the increasing demand of vehicles leads to the shortage, serious environmental pollution and global warming. The energy saving and emission reduction has been the main focus of the countries across the world and accordingly the new energy vehicles (NEVs) industry has been paid much attention by the Chinese government [1]. The Decision on Rapidly Fostering and Developing Strategic Emerging Industries and The Development Plan of Energy-saving New Energy Vehicles Industry during 2012–2020 were issued by the State Council of China in 2010 and 2012, respectively. Made in China 2025 issued by the state council in 2015 has seen energy-saving NEVs as a key industry. The data issued by China Association of Automobile Manufactures show that the sales volumes of NEVs during 2012–2016 are 12,791, 17,600, 74,763, 331,092, and 507,000 and total sales volume within the five-year increase by 41-fold [2]. Moreover, the sales volume of NEVs in 2016 takes up 1.81% of total sales volume of vehicles in China in the same period and increases by 53%, presenting a rapid growth. According to China’s 13th Five-Year Strategic Development Plan, the sales volume of NEVs will increase to more than two million by 2020. In order to achieve the overall goals of the 13th Five-Year Plan, forecasting accurately the developing trend of the sales volume for China’s NEVs is essential for making policies about NEVs, and can lay a reliable foundation for accelerating the fostering and development of NEVs. On this basis, the goals of relieving energy shortage and environmental pressure, promoting sustainable development, and realizing transformation and upgrading of automobile industry can be finally realized, thus enhancing international competitiveness of China [3].
Based on Wind database, we demonstrate quarterly data for the sales volume of NEVs during 2013–2017 (Figure 1). As shown in the figure, the sales volume of NEVs in recent two years has shown a rapid increase with a large quarterly fluctuation, while the sales volume during the fourth quarter is significantly higher than the first three quarters. This is mainly because people are likely to purchase goods in the end of current year while restrict the expense in the beginning of New Year. Generally, the sales volume of NEVs is affected by multiple factors including income level of people, market supply and demand and industrial policies and, therefore, can be seen as a grey system. Meanwhile, as NEVs has developed in a fast way since 2009, there is only small-sized sample, which is unable to be effectively predicted by the typical econometric method based on large-sized sample. The traditional regression model is suitable for large sample, small-volume data modeling. When the data follows the atypical distribution or the relevant factors are not considered enough, the error of fitted regression value and actual value tends to have large prediction errors. This research conducts predication using grey system theory characterized with small-sized sample data and poor information [4], while considering the quarterly difference of NEVs’ sales volume. Based on an idea of introducing data grouping approach, a nonlinear grey Bernoulli model (DGA-based NGBM (1,1)) is built. Moreover, the background values and power exponents of the model are optimized to improve the predicating accuracy so as to precisely forecast the sales volume of NEVs.

1.2. Literature Review of the NEV Market

The NEV market in China has been emerged since the initiation of The China National “863” Program for the Key Projects of Electric Vehicles in 2010, and gradually developed based on the Pilot Popularization and Application Project of Thousands of Vehicles with Energy Saving and New Energy released in 2009. More research attentions have been arisen from the NEVs market. The present research mainly focuses on the analysis of policy on the NEVs market [5,6], subsidies for purchasing NEVs [7,8], and purchase attention of NEV consumers [9,10].
However, little research on the predication of NEVs market has been made due to poor data, and existing studies primarily adopt the methods based on time series or causality, such as the grey system theory-based modeling method and a Bass diffusion model. Zeng et al. [11] predicted the NEVs ownership using the Bass model. The results show that China’s NEVs will witness a fast growth within ten years. Zeng et al. [12] proposed the NGM (1,1) to improve the structure defect of the GM (1, N) by introducing a linear correction item and a grey action quantity, and used the model to forecast the amount of Beijing’s motor vehicles. The findings confirm the effectiveness of the structure improvement. Xu and Zhao [13] employed an equal dimension gray recurrence model to predict the patent application quantity in the NEV industry in the 13th Five-Year-Plan period. Results indicate that: the patent application quantity of China’s NEVs industry during the 13th Five-Year Plan period will be expected to present a great increase, which showing that NEVs industry within five years will be remarkably developed.

1.3. The Development of Grey Theory Model

Deng [14] built the grey system theory-GM (1,1) which has been a typical forecasting model, and widely used in energy [15,16]. A large number of scholars have carried out further research on GM (1,1) model in recent years [17,18]. Chen et al. [19] believe that the traditional GM (1,1) model is not flexible, and is merely applicable to linear time series analysis featuring with approximate power exponential growth and attenuation. By combining Bernoulli differential equation and grey modeling principle, they put forwards a nonlinear grey Bernoulli model (NGBM (1,1)). The power exponents of this model can applicable to different development series with and hence can overcome the limits that grey models are merely applicable to power exponential growth. Therefore, the model is also called as GM (1,1) power exponential model [20]. Furthermore, Chen [21] performed an empirical comparison between NGBM (1,1) and traditional GM (1,1) model on the basis of unemployment rates from ten countries. Their results indicate that the NGBM (1,1) established can effectively promote the predicating accuracy. Tsai et al. [22] used traditional grey model GM (1,1), NGBM (1,1) and grey Verhulst model to forecast the increasing consumption trend of renewable sources. Additionally, they compared the result with typical linear regression model to confirm the accuracy and applicability of the NGBM (1,1) model.
In 2010, Chen et al. [23] established a Nash NGBM (1,1) model by introducing a Nash equilibrium idea into the NGBM (1,1) model. The optimal solution can be obtained by determining background values and power exponents of the Nash NGBM (1,1) model via an iterative process in a computer system, which elevates the applicability of NGBM (1,1). The solution to the unknown parameters is the key to examine whether NGBM (1,1) can be used to solve different actual problems. For the solution of power exponents, Wang et al. [24] demonstrated a whitening differential formula for solving power exponents of NGBM (1,1) model based on the information coverage principle of grey system and discusses the influences of varying value range for power exponents on the performance of model solution. Afterwards, they proposed NGBM (1,1) model and the parametric optimization methods to offset the deviation of NGBM (1,1) [25]. Pao et al. [26] put forward a NGBM-OP model to solve the power exponents of the NGBM (1,1) by using numerical iteration, the predication capability of the model performs better than that of traditional GM (1,1) and ARIMA. Shaikh et al. [27] use the Levenberge Marquardt (LM) optimization principle to estimate the model parameters of the NGBM (1,1), and then carried out empirical comparison with regression models, traditional GM (1,1) and grey Verhulst models, the comparison indicates that NGBM (1,1) exhibits most favorable predicating accuracy. Hsin et al. [28] built two-stage NGBM (1,1) model by iterative calculation of the two parameters (p and n) of the NGBM (1,1) model, which was used to predict the GDP of Taiwan. The model improves the forecasting precision of the model. Wang et al. [29] proposed the calculation equations of parameters a and b for NGBM (1,1), and obtained the value range of four unknown parameters (a,b,p,n) within NGBM (1,1), the NGBM (1,1) can determine the prediction accuracy of the model. Their results reveal that the optimization model established can greatly improve the prediction accuracy through calculating unknown parameters [30].
Additionally, intelligent algorithms, such as the particle swarm optimization (PSO) algorithm [31,32,33] and genetic algorithms [34], have been extensively applied in the optimization of parameters of NGBM (1,1) in recent years, and significantly increase the predicating precession. Generally, the aforementioned analysis can improve the prediction precision of common time series, however, the NGBM (1,1) model applicable to the forecast of time series data based on quarterly fluctuation warrants further research. In this research, on the basis of quarterly fluctuation features of the sales volume for the NEVs in China, a data grouping approach is introduced into NGBM (1,1) model to build a DGA-based NGBM (1,1). Furthermore, PSO algorithm is adopted to optimize the background values and power exponents of the model proposed, so as to both simultaneously forecast sale tendency and effectively identify the quarterly fluctuation features for China’s NEVs.

1.4. Contribution and Organization

The contributions of this paper include the following two aspects:
(1)
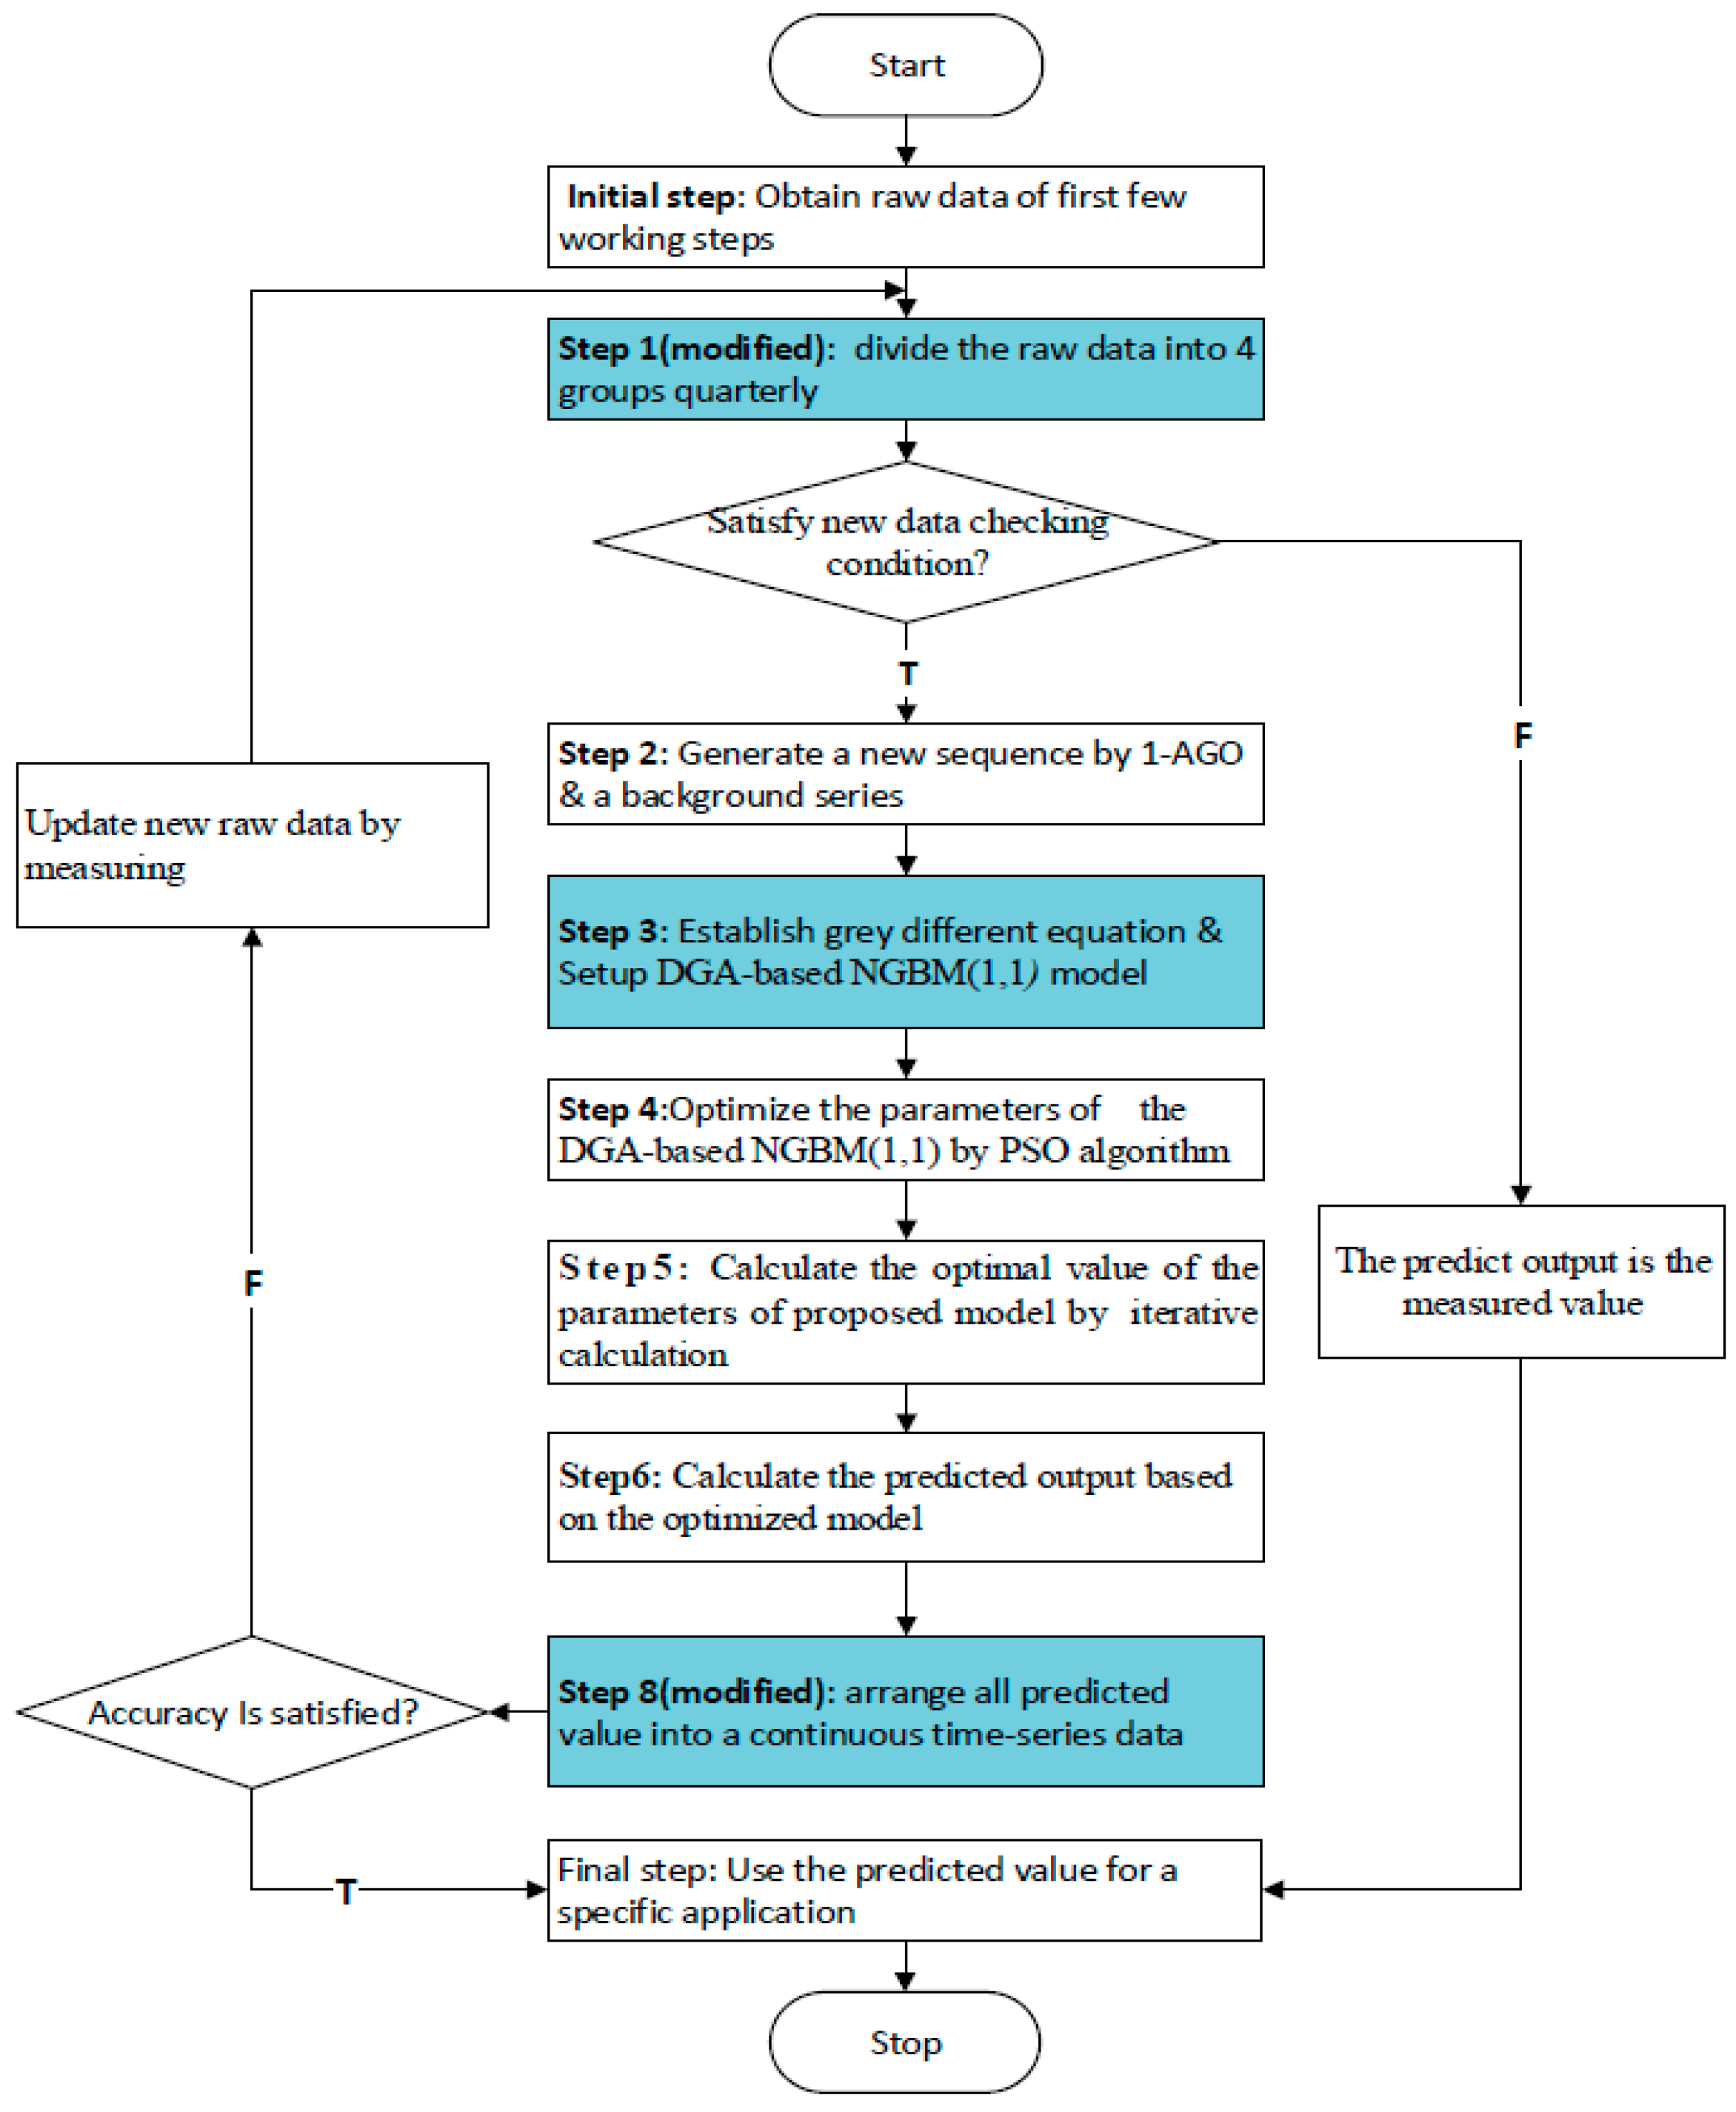
This paper proposed a data grouping approach-based nonlinear grey Bernoulli model (DGA-based NGBM (1,1)) which can effectively predict the quarterly fluctuations of quarterly sales of the new energy vehicle industry in China.
(2)
The parameters of the DGA-based NGBM (1,1) model are optimized by PSO algorithm to improve the prediction accuracy of the model.
The rest of this research is organized as follows: Section 2 illustrates the establishment of data grouping approach-based nonlinear grey Bernoulli model (DGA-based NGBM (1,1)) and DGA-based NGBM (1,1) based on the PSO algorithm. In Section 3, data grouping approach-based GM (1,1) model (DGA-based GM (1,1)), and DGA-based NGBM (1,1) are employed to carry out empirical analysis on the sales volume of China’s NEVs and perform short-term out-of-sample forecasting. Section 4 concludes this work.

2. Methodology

2.1. Data Grouping Approach-Based Nonlinear Grey Bernoulli Model

Grey system theory is seen as an important approach for processing small sized sample discrete sets [35]. Its main idea is to adequately utilize and develop the limited information of raw data. The weakly dependent stochastic sequences are conducting IAGO on raw data to further seek the change law underlying the grey system. Traditional GM (1,1) can be applied in the stationary sequence of power exponential growth, while it is inapplicable to time series with quarterly fluctuation. Wang et al. [36] introduced a data grouping approach into GM (1,1) model to establish a DGA-based GM (1,1) model, it can effectively identify the quarterly fluctuation of linear data series, however, it is unable to forecast the nonlinear tendency of data series. As actual quarterly time series usually contain nonlinear fluctuation features, in order to improve the applicability of GM (1,1) model to nonlinear model, Ma et al. [37] introduced the kernel method into the model to build nonlinear grey model and proved the kernel method can effectively deal with complicated nonlinear time series [38]. The nonlinear grey Bernoulli model exhibits preferable forecasting capability on nonlinear time series data, however, it fails to identify the quarterly fluctuation in time series data. Thus, this research proposes the use of a data grouping approach into NGBM (1,1) model, to further build DGA-based NGBM (1,1). The aim is to identify the quarterly and nonlinear tendency of the time series data for the sales volume of China’s NEVs. The modeling process is described as:
Firstly, the time series data featuring quarterly fluctuation are divided into four groups according to different seasons:
x ( 0 ) ( m ) = ( x ( 0 ) ( m , 1 ) , x ( 0 ) ( m , 2 ) , , x ( 0 ) ( m , n ) ) , m = 1 , 2 , 3 , 4
Then, through accumulated generating operation (AGO) of grouped series, a series after one accumulation x ( 1 ) ( m ) ( 1 A G O ) is generated:
x ( 1 ) ( m ) = ( x ( 1 ) ( m , 1 ) , x ( 1 ) ( m , 2 ) , , x ( 1 ) ( m , n ) ) = ( x ( 1 ) ( m , 1 ) , x ( 1 ) ( m , 1 ) + x ( 0 ) ( m , 2 ) , , x ( 1 ) ( m , n 1 ) + x ( 0 ) ( m , n ) )
where x ( 1 ) ( m , k ) = i = 1 k x ( 0 ) ( m , i ) , k = 1 , 2 , , n ; m = 1 , 2 , 3 , 4 , and the background values of the model are written as:
z ( 1 ) ( m , k ) = ρ x ( 1 ) ( m , k ) + ( 1 ρ ) x ( 1 ) ( m , k 1 )
where ρ [ 0 , 1 ] , the equation of grey differential is expressed as:
x ( 0 ) ( m , k ) + a z ( 1 ) ( m , k ) = b ( z ( 1 ) ( m , k ) ) γ
while the corresponding whitening differential equation is:
d x ( 1 ) ( m , t ) d t + a x ( 1 ) ( m , t ) = b ( x ( 1 ) ( m , t ) ) γ
Using the least square method, the least square estimate a ^ , b ^ of a and b is calculated as:
[ a ^ b ^ ] = ( B T B ) 1 B T Y
where B = [ z ( 1 ) ( m , 2 ) ( z ( 1 ) ( m , 2 ) ) γ z ( 1 ) ( m , 3 ) ( z ( 1 ) ( m , 3 ) ) γ z ( 1 ) ( m , n ) ( z ( 1 ) ( m , n ) ) γ ]       Y = [ x ( 0 ) ( m , 2 ) x ( 0 ) ( m , 3 ) x ( 0 ) ( m , n ) ]
By taking an initial value as x ^ ( 0 ) ( m , 1 ) = x ( 0 ) ( m , 1 ) , the time response of DGA-based NGBM (1,1) is expressed as:
x ^ ( 1 ) ( m , k ) = { b a + [ x ( 0 ) ( m , 1 ) 1 γ b a ] e a ( 1 γ ) ( k 1 ) } 1 1 γ
Through restoration processing, the predicted value of original data series x ^ ( 0 ) ( m , k ) is achieved:
x ^ ( 0 ) ( m , k ) = x ^ ( 1 ) ( m , k ) x ^ ( 1 ) ( m , k 1 ) , k = 2 , 3 , , n
Consequently, based on the precision of the predicted value, the predicted values of the four seasons are summarized into a consecutive time series as:
x ^ ( 0 ) ( m , k ) = ( x ^ ( 0 ) ( 1 , 1 ) , x ^ ( 0 ) ( 2 , 1 ) , x ^ ( 0 ) ( 3 , 1 ) , x ^ ( 0 ) ( 4 , 1 ) , , x ^ ( 0 ) ( 1 , n ) , x ^ ( 0 ) ( 2 , n ) , x ^ ( 0 ) ( 3 , n ) , x ^ ( 0 ) ( 4 , n ) )

2.2. Parameters Optimization in the DGA-Based NGBM (1,1)

The method of determining the value of power exponents can decide the adaptability of NGBM (1,1) in varying time series. In this work, the PSO algorithm is used to construct the DGA-based NGBM (1,1) to solve the optimal background value ρ and power exponent γ by taking the minimum mean absolute percentage error (MAPE) of the predicted values obtained by the NGBM (1,1) and actual values.
The PSO algorithm was proposed by Eberhart and Kennedy in 1995 [39,40]. Due to the advantages including having simple rule, rapid convergence rate, and few tunable parameters, it has been developed extensively. The PSO algorithm usually obtains a global optimal solution by simulating predation behaviors of birds: the location in a fixed place that is randomly searched by a flock of birds is unknown, and the distance between them and the location of the foods is known, those birds search the food by stochastically altering their flight direction and speeds. The best strategy of finding the food is to search the bird which is presently nearest to the location of the food. When using the PSO algorithm, the stochastic solution of each problem to be optimized corresponds to a bird, namely, a “particle”. Each particle has one fitness value which is solved based on the functions optimized. Additionally, particles tend to adjust their flight directions and speeds according to the flight experiences from themselves and peers. The flight experience of one particle is optimal location P b e s t in which the particle searches, namely, the optimal solution of the particle, while the flight experience of the peer for the particle aforementioned is optimal location P b e s t in which all particles passes, namely, global optimal solution. The details are described as follows:
Assume that there are X i = ( X i 1 , X i 2 , , X i D ) particles in a D-dimensional space. The location of the ith partilce is i = 1 , 2 , , c and for i = 1 , 2 , , c , the location of each particle is a potential solution. By substituting X i into target function, the value of fitness function can be calcualted and its superiority and inferiority are judged. The optimal location that the particle experineces is P i = ( p i 1 , p i 2 , , p i D ) , the optimal location of whole particle swarm denotes P g = ( p g 1 , p g 2 , , p g D ) , the speed of particle V i = ( v i 1 , v i 2 , , v i D ) , while the change of speeds and locations are expressed as:
v i + 1 = w v i d + c 1 r 1 ( p i d x i d ) + c 2 r 2 ( p g d x i d )
x i + 1 d = x i d + α v i d
where i = 1 , 2 , , c , d = 1 , 2 , , D ; w is an inertia factor, while c 1 , c 2 are learning factors, c 1 = c 2 = 2 , r 1 , r 2 are varying stachastic numbers in an interval range of and a is constraint factor of controlling the weight of speed.
Stopping conditions of iteration are set according to specific problems: the values of maximum iterative number or the optimal location searched by particle swarm need to satisfy minimum scheduled thresholds.
The above improved modelling process can be expressed by the flow chart shown in Figure 2.

2.3. Model Evaluation Criteria

The root mean square error (RMSE), mean absolute error (MAE), and mean absolute percentage error (MAPE) are used to confirm the reliability of the predicating model proposed. The calculation is demonstrated as:
R M S E = 1 n i = 1 1 e 2 ( i )
M A E = 1 n i = 1 n | e ( i ) |
M A P E = 1 n i = 1 n | e ( i ) x ( 0 ) ( i ) | × 100 %
where e ( i ) = x ( 0 ) ( i ) x ^ ( 0 ) ( i ) , x ( 0 ) ( i ) is actual value, while x ^ ( 0 ) ( i ) is predicted value. The precision levels of predicted values based on MAPE are displayed in Table 1.

3. Empirical Analysis and Discussion

To verify the effectiveness and superiority of DGA-based NGBM (1,1), this research uses the sales volume of China’s NEVs during 2013–2017 as raw data to conduct an empirical analysis: based on raw data, DGA-based GM (1,1) model and DGA-based NGBM (1,1) model based on PSO algorithm are constructed, respectively, the predicted results of the two models are comparatively analyzed. As the NEVs belong to the emerging industry, they are greatly affected by the policies in the early stage of development. Therefore, the data is assumed to meet the following conditions before analysis: (1) The data collected from the Wind database in this paper is authentic and credible. (2) The sales volume of NEVs is not affected by unexpected policies and still has obvious quarterly characteristics. According to the “13th Five-Year Strategic Development Plan”, the sales volume of NEVs will increase to 2 million in 2020, and the actual quarterly sales volume of NEVs during 2013–2017, we assume that: (1) The sales volume of NEVs will continue to grow, and the annual sales volume will be close to 2 million in 2020. (2) The sales volume of NEVs still has significant quarterly fluctuation characteristics, and the sales volume in the fourth quarter is the highest.

3.1. The Construction of the Two Models

3.1.1. DGA-Based GM (1,1)

DGA-based GM (1,1) model is established on the basis of raw data refer to the paper written by Wang et al. [36], four groups of modeling parameters are presented as follows:
α ^ 1 = [ a ^ 1 b ^ 1 ] T = [ 0.40981 14507.66 ]
α ^ 2 = [ a ^ 2 b ^ 2 ] T = [ 0 .52241 23969.42 ]
α ^ 3 = [ a ^ 3 b ^ 3 ] T = [ 0.60655 22292.56 ]
α ^ 4 = [ a ^ 4 b ^ 4 ] T = [ 0.49005 64764.5 ]
The initial values x ^ ( 0 ) ( m , 1 ) = x ( 0 ) ( m , 1 ) are set, the corresponding time responses are obtained as follows:
x ^ 1 ( 1 ) ( k ) = 38575.97 × e 0.40981 ( k 1 ) 35401
x ^ 2 ( 1 ) ( k ) = 48596.27 × e 0.52241 ( k 1 ) 45882.3
x ^ 3 ( 1 ) ( k ) = 40907.28 × e 0.60655 ( k 1 ) 36753.3
x ^ 4 ( 1 ) ( k ) = 139756 × e 0.49005 ( k 1 ) 132158
The predicted values of DGA-based GM (1,1) are compared with actual values and are shown in Table 3.

3.1.2. DGA-Based NGBM (1,1)

The steps for the optimizing background value ρ and power exponent γ of the DGA-based NGBM (1,1) using the PSO algorithm are presented as follows:
Step 1: Initializing c = 20 particles: to avoid missing the optimal solution resulting from fast learning speed, a small learning factor c 1 = c 2 = 1.75 is set. Meanwhile, inertia weight w = 0.75 is set based on the research of Shi and Eberhar [42]. The maximum iterative number is T max = 1000 when the process is finished. As two parameters ρ and γ need to be solved, two dimensions for particles are set. The location and speed of initial particles within particle swarm are initialized as:
λ i = ( ρ i , γ i ) , V i = ( v i 1 , v i 2 ) , i = 1 , 2 , , c ,
Step 2: Target functions are used to calculate the fitness value of each particle. In this work, the minimum MAPE is used as target function and presented as
M A P E = M i n ( F ( i ) ) = 1 n i = 1 n | x ( 0 ) ( i ) x ^ ( 0 ) ( i ) x ( 0 ) ( i ) | × 100 %
Step 3: The parameters of λ i = ( ρ i , γ i ) are substituted into Equations (2) and (6), to further obtain x ^ ( 1 ) ( k ) . The predicted value of x ^ ( 0 ) ( k ) is obtained based Equation (7). Consequently, Equation (13) is adopted to calculate the fitness value of each particle. The fitness value of each particle is compared with that of fitness of value optimal location P b e s t and global optimal location g b e s t , if f ( λ i ) < f ( p b e s t ) , f ( λ i ) = p b e s t , and if f ( λ i ) < f ( g b e s t ) , then f ( λ i ) = g b e s t .
Step 4: Optimizing speed and location: The speed and location of particles are altered based on Equations (8) and (9), and the speed is controlled within V max .
Step 5: Stopping criterion: the maximum interactive number T max is set to1000. If the number is smaller than 1000, the process goes back to above step 2.
MATLAB 2016a (MATLAB was developed by The MathWorks, a software development company based in Natick, MA, USA.) is used for solution in the calculation process. The four groups of parameters obtained are listed in Table 2.
The comparison between predicted value of DGA-based NGBM (1,1) and actual value is shown in Table 3.

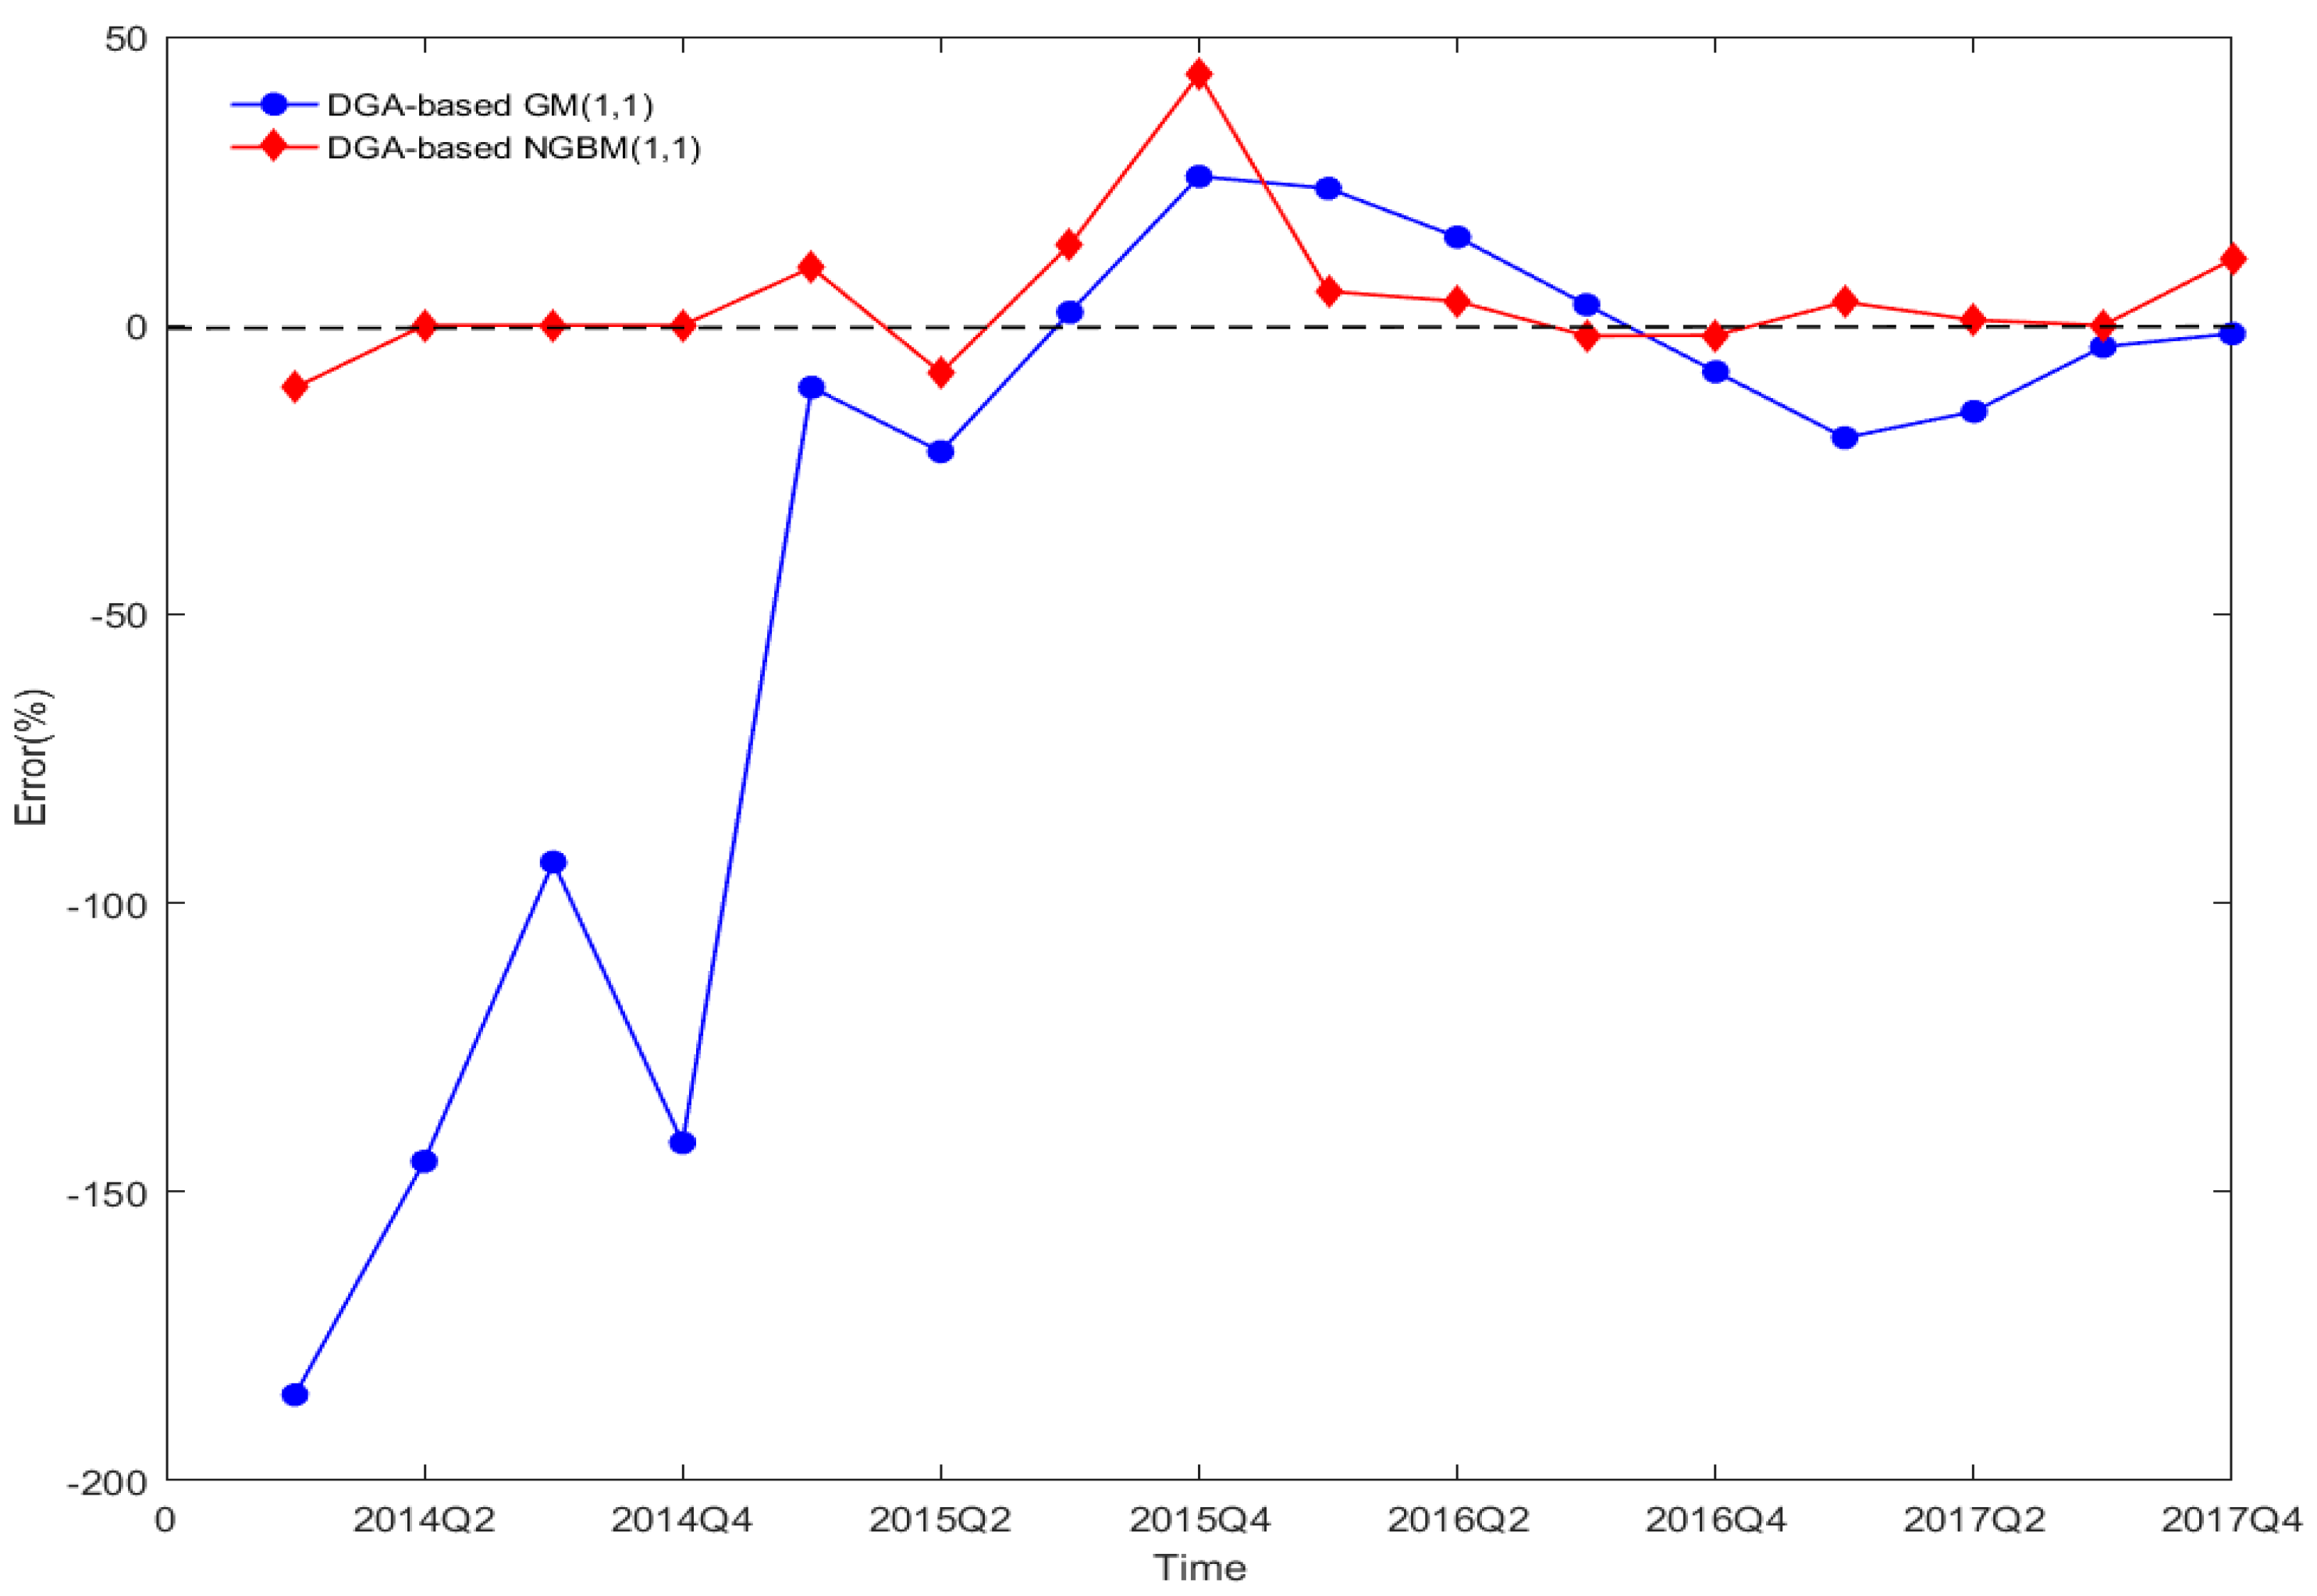
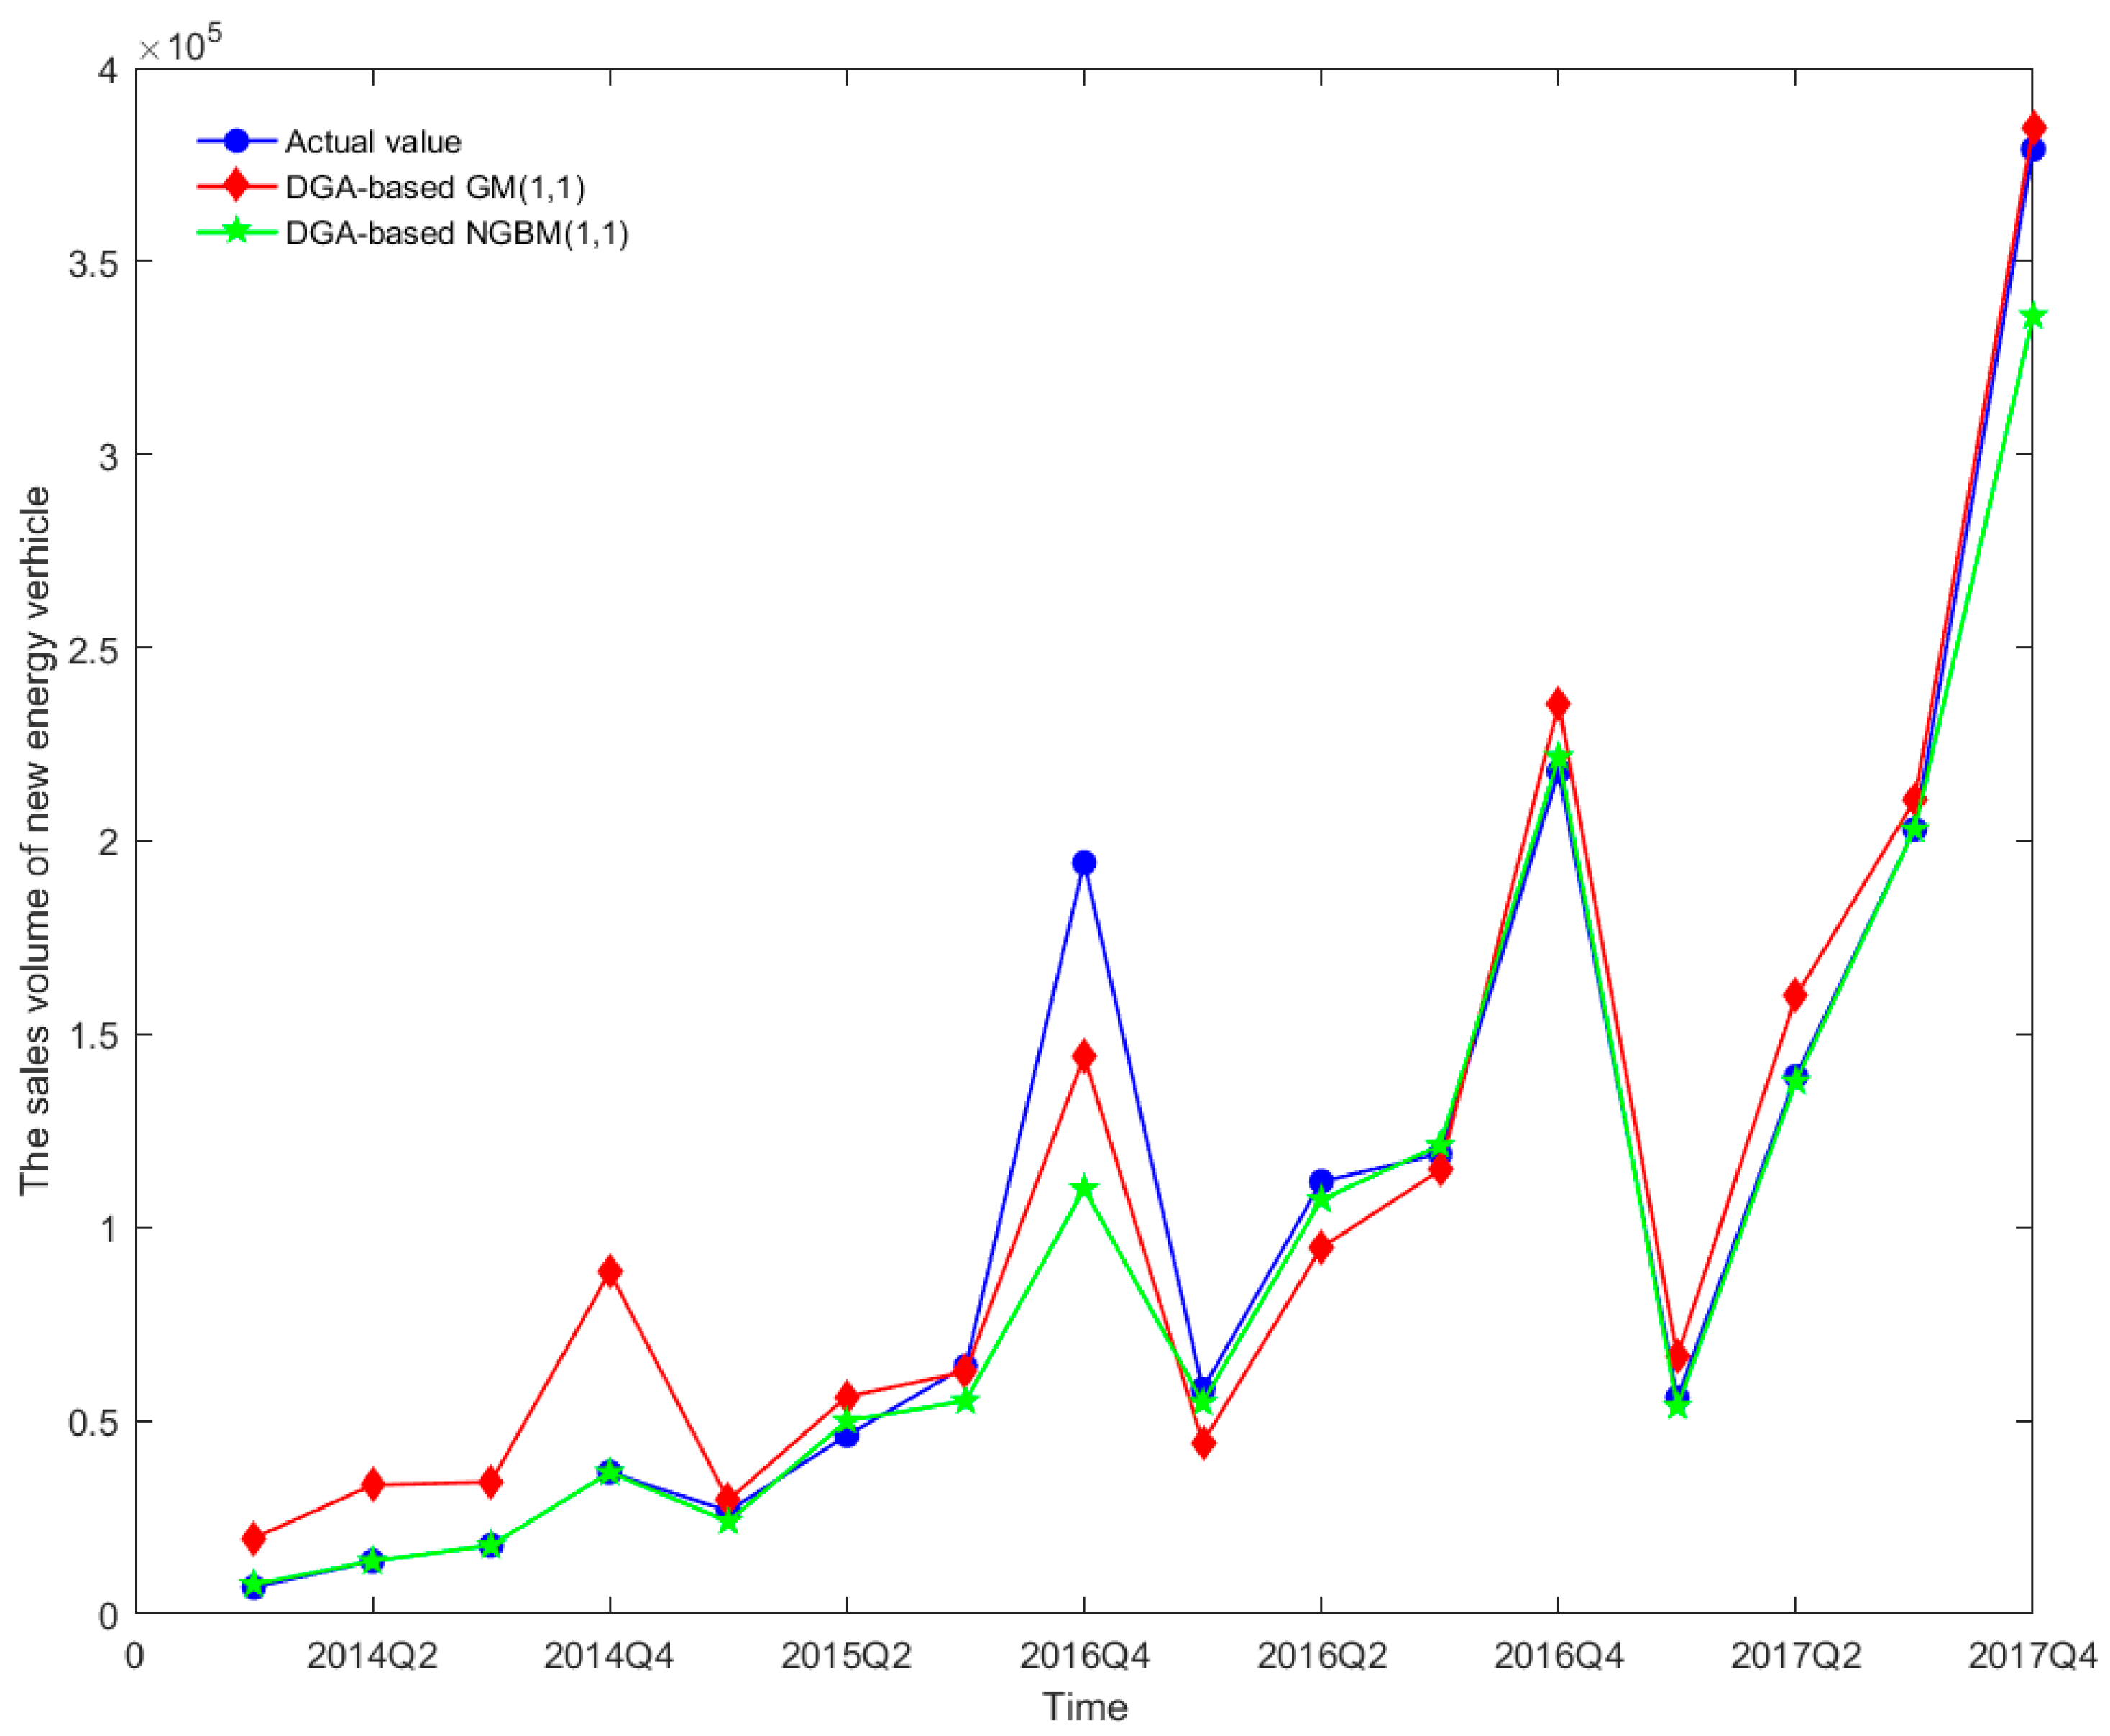
3.2. The Comparison between DGA-Based GM (1,1) and DGA-Based NGBM (1,1)

In order to compare the forecasting precision of the two models, the predicted values of DGA-based GM (1,1), DGA-based NGBM (1,1), and the actual values are summarized in Table 3. Moreover, the errors of the predicted values for the two models and actual values are shown in Figure 3 and Figure 4 to demonstrate the comparison results. Table 3 reveals that the maximum errors of DGA-based GM (1,1) and DGA-based NGBM (1,1) are 185.13% and 43.42%, respectively, while the minimum errors are 1.44% and 0%. The comparison indicates that the DGA-based NGBM (1,1) performs better when fitting the original time series, with a predicting precision higher than DGA-based GM (1,1). With an aim to conduct further comparisons for the two models, their indices—RMSE, MAE, and MAPE—are used for judgment. The calculation results are illustrated in Table 4. As can be seen from the table, MAE and MAPE of DGA-based GM (1,1) are greatly higher than that of DGA-based NGBM (1,1). The MAPEs for the two models are 44.69% and 7.26%. According to Table 1, it is inferred that the forecasting precision of DGA-based GM (1,1) can be sorted at a reasonable forecasting level, while DGA-based NGBM (1,1) has lived up to the high forecasting level. Such results show that DGA-based GM (1,1) cannot perform well when forecasting the sales volume of China’s NEVs. DGA-based NGBM (1,1) can promote the forecasting precision of the mode as it can use PSO to flexibly set value range of exponents which further make it fit different time series. The predicted results are, therefore, of actual reference significance.

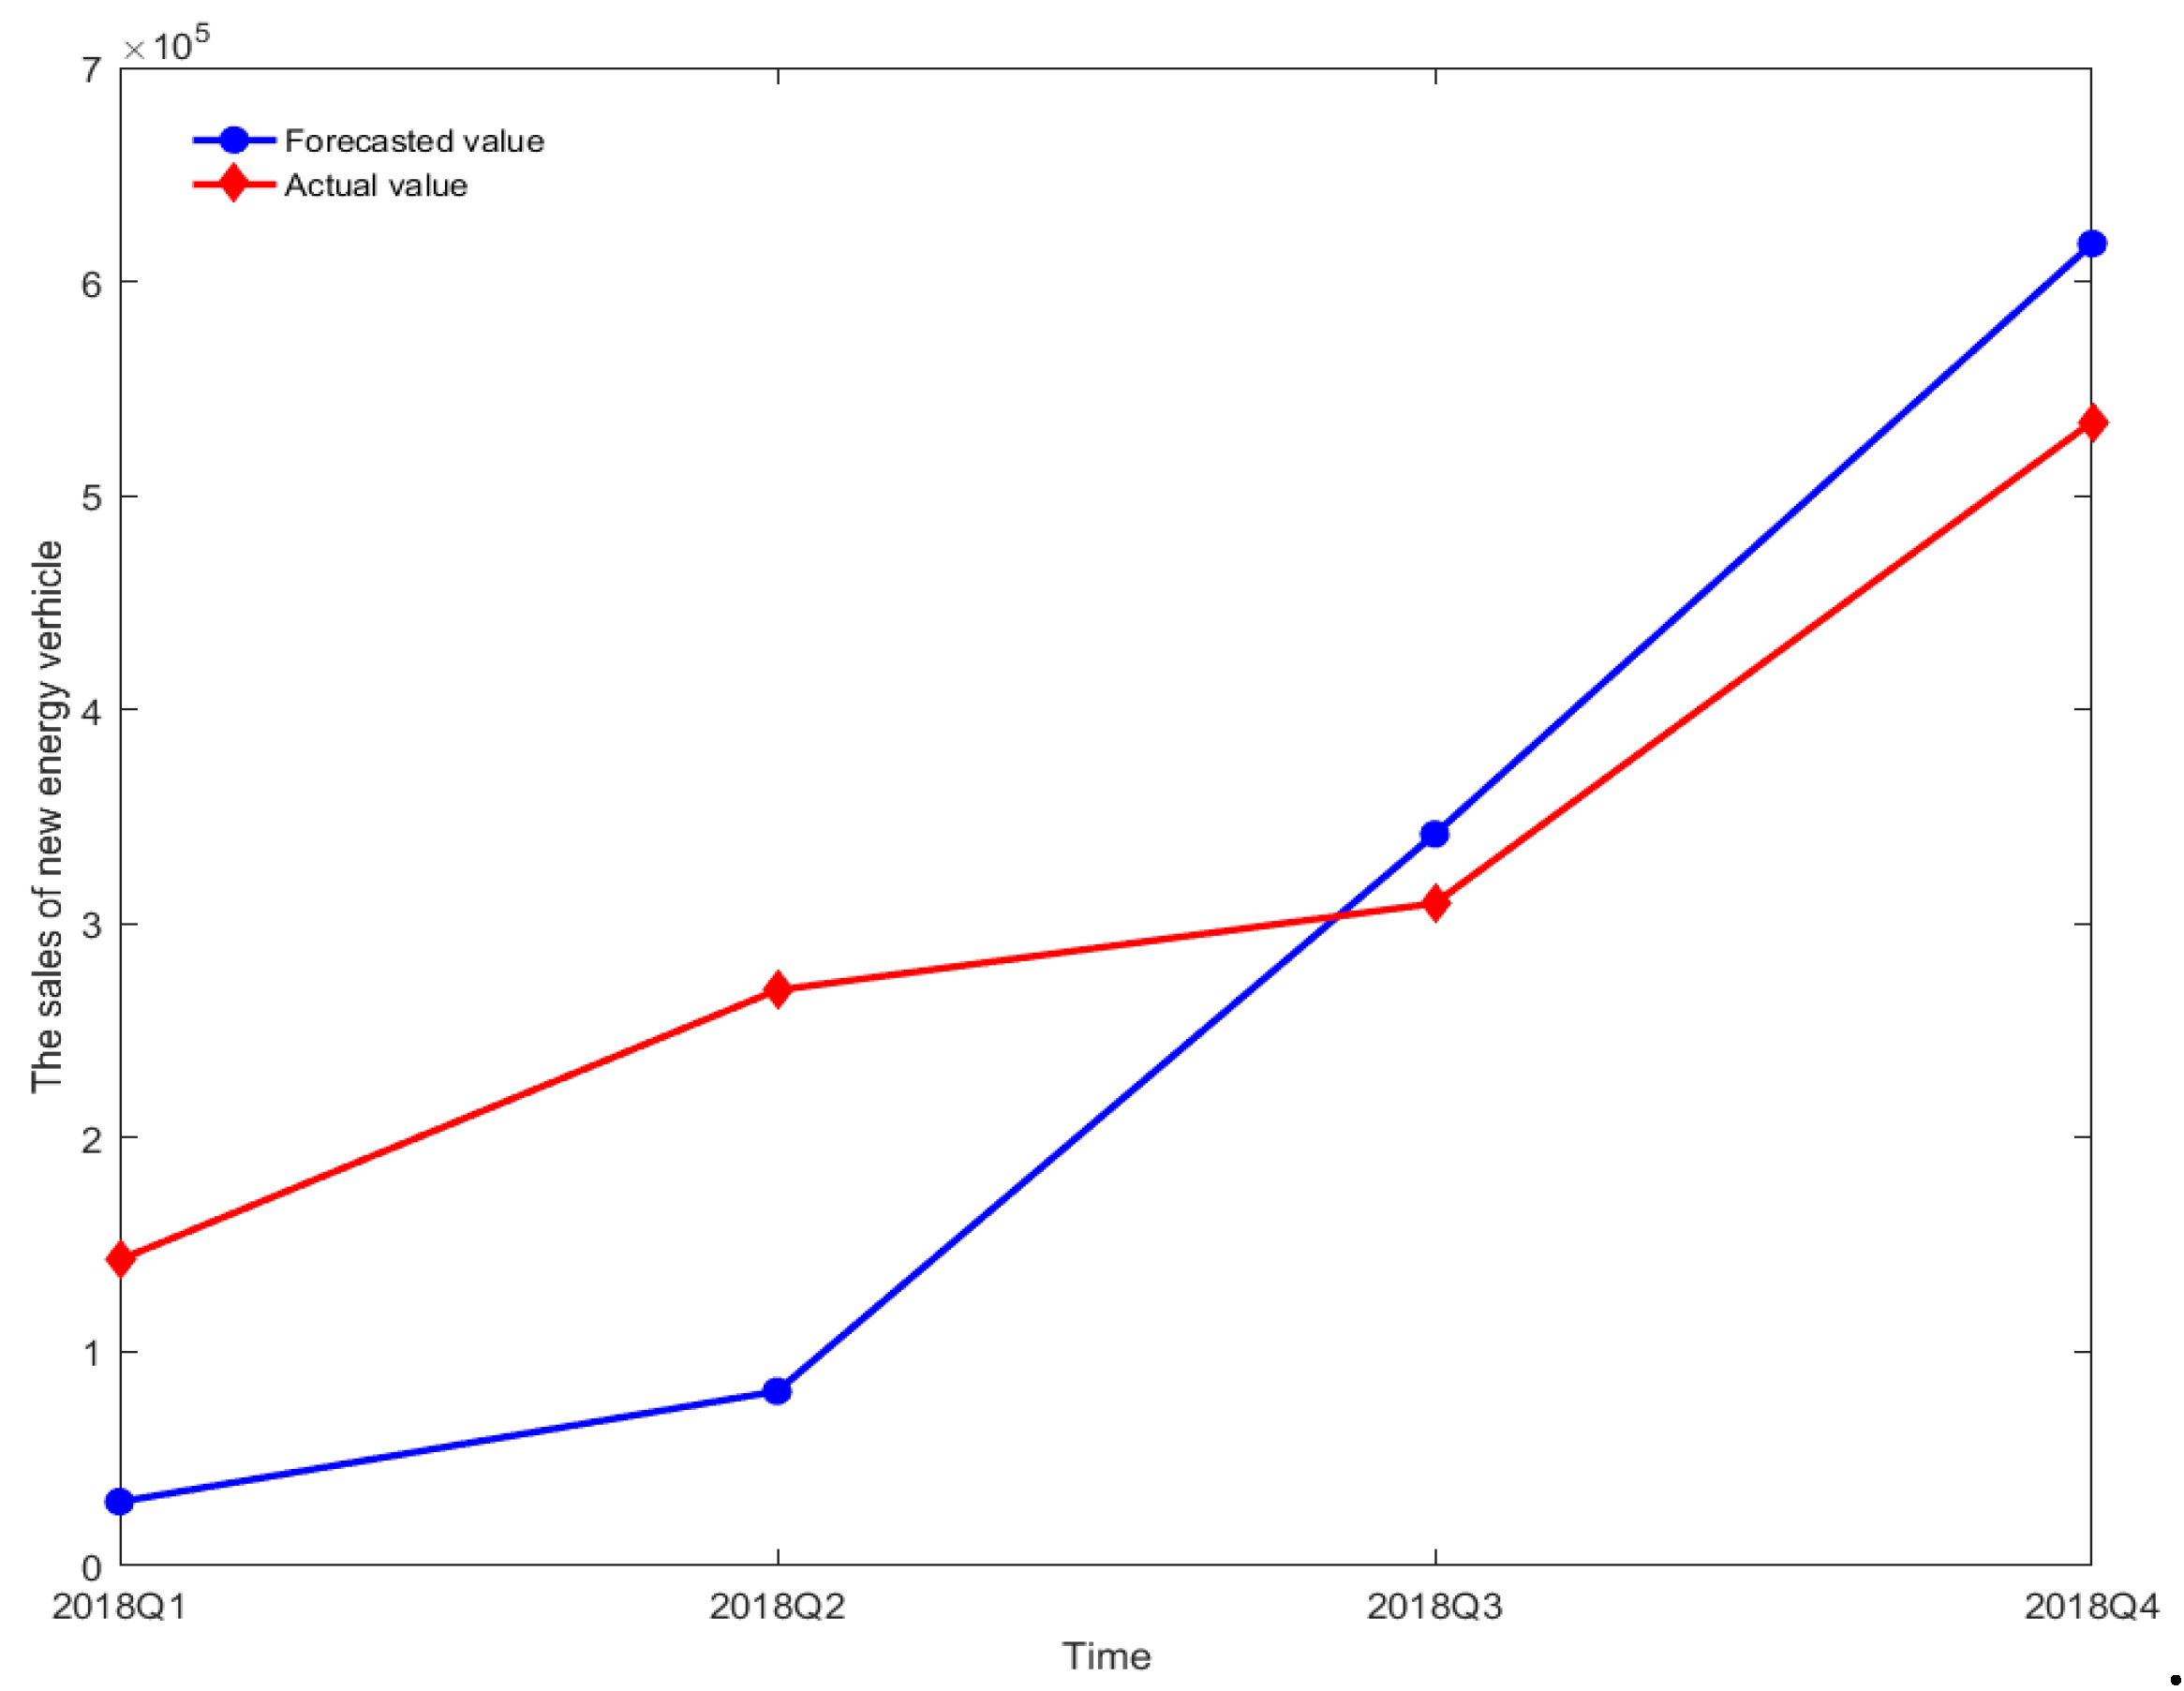
3.3. Out-of-Sample Forecasting and Discussion

Based on the comparisons of aforementioned models, DGA-based NGBM (1,1) performs better than DGA-based GM (1,1) when predicting the sales volume of China’s NEVs. Therefore, in this research, DGA-based NGBM (1,1) is used to conduct out-of-sample forecasting on the sales volumes of China’s NEVs during in 2018. In Section 4 of this research, the PSO algorithm is employed to optimize the parameters of DGA-based NGBM (1,1) by taking the minimum MAPE of all predicted sample data as target functions. To make the sample data have more reference significance, new information is given first priority when setting target functions: minimum MAPE of the predicted values within the past three years are used as target functions. By doing so, the large error of the predicted out-of-sample data resulting from overfitting of early data can be avoided in the optimization process. Based on the modified target functions, four groups of optimized parameters modified can be obtained, as shown in Table 5. The out-of-sample values predicted in 2018 are finally acquired, as displayed in Table 6 and shown in Figure 5.
Lu et al. [43] proposed the accuracy and error test of grey model in 1998. When the relative error between the actual value and the predicted value is 0–5% and 5–20%, the prediction accuracy is excellent, respectively. As shown in Table 6, the prediction error of the DGA-based NGBM (1,1) model for the third and fourth quarters of 2018 is 10.46% and 15.56%, respectively, with a high prediction accuracy, while the prediction accuracy of the first and second quarters is poor. This can be explained by the unexpected policy was released in February 2018. The Ministry of Finance and the Ministry of Industry and Information Technology jointly issued the "Notice on Adjusting and Improving the Financial Subsidy Policy for the Promotion and Application of New Energy Vehicles". The subsidy standard for 2018 is divided into three phases. The subsidy will be based on the standard of subsidy in 2017 during 1 January to 11 February, there is a transition period from 12 February to 11 June, the subsidy standard for new energy passenger cars and buses is 0.7 times that of the standard in 2017, while the new energy trucks and special vehicles is 0.4 times. The new subsidy standard will be implemented after June 12 in 2018. The sales volume of NEVs in the first and second quarters of 2018 increased by 155.68% and 93.423%, respectively, compared with 2017 because of the adjusted subsidy standard. This research uses the Pauta criterion to judge the abnormality of data [44], and the results show that the data in the first and second quarters of 2018 are outliers. This is inconsistent with the assumptions of the data in this paper, which leads to poor prediction accuracy. To further verify the applicability of the DGA-based NGBM (1,1) model to quarterly data, this paper updates the dataset with quarterly data for 2014–2018 again, which including the outliers in 2018 to forecast the sales volume of NEVs from 2019–2020. The value of MAPE is 6.03%, The MAPE value of fitting result of DGA-based NGBM (1,1) model is 6.03%, which is a high-level prediction accuracy. The predicted values for 2019–2010 are shown in the table, which belongs to the high prediction accuracy, the predicted values for 2019-2010 are shown in the Table 7.
As shown in Table 7, the sales volume of NEVs in China still maintains a quarterly fluctuation from 2019 to 2020, with the highest sales volume in the fourth quarter and the lowest in the first quarter. The growth rate in the first quarter is the largest, and the third quarter is the lowest. The growth rate of the total annual sales volume has remained at 57%. In 2020, the annual sales volume reached 3,115,062, which more than 2 million. To achieve this goal in 2020, compound annual growth rate must reach 41.4% [45]. According to the predicted results of this paper, if the government continues to issue policies to stimulate the consumption of NEVs, the annual growth rate reaches more than 50%, and the annual sales volume will reach 2 million before 2020. The development of the NEVs includes the growth of sales volume, but is not limited to the sales volume. The data from China Electric Vehicle Charging Infrastructure Promotion Alliance indicates that 266,231 public charging piles have been installed [46]. However, there are 1.8 million NEVs at least, on average every six car is equipped with a public charging pile, it leads to the problem of insufficient supply of charging piles. In addition, the "Interim Measures for the Management of Recycling and Utilization of Power Battery for New Energy Vehicles" was officially implemented on 1 August 2018, the government has not yet completed a complete system for the recycling and harmless disposal of NEVs. The sales volume of NEVs is increasing, the problems of the after-sales, emergency support need to be solved urgently. The government should pay more attention to the infrastructure construction of the NEVs, and create a favorable environment for the development of it.

4. Conclusions

Aiming at the quarterly fluctuation features of the sales volume of the NEVs in China, this work introduces a data grouping approach into a NGBM (1,1) model to build a DGA-based NGBM (1,1). By conducting empirical comparison between the DGA-based NGBM (1,1) and existing DGA-based GM (1,1), When the time series has nonlinear characteristics of quarterly fluctuation, data grouping approach can effectively identify the quarterly difference, it can improve the fitting accuracy, at the same time, the PSO algorithm optimizes the power exponent and background value of the DGA-based NGBM (1,1) model, which can flexibly fit the nonlinear trend of data, so the DGA-based NGBM (1,1) is able to reduce the predicating error triggered by quarterly fluctuation of sales volume of the NEVs, showing high predicating performance. The predicting results of out-of-samples using the model proposed show that the sales volume of NEVs in China will increase by 57%, with an apparent quarterly fluctuation in 2019–2020. However, the predicted results are more than the goals of the 13th Five-Year Plan for the national development of strategic emerging industries. Hence, China is suggested to further improve the infrastructure of the NEVs market and create a favorable environment to promote the development of the NEVs market. and relieve the pressure on energy shortage and environmental pollution. China needs to further improve the infrastructure of the NEVs market and create a favorable environment to promote the development of NEVs market.

Author Contributions

Conceptualization, L.-L.P. and Q.L.; methodology, L.-L.P.; software, Q.L.; validation, L.-L.P. and Q.L.; formal analysis, L.-L.P.; investigation, L.-L.P.; resources, L.-L.P.; data curation Q.L.; writing—original draft preparation, L.-L.P. and Q.L.; writing—review and editing, Q.L.; visualization, L.-L.P.; supervision, Q.L.; project administration, L.-L.P.

Funding

This research was funded by National Natural Science Foundation of China grant number [71801190; 71571157].

Acknowledgments

The authors are grateful to the editors and the anonymous reviewers for their insightful comments and suggestions. This research is supported by the National Natural Science Foundation of China (Grant No. 71801190; 71571157).

Conflicts of Interest

The authors declare no conflict of interest.

References

  1. Yao, M.; Liu, H.; Xuan, F. The development of low-carbon vehicles in China. Energy Policy 2011, 39, 5457–5464. [Google Scholar] [CrossRef]
  2. China Association of Automobile Manufacturers. Available online: http://www.caam.org.cn/qiyexinwen /20171011/1005212242.html (accessed on 8 June 2018).
  3. Fang, X.F. The Development Planning of Energy Saving and New Energy Automobile Industry. Chin. Automob. Ind. 2012, 7, 10–14. [Google Scholar]
  4. Deng, J.L. Introduction of grey system. J. Grey Syst. 1989, 1, 1–24. [Google Scholar]
  5. Zhang, L.; Liu, Y. Analysis of New Energy Vehicles Industry Policy in China’s Cities from the Perspective of Policy instruments. Energy Procedia 2016, 104, 437–442. [Google Scholar] [CrossRef]
  6. Zhang, X.; Bai, X. Incentive policies from 2006 to 2016 and new energy vehicle adoption in 2010–2020 in China. Renew. Sustain. Energy Rev. 2017, 70, 24–43. [Google Scholar] [CrossRef]
  7. Lin, B.; Tan, R. Estimation of the environmental values of electric vehicles in Chinese cities. Energy Policy 2017, 104, 221–229. [Google Scholar] [CrossRef]
  8. Peng, Z. Price-dependent Decision of New Energy Vehicles Considering Subsidies and Backorders. Energy Procedia 2017, 105, 2065–2070. [Google Scholar] [CrossRef]
  9. Wang, Z.; Zhao, C.; Yin, J.; Zhang, B. Purchasing intentions of Chinese citizens on new energy vehicles: How should one respond to current preferential policy? J. Clean. Prod. 2017, 161, 1000–1010. [Google Scholar] [CrossRef]
  10. Lin, B.; Tan, R. Are people willing to pay more for new energy bus fares? Energy 2017, 130, 365–372. [Google Scholar] [CrossRef]
  11. Zeng, M.; Zeng, F.X.; Zhu, X.L.; Xue, S. Forecast of electric vehicles in China based on Bass model. Electr. Power 2013, 46, 36–39. [Google Scholar]
  12. Zeng, B.; Luo, C.; Liu, S.F.; Chuan, L. A novel multi-variable grey forecasting model and its application in forecasting the amount of motor vehicles in Beijing. Comput. Ind. Eng. 2016, 101, 479–489. [Google Scholar] [CrossRef]
  13. Xu, S.; Zhao, X. Predication of patent application quantity in NEVs industry in in the 13th Five-Year-Plan period using an equal dimension gray recurrence model. Marketpl. Mod. 2017, 12, 16–17. [Google Scholar]
  14. Deng, J.L. Control problems of grey system. Syst. Control Lett. 1982, 1, 288–294. [Google Scholar]
  15. Jiang, F.; Yang, X.; Li, S.Y. Comparison of Forecasting India’s Energy Demand Using an MGM, ARIMA Model, MGM-ARIMA Model, and BP Neural Network Model. Sustainability 2018, 10, 2225. [Google Scholar] [CrossRef]
  16. Zeng, B.; Zhou, M.; Zhang, J. Forecasting the Energy Consumption of China’s Manufacturing Using a Homologous Grey Prediction Model. Sustainability 2017, 9, 1975. [Google Scholar] [CrossRef]
  17. Xie, N.M.; Liu, S.F. Discrete grey forecasting model and its optimization. Appl. Math. Model. 2009, 33, 1173–1186. [Google Scholar] [CrossRef]
  18. Liu, S.F.; Yang, Y.J.; Xie, N.M.; Forrest, J. New progress of Grey System Theory in the new millennium. Grey Syst. Theory Appl. 2016, 6, 2–31. [Google Scholar] [CrossRef]
  19. Chen, C.I.; Chen, H.L.; Chen, S.P. Forecasting of foreign exchange rates of Taiwan’s major trading partners by novel nonlinear Grey Bernoulli model NGBM (1,1). Commun. Nonlinear Sci. Numer. Simul. 2008, 13, 1194–1204. [Google Scholar] [CrossRef]
  20. Deng, J.L. Grey Control System; Huazhong University of Science and Technology Press: Wuhan, China, 1993. [Google Scholar]
  21. Chen, C.I. Application of the novel nonlinear grey Bernoulli model for forecasting unemployment rate. Chaos Solitons Fractals 2008, 37, 278–287. [Google Scholar] [CrossRef]
  22. Tsai, S.B.; Xue, Y.; Zhang, J.Y.; Chen, Q.; Liu, Y.B.; Zhou, J.; Dong, W.W. Models for forecasting growth trends in renewable energy. Renew. Sustain. Energy Rev. 2016, 77, 1169–1178. [Google Scholar] [CrossRef]
  23. Chen, C.I.; Hsin, P.H.; Wu, C.S. Forecasting Taiwan’s major stock indices by the Nash nonlinear grey Bernoulli model. Expert Syst. Appl. 2010, 37, 7557–7562. [Google Scholar] [CrossRef]
  24. Wang, Z.X.; Zhu, H.T.; Ye, D.J. Increasing Prediction Precision of NGBM (1,1) Based on 1-WAGO and 1-WIAGO Techniques. J. Grey Syst. 2016, 28, 107–120. [Google Scholar]
  25. Wang, Z.X. A Predictive Analysis of Clean Energy Consumption, Economic Growth and Environmental Regulation in China Using an Optimized Grey Dynamic Model. Comput. Econ. 2015, 46, 437–453. [Google Scholar] [CrossRef]
  26. Pao, H.T.; Fu, H.C.; Tseng, C.L. Forecasting of CO2, emissions, energy consumption and economic growth in China using an improved grey model. Energy 2012, 40, 400–409. [Google Scholar] [CrossRef]
  27. Shaikh, F.; Ji, Q.; Shaikh, P.H.; Uqaili, M.A. Forecasting China’s natural gas demand based on optimized nonlinear grey models. Energy 2017, 140, 941–951. [Google Scholar] [CrossRef]
  28. Hsin, P.H.; Chen, C.I. Application of game theory on parameter optimization of the novel two-stage Nash nonlinear grey Bernoulli model. Commun. Nonlinear Sci. Numer. Simul. 2015, 27, 168–174. [Google Scholar] [CrossRef]
  29. Wang, Z.X.; Ye, D.J. Forecasting Chinese carbon emissions from fossil energy consumption using non-linear grey multivariable models. J. Clean. Prod. 2017, 142, 600–612. [Google Scholar] [CrossRef]
  30. Wang, Z.X.; Ye, D.J. A weighted non-linear grey Bernoulli model for forecasting non-linear economic time series with small data sets. Econ. Comput. Econ. Cybern. Stud. Res. 2017, 51, 169–186. [Google Scholar]
  31. Zhou, J.Z.; Fang, R.; Li, Y.; Zhang, Y.C.; Peng, B. Parameter optimization of nonlinear grey Bernoulli model using particle swarm optimization. Appl. Math. Comput. 2009, 207, 292–299. [Google Scholar] [CrossRef]
  32. An, Y.; Zou, Z.H.; Zhao, Y.F. Forecasting of dissolved oxygen in the Guanting reservoir using an optimized NGBM (1,1) model. J. Environ. Sci. 2015, 29, 158–164. [Google Scholar] [CrossRef] [PubMed]
  33. Zhang, L.P.; Zheng, Y.L.; Wang, K.; Zhang, X.L.; Zheng, Y.J. An optimized Nash nonlinear grey Bernoulli model based on particle swarm optimization and its application in prediction for the incidence of Hepatitis B in Xinjiang, China. Comput. Biol. Med. 2014, 49, 67–73. [Google Scholar] [CrossRef] [PubMed]
  34. Hsu, L.C. A genetic algorithm based nonlinear grey Bernoulli model for output forecasting in integrated circuit industry. Expert Syst. Appl. 2010, 37, 4318–4323. [Google Scholar] [CrossRef]
  35. Liu, S.F.; Deng, J.L. Applicative scope of the GM (1,1) model. Syst. Eng. Theory Pract. 2000, 20, 121–124. [Google Scholar]
  36. Wang, Z.X.; Li, Q.; Pei, L.L. Grey forecasting method of quarterly hydropower production in China based on a data grouping approach. Appl. Math. Model. 2017, 51, 302–316. [Google Scholar] [CrossRef]
  37. Ma, X.; Hu, Y.S.; Liu, Z.B. A novel kernel regularized nonhomogeneous grey model and its applications. Commun. Nonlinear Sci. Numer. Simul. 2017, 48, 51–62. [Google Scholar] [CrossRef]
  38. Ma, X.; Liu, Z.B. The kernel-based nonlinear multivariate grey model. Appl. Math. Model. 2017, 56, 217–238. [Google Scholar] [CrossRef]
  39. Eberhart, R.; Kennedy, J. A new optimizer using particle swarm theory. In Proceedings of the International Symposium on MICRO Machine and Human Science, Nagoya, Japan, 4–6 October 2002; IEEE: Piscataway, NJ, USA, 2002; pp. 39–43. [Google Scholar]
  40. Kennedy, J. Eberhart Particle swarm optimization. IEEE International Conference on Neural Networks. Proc. IEEE 1995, 4, 1942–1948. [Google Scholar]
  41. Lewis, C. Industrial and Business Forecasting Methods; Butterworth Scientific: London, UK, 1982. [Google Scholar]
  42. Shi, Y.; Eberhart, R. A modified particle swarm optimizer. Inst. Electr. Electron. 1998, 9, 69–73. [Google Scholar]
  43. Lu, A.L.; Zhang, J.; Zhao, S.M. Accuracy and error test of grey model. J. Huazhong Univ. Sci. Technol. 1998, 26, 41–42. [Google Scholar]
  44. Ye, C.; Wu, C.H.; Zhang, J.Y. Comparison about how to get rid of abnormal data in metrology and measurement. Metrol. Test. Technol. 2007, 34, 26–27. [Google Scholar]
  45. Xiao, L.; Shao, W.; Wang, C.; Zhang, K.; Lu, H.Y. Research and application of a hybrid model based on multi-objective optimization for electrical load forecasting. Appl. Energy 2016, 180, 213–233. [Google Scholar] [CrossRef]
  46. China Electric Vehicle Charging Infrastructure Promotion. Available online: Alliance. http://www.evcipa.org.cn/ (accessed on 23 January 2019).
Figure 1. The quarterly sales volume of the NEVs in China: 2013 Q1–2017 Q4.
Sustainability 11 01247 g001
Figure 2. The prediction process using the proposed DGA-based NGBM (1,1) model.
Sustainability 11 01247 g002
Figure 3. The distributions of forecast values and actual values among models from 2014 to 2017.
Sustainability 11 01247 g003
Figure 4. The errors (%) in the two models used to predict the quarterly sales volume of NEVs from 2014 to 2017 in China.
Sustainability 11 01247 g004
Figure 5. The distributions of forecast values by the adjusted DGA-based NGBM (1,1) in 2018.
Sustainability 11 01247 g005
Table 1. MAPE Criteria for model examination [41].
MAPE (%)Forecasting AbilityMAPE (%)Forecasting Ability
<10High forecasting20–50Reasonable forecasting
10–20Good Forecasting>50Weak forecasting
Table 2. The coefficients of DGA-based NGBM (1,1) for four quarters.
CoefficientsQ1Q2Q3Q4
ρ 0.54970.55570.60410.5499
γ 2.44541.30041.02720.9873
Table 3. Forecasting values and errors of the sales volume of NEVs in the use of two models.
TimeActual ValueDGA-Based GM (1,1)DGA-Based NGBM (1,1)
Model ValueError (%)Model ValueError (%)
2014Q1685319,539.93−185.137592.58−10.79
2014Q213,62433,341.34−144.7313,624.000.00
2014Q317,68634,120.17−92.9217,686.000.00
2014Q436,60088,382.89−141.4836,600.000.00
2015Q126,58129,437.51−10.7523,925.469.99
2015Q246,13056,216.45−21.8749,910.77−8.20
2015Q364,02262,579.312.2555,086.7613.96
2015Q4194,359144,276.6825.77109,959.6243.42
2016Q158,12544,348.5223.7054,709.705.88
2016Q2111,87594,785.9115.28107,230.304.15
2016Q3119,000114,775.813.55121,187.50−1.84
2016Q4218,000235,517.98−8.04221,736.76−1.71
2017Q155,92966,812.42−19.4653,683.734.01
2017Q2139,071159,817.42−14.92137,816.660.90
2017Q3203,000210,508.66−3.70203,000.000.00
2017Q4379,000384,460.74−1.44335,854.0111.38
Table 4. Comparison of the prediction accuracies of the two models (2014Q1–2017Q4).
RMSEMAEMAPE (%)
DGA-based GM (1,1)21741.5416393.5244.69
DGA-based NGBM (1,1)23907.5910071.277.26
Table 5. The coefficients of the modified DGA-based NGBM (1,1) for four quarters.
CoefficientsQ1Q2Q3Q4
ρ 0.47680.63390.49660.4897
γ 1.89571.64470.3946−0.0020
Table 6. Forecasting values of the sales volume of NEVs in 2018 by the modified DGA-based NGBM (1,1).
TimeActual ValueForecasted ValueError (%)
2018Q1143,00029,978.98−79.04
2018Q2269,00081,594.23−69.67
2018Q3309,484341,844.610.46
2018Q4534,516617,674.415.56
Table 7. Forecasting values of the sales of new energy vehicle in 2019–2020 by the DGA-based NGBM (1,1).
TimeForecasted ValueGrowth RateTimeForecasted ValueGrowth Rate
2019Q1259,813.93481.69%2020Q1473,419.51282.21%
2019Q2433,198.62261.04%2020Q2683,816.16557.85%
2019Q3470,656.11852.08%2020Q3702,788.73249.32%
2019Q4816,162.57452.69%2020Q41,255,038.5253.77%
All1,979,831.2557.63% 3,115,062.9357.34%

