Efficiency versus Fairness in the Management of Public Housing Assets in Palermo (Italy)


Abstract
:1. Introduction
- -
- measuring the differential between the estimated prices and the ‘political prices’ that are fixed by the municipality according to the current laws, then assuming the ratio between the political and the estimated prices as an indicator of the overall efficiency of the public housing policy [34];
- -
2. Materials: Public Housing Policy in the Municipality of Palermo
- the additional subsidy to housing rent, for low-income households;
- the subsidy to involuntary arrears of tenants, implementing the Legislative Decree 102/2013;
- the subsidy for housing emergency.
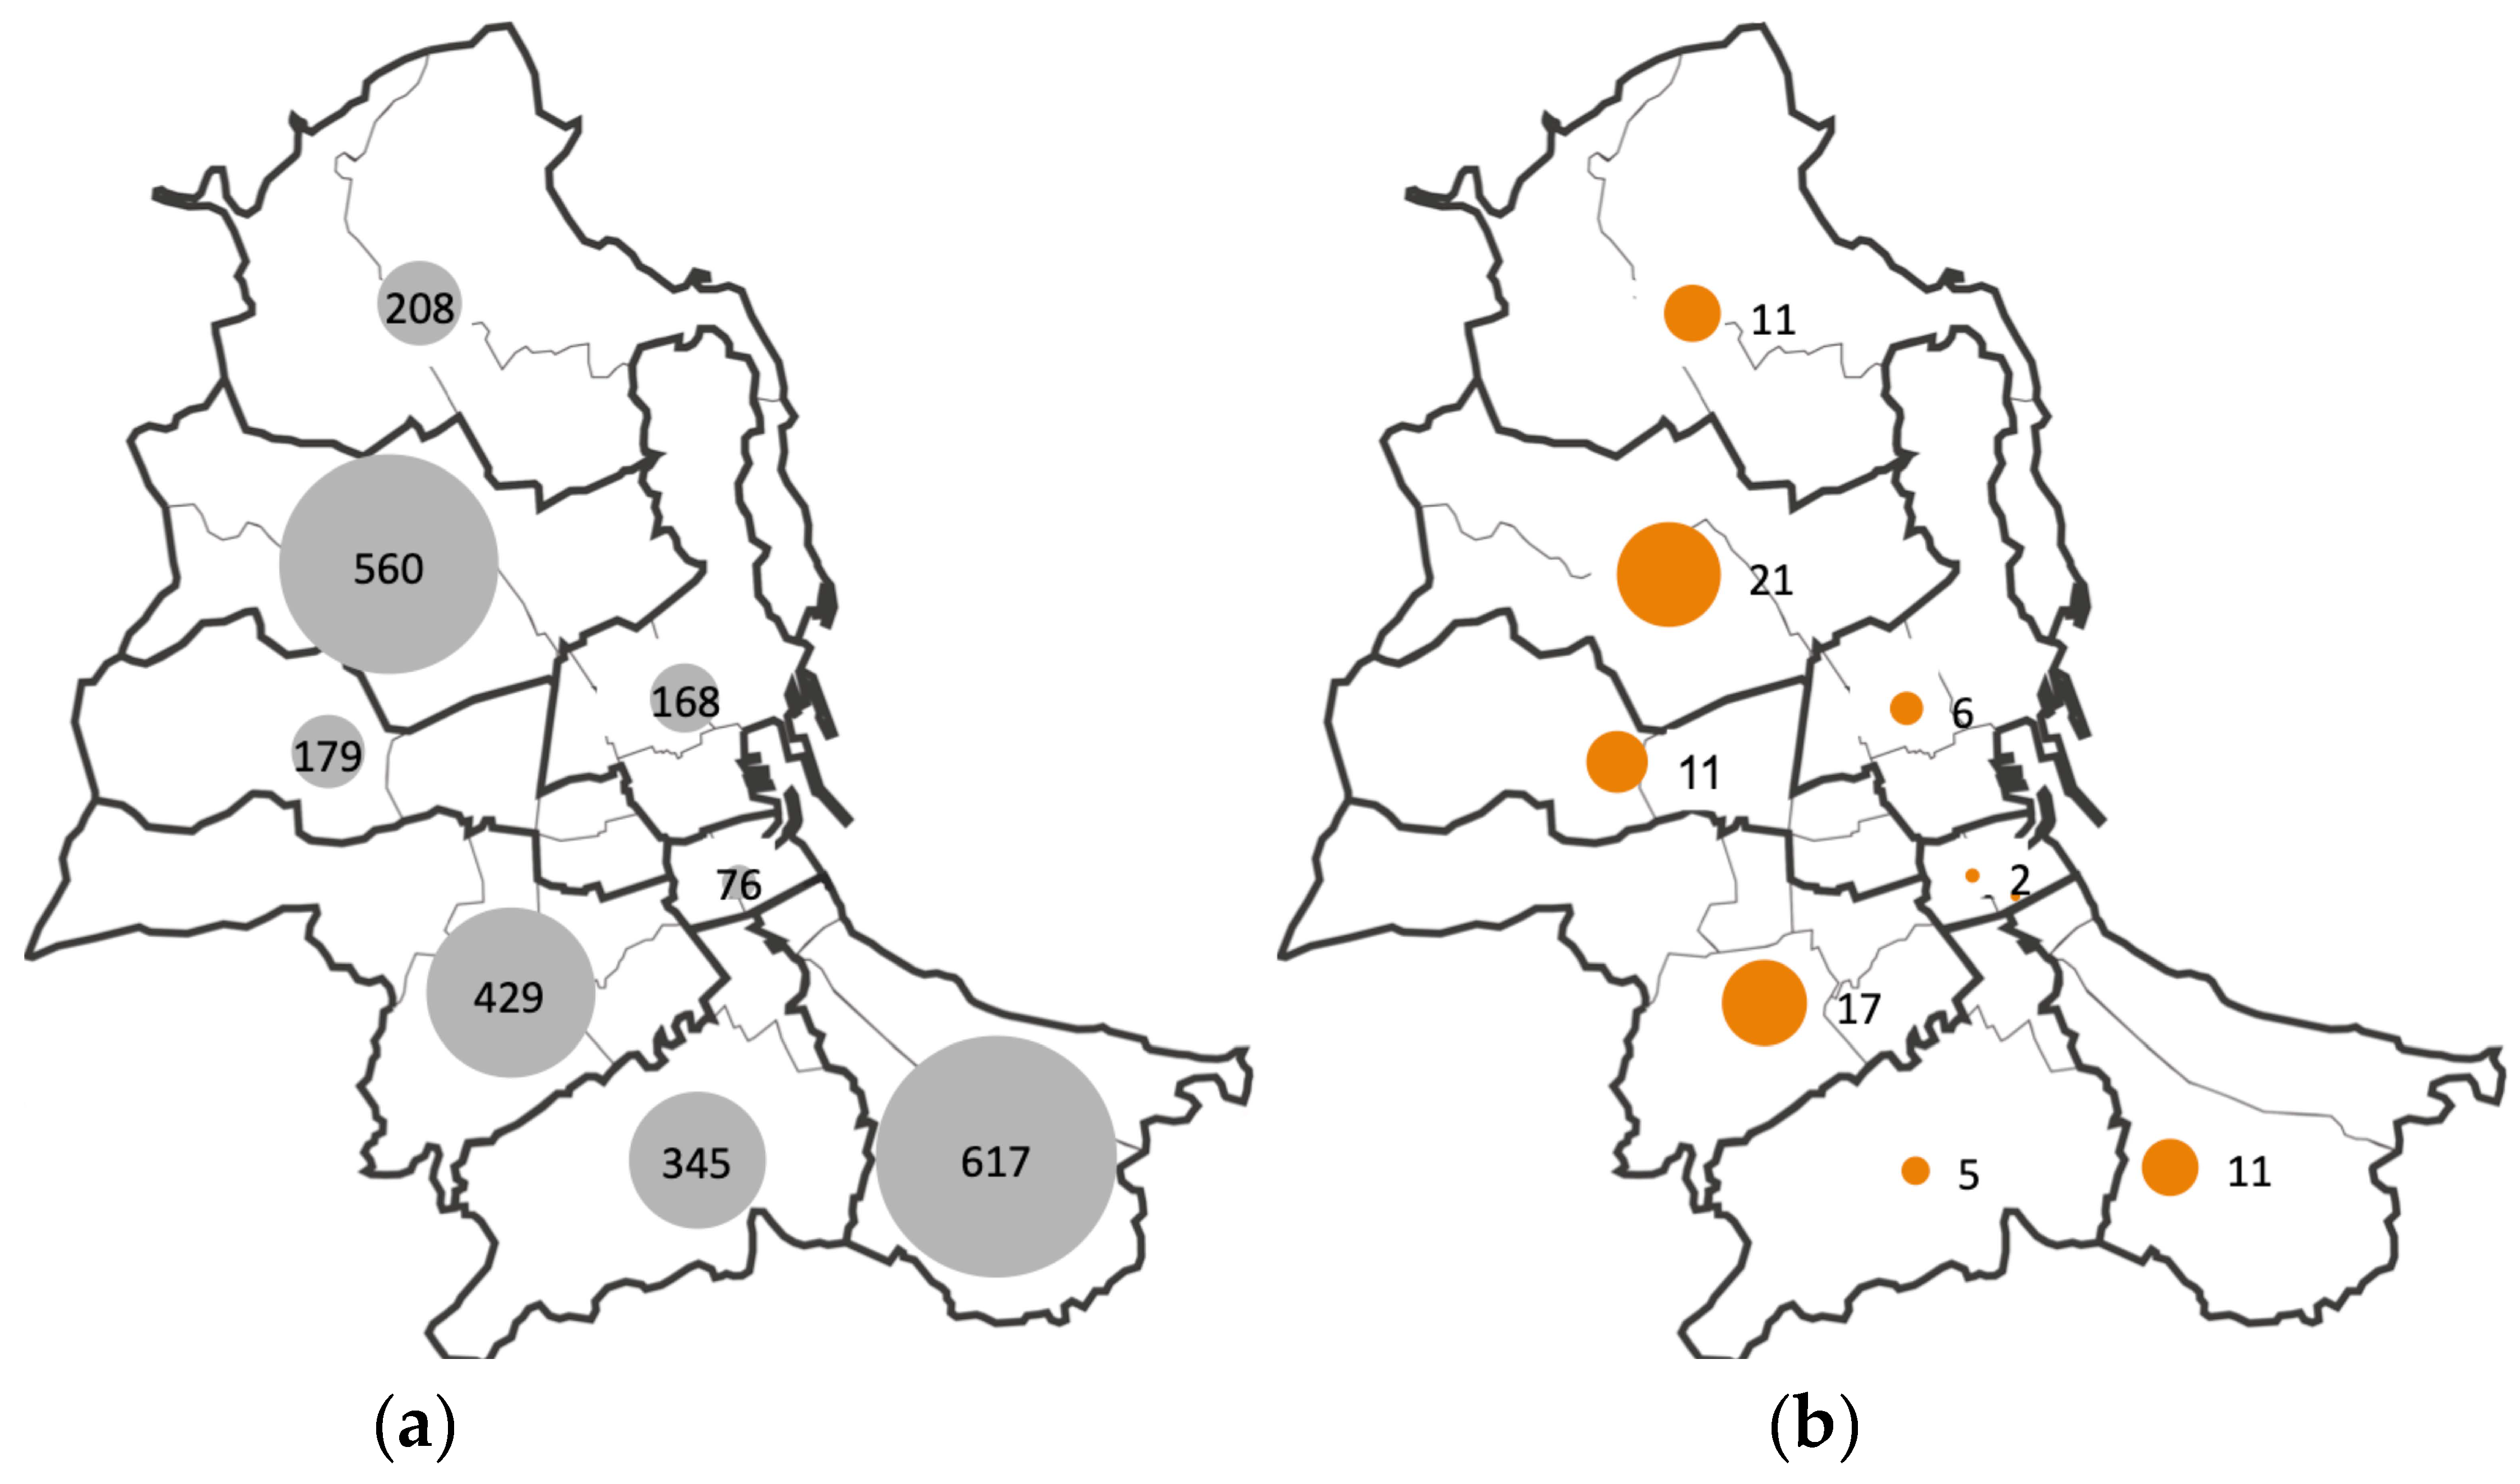
2.1. Public Housing Stock in Palermo
2.2. The Transfer Programme of Public Housing
- being up-to-date with the payment of the rent and the condominium fees;
- no member of the family must own, use or usufruct a suitable housing for the family;
- to have had the final assignment of the dwelling for at least two years;
- being in possession of other legal requirements (that are set by Presidential Decree 30/12/1972 no. 1035).
3. Methods
- -
- reconsider the rules for the political pricing in order to grant homogeneous reductions of the real estate market estimates, for the purpose of the equalization between the current tenants (potential owners);
- -
- suggest possible variations in the political prices for those properties of which, due to any higher location characteristics, the market estimates are greater, and in respect of which the reduction is greater than the average.
- A real estate market survey aimed at providing a wide and articulated database intended to appraise the potential real estate market price of the properties to be transferred;
- The application of a multiple linear regression pattern, aimed at eliciting the marginal prices of the characteristics by which the properties to be transferred have been featured;
- The estimate of the properties to be transferred aimed at comparing the real estate potential market price to the political prices carried out by the municipality according to the current laws, in order to provide some critical item of the fairness of the municipal public housing management policy.
3.1. Real Estate Market Survey: Characterization of the Sample
3.2. The Multiple Regression Model
- a set of parameters that summarize the relationship between the dependent variable and the independent ones, under the assumptions that the former is the effect of the latter, and that in examining the influence of each independent variable on the dependent ones, the value of other independent variables are kept constant;
- a statistic for examining the significance of the parameters, and a probability value associated with each of these parameters;
- a value that summarizes the proportion of variance of the dependent variable that is generally explained by the independent variables.
- evaluation of the adequacy of the variables (measurement level, distribution, collinearity etc.);
- choice of the analytical strategy to insert the independent variables into an equation;
- interpretation of the solution;
- validation of the solution.
- The coefficient of determination which represents the proportion of variability of the explained by the independent variables, may measure the goodness of the proximity of the model to the original data; or which takes into account the number of explanatory variables included in the model and sample size;
- The , derived from the corresponding analysis of variance, which allows to decide if the variance induced by regression is statistically significant or may be assigned to the case to a predetermined level of confidence;
- The on the statistical significance of the individual variables;
- The variance inflation factor (VIF) is the ratio of variance in a model with multiple terms, divided by the variance of a model with one term alone. It quantifies the severity of multicollinearity in an ordinary least squares regression analysis. It provides an index that measures how much the variance (the square of the estimate’s standard deviation) of an estimated regression coefficient is increased because of collinearity;
- The analysis of residuals, which may assess the appropriateness of the model by defining residual and examining residual plots. Residuals are the difference between the observed value of the dependent variable and the predicted value. The analysis of the residuals : is a tool to verify the goodness of the regression model, i.e., if there are no violations in terms of linearity, additivity and homoschedasticity of particular variables.
- mean equal to zero: ; for each combination of values of the independent variables, the expected residual value must be equal to 0;
- homoschedasticity: for each ; the variance of the residuals must be constant for all combinations of the values of the independent variables;
- normality: the distributions of the values of for each combination of values of independent variability must be of normal form;
- absence of autocorrelation: , for each and , with ; residues associated with different observations must not be correlated;
- the independent variables must not be correlated with the residuals:
- Value of the coefficients of determination equal to or greater than 0.95, or in some less restrictively are proposed values equal to 0.90 or, however, close to 0.90;
- The average error rate should not be higher than 10% and errors for each observation must not be greater than 15%, or the standard error should not be greater than 5% of the average price;
- The limit values of the t and F tests are based on the confidence interval that generally is equal to 0.95. An important condition in the regression analysis concerns the relation between the number of observations and the number of explanatory variables required.
- Practical criteria suggest that the relation between the number of observations and the number of variables should be , o + 30, or less restrictively at least up to in respect of the previous inequality, or even , where is the number of observations in the sample of property trades and is the number of the property features. In general, the choice of the criterion is related to the actual availability of the data.
3.3. Appraisal and Benchmarking
4. Application and Results
4.1. Real Estate Market Survey
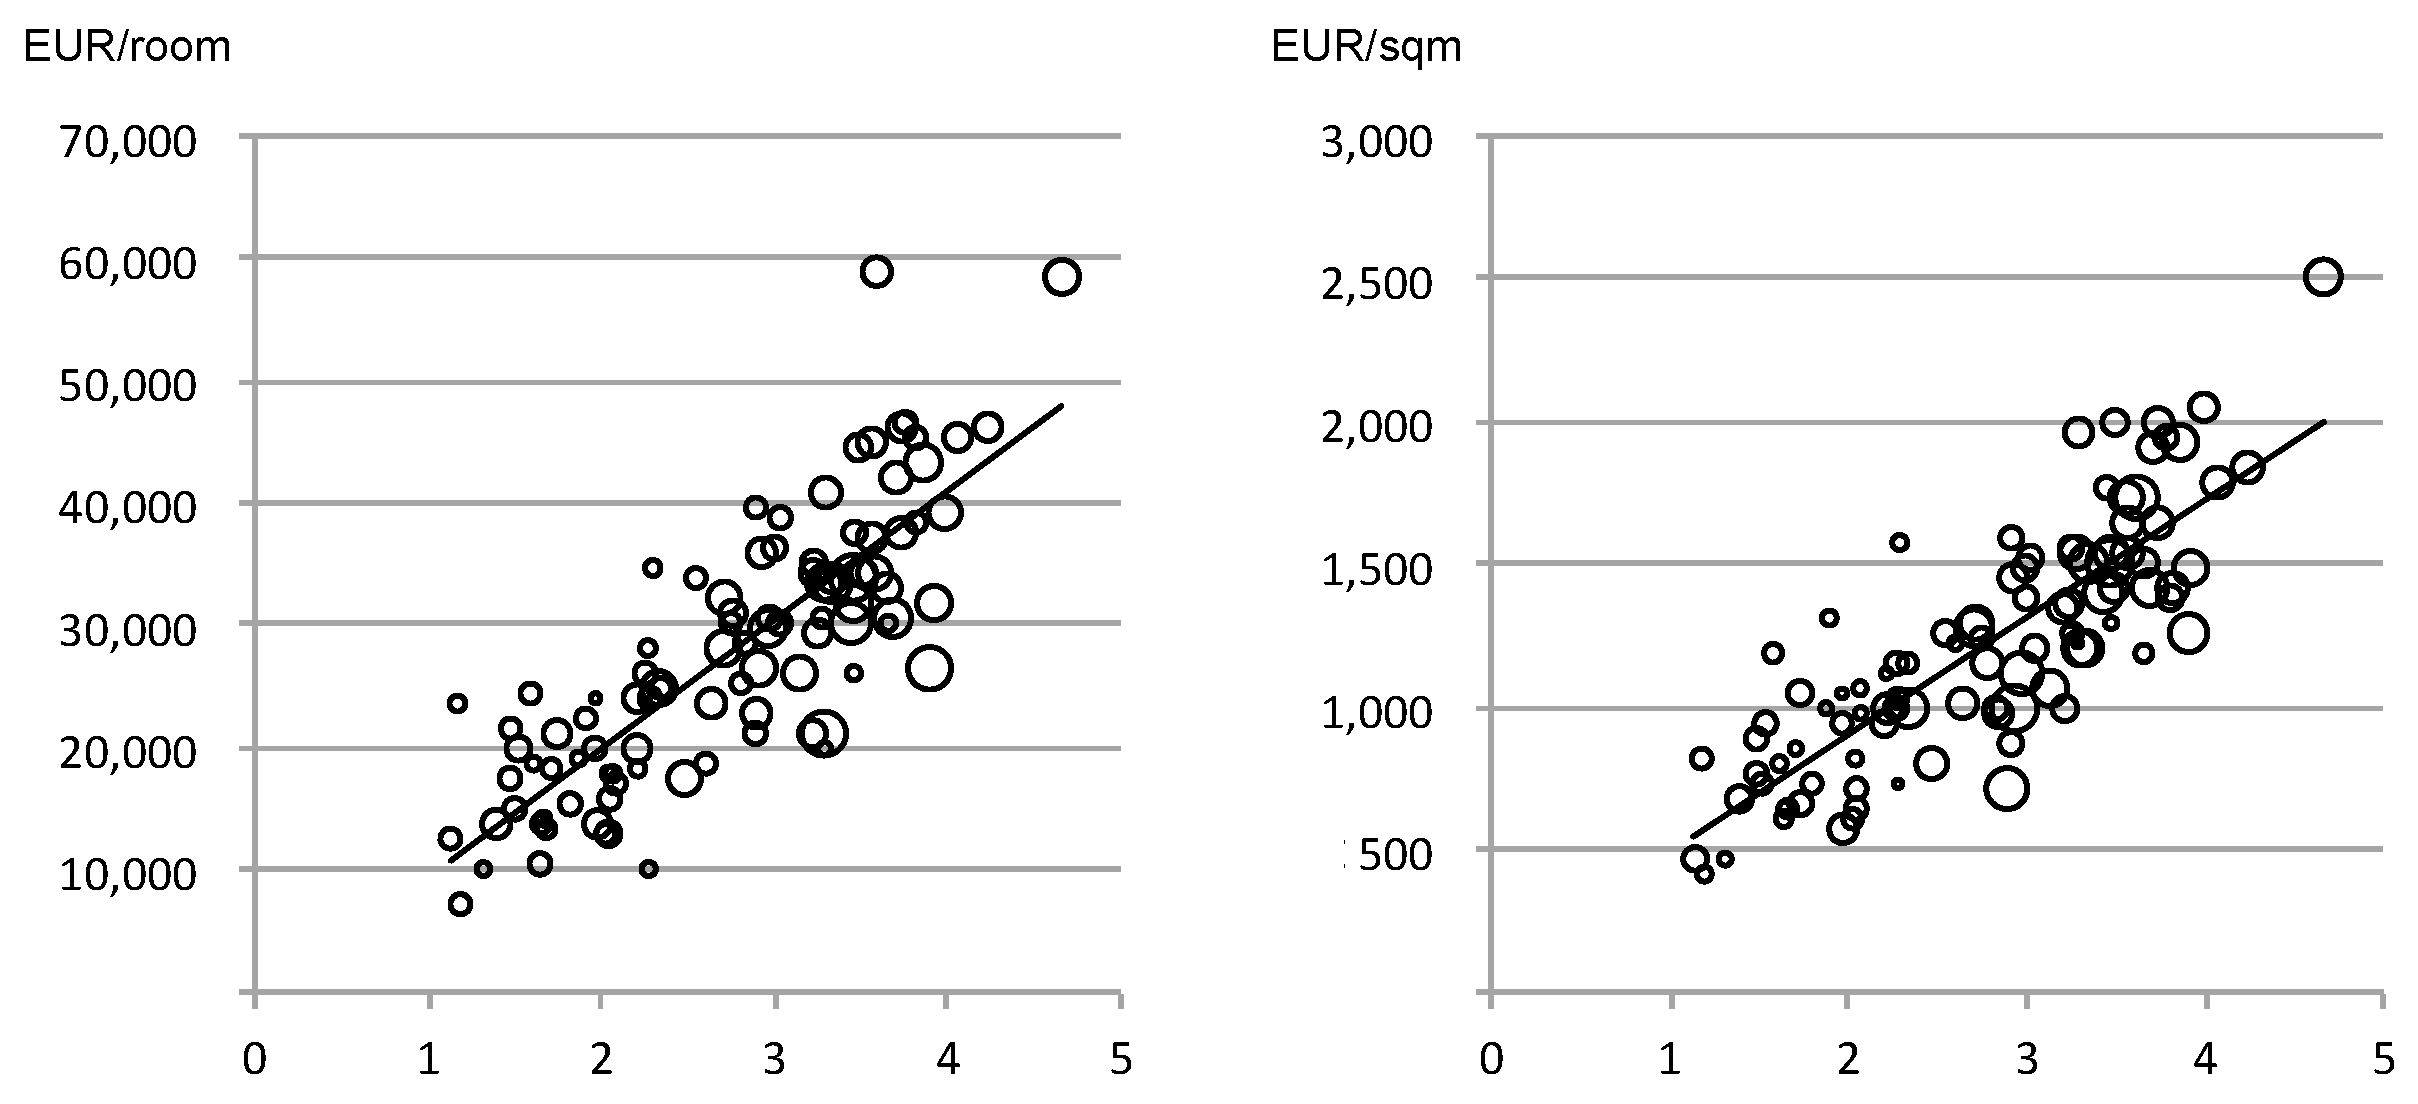
4.2. The Multiple Linear Regression Analysis and the Elicitation of the Predictors
- The coefficient of determination , which represents the proportion of variability of explained by the explanatory variables, and which represents a measure of the goodness of the proximity of the model to the original data in this case is 0.834, which can be considered an acceptable result;
- taking into account the number of explanatory variables , i.e., the six real estate characteristics included in the model and the sample size has a value of 0.825, which can be considered acceptable;
- The used to evaluate the statistical significance of the model as a whole is based on the relationship between the variance explained by the model and the residual variance; in this case the is less than the ;
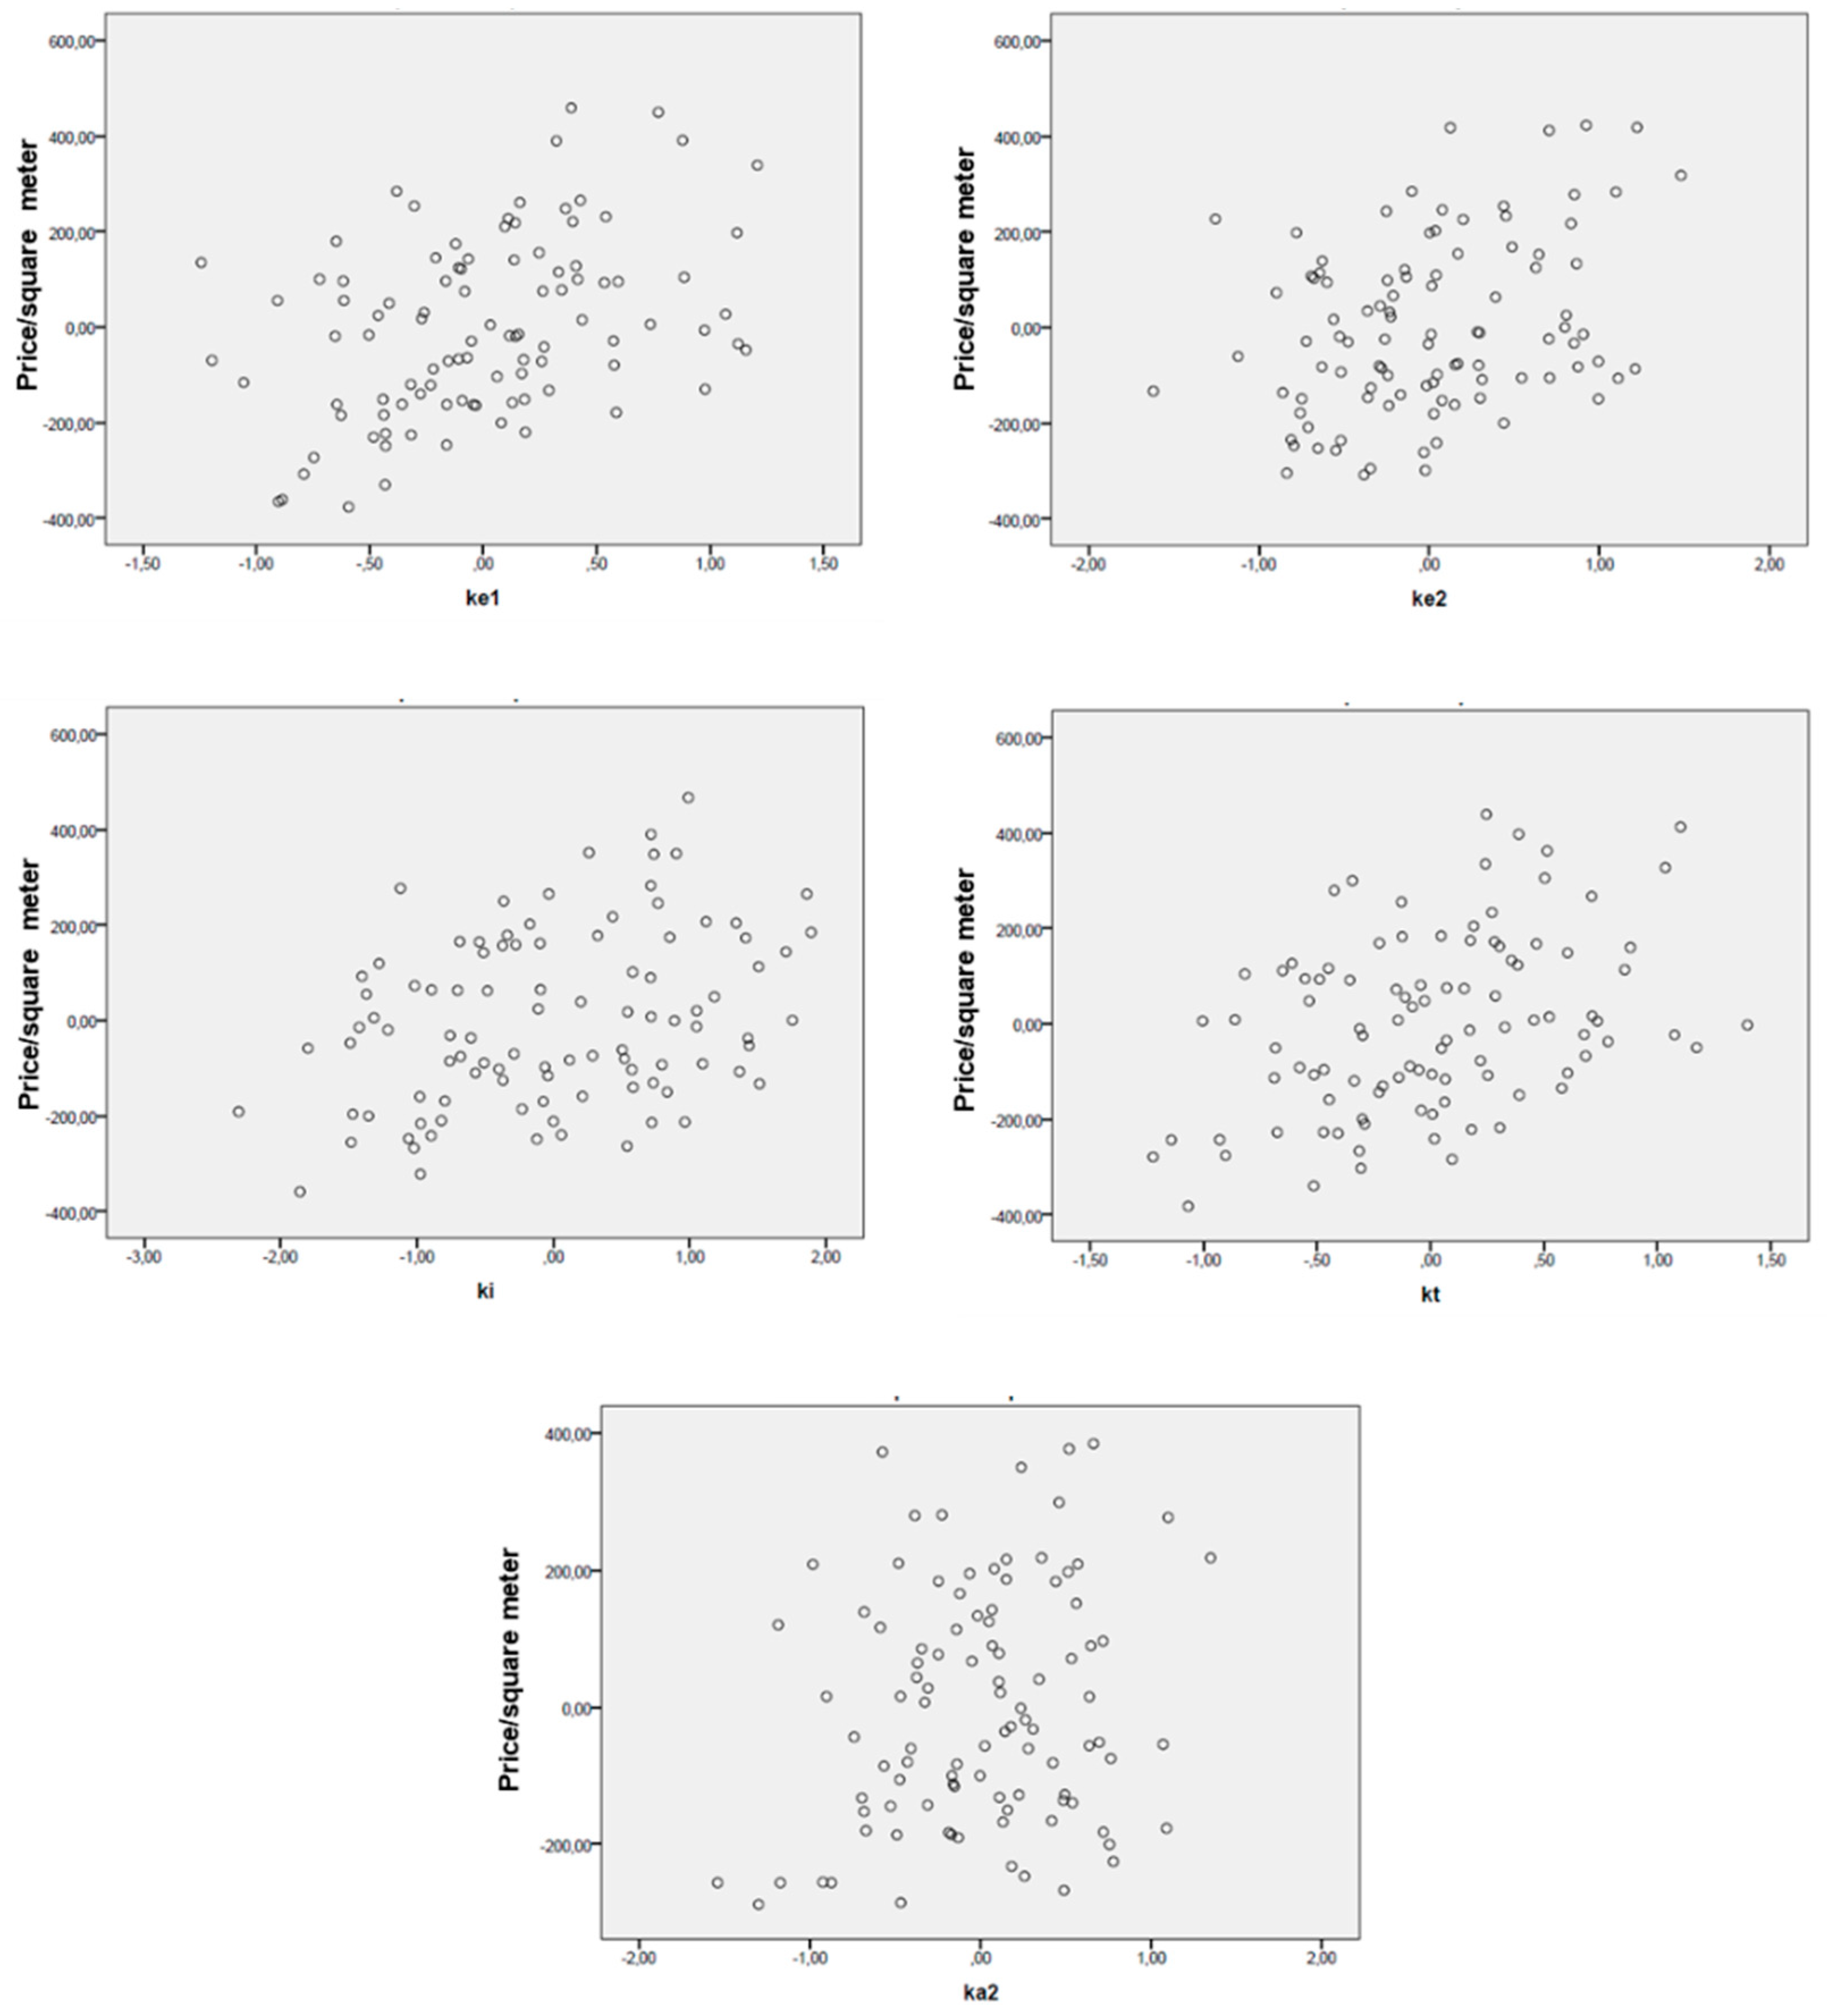
- The on the statistical significance of the individual predictors within the meaningful model for the five variables , i.e., the real estate characteristics , , , have a significant influence on the formation of the ;
- The VIF, that helps to quantifies the severity of multicollinearity in an ordinary least squares regression analysis, in this case is very low and there is not multicollinearity between the variables.
- The analysis of the eigenvalues to identify possible multicollinearity conditions identifies low values of the condition index, i.e., very low or lack of multicollinearity.
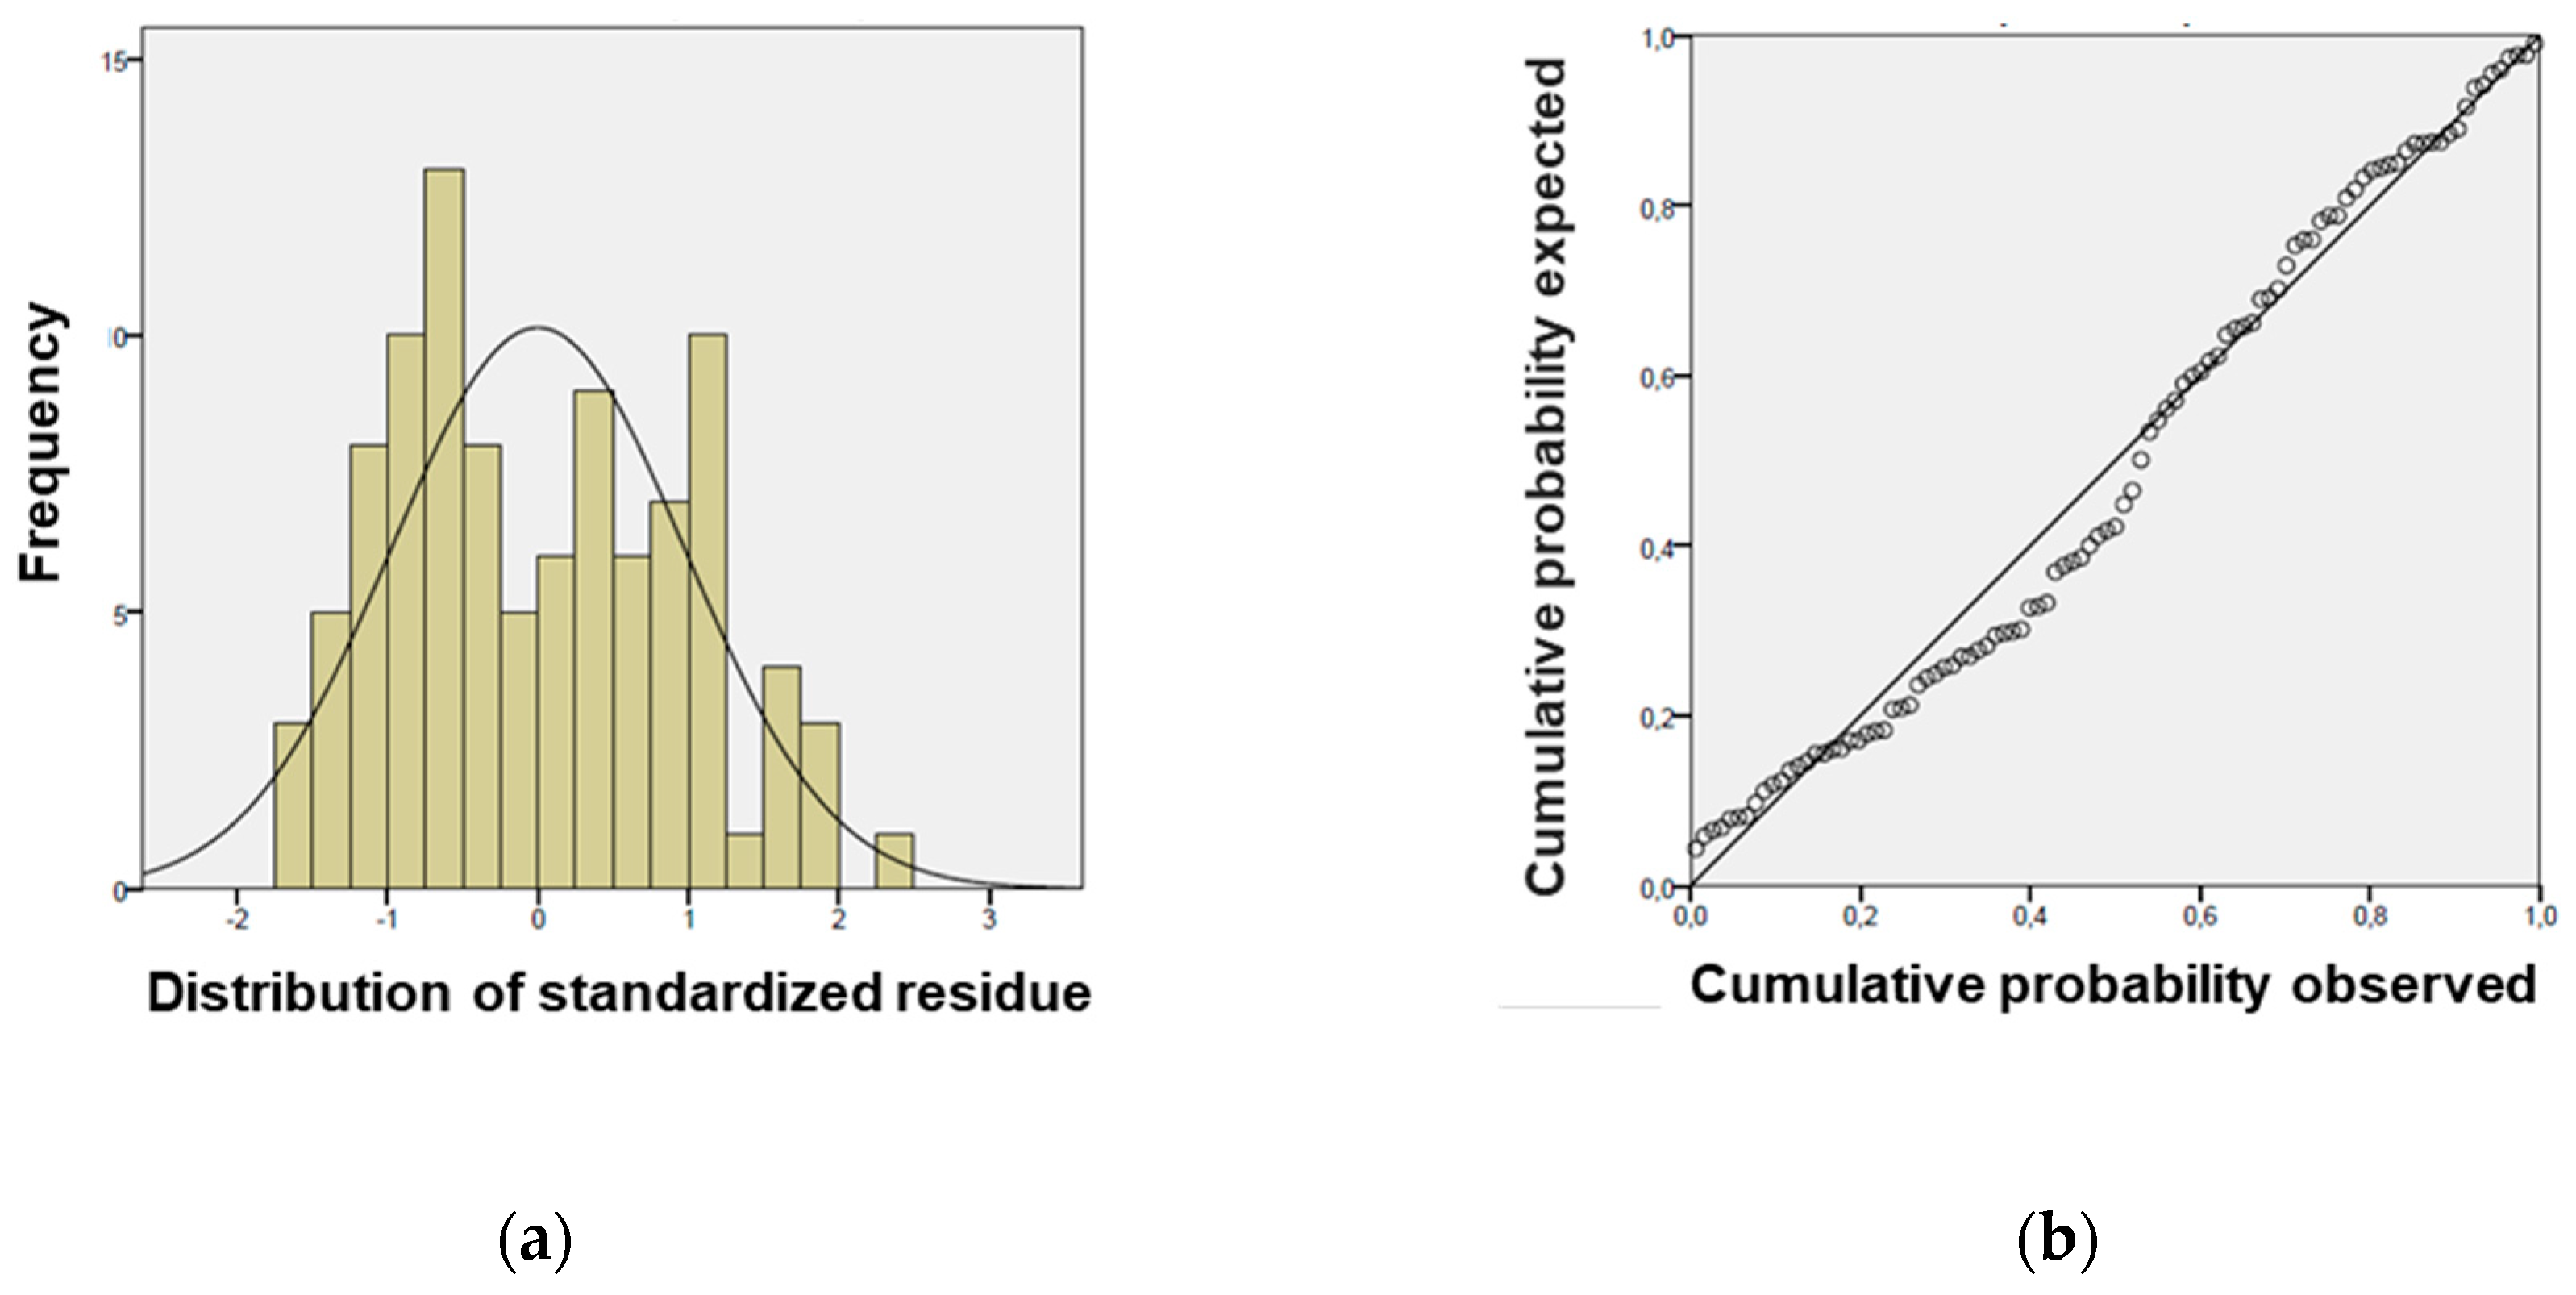
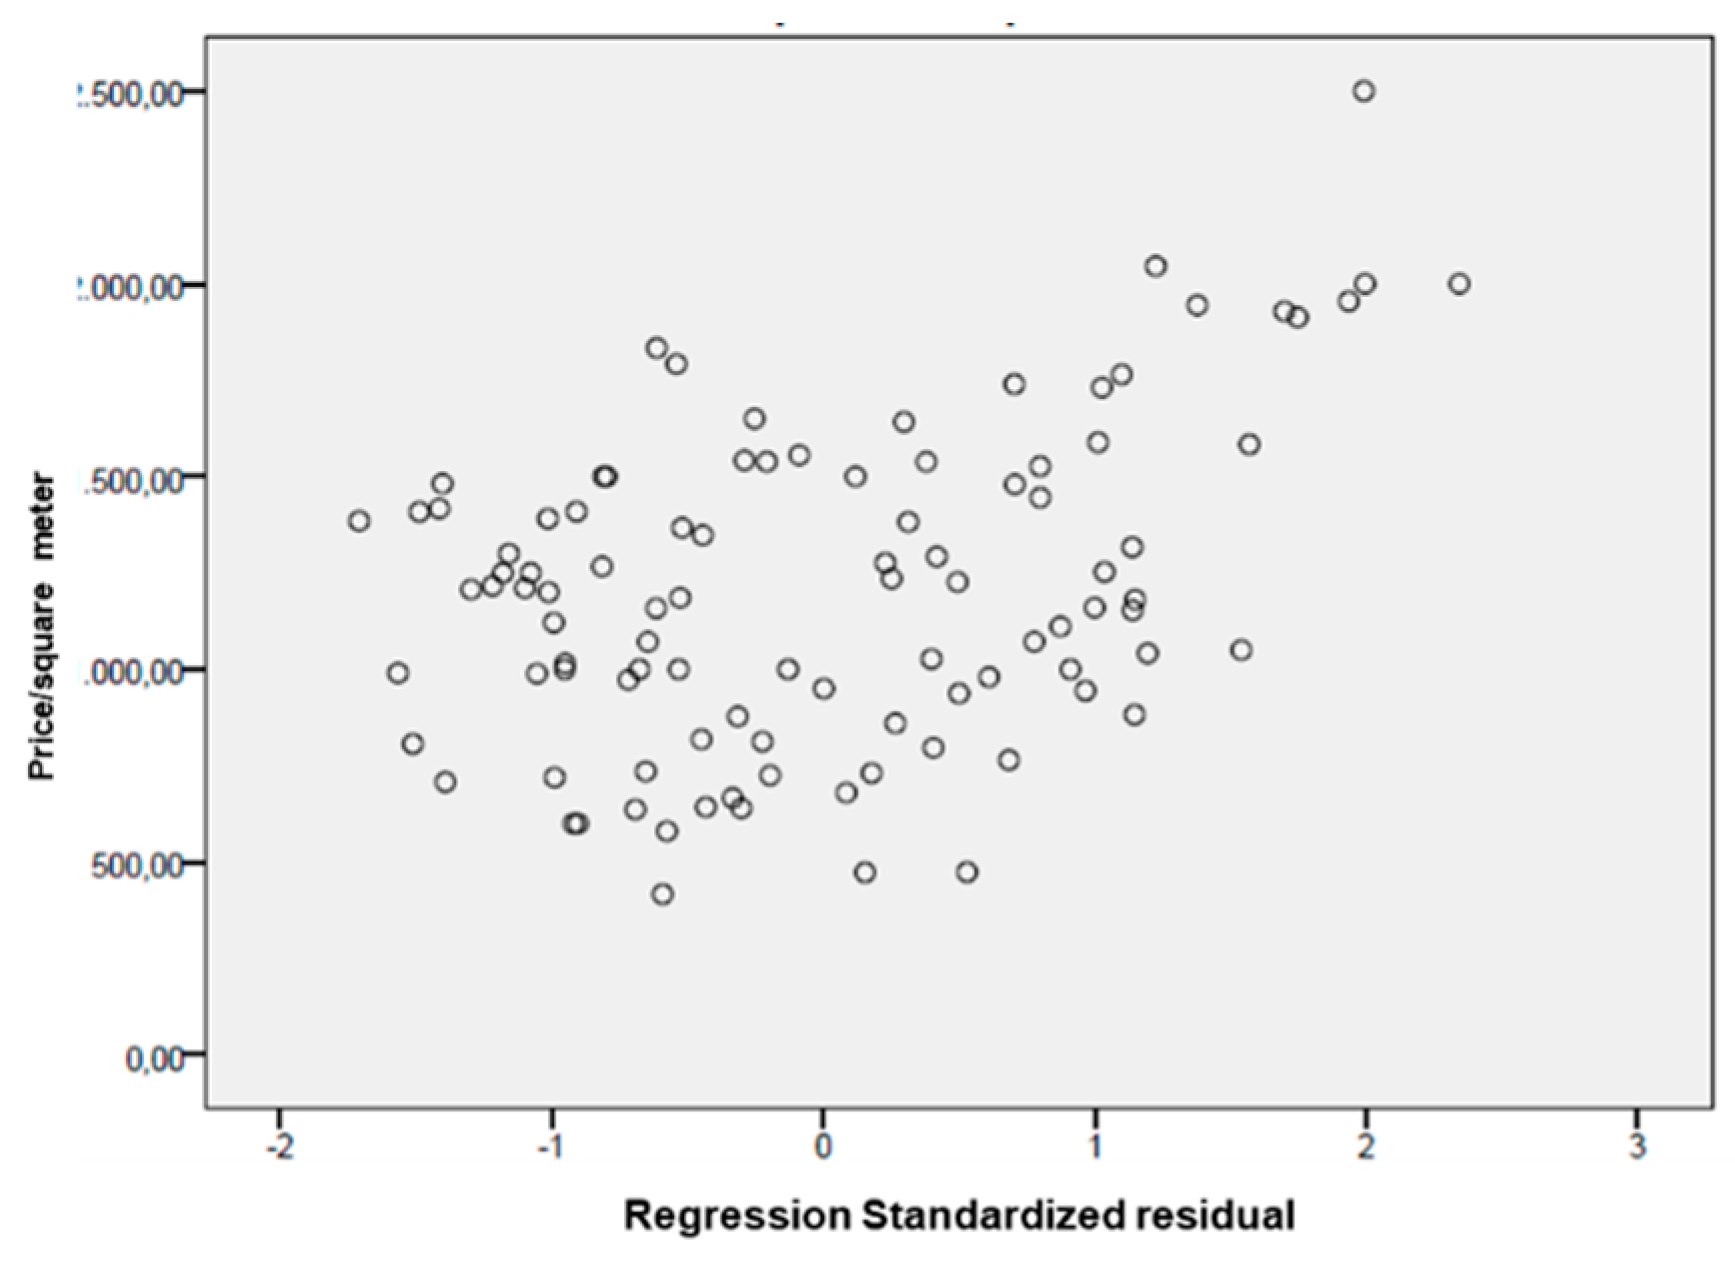
- The analysis of the residuals shows that the standardized residue approximates to the distribution to the normal one, i.e., for each combination of values of the independent variables, the expected residual value is equal to 0 and for each the variance of the residuals is constant for all combinations of the values of the independent variables (Figure 6 left);
- In the Normal P-P graph of standardized residual regression the points tend to be arranged even if with some approximation along a straight line (Figure 8b, right);
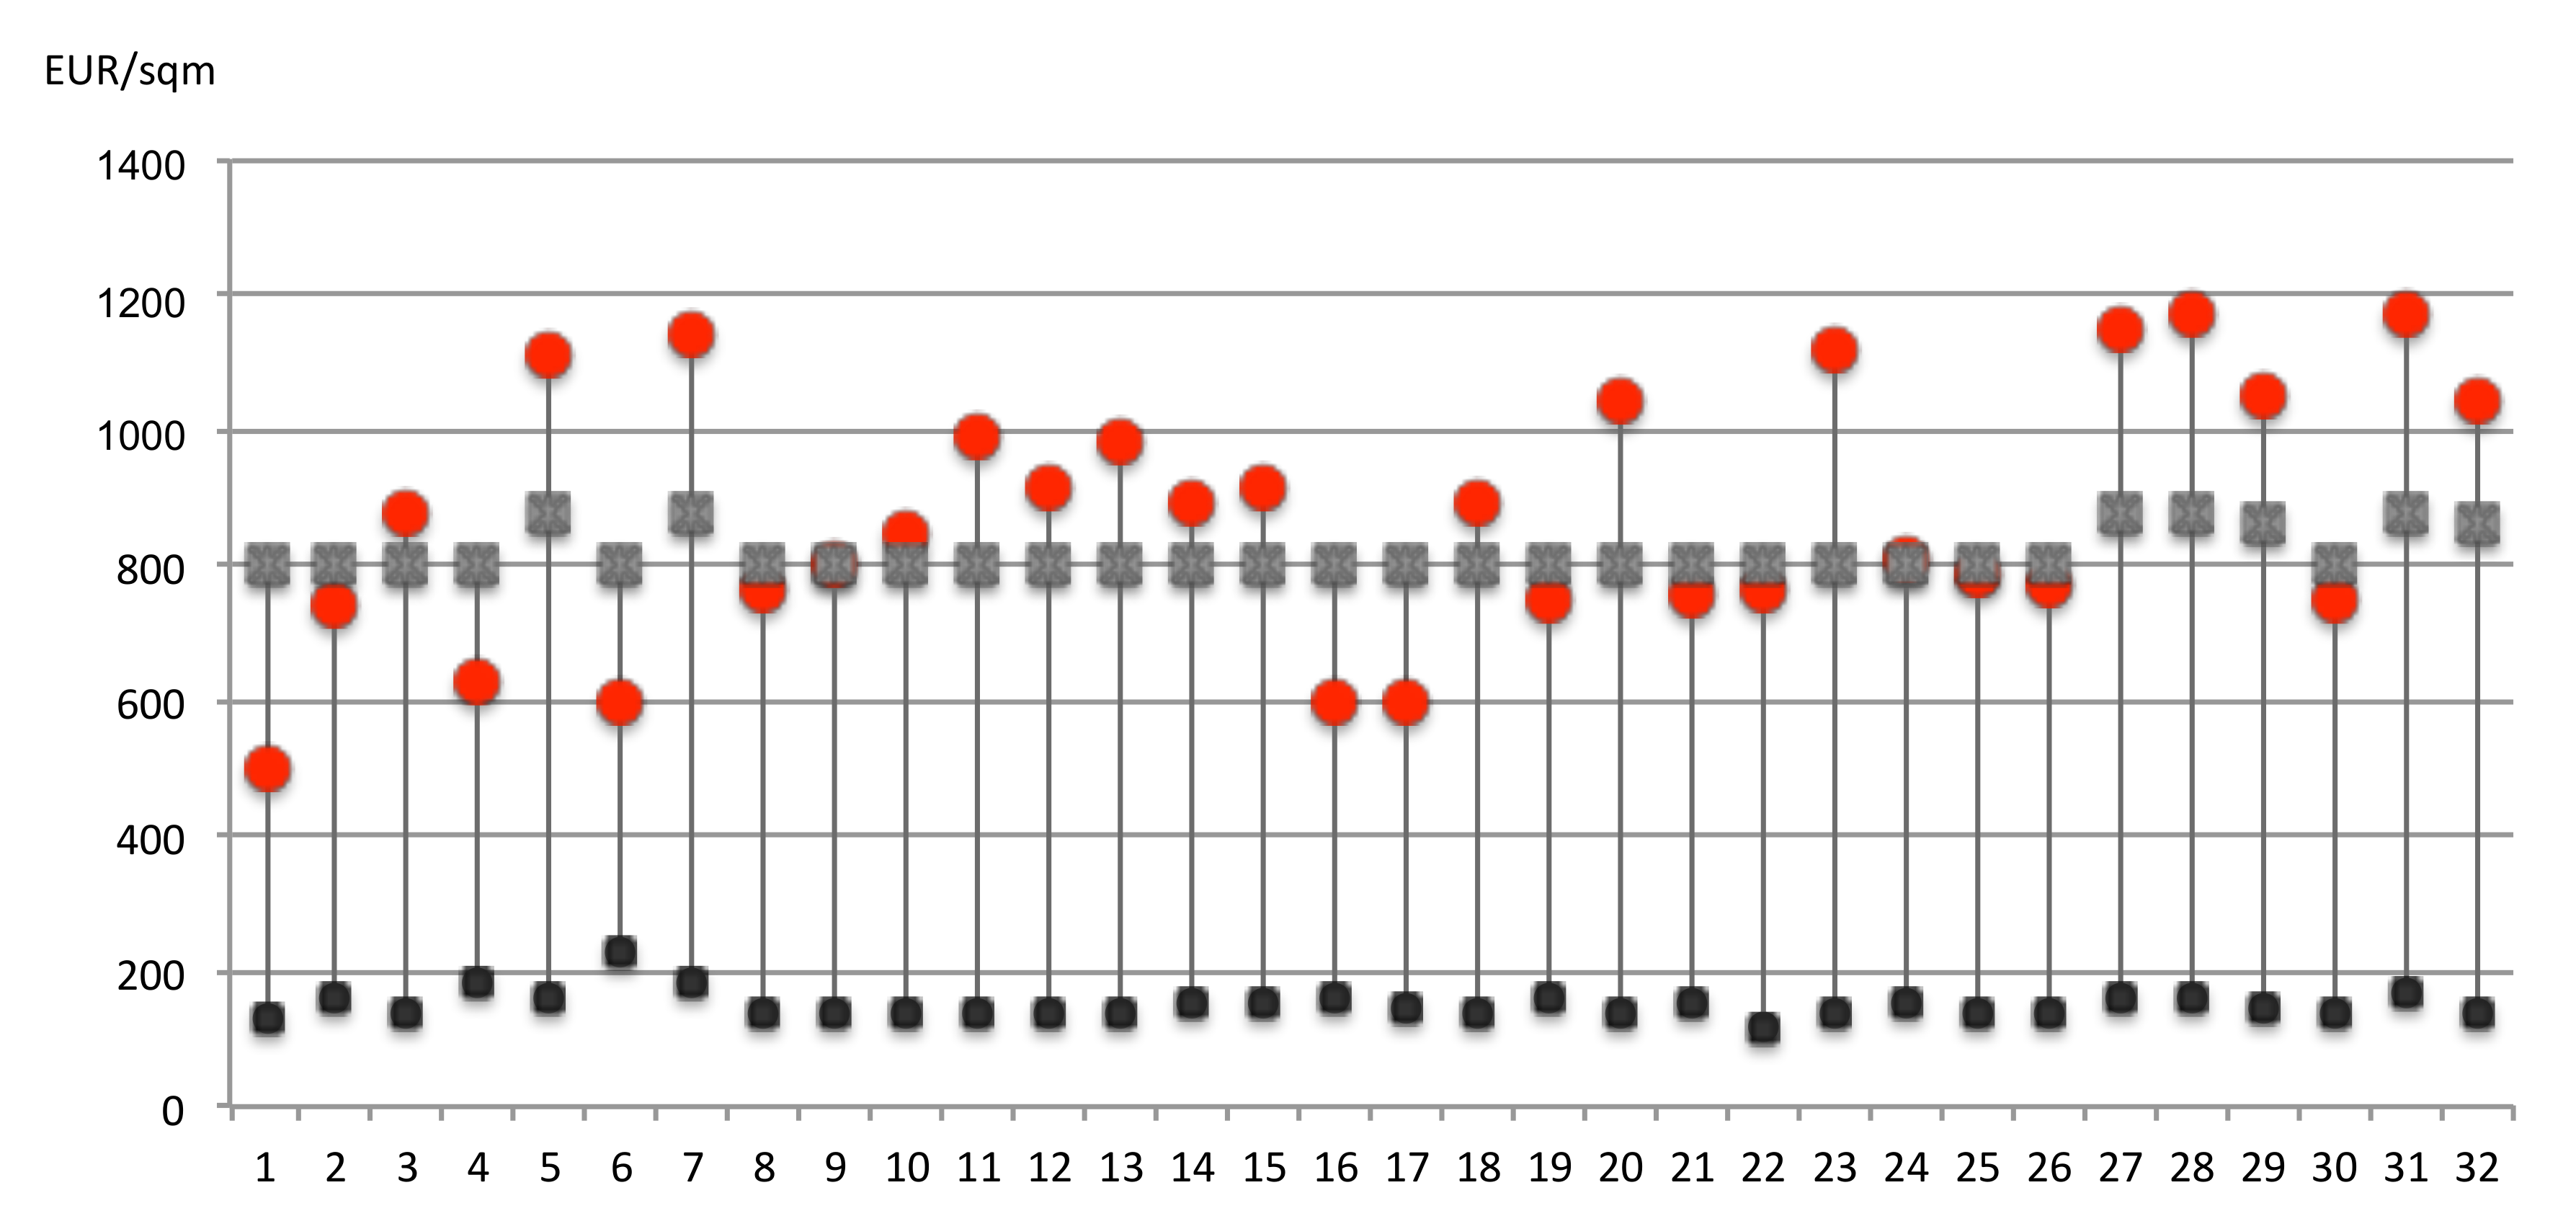
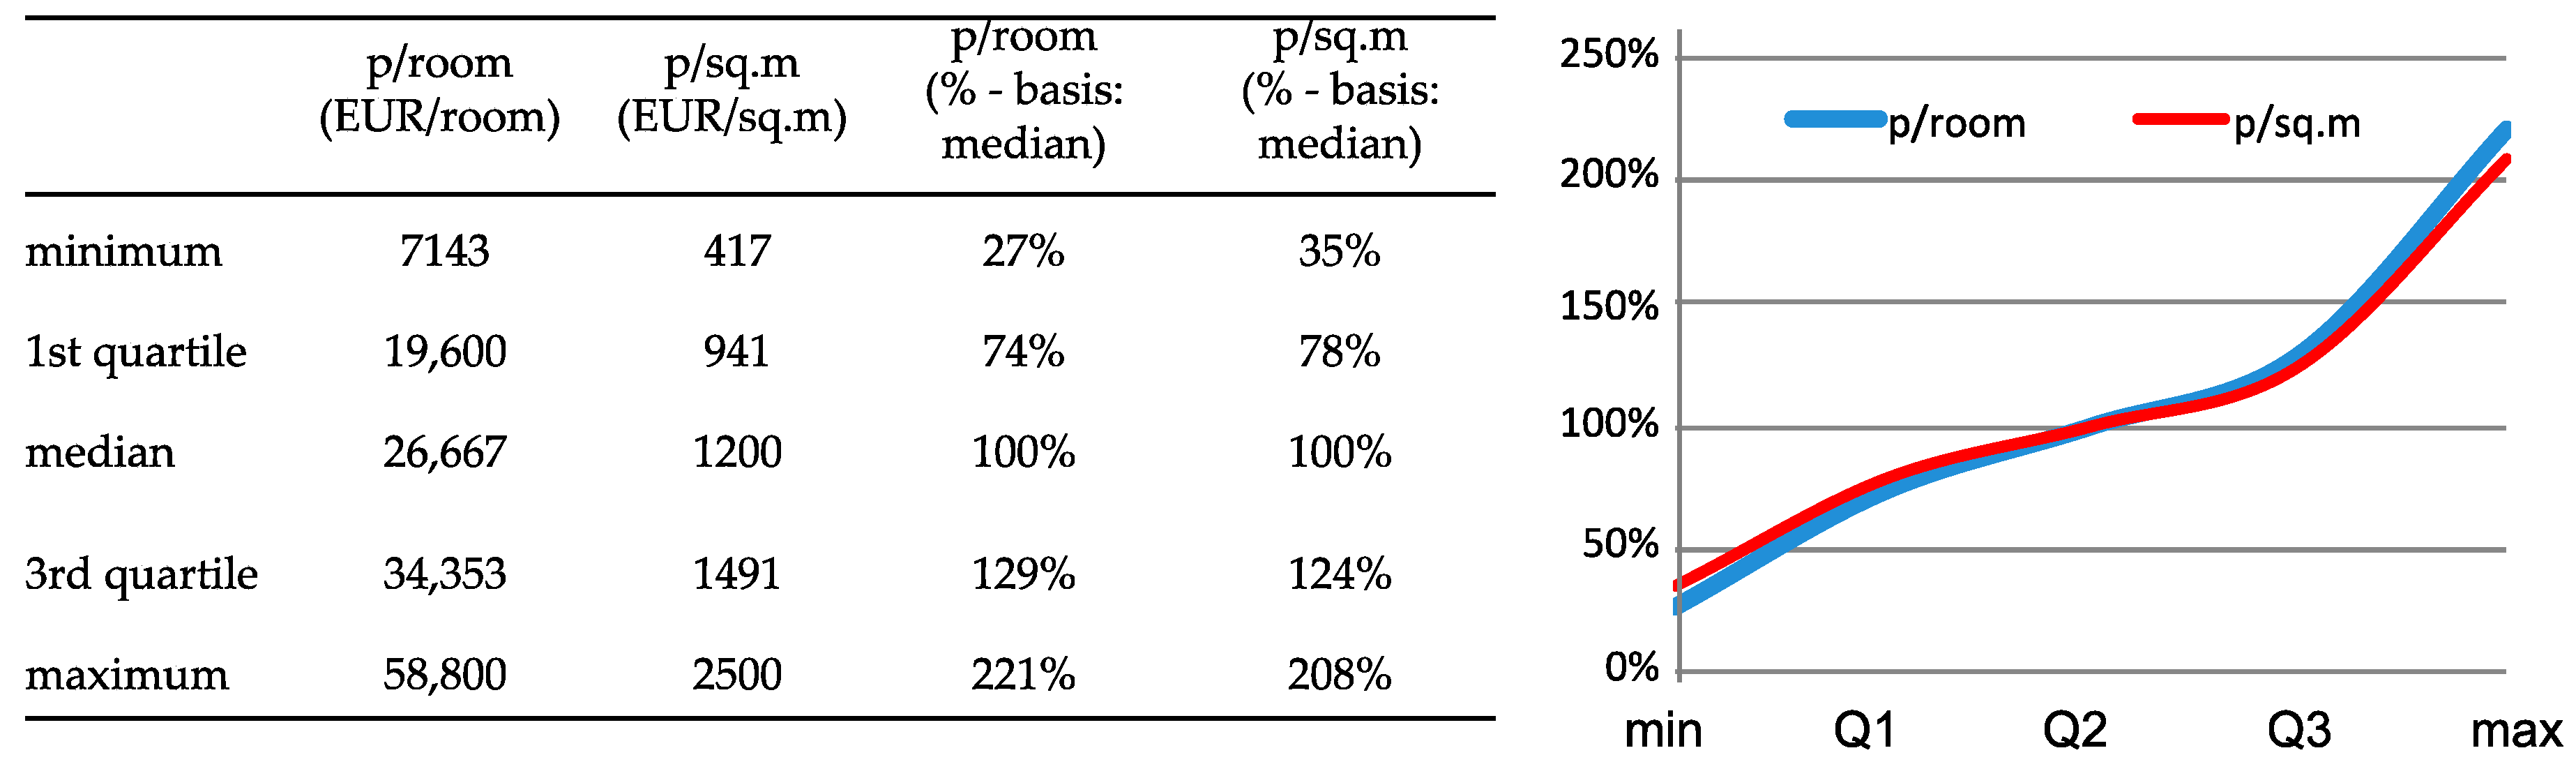
4.3. Comparison between Political, Real Estate Market, and Observatory of the Real Estate Market (OMI) Prices
5. Discussion and Conclusions
Author Contributions
Funding
Conflicts of Interest
References
- Soja, E.W. Regional Urbanization and the End of the Metropolis Era. In New Companion to the City; Bridge, G., Watson, S., Eds.; Wiley-Blackwell: Cambridge, MA, USA, 2011; pp. 679–689. [Google Scholar]
- Davis, M. City of Quartz: Excavating the Future in Los Angeles; Verso: New York, NY, USA, 1990. [Google Scholar]
- Mackenzie, E. Privatopia: Homeowner Association and the Rise of Residential Private Government; Yale University Press: New Haven, CT, USA; London, UK, 1994. [Google Scholar]
- Aalbers, M.B.; Gibb, K. Housing and the right to the city: Introduction to the special issue. Int. J. Hous. Policy 2014, 14, 207–213. [Google Scholar] [CrossRef]
- Giampino, A.; Lo Piccolo, F. Formal property rights in the face of the substantial right to housing. Public Sect. 2016, 42, 52–63. [Google Scholar]
- Napoli, G.; Giuffrida, S.; Trovato, M.R. Fair Planning and Affordability Housing in Urban Policy. The Case of Syracuse (Italy). In Proceedings of the Computational Science and Its Applications, Beijing, China, 4–7 July 2016; Springer International Publishing: Cham, Switzerland, 2016; Volume 9789, pp. 46–62. [Google Scholar] [CrossRef]
- Napoli, G. Housing affordability in metropolitan areas. The Application of a Combination of the Ratio Income and Residual Approaches to Two Case Studies in Sicily, Italy. Buildings 2017, 7, 95. [Google Scholar] [CrossRef]
- Stone, M.E. A housing affordability standard for the UK. Hous. Stud. 2006, 21, 453–476. [Google Scholar] [CrossRef]
- Stone, M.E.; Burke, T.; Ralston, L. The Residual Income Approach to Housing Affordability: The Theory and the Practise. 2011. Available online: http://works.bepress.com/michael_stone/7 (accessed on 31 May 2018).
- Haffner, M.; Boumeester, H. The Affordability of Housing in the Netherlands: An Increasing Income Gap between Renting and Owning? Hous. Stud. 2010, 25, 799–820. [Google Scholar] [CrossRef]
- Government UK; Council Housing and Housing Association. Right to Buy. Available online: www.gov.uk/right-to-buy-buying-your-council-home (accessed on 30 September 2018).
- Disney, R.; Luo, D. The Right to Buy public housing in Britain: A welfare analysis. J. Hous. Econ. 2017, 35, 51–68. [Google Scholar] [CrossRef]
- Napoli, G.; Gabrielli, L.; Barbaro, S. The efficiency of the incentives for the public buildings energy retrofit. The case of the Italian Regions of the “Objective Convergence”. Valori e Valutazioni 2017, 18, 25–39. [Google Scholar]
- Napoli, G. Financial sustainability and morphogenesis of urban transformation project. In Proceedings of the ICCSA 2015, Part III, LNCS 9157, Banff, AB, Canada, 22–25 June 2015; Springer International Publishing: Cham, Switzerland, 2015; pp. 178–193. [Google Scholar] [CrossRef]
- Gabrielli, L.; Giuffrida, S.; Trovato, M.R. Functions and Perspectives of Public Real Estate in the Urban Policies: The Sustainable Development Plan of Syracuse. In Proceedings of the ICCSA 2016, LNCS 9789, Beijing, China, 4–7 July 2016; Gervasi, O., Murgante, B., Misra, S., Eds.; Springer: Cham, Switzerland, 2016; Volume IV, pp. 13–28. [Google Scholar] [CrossRef]
- Trovato, M.R.; Giuffrida, S. The choice problem of the urban performances to support the Pachino’s redevelopment plan. Int. J. Bus. Intell. Data Min. 2014, 9, 330–355. [Google Scholar] [CrossRef]
- Trovato, M.R.; Giuffrida, S. A DSS to Assess and Manage the Urban Performances in the Regeneration Plan: The Case Study of Pachino. In Proceedings of the International Conference on Computational Science and Its Applications, ICCSA 2014, PT III, Guimarães, Portugal, 30 June–3 July 2014; pp. 224–239. [Google Scholar] [CrossRef]
- Hoekstra, J.; Saizarbitoria, I.H.; Etxarri, A.E. Recent changes in Spanish housing policies: Subsidized owner-occupancy dwellings as a new tenure sector? J. Hous. Built Environ. 2010, 25, 125–138. [Google Scholar] [CrossRef]
- Eastaway, M.P.; Varo, I.S.M. The Tenure Imbalance in Spain: The Need for Social Housing Policy. Urban Stud. 2002, 39, 283–295. [Google Scholar] [CrossRef]
- Palomerg, J. How Did Finance Capital Infiltrate the World of the Urban Poor? Homeownership and Social Fragmentation in a Spanish Neighborhood. Int. J. Urban Reg. Res. 2013. [Google Scholar] [CrossRef]
- Giuffrida, S. City as Hope. Valuation Science and the Ethics of Capital. In Integrated Evaluation for the Management of Contemporary Cities SIEV 2016; Green Energy and Technology; Mondini, G., Fattinnanzi, E., Oppio, A., Bottero, M., Stanghellini, S., Eds.; Springer: Cham, Switzerland, 2018; pp. 411–424. [Google Scholar] [CrossRef]
- Giuffrida, S. A Fair City. Value, Time and the Cap Rate. In Integrated Evaluation for the Management of Contemporary Cities SIEV 2016; Green Energy and Technology; Mondini, G., Fattinnanzi, E., Oppio, A., Bottero, M., Stanghellini, S., Eds.; Springer: Cham, Switzerland, 2018; pp. 425–439. [Google Scholar] [CrossRef]
- Giuffrida, S. The True Value. On Understanding Something. In Appraisal. From Theory to Practice; Stanghellini, S., Morano, P., Bottero, M., Oppio, A., Eds.; Springer: Cham, Switzerland, 2017; pp. 1–14. ISBN 978-3-319-49675-7. [Google Scholar] [CrossRef]
- Naselli, F.; Trovato, M.R.; Castello, G. An evaluation model for the actions in supporting of the environmental and landscaping rehabilitation of the Pasquasia’s site mining (EN). In Proceedings of the ICCSA 2014. LNCS 8581, Part III, Guimarães, Portugal, 30 June–3 July 2014; Springer International Publishing: Cham, Switzerland, 2014; pp. 26–41. [Google Scholar] [CrossRef]
- Sullivan, L.J.; Rydin, Y.; Buchanan, C. Neighbourhood Sustainability Frameworks—A Literature Review; Working Paper; Centre for Urban Sustainability and Resilience, University College London: London, UK, 2014. [Google Scholar]
- Berardi, U. Sustainability assessment of urban communities through rating systems. Environ. Dev. Sustain. 2013, 15, 1573–1591. [Google Scholar] [CrossRef]
- Rizzo, F. Nuova economia. Felicità del lavoro creativo e della conservazione della natura, infelicità della speculazione finanziaria e dell’inquinamento ambientale; Aracne: Roma, Italy, 2013. [Google Scholar]
- Napoli, G.; Giuffrida, S.; Valenti, A. Forms and functions of the real estate market of Palermo. Science and knowledge in the cluster analysis approach. In Appraisal: From Theory to Practice. Results of SIEV 2015; Stanghellini, S., Morano, P., Bottero, M., Oppio, A., Eds.; Springer International Publishing: Cham, Switzerland, 2017; pp. 191–202. [Google Scholar] [CrossRef]
- Gabrielli, L.; Giuffrida, S.; Trovato, M.R. From Surface to Core: A Multi-layer Approach for the Real Estate Market Analysis of a Central Area in Catania. In Proceedings of the Computational Science and Its Applications—ICCSA 2015, Banff, AB, Canada, 22–25 June 2015; Springer: Cham, Switzerland, 2015; Volume III, pp. 284–300. [Google Scholar]
- Giuffrida, S.; Ventura, V.; Trovato, M.R.; Napoli, G. Axiology of the historical city and the cap rate. The case of the old town of Ragusa Superiore. Valori e Valutazioni 2017, 18, 41–55. [Google Scholar]
- Gabrielli, L.; Giuffrida, S.; Trovato, M.R. Gaps and Overlaps of Urban Housing Sub-market: Hard Clustering and Fuzzy Clustering Approaches. In Appraisal: From Theory to Practice; Springer: Cham, Switzerland, 2017; pp. 203–219. ISBN 978-3-319-49675-7. [Google Scholar] [CrossRef]
- Nesticò, A.; De Mare, G.; Galante, M. The Sustainable Limit of the Real Estate Tax: An Urban-Scale Estimation Model. In Proceedings of the Computational Science and Its Applications—ICCSA 2014, Guimarães, Portugal, 30 June–3 July 2014; Springer: Cham, Switzerland, 2014; Volume III. [Google Scholar]
- Del Giudice, V.; De Paola, P. Spatial analysis of residential real estate rental market with geoadditive models. In Advanced Valuation Modeling; Studies in Systems, Decision and Control; d’Amato, M., Kauko, T., Eds.; Springer: Cham, Switzerland, 2017; Volume 86. [Google Scholar] [CrossRef]
- Hvelplund, F. Political prices or political quantities? A comparison of renewable energy support system. New Energy 2001, 5, 18–23. [Google Scholar]
- Hemphill, L.; Berry, J.; McGreal, S. An indicator-based approach to measuring sustainable urban regeneration performance: Part 1, conceptual foundations and methodological framework. Urban Stud. 2004, 41, 725–755. [Google Scholar] [CrossRef]
- Elgert, L. Rating the sustainable city: ‘Measurementality’, transparency, and unexpected outcomes at the knowledge-policy interface. Environ. Sci. Policy 2018, 79, 16–24. [Google Scholar] [CrossRef]
- Comune di Palermo. Bilancio Sociale 2015. Available online: https://www.comune.palermo.it/bilancio_sociale.php?anno=2015&id=24&lev=2&cap=225 (accessed on 31 May 2018).
- ISTAT 8mila Census. Incidenza Delle Famiglie con Potenziale Disagio Economico nei Diversi Quartieri di Palermo, anno 2011. Available online: http://ottomilacensus.istat.it/sottotema/082/082053/15/ (accessed on 31 May 2018).
- Giampino, A.; Lo Piccolo, F.; Todaro, V. Questione abitativa e diritto alla città a Palermo. In Transizioni Postmetropolitane. Declinazioni Locali Delle Dinamiche Posturbane in Sicilia; Lo Piccolo, F., Picone, M., Todaro, V., Eds.; FrancoAngeli: Milano, Italy, 2018; pp. 185–214. [Google Scholar]
- Ratcliffe, J.; Stubbs, M.; Keeping, M. Urban Plannning and Real Estate Development; Routledge: London, UK, 1996; ISBN 9781134106653. [Google Scholar] [CrossRef]
- Forte, C. Elementi di estimo urbano; Etas Kompass: Naples, Italy, 1968. [Google Scholar]
- Napoli, G.; Giuffrida, S.; Trovato, M.R.; Valenti, A. Cap rate as the interpretative variable of the urban real estate capital asset: A comparison of different sub-market definitions in Palermo, Italy. Buildings 2017, 7, 80. [Google Scholar] [CrossRef]
- Afifi, A.; May, S.; Clark, V.A. Practical Multivariate Analysis; Taylor and Francis: Boca Raton, FL, USA, 2012. [Google Scholar]
- Hair, J.F. Multivariate Data Analysis; Andover: Hampshire, UK, 2019. [Google Scholar]
- Johnson, R.A.; Wichern, D.W. Applied Multivariate Statistical Analysis; Pearson: Upper Saddle River, NJ, USA, 2019. [Google Scholar]
- Kryvobokov, M. What location attributes are the most important for market value? Extraction of attributes from regression models. Prop. Manag. 2007, 25, 257–286. [Google Scholar]
- Zahirovic-Herbert, V.; Chatterjee, S. Historic preservation and residential property values: Evidence from quantile regression. Urban Stud. 2012, 49, 369–382. [Google Scholar] [CrossRef]
- Dattalo, P. Analysis of Multiple Dependent Variables; Oxford University Press: Oxford, UK, 2013; ISBN 9780199773596. [Google Scholar] [CrossRef]
- Ciuna, M.; Milazzo, L.; Salvo, F. A mass appraisal model based on market segment parameters. Buildings 2017, 7, 34. [Google Scholar] [CrossRef]


| Owner | Dwellings | Squatted Dwellings | |
|---|---|---|---|
| No. | No. | % | |
| Municipality of Palermo | 4827 | 2580 | 53.4% |
| Istituto Autonomo Case Popolari (IACP) | 19,208 | 2658 | 13.8% |
| Total | 24,035 | 5238 | 21.8% |
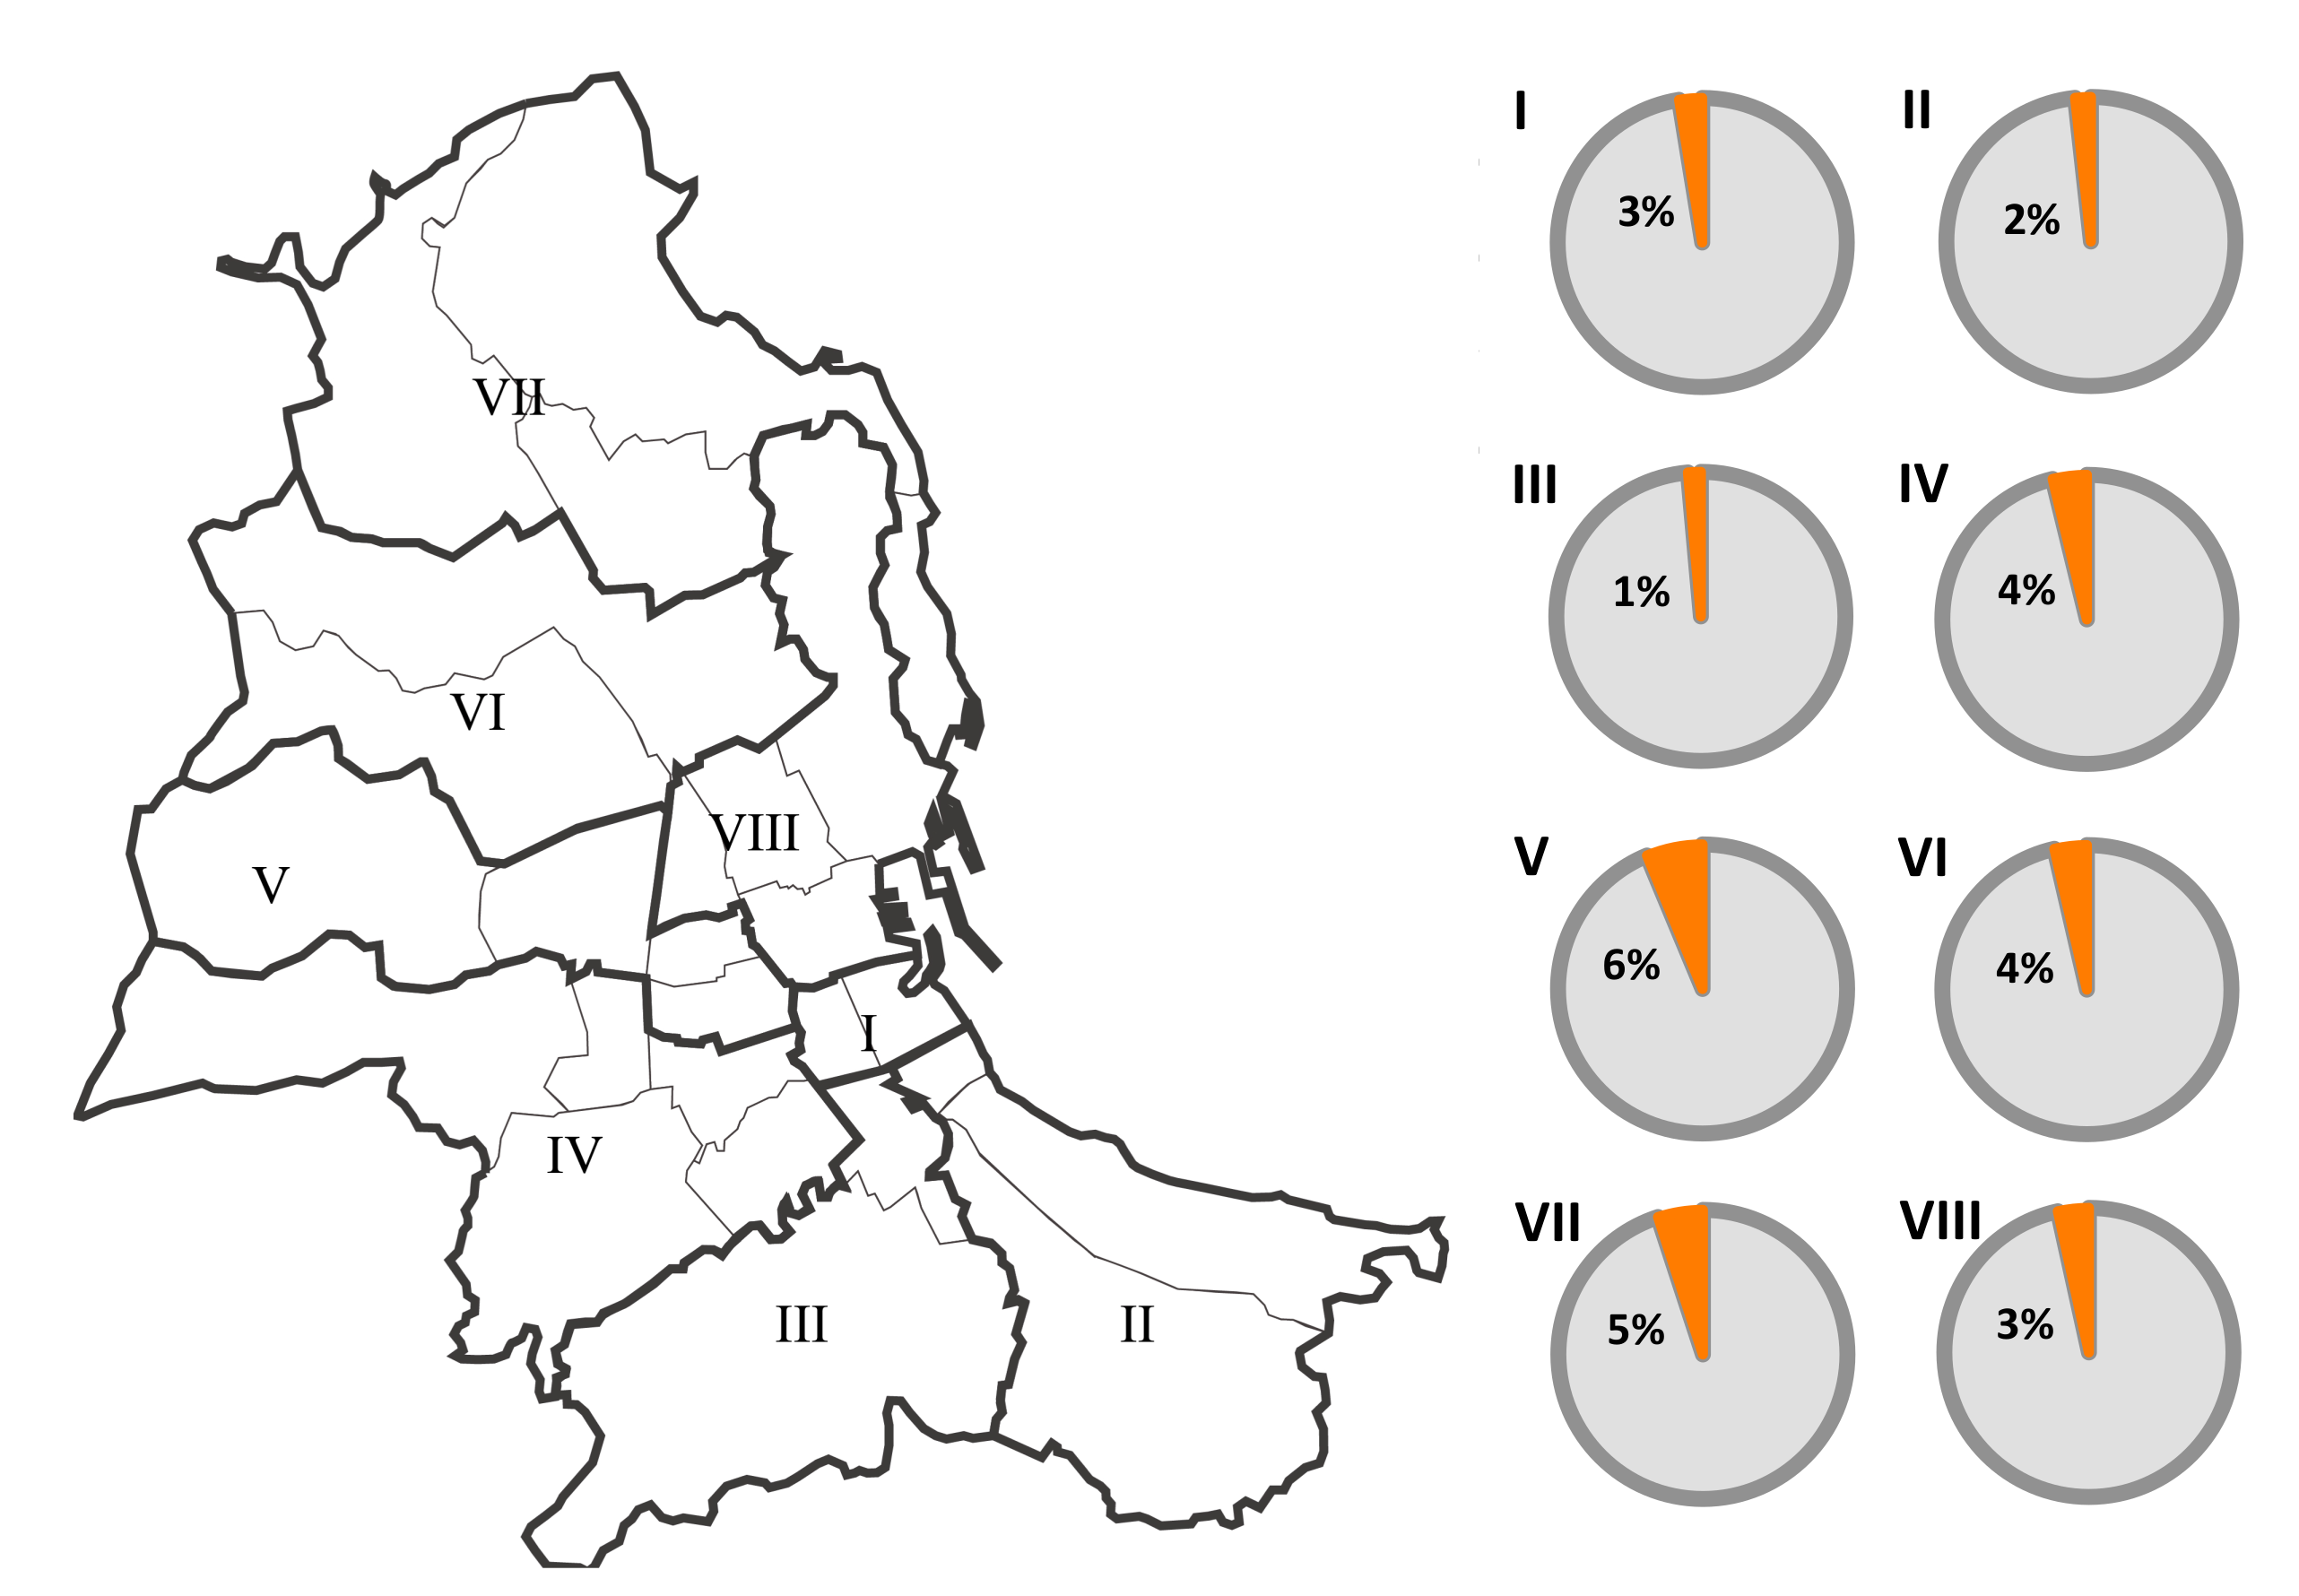
| Districts | Surface (sq.km) | Inhabitants | Population Density (inhab./sq.km) |
|---|---|---|---|
| I | 2.497 | 21,489 | 8606 |
| II | 21.39 | 72,888 | 3408 |
| III | 20.34 | 77,068 | 3789 |
| IV | 26.16 | 112,158 | 4287 |
| V | 17.53 | 120,885 | 6896 |
| VI | 23.90 | 78,548 | 3287 |
| VII | 32.95 | 74,330 | 2256 |
| VIII | 15.32 | 127,794 | 8342 |
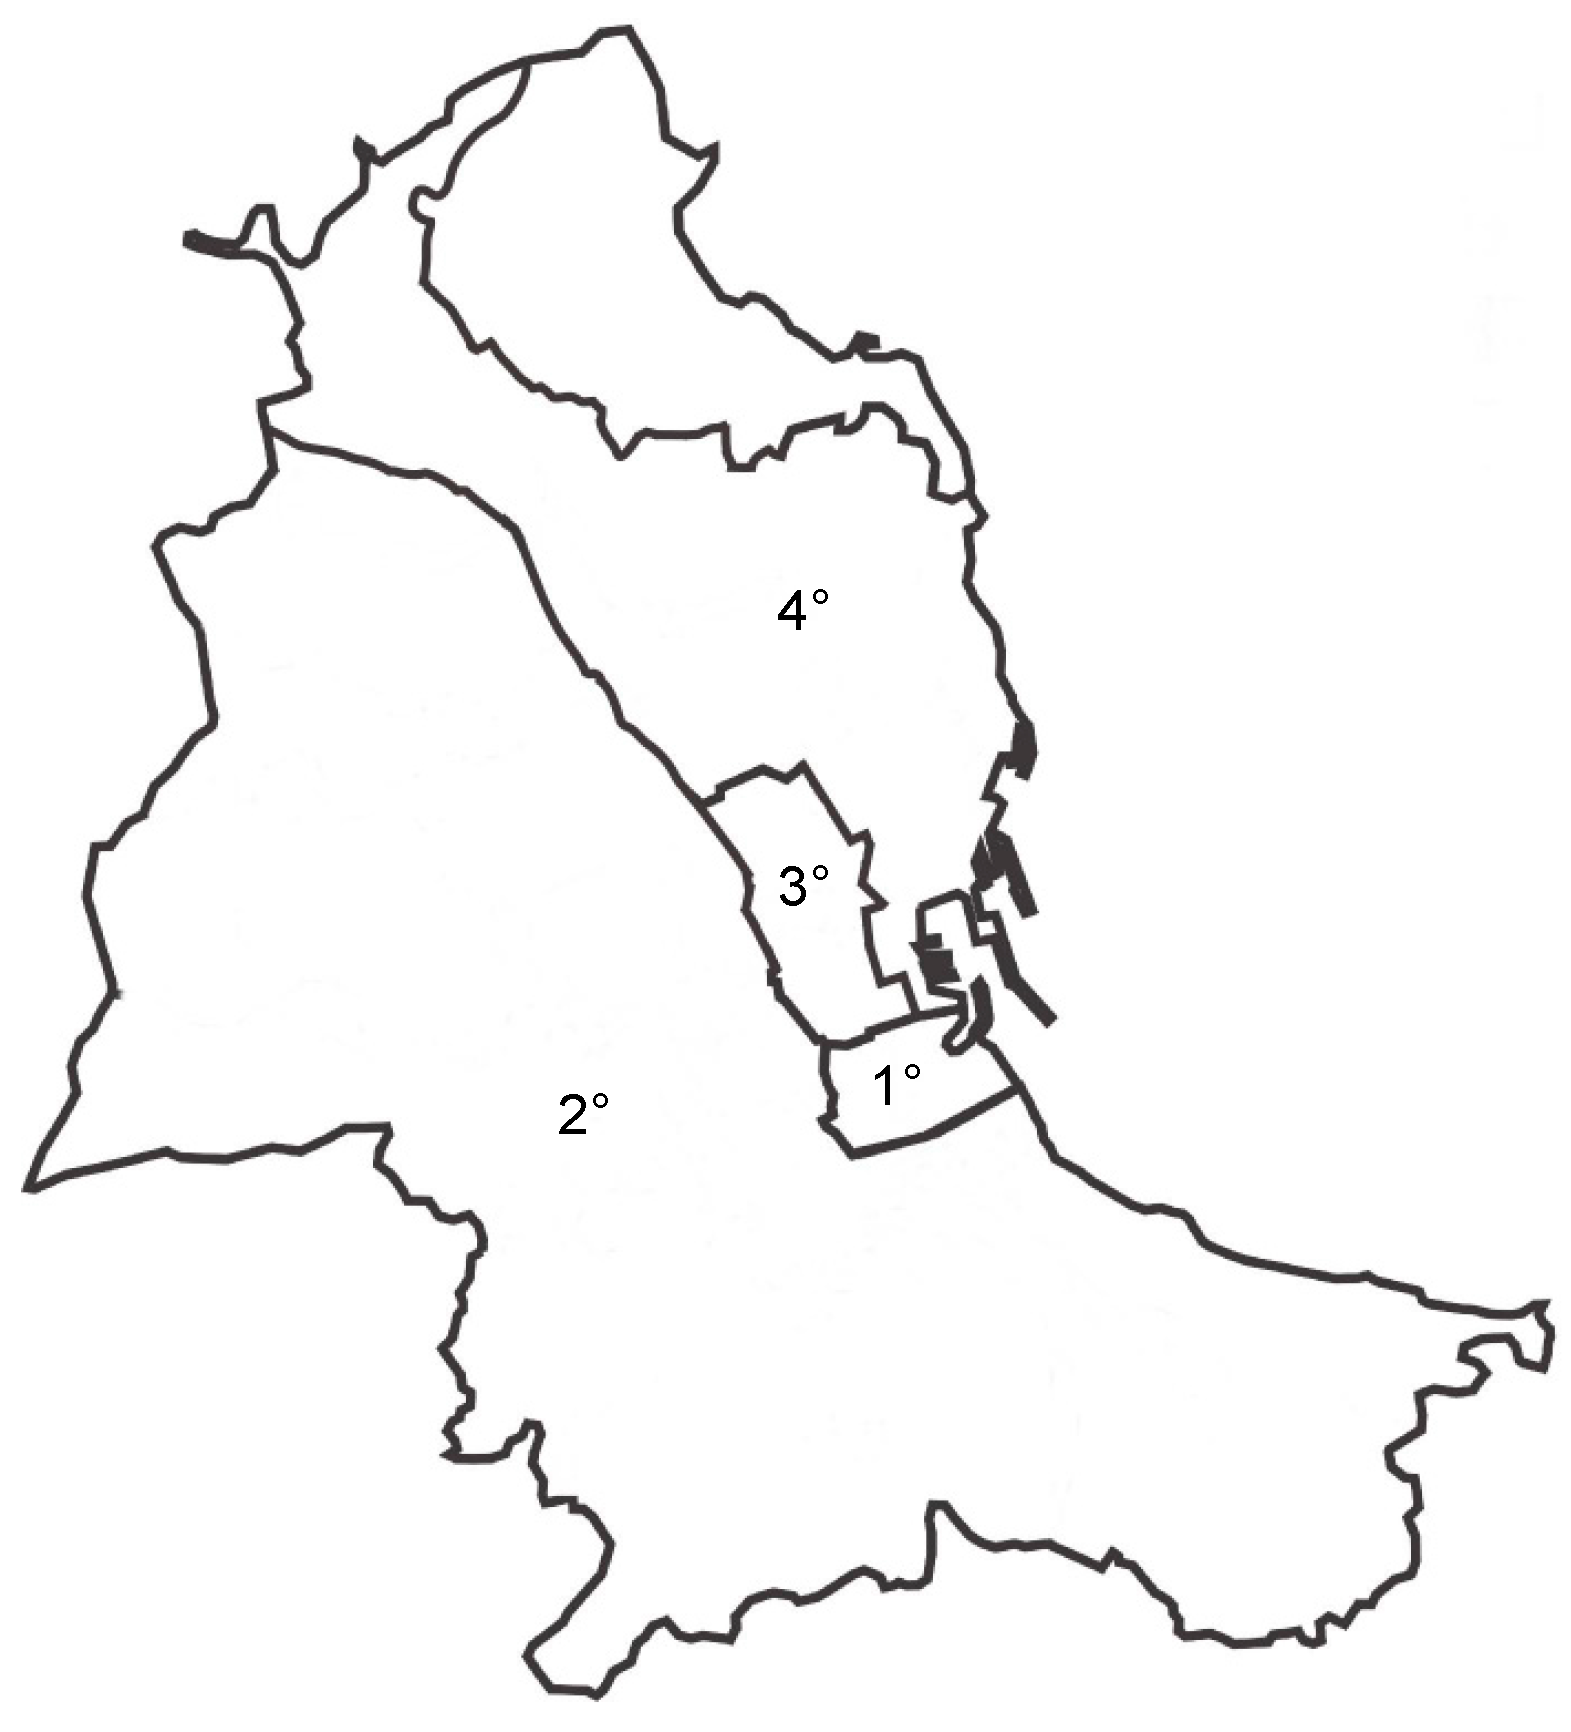
| Cadastral Data | Cadastral Income | Political Prices (by Law) | |||||
|---|---|---|---|---|---|---|---|
| Zone | Category | Class | EUR/room | EUR/sqm | EUR/sqm | Price 1 EUR/sqm | Price 2 EUR/sqm |
| 1° | A3 | 4 | 43.38 | 2.53 | 253 | 202 | 182 |
| 6 | 59.39 | 3.46 | 346 | 277 | 249 | ||
| A4 | 2 | 25.31 | 1.48 | 148 | 118 | 106 | |
| 4 | 35.12 | 2.05 | 205 | 164 | 147 | ||
| 2° | A2 | 5 | 54.23 | 3.16 | 316 | 253 | 228 |
| 6 | 64.56 | 3.76 | 376 | 301 | 271 | ||
| 7 | 77.47 | 4.52 | 452 | 361 | 325 | ||
| A3 | 4 | 41.32 | 2.41 | 241 | 193 | 173 | |
| 5 | 48.55 | 2.83 | 283 | 226 | 204 | ||
| 6 | 56.81 | 3.31 | 331 | 265 | 239 | ||
| 7 | 67.14 | 3.91 | 391 | 313 | 282 | ||
| A4 | 4 | 25.31 | 1.48 | 148 | 118 | 106 | |
| 5 | 29.44 | 1.72 | 172 | 137 | 124 | ||
| 6 | 34.60 | 2.02 | 202 | 161 | 145 | ||
| 7 | 40.80 | 2.38 | 238 | 190 | 171 | ||
| 3° | A2 | 3 | 74.89 | 4.37 | 437 | 349 | 314 |
| 4° | A2 | 7 | 64.56 | 3.76 | 376 | 301 | 271 |
| A3 | 8 | 67.14 | 3.91 | 391 | 313 | 282 | |
| A4 | 6 | 25.31 | 1.48 | 148 | 118 | 106 | |
| 7 | 29.44 | 1.72 | 172 | 137 | 124 | ||
| 8 | 34.60 | 2.02 | 202 | 161 | 145 | ||
| 5° | A2 | 3 | 44.41 | 2.59 | 259 | 207 | 186 |
| 4 | 51.65 | 3.01 | 301 | 241 | 217 | ||
| 5 | 61.98 | 3.61 | 361 | 289 | 260 | ||
| 6 | 72.30 | 4.22 | 422 | 337 | 304 | ||
| 7 | 85.20 | 4.97 | 497 | 398 | 358 | ||
| A3 | 8 | 51.65 | 3.01 | 301 | 241 | 217 | |
| Location, urbanization and accessibility | 1. Location | 1. Settlement quality; 2. Mix of functions |
| 2. Urban facilities | 1. Public facilities and services | |
| 3. Accessibility | 1. Mobility from/to the area with private transportation; 2. Mobility from/to the area with public transportation; 3. Mobility within the neighbourhood | |
| Neighbourhood characteristics | 1. Functional; 2. Symbolic characteristics | |
| Unit location within the building | 1. Panoramic quality and view; 2. Brightness; 3. Accessibility within the building | |
| Technological characteristics | 1. Building overall technological quality; 2. Unit finishes and windows quality; 3. Maintenance levels | |
| Building architectural quality | 1. Overall building decoration | |
| Unit architectural quality | 1. Size, functionality and distribution; 2. Additional surfaces; 3. Quality of finishes | |
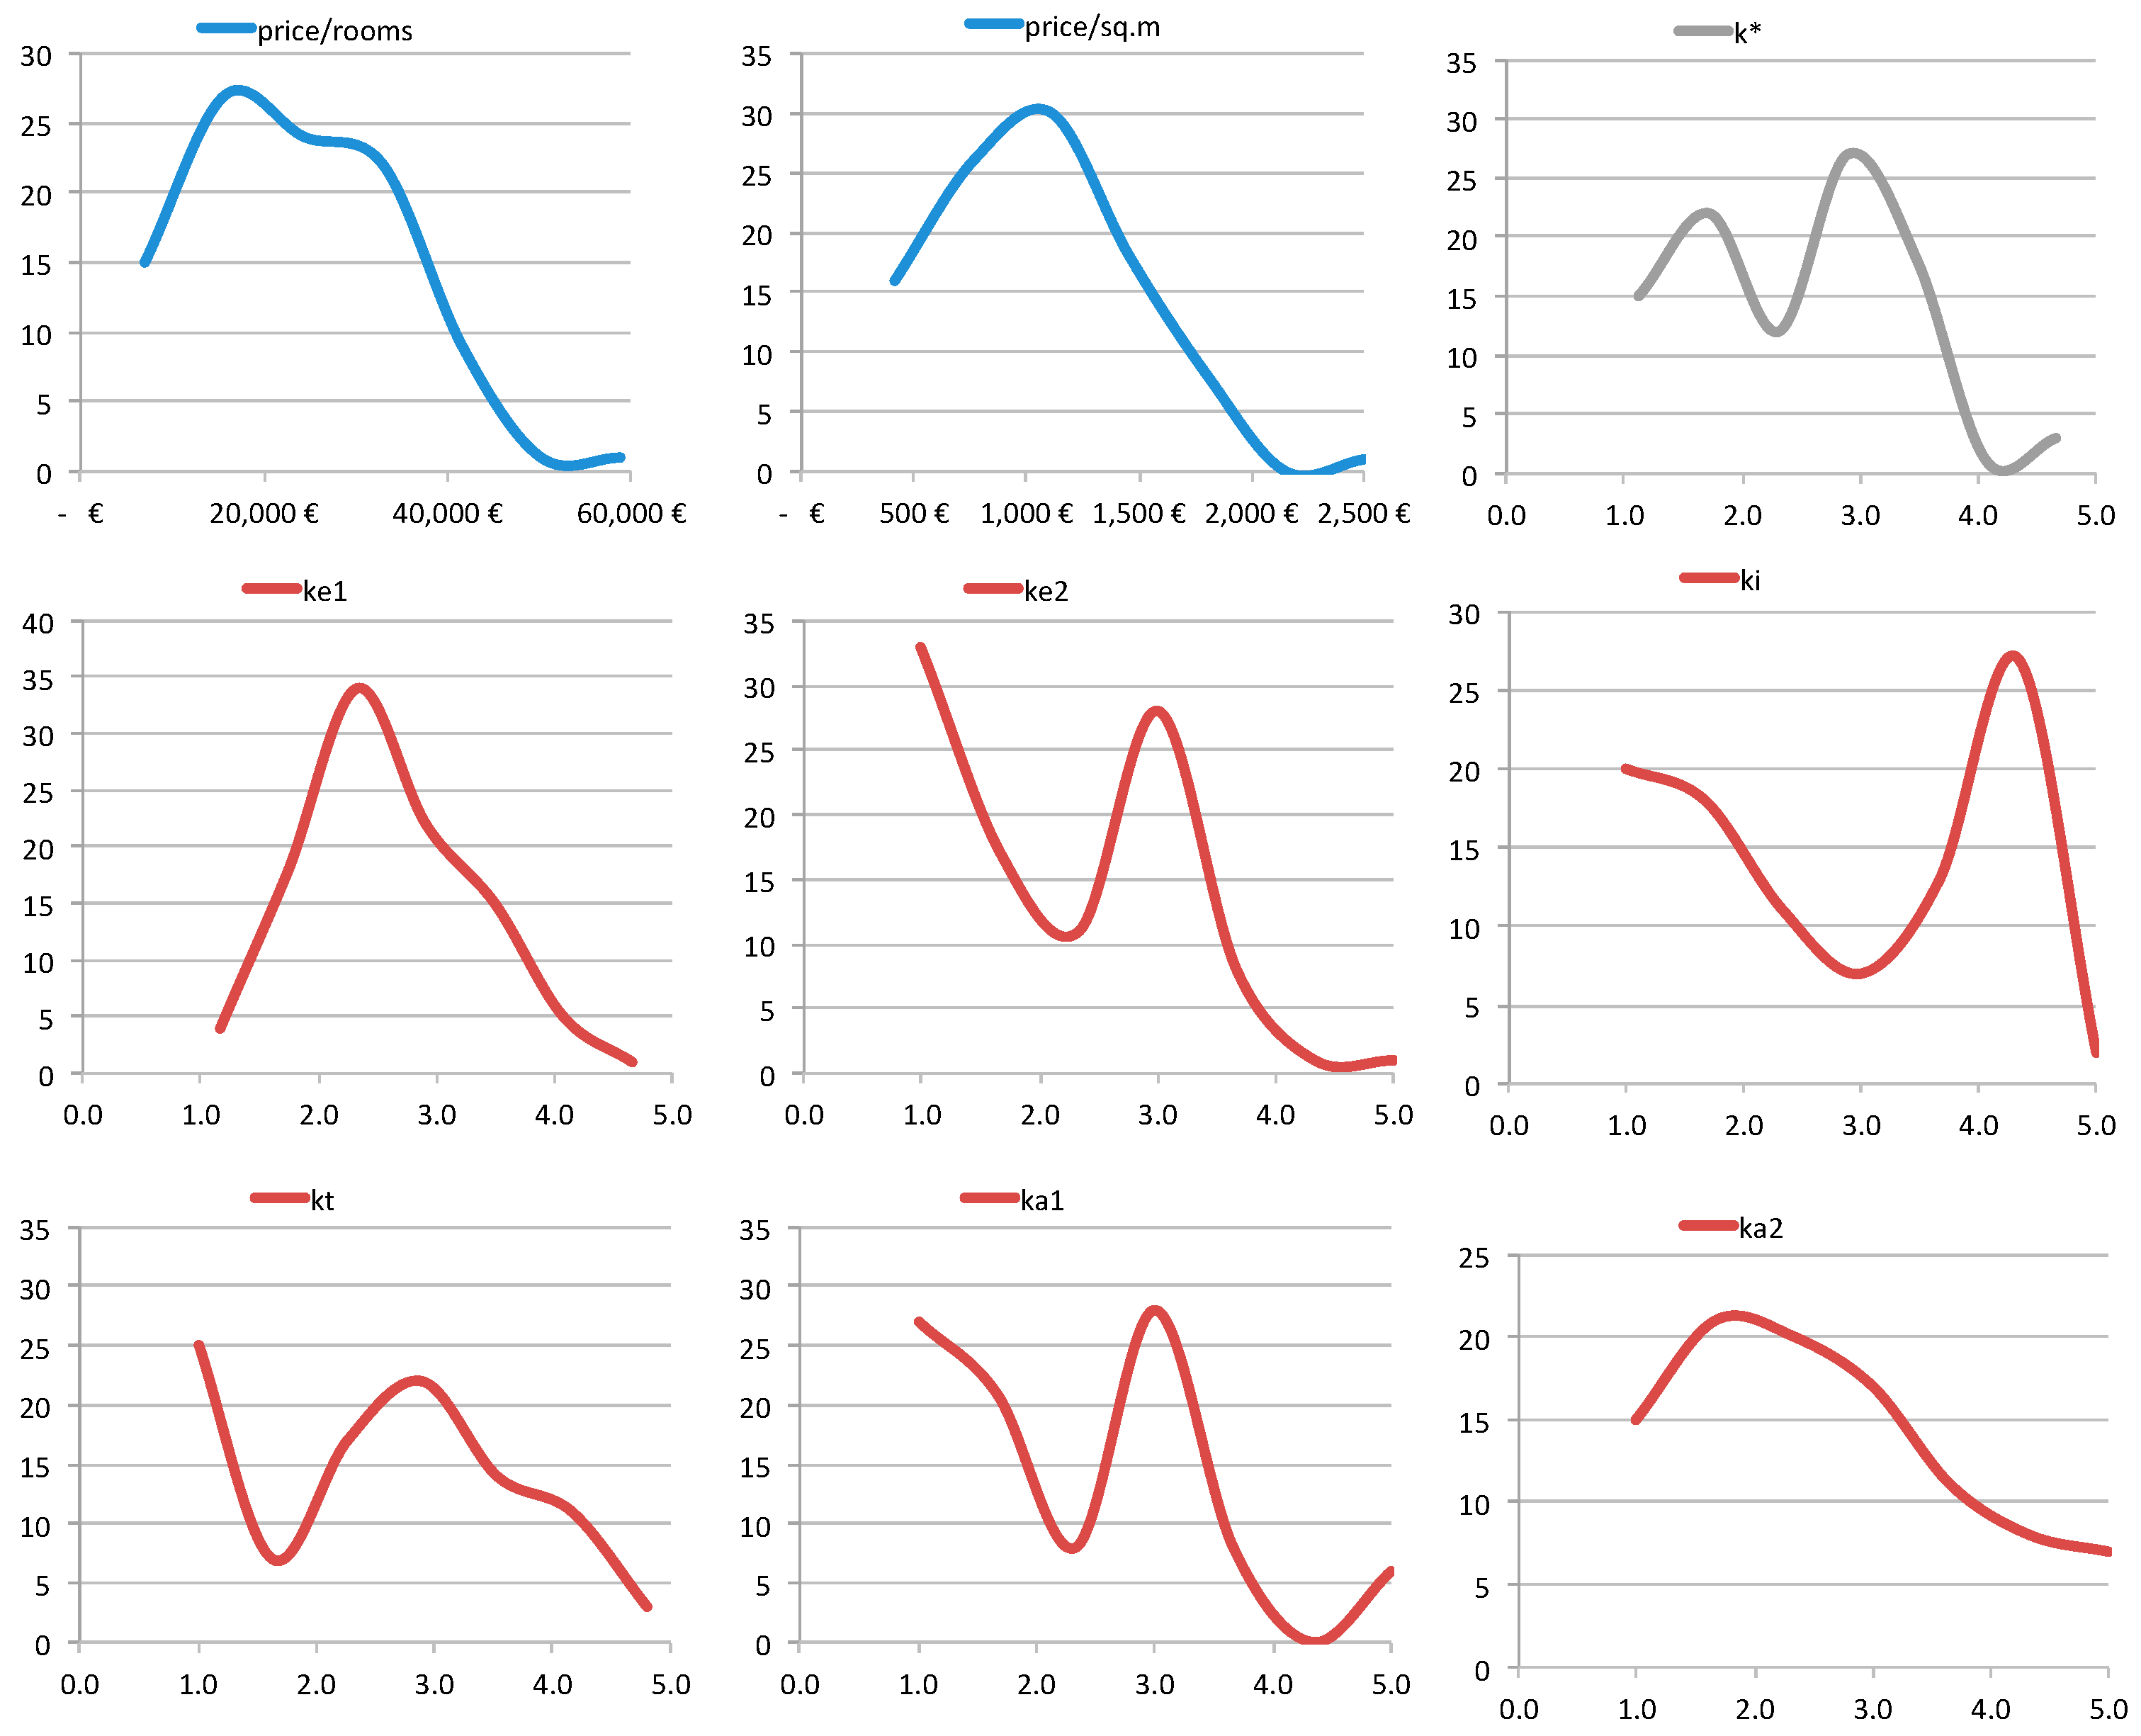
| Id. | Floor | Size | Asking Prices | Characterization | |||||||||
|---|---|---|---|---|---|---|---|---|---|---|---|---|---|
| Rooms | Surface (sq.m) | Total (EUR) | Unit (rooms) (EUR/rooms) | Unit (surf.) (EUR/sq.m) | ke1 | ke2 | ki | kt | ka1 | ka2 | k* | ||
| B01 | 5 | 5 | 110 | 165,000 | 33,000 | 1500 | 3.0 | 3.0 | 5.0 | 4.1 | 2.0 | 3.5 | 3.6 |
| B02 | 3 | 3.5 | 85 | 105,000 | 30,000 | 1235 | 3.1 | 2.0 | 1.2 | 3.5 | 3.5 | 2.6 | 2.7 |
| B03 | 2 | 4 | 98 | 145,000 | 36,250 | 1480 | 3.6 | 3.5 | 4.9 | 1.6 | 4.0 | 2.2 | 3.0 |
| B04 | 1 | 3.8 | 90 | 90,000 | 24,000 | 1000 | 2.3 | 1.5 | 3.8 | 2.0 | 1.5 | 3.0 | 2.3 |
| B05 | r | 2.3 | 37 | 45,000 | 20,000 | 1216 | 3.9 | 4.5 | 3.8 | 3.0 | 1.0 | 1.8 | 3.3 |
| B06 | r | 2.5 | 52.8 | 25,000 | 10,000 | 474 | 1.6 | 1.0 | 2.4 | 1.0 | 1.0 | 1.0 | 1.3 |
| B07 | r | 3.5 | 87.5 | 139,000 | 39,714 | 1589 | 4.0 | 2.5 | 3.1 | 2.7 | 1.5 | 3.2 | 2.9 |
| B08 | 7 | 3.8 | 110.0 | 107,000 | 28,533 | 973 | 2.4 | 2.0 | 4.6 | 2.8 | 2.5 | 2.6 | 2.8 |
| B09 | 1 | 4.8 | 120.0 | 215,000 | 45,263 | 1792 | 4.0 | 3.5 | 4.4 | 4.3 | 3.0 | 4.8 | 4.1 |
| B10 | 3 | 4.8 | 100.0 | 95,000 | 20,000 | 950 | 2.5 | 1.5 | 1.5 | 2.8 | 2.0 | 1.9 | 2.2 |
| B11 | r | 3.5 | 85.0 | 75,000 | 21,429 | 882 | 2.6 | 1.0 | 2.4 | 1.0 | 1.0 | 1.0 | 1.5 |
| B12 | 2 | 1.8 | 40.0 | 42,000 | 24,000 | 1050 | 1.6 | 1.0 | 1.7 | 2.8 | 2.0 | 1.7 | 2.0 |
| B13 | 1 | 2.5 | 34.0 | 25,000 | 10,000 | 735 | 3.1 | 3.5 | 3.1 | 1.2 | 2.0 | 1.0 | 2.3 |
| B14 | 3 | 5.3 | 115.0 | 220,000 | 41,905 | 1913 | 2.3 | 4.0 | 4.9 | 3.8 | 3.5 | 3.7 | 3.7 |
| B15 | 9 | 5.0 | 181.8 | 180,000 | 36,000 | 990 | 2.1 | 2.0 | 4.2 | 3.0 | 3.0 | 4.0 | 2.9 |
| B16 | 5 | 4.5 | 110.0 | 155,000 | 34,444 | 1409 | 3.5 | 2.5 | 4.4 | 3.8 | 3.0 | 3.3 | 3.5 |
| B17 | 6 | 6.0 | 150.0 | 190,000 | 31,667 | 1267 | 2.8 | 2.5 | 4.3 | 4.7 | 5.0 | 4.3 | 3.9 |
| B18 | 6 | 2.8 | 75.0 | 77,000 | 28,000 | 1027 | 1.9 | 1.5 | 4.0 | 2.4 | 1.5 | 1.8 | 2.3 |
| B19 | 1 | 3.8 | 120.0 | 170,000 | 45,333 | 1417 | 3.1 | 3.0 | 2.3 | 4.7 | 5.0 | 5.0 | 3.8 |
| B20 | 1 | 2.5 | 55.0 | 45,000 | 18,000 | 818 | 2.5 | 1.0 | 1.5 | 2.7 | 1.5 | 2.0 | 2.0 |
| B21 | 4 | 4.8 | 112.0 | 65,000 | 13,684 | 580 | 2.9 | 2.0 | 1.6 | 1.2 | 3.0 | 3.0 | 2.0 |
| B22 | 4 | 5.8 | 110.0 | 225,000 | 39,130 | 2045 | 3.5 | 4.0 | 4.7 | 3.8 | 3.5 | 5.0 | 4.0 |
| B23 | 6 | 2.5 | 50.0 | 65,000 | 26,000 | 1300 | 2.8 | 4.0 | 4.6 | 3.1 | 4.0 | 2.5 | 3.5 |
| B24 | 9 | 3.8 | 90.0 | 175,000 | 46,667 | 1944 | 3.5 | 3.5 | 4.6 | 3.9 | 3.0 | 3.5 | 3.8 |
| B25 | 2 | 5.0 | 100.0 | 68,000 | 13,600 | 680 | 2.8 | 1.0 | 1.0 | 1.2 | 1.0 | 1.3 | 1.4 |
| Location | Political Price (P) | Characterization | Estimated Market Price (E) | OMI Zone | OMI Price (O) | Ratio (P/E) *100 | Ratio (P/O) *100 | ||||||
|---|---|---|---|---|---|---|---|---|---|---|---|---|---|
| id | District | Street/Square | EUR/sq.m | ke1 | ke2 | ki | kt | ka2 | EUR/sq.m | id | EUR/sq.m | % | % |
| 1 | V | Petralie (IACP-L. 745) | 133 | 1.0 | 1.0 | 1.5 | 1.5 | 2.0 | 502 | E19 | 800 | 26 | 17 |
| 2 | V | Erice (IACP-L. 745) | 163 | 1.0 | 1.5 | 3.5 | 2.0 | 2.0 | 738 | E19 | 800 | 22 | 20 |
| 3 | VI | Carreca | 139 | 1.0 | 2.0 | 4.0 | 2.0 | 3.0 | 875 | E19 | 800 | 16 | 17 |
| 4 | V | Erice (IACP-L. 745) | 182 | 1.0 | 1.5 | 2.0 | 2.0 | 2.0 | 625 | E19 | 800 | 29 | 23 |
| 5 | VI | Florio | 163 | 4.0 | 2.0 | 3.5 | 2.5 | 2.0 | 1113 | E15 | 880 | 15 | 19 |
| 6 | V | Erice (IACP-L. 745) | 229 | 1.0 | 1.5 | 1.5 | 2.0 | 2.0 | 601 | E19 | 800 | 38 | 29 |
| 7 | V | Brancato | 180 | 4.0 | 2.0 | 2.0 | 3.0 | 3.0 | 1140 | B3 | 880 | 16 | 20 |
| 8 | VI | Calandrucci | 139 | 2.5 | 1.5 | 1.5 | 2.0 | 2.0 | 763 | E19 | 800 | 18 | 17 |
| 9 | VI | Centorbe | 139 | 2.5 | 2.0 | 1.5 | 2.0 | 2.0 | 800 | E19 | 800 | 17 | 17 |
| 10 | VI | Centorbe | 139 | 2.5 | 2.0 | 2.5 | 2.0 | 2.0 | 849 | E19 | 800 | 16 | 17 |
| 11 | VI | Paladini | 139 | 3.0 | 2.5 | 3.0 | 2.0 | 2.5 | 989 | E19 | 800 | 14 | 17 |
| 12 | VI | Ragusa | 139 | 2.5 | 2.5 | 1.5 | 2.5 | 2.5 | 911 | E19 | 800 | 15 | 17 |
| 13 | VI | Ragusa | 139 | 2.5 | 2.5 | 3.0 | 2.5 | 2.5 | 984 | E19 | 800 | 14 | 17 |
| 14 | VI | Rossi | 155 | 2.5 | 2.5 | 1.5 | 2.5 | 2.0 | 891 | E19 | 800 | 17 | 19 |
| 15 | VI | Rossi | 155 | 2.5 | 2.5 | 2.0 | 2.5 | 2.0 | 916 | E19 | 800 | 17 | 19 |
| 16 | V | Nicosia (IACP-L. 745) | 161 | 1.0 | 1.5 | 1.5 | 2.0 | 2.0 | 601 | E19 | 800 | 27 | 20 |
| 17 | V | Nicosia (IACP-L. 745) | 149 | 1.0 | 1.5 | 1.5 | 2.0 | 2.0 | 601 | E19 | 800 | 25 | 19 |
| 18 | VI | Paladini | 139 | 3.0 | 2.5 | 1.0 | 2.0 | 2.5 | 892 | E19 | 800 | 16 | 17 |
| 19 | VI | Scaglione | 164 | 1.5 | 2.5 | 3.5 | 1.5 | 1.5 | 752 | E19 | 800 | 22 | 20 |
| 20 | VI | Michelangelo | 139 | 3.0 | 2.5 | 3.5 | 2.5 | 2.0 | 1043 | E19 | 800 | 13 | 17 |
| 21 | VI | Alibrandi | 150 | 3.3 | 1.0 | 2.0 | 1.5 | 1.5 | 754 | E19 | 800 | 20 | 19 |
| 22 | VI | Calandrucci | 118 | 2.5 | 1.5 | 1.5 | 2.0 | 2.0 | 763 | E19 | 800 | 15 | 15 |
| 23 | VI | Michelangelo | 139 | 3.0 | 2.5 | 3.5 | 3.0 | 2.5 | 1119 | E19 | 800 | 12 | 17 |
| 24 | VI | Paladini | 150 | 2.5 | 1.5 | 2.5 | 2.0 | 2.0 | 811 | E19 | 800 | 18 | 19 |
| 25 | VI | Paladini | 139 | 2.5 | 1.5 | 2.0 | 2.0 | 2.0 | 787 | E19 | 800 | 18 | 17 |
| 26 | VI | Zumbo | 139 | 2.5 | 2.0 | 1.5 | 1.5 | 2.5 | 771 | E19 | 800 | 18 | 17 |
| 27 | V | Agostino | 158 | 3.5 | 2.5 | 2.5 | 3.0 | 3.0 | 1148 | C5 | 880 | 14 | 18 |
| 28 | V | L’Emiro | 163 | 3.5 | 2.5 | 3.0 | 3.0 | 3.0 | 1172 | C5 | 880 | 14 | 19 |
| 29 | V | Casalini | 145 | 2.0 | 4.0 | 1.5 | 3.0 | 3.0 | 1051 | E20 | 860 | 14 | 17 |
| 30 | VI | Zumbo | 139 | 2.5 | 2.0 | 1.0 | 1.5 | 2.5 | 747 | E19 | 800 | 19 | 17 |
| 31 | V | Agostino | 169 | 3.5 | 2.5 | 3.0 | 3.0 | 3.0 | 1172 | C5 | 880 | 14 | 19 |
| 32 | VI | Paladini | 139 | 3.0 | 2.5 | 3.5 | 2.5 | 2.0 | 1043 | E20 | 860 | 13 | 16 |
| Statistical | Prices | Ratio | Differentials | ||||
|---|---|---|---|---|---|---|---|
| Index | Political (P) | OMI (O) | Estimated (E) | P/E | P/O | E–P | O–P |
| EUR/sq.m | EUR/sq.m | EUR/sq.m | No. | No. | EUR/sq.m | EUR/sq.m | |
| Min | 118 | 800 | 502 | 0.12 | 0.15 | 370 | 571 |
| Average | 151 | 816 | 873 | 0.18 | 0.19 | 722 | 665 |
| Median | 142 | 800 | 862 | 0.16 | 0.17 | 723 | 661 |
| Max | 229 | 880 | 1172 | 0.38 | 0.29 | 1009 | 722 |
| SD | 20 | 31 | 188 | 0.06 | 0.02 | 191 | 33 |
| RSD% | 13% | 4% | 22% | 31% | 13% | 26% | 5% |
| Differentials between Prices | ||
|---|---|---|
| Estimated–Political E–P EUR | OMI–Political O–P EUR | |
| Total | 2,661,757 | 2,400,460 |
© 2019 by the authors. Licensee MDPI, Basel, Switzerland. This article is an open access article distributed under the terms and conditions of the Creative Commons Attribution (CC BY) license (http://creativecommons.org/licenses/by/4.0/).
Share and Cite
Napoli, G.; Giuffrida, S.; Trovato, M.R. Efficiency versus Fairness in the Management of Public Housing Assets in Palermo (Italy). Sustainability 2019, 11, 1199. https://doi.org/10.3390/su11041199
Napoli G, Giuffrida S, Trovato MR. Efficiency versus Fairness in the Management of Public Housing Assets in Palermo (Italy). Sustainability. 2019; 11(4):1199. https://doi.org/10.3390/su11041199
Chicago/Turabian StyleNapoli, Grazia, Salvatore Giuffrida, and Maria Rosa Trovato. 2019. "Efficiency versus Fairness in the Management of Public Housing Assets in Palermo (Italy)" Sustainability 11, no. 4: 1199. https://doi.org/10.3390/su11041199
APA StyleNapoli, G., Giuffrida, S., & Trovato, M. R. (2019). Efficiency versus Fairness in the Management of Public Housing Assets in Palermo (Italy). Sustainability, 11(4), 1199. https://doi.org/10.3390/su11041199