1. Introduction
At the Rio +20 Summit in 2012 a new set of global goals was defined to take effect on the expiry of the previous UN Millennium Development Goals (MDGs [
1]). In September 2015, 193 Member States of the United Nations approved the 17 Sustainable Development Goals for the 2030 Agenda. The SDGs are a set of global objectives common to all countries: developed and developing, poor and rich. They imply involvement of nations and local authorities, the public sector and individual citizens, multinational companies, and family businesses. The SDG framework promotes economic development, social inclusion, and environmental protection in all nations of the world, in an atmosphere of peace and justice, strong institutions, and international collaboration.
The Sustainable Development Solutions Network (SDSN) is a new organism of the United Nation created to support implementation of the SDGs and to promote cooperation between universities, civil society and the private sector. It is divided into regional sectors: SDSN Mediterranean is hosted by the University of Siena, and includes all countries bordering the Mediterranean Sea.
The Mediterranean region is unique by virtue of its climate, diet, ecosystems, biological diversity, history, and cultural heritage. Despite these common features, there are significant socioeconomic differences between the Northern Mediterranean Countries (NMCs) and the Southern and Eastern Mediterranean Countries (SEMC). A challenge for the Mediterranean area is the sustainability of the agro-food system, seriously threatened by climate change, population growth, water scarcity, food insecurity, unsustainable agricultural practices, and low profitability of small holders. For this purpose, the Partnership for Research and Innovation in the Mediterranean area (PRIMA) has been recently launched, a joint research and innovation program among the Euro-Mediterranean countries, aimed at promoting sustainable management of agro-food systems and water resources in the region and contributing to achievement of the SDGs.
The partnership is a ten-year initiative (2018–2028) to tackle the evolving challenges affecting agro-food sustainability in the region. It is set in the context of the several policies adopted to strengthen Euro-Mediterranean cooperation towards prosperity and stability in the region, i.e., the Euro-Mediterranean partnership, also known as the Barcelona process, begun in 1995, the European Neighborhood policy of 2003, and the Union for the Mediterranean of 2011.
In order to monitor the progress induced, directly and indirectly, by the PRIMA program a set of indicators, based on SDGs, has been identified, able to detect improvements during its time span [
2]. The problem that remains unsolved is how to synthesize the information of the different indicators in a proper way, without losing information.
In the context of the Sustainable Development Goals (SDGs), several attempts have been conducted by international bodies and single researchers in order to propose approaches able to meet the requirements of the UN 2030 Agenda. These contributions have produced hundreds of indicators, which are often not in line with general properties that guarantee statistical quality (such properties are, for example, defined by OECD or Eurostat) and, more specifically, are not able to summarize the information to be used by policy makers or other researchers. Other two relevant studies that produce an overall index on Mediterranean countries and on topics of interest for the PRIMA Program, are (i) the SDG Index and (ii) the Food Sustainability Index.
(i) The UN Sustainable Development Solutions Network (SDSN) issued and annual report presenting the SDG Index and Dashboards [
3,
4]. It is a composite index that aggregates available data on 99 indicators to monitor all the 17 SDGs measuring performance on the 2030 Agenda for 156 countries (in the last edition).
(ii) The Barilla Center for Food and Nutrition Foundation (BCFN) is a private non-profit institution devoted to foster more sustainable agro-food systems in order to face the global challenges related to food and nutrition. It has developed, in collaboration with the Economist Intelligence Unit (EIU), the Food Sustainability Index (FSI) to assess the sustainability of the country agro-food systems.
Further to these two context-specific indices, the literature is rich of methods and applications for the construction of multidimensional indicators. For instance, Kaklauskas et al. [
5] jointly consider trends relevant to environmental sustainability—Ecological Footprint (EF) and the Environmental Performance Index (EPI)— and Quality of Life Index (QLI) in 15 republics of the former Soviet Union over the past 25 years, while Liang et al. [
6] develop a composite index to measure the multidimensional concept of industrialization efficiency.
Another group of authors, instead, propose to use several indicators in multicriteria or multi-attribute decision-making methods; Lehner et al. [
7] identify indicators for the sustainable development of cities that have the greatest potential for their underlying data to be measured by means of remote sensing. They then investigated Multicriteria Decision-Making (MCDM) weighting methods to identify the most relevant quality of life indicators that can be captured by means of remote sensing techniques. Haeruddin et al. [
8] aim to produce a model of integration of poverty data management, and MCDM methods in a management system framework that can manage data criteria and indicators, source data, poverty alleviation program data, and citizen data. Debnath et al. [
9] analyze the framework of corporate social responsibility assessment (CRS) practices on identification of five criteria and 17 indicators encompassing the strategies of accountability, transparency, and compliance of CSR. To achieve the goal, strategies have been defined in connection with different literatures and quaternary survey for criteria selection, where the criteria are expressed in a fuzzy horizon, however quite different from the approach proposed in our paper.
Another paper attempting to develop a framework for the assessment of corporate environmental performance is Escrig-Olmedo et al. [
10], based on the application of a fuzzy MCDM method. An MCDM technique has also been applied by Sayed et al. [
11] in the human development index (HDI) framework: such a methodology, defined as Goal Programming Benefit-of-the-Doubt (GP-BOD), shows a good solution to the so-called ranking contradictions problem in countries’ rankings. Well-being multidimensional indicators have been treated also by Hu et al. [
12], where imprecise information is introduced in a fuzzy MCDM model for addressing the complex interrelationships among all indicators.
Starting from already known approaches of MCDM, Hashemkhani Zolfani et al. [
13] tried to innovate by presenting future-oriented models using Multiple Attribute Decision-making (PMADM) as a specific approach. Siksnelyte et al. [
14] perform a very extensive overview of the application of decision-making methods in dealing with sustainable energy development issues, which could be very useful for identifying pros and cons of methods presented so far. Other interesting contributions in the literature on this issue are Kaklauskas et al., Streimikiene et al., Dahooie et al., Kveselis et al. [
15,
16,
17,
18].
This paper is inserted in the context of such literature, by proposing a new methodological framework for the identification of the most appropriate indicators, and for the estimation of the multidimensional nature of sustainable development; in this regard, it presents an innovative “Fuzzy Multidimensional Index” in order to measure the performance of countries with a focus on agro-food sustainability. In particular, the focus is on Mediterranean countries with the aim of providing policy makers useful and concise information to measure the performance of such countries in the context of the PRIMA program. The 17 countries involved in this program are those bordering (or very close in the case of Jordan and Portugal) the Mediterranean Sea, namely, NMCs Croatia, Cyprus, France, Greece, Italy, Malta, Portugal, Slovenia, and Spain, and SEMCs Algeria, Egypt, Israel, Jordan, Lebanon, Morocco, Tunisia, and Turkey.
For this purpose, drawing on the fuzzy approach developed by Betti et al. [
19], a step-by-step procedure is developed: the underlying dimensions of a set of selected indicators for the SDGs are identified by exploratory factor analysis (EFA [
20]); an innovative weighting method is applied to aggregate the indicators to calculate the country scores for each dimension and an overall index defined as Fuzzy Multidimensional.
2. Methods and Materials
Several methodological studies on multidimensional indices have been developed in the recent years especially in the fields of sustainability [
3,
4,
21], quality of life [
22,
23,
24], and poverty [
13,
25,
26,
27,
28,
29,
30,
31].
Among these works, noteworthy are those based on the fuzzy logic. In fact, the fuzzy set theory has shown to be a powerful tool to describe the multidimensionality and complexity of social phenomena replacing the classical crisp approach, which generally tends to overestimate or underestimate social dynamics.
The fuzzy set theory, introduced by Zadeh [
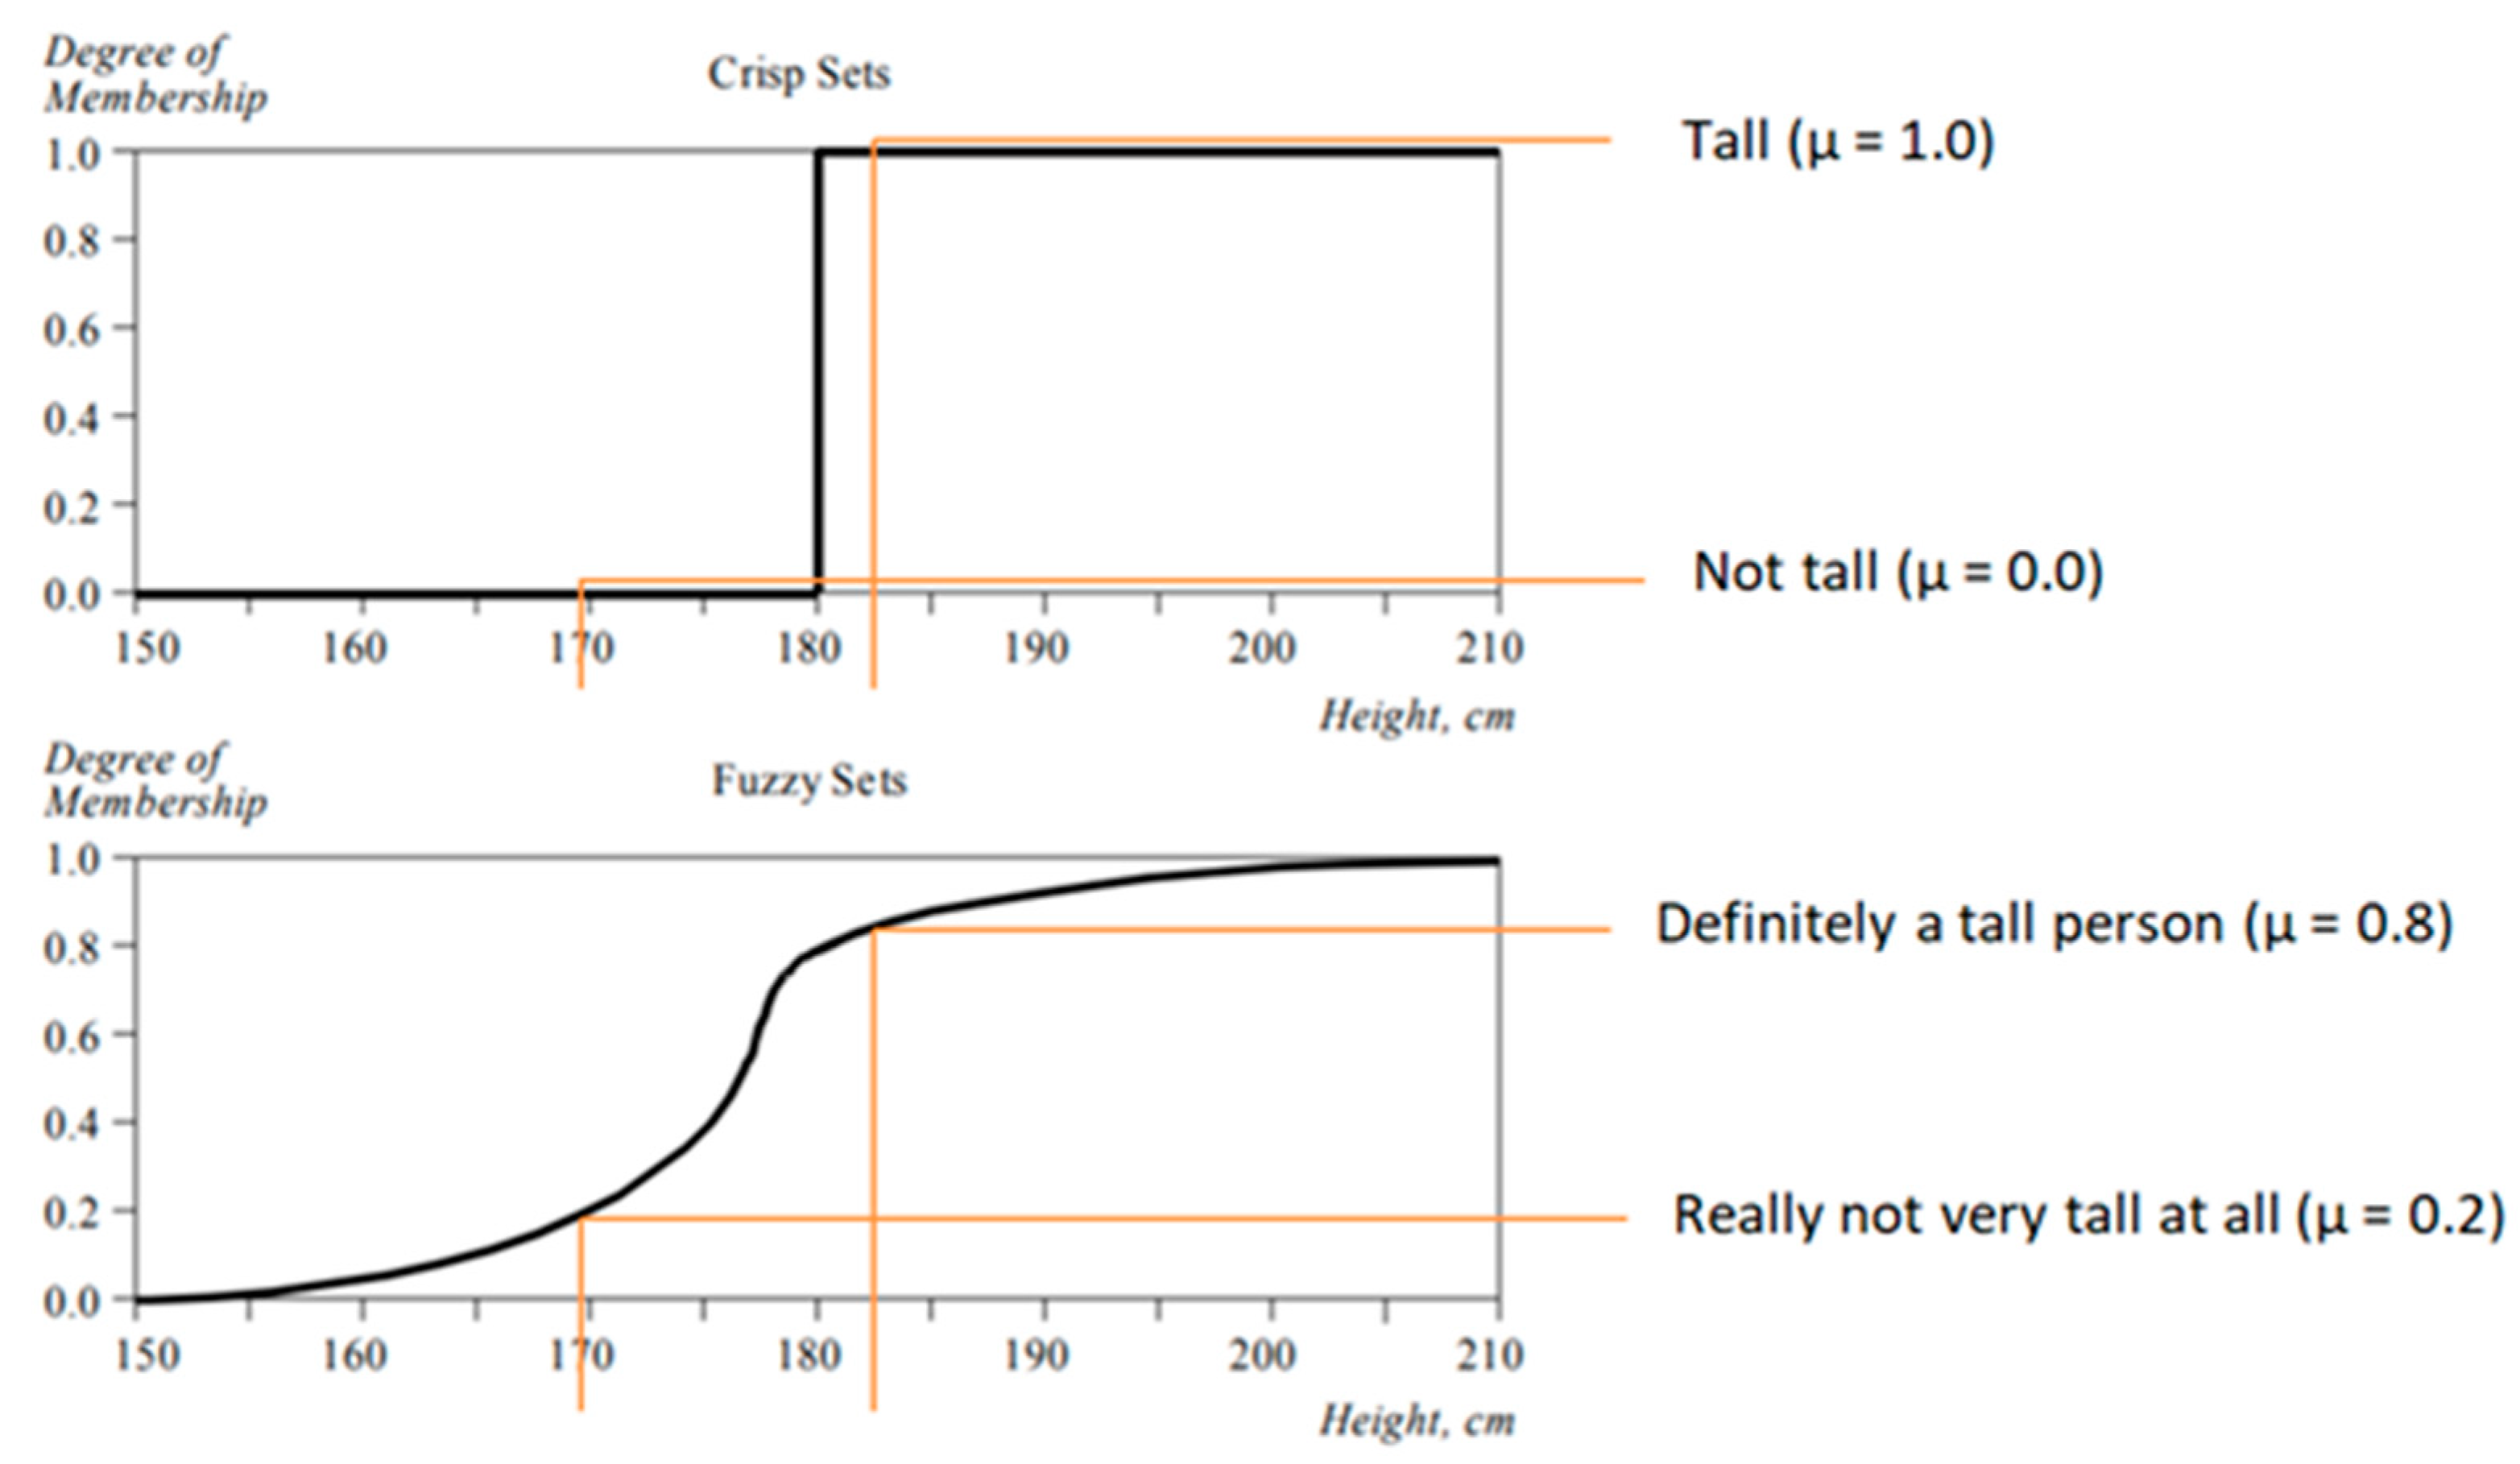
32], emerged in response to the evidence that real situations are often characterized by imprecision, uncertainty and vagueness and cannot be properly described by the classical set theory representing reality in a simple true-false binary logic. Indeed, in the classical crisp approach the sets are characterized by sharp and clearly defined boundaries and thus an item may fully belong or does not belong at all to a set according to a bivalent condition. On the contrary, in fuzzy set theory, an item may belong to a set with partial degrees of membership between 0 and 1 and not only with the extreme values. A fuzzy set is a collection of elements with a continuum of grades of membership and it is characterized by a membership function defining to what extent an element belongs to the set, that is the grade of membership for the elements of a given set.
According to Zimmerman [
33], “if X is a collection of objects denoted generically by x, then a fuzzy set A in X is a set of ordered pairs
where
is called the membership function or grade of membership/degree of truth of x in A. It maps each element of X to a membership value between 0 and 1”.
As shown in the commonly used example of tall people (
Figure 1), the crisp approach identifies whether a person is tall or not in binary terms over the interval {0,1}. In this case, tall men are those above 180 cm, and not tall men those below 180 cm. The fuzzy approach, instead, describes how tall a person is through a membership function, which defines how each height value is mapped to a membership value over the interval [0, 1]. All people belong to the fuzzy set “tall people”, but their degrees of membership depend on their height. Indeed, the concept of tall person cannot often be sharply defined as it may be ambiguous and may depend on each individual’s perception.
Therefore, fuzzy logic allows considering truth as a matter of degree in the whole interval [0, 1] rather than a simple {0,1} dichotomy.
The methodological proposal for the construction of a multidimensional index for sustainability assessment is hence based on the fuzzy set theory. In particular, it draws on the fuzzy approach proposed by Betti et al. [
19] to build a multidimensional index of poverty and deprivation. This approach relies on the contributions of [
25,
26,
35] and it has been further elaborated in Betti et al. [
29]. It considers poverty and deprivation as a matter of degree overcoming the simple dichotomization of the population into poor and non-poor with respect to a given poverty line. The state of deprivation is described by monetary and also non-monetary aspects of living conditions, defined respectively as Fuzzy Monetary (FM) and Fuzzy Supplementary (FS). The propensity to poverty and deprivation for any individual of rank
j, that is the degree of monetary and non-monetary deprivation, is quantitatively specified through the following generalized form of membership function.
where
X is the equivalized income in the monetary deprivation or the overall score
s in the non-monetary deprivation;
wγ is the sample weight of individual of rank
γ and
αK (
K = 1,2) are two parameters corresponding, respectively, to monetary and non-monetary dimensions of deprivation. Each parameter α
K is estimated so that the mean of the corresponding membership function is equal to the at-risk-of-poverty rate (ARPR) computed on the basis the official poverty line.
and
are the normalized distribution of income and the value of the Lorenz curve for any individual of rank
j, respectively. Therefore,
represents the proportion of individuals less poor than a given person (as in Cheli and Lemmi [
26]) while
indicates the share of the total equivalized income received by all individuals less poor than a given person (as in Betti and Verma [
36]). Both the parameters
αK have thus an economic interpretation: the mean of the membership functions is expressible in terms of the generalized Gini measure
, a generalisation of the standard Gini coefficient:
= ARPR.
For non-monetary deprivation, Betti et al. [
19] provides the following step-by-procedure to combine different supplementary indicators of living conditions into a composite index:
Selection of meaningful and useful indicators for the analysis.
Transformation of the indicators into the [0, 1] interval.
Identification of underlying dimensions through exploratory and confirmatory factor analysis.
Calculation of weights within each dimension.
Calculation of scores for each dimension.
Calculation of an overall score and the parameter α of the m.f.
Construction of fuzzy supplementary indicators in each dimension and overall.
After the indicators selection, their normalization and the identification of the latent dimensions, the indicators are weighted within each dimension to calculate the scores of any individual
i for each dimension (step 5) using the methodology of the Second European report on Poverty, Income and Social Exclusion [
28]:
where
is the weight of the
j-th indicator in the
h-th dimension
.
The weights to be assigned to a given item within each dimension (step 4) are calculated using the “prevalence-correlation” method proposed by Betti and Verma [
36] taking into account both the dispersion of a deprivation indicator (prevalence weights) and its correlation with the other deprivation indicators in a given dimension (correlation weights).
The dispersion of a deprivation indicator is the coefficient of variation of the complement to one of the deprivation scores s. Thus, the weights for the items affecting a large proportion of the population are low and on the opposite, the items with lower dispersion get higher weights since these can be respectively considered less/more critical in describing deprivation. The correlation among indicators within a given dimension ( is computed in a way through which low weights are given to the indicators more highly correlated with others in the same dimension to limit the effect of redundancy and arbitrariness in assigning weights to the indicators.
The final weights for the indicators are hence calculated as
Then, the overall score, which is the non-monetary indicator FS for any individual i, is calculated (step 6) with the following arithmetic mean.
These values are then used in the m.f. to calculate the parameter α2, so that the mean of the FS values is equal to the conventional at-risk-of-poverty rate (ARPR).
Finally, the estimated parameter α2 is used in the m.f to calculate the FS indicators for each dimension of deprivation and overall.
This multidimensional methodology has proved to be robust and applicable also to other fields besides poverty (among others, [
22,
23,
24,
37,
38,
39,
40]). In this context, we have introduced a methodological proposal for a new fuzzy approach in the field of sustainability assessment.
In order to select suitable statistically sound indicators for the Fuzzy Multidimensional Index —i.e., in order to implement step 1 of the step-by-step procedure described above—we first analyzed the statistical quality of the main datasets available for SDGs indicators by examining both primary and secondary sources. We used six criteria identified on the basis of internationally recognized criteria for data quality [
41]:
Completeness: the indicators provided by a compiling agency have to cover most SDGs.
Availability (coverage): data had to be available for most of the Mediterranean countries considered in this analysis.
Clarity: data had to be clear and understandable.
Timeliness: data had to be promptly available for recent years.
Comparability over time (ability to monitor): data on the same phenomenon had to be comparable at different points in time.
Comparability between indicators (internal): data had to be compiled in a statistically reliable and valid manner using common standards, definitions, classifications and units in the different sources and countries.
In line with these criteria, among primary sources we evaluated the data bases of the main agencies that compile the official UN SDG indicators, namely, UN organizations (described in details below in
Section 2.1) and Eurostat, which is the principal institution providing indicators for SDGs in an EU context. Among secondary sources, we investigated compliance of the datasets used by SDSN in the SDG Index [
4] and those of CIHEAM (International Centre for Advanced Mediterranean Agronomic Studies) and the BCFN Foundation (Barilla Centre for Food and Nutrition Foundation) which focus on the Mediterranean agro-food system.
2.1. Primary Sources
In order to monitor progress towards the SDGs, in 2017 the UN adopted a global indicator framework including 232 official indicators for the 17 SDGs. For each indicator, specific international institutions were appointed “custodian” agencies charged with collecting data from national sources and compiling internationally comparable estimates. The latter were forwarded to the United Nations Statistics Division (UNSD) for inclusion in the Global SDG Indicators Database.
The nine main UN organizations committed to this task are described below.
(i) The Food and Agriculture Organization (FAO) plays a leading role in providing food and agriculture statistics at global level through a series of databases of which FAOSTAT is the world’s most comprehensive on these topics. It is custodian agency for 21 SDG global indicators (around 10% of the total), in particular covering SDG #2, dedicated to food security and sustainable agriculture.
(ii) The World Bank (WB), whose aim is to reduce poverty worldwide, provides data on global development in its World Development Indicators (WDI) database. It is responsible for 22 official UN indicators related to ten SDGs.
(iii) The World Health Organization (WHO) is the custodian agency for the highest number of SDG indicators (31) with a focus on SDG #3 concerning health promotion, which is central to its mission. The Global Health Observatory (GHO) is the main WHO database of health related statistics.
(iv) The International Labour Organization (ILO) which promotes decent work and employment opportunities around the world, is custodian agency for 15 indicators, nine of which concern SDG #8, as such goal is closely related to its aim. ILOSTAT is the world’s largest database on labour market statistics.
(v) The UN Educational, Scientific and Cultural Organization (UNESCO) is the global leader of data for education, disseminated by the UNESCO Institute for Statistics (UIS) databases. It is responsible for 22 indicators that significantly contribute to SDG #4, concerning quality of education.
(vi) The United Nations Children’s Fund (UNICEF) aims to protect the rights of children through humanitarian and development assistance and is the leading global provider of data for children with 17 indicators across seven SDGs.
(vii) The United Nations Environment Program (UNEP) is the UN authority dedicated to environmental issues and custodian agency for 29 indicators across six Goals, especially SDG #12 concerning sustainable consumption and production patterns. The UNEP Environmental Data Explorer contains datasets on a wide range of environmental statistics.
(viii) The World Trade Organization (WTO) and (ix) the International Monetary Fund (IMF) are responsible for a total of 12 indicators. The WTO Statistics Database provides data on international trade. Among the IMF databases, World Economic Outlook (WEO) contains global macroeconomic data.
The Organization for Economic Cooperation and Development (OECD) is responsible for 20 SDG global indicators covering 13 SDGs. It keeps many databases related to its field of action, mainly concerning its 35 member countries, only seven of which are Mediterranean countries (Greece, Italy, Israel, Portugal, Slovenia, Spain, and Turkey).
Table 1 shows our overall evaluation of the primary data sources for SDG indicators according to the six criteria by a traffic light rating system indicating the level of suitability of the datasets.
In conclusion, the primary data sources for the SDG indicators that satisfy all or most of the six criteria are UNStats datasets, whereas OECD and Eurostat datasets do not cover many of the 17 Mediterranean countries.
2.2. Secondary Sources
The data used by the Sustainable Development Solution Network Index mentioned above, is derived from official and reliable unofficial sources. Not all of it is updated annually at the same time across countries; all Mediterranean countries are included in the index.
The Barilla Center for Food and Nutrition developed the Food Sustainability Index (FSI). The data used to construct the FSI comes mainly from UN institutions (primarily FAO) and EIU databases which are clear and reliably compiled. However, not all the indicators selected to build the index are available for latest years and most are only provided for a single year. In the 2017 edition of the FSI, 34 countries were included in the study, twelve of which are Mediterranean countries (Egypt, France, Greece, Israel, Italy, Jordan, Lebanon, Morocco, Portugal, Spain, Tunisia, and Turkey). FSI indicators can be related to some SDGs, above all Goals #2, 3, 10, 12, 13, and 15.
The International Centre for Advanced Mediterranean Agronomic Studies (CIHEAM) is a Mediterranean intergovernmental organization that promotes sustainability of the agro-food system in Mediterranean countries. Its 2015 version of the Statistical Review includes several indicators on agriculture, food and development in the Euro-Mediterranean area derived from UN organizations and Eurostat. These statistics concern the 13 CIHEAM member states (Albania, Algeria, Egypt, France, Greece, Italy, Lebanon, Malta, Morocco, Portugal, Spain, Tunisia, and Turkey) and six other Mediterranean countries (Bosnia and Herzegovina, Croatia, Jordan, Libya, Montenegro, and Syria). The data covers several decades, from the 1960s to recent years, although it is not always available for all countries. Moreover, the estimates are not updated annually and more information on the criteria used for data selection could be provided. CIHEAM provides indicators for five SDGs regarding the agro-food sustainability: Goals #2, 6, 12, 14, and 15.
Table 2 shows our evaluation of the secondary data sources for the SDG indicators according to the criteria for statistical quality of the datasets. All the secondary data sources analyzed may be considered suitable for our study even if they do not fully meet all six criteria, even if SDSN and BCFN Foundation databases do not generally provide time series data.
3. Indicators Selection
After datasets analysis, we identified and evaluated indicators that could be appropriate to gauge sustainability of agro-food systems in the Mediterranean region according to specific statistical criteria, which are introduced shortly below. Among the 17 SDGs, we focused on four specific goals related to agro-food sustainability, namely SDGs #2 (“End hunger, achieve food security and improved nutrition and promote sustainable agriculture”), #6 (“Ensure availability and sustainable management of water and sanitation for all”), #12 (“Ensure sustainable consumption and production patterns”), and #15 (“Sustainable land use, forest and other terrestrial ecosystems”).
The criteria for selection of suitable indicators to include in the Fuzzy Multidimensional Index are internationally recognized and proposed by [
41]. These criteria, in order of importance, are as follows.
Using these criteria for each goals, we analyzed the indicators provided in the UNSD Global SDG Indicators Database (primary source) and those used by SDSN in the SDG index (secondary source). Since internationally established methods and standards do not yet exist for all the UN indicators and the data is not widely available, SDSN has selected alternative unofficial indicators from other reputable sources to complement the official indicators in the case of gaps. The official indicators are classified in three tiers in order of methodological development and data availability (tiers I, II, and III; [
42]). Tier I indicators are those for which internationally established methodologies already exist and data are easily available for most countries; tier II indicators rely on internationally agreed methodologies and standards but their underlying data are not widely available worldwide; tier III indicators are normally not available on the UN official database since their methodology and standards are still being developed.
Table 3 shows the tier classification for the selected SDGs.
3.1. SDG 2: Food Security and Sustainable Agriculture
All 13 official UN indicators for SDG 2 are relevant and clearly linked to the PRIMA program. Unfortunately, only four align with the criteria: 2.1.1 “Prevalence of undernourishment”, 2.5.1 “Conservation of genetic resources for food and agriculture”, 2.5.2 “Risk status of livestock breeds”, and 2.a.1 “Public investment in agriculture”.
The six indicators used by SDSN for SDG 2 in the SDG Index are policy relevant and available for all the Mediterranean countries in our study. Among these, we do not consider the indicator “Prevalence of undernourishment (%)” since it is similar to the one in the official database. The indicators analyzed are “Prevalence of stunting, under-5s (%)”, “Prevalence of wasting, under-5s (%)”, “Prevalence of adult obesity”, “Cereal yield (t/ha)”, and “Sustainable Nitrogen Management Index” [
43].
Table 4 shows an overall evaluation of the official UN indicators and those used by SDSN.
Among the UN indicators, 2.1.1 covers almost all the selection criteria, classified as tier I. The other UN indicators are classified as tier II and data for these indicators is not regularly produced by all countries at the same time for all components. Internal comparability depends on the quality of a country data compiled by its official source.
Concerning the SDSN indicators, “Prevalence of stunting, under-5s (%)” and “Prevalence of wasting, under-5s (%)” perfectly match official indicators 2.2.1 and 2.2.2, which are not available for most Mediterranean countries. An established methodology exists; however data is not available for recent years in all countries at the same points in time. The indicator “Prevalence of adult obesity” is also closely aligned to official indicator 2.2.2 whereas “Cereal yield” and “Sustainable Nitrogen Management Index” are not in the official UN database. In conclusion, the indicators suitable to monitor SDG 2 in the Mediterranean region are 2.1.1 and 2.5.2 (UN indicators) and “Prevalence of adult obesity” and “Cereal yield” (SDSN indicators), since they meet most of the selection criteria.
3.2. SDG 6: Clean Water and Sanitation
The 11 official UN indicators for SDG 6 are all policy relevant, but only six are available from the UNSD database. Three of others cover most of the Mediterranean countries in the study, namely indicators 6.1.1 “Proportion of population using safely managed drinking water services”, 6.2.1 “Proportion of population using safely managed sanitation services”, and 6.4.2 “Level of water stress: freshwater withdrawal as a proportion of available freshwater resources”.
As shown in
Table 5, the indicators may be considered appropriate for monitoring progress towards SDG 6 in Mediterranean countries.
3.3. SDG 12: Sustainable Consumption and Production Patterns
Of the 13 UN indicators for SDG 12, almost are classified as tier III and do not yet have established methodologies. Three indicators are in tier I: 12.4.1 “Number of parties to international multilateral environmental agreements on hazardous waste …” is not policy relevant. The other two indicators 12.2.1 “Material footprint, material footprint per capita, and material footprint per GDP” and 12.2.2 “Domestic material consumption, domestic material consumption per capita, and domestic material consumption per GDP” are relevant to the PRIMA program and are available for all Mediterranean countries. Among the eight indicators selected by SDSN for this goal, five are policy relevant and cover most of the countries: “E-waste (kg/capita)”; “Wastewater treated (%)”; and “Production-based SO2 emissions (kg/capita)” [
44].
“Nitrogen production footprint (kg/capita)” [
45] and “Municipal solid waste” [
46]. “Wastewater treated” and “Municipal solid waste” are similar to official indicators, 12.4.2 and 12.5.1, respectively, which are not available on the official UN database. The other indicators are not related to any of the official SDG indicators.
As shown in
Table 6, UN indicators, 12.2.1 (tier III) and 12.2.2 (tier II), do not meet most of the criteria since they are produced compiling data from different sources, which are not readily available in all countries for the years and are not comparable over time. The SDSN indicators are only provided in research papers at a single point in time and based on methods which are not easy to apply consistently in all countries. Therefore, the UN and SDSN indicators for SDG 12 do not seem the most appropriate indicators for this study.
3.4. SDG 15: Sustainable Management of Terrestrial Ecosystems
Among the 14 official UN indicators for SDG 15, six cover most of the Mediterranean countries in our analysis: 15.1.1 “Forest area as a proportion of total land area”, 15.1.2 “Proportion of important sites for terrestrial and freshwater biodiversity that are covered by protected areas, by ecosystem type”, 15.2.1 “Progress towards sustainable forest management”, 15.4.1 “Coverage by protected areas of important sites for mountain biodiversity”, 15.4.2 “Mountain Green Cover Index”, and 15.5.1 “Red List Index”. SDSN indicators for this goal closely align with official indicators 15.1.1, 15.1.2 and 15.5.1.
Table 7 shows that the UN indicators for SDG 15 satisfy many of selection criteria: 15.1.1 and 15.1.2, classified as tier I, may be suitable for our study, although the former is not available every year, but at longer intervals. Concerning the others (tier II), indicators 15.4.1 and 15.5.1 meet almost all the criteria, whereas 15.2.1 and 15.4.2 are not readily available for recent years and at different points in time. On the whole, the most appropriate indicators seem to be 15.1.1, 15.1.2, 15.4.1, and 15.5.1.
3.5. PRIMA Indicators
The PRIMA program identified a set of Key Performance Indicators (KPIs) [
2] to measure agro-food sustainability performance of Mediterranean countries, thus contributing to implementation of SDGs 2, 6, 12, and 15 in the region. We used these indicators to build of the Fuzzy Multidimensional Index, adjusting some to obtain a more accurate measure of the relevant phenomena (
Table 8). The KPIs are described in detail in Saladini et al. [
2].
The proposed method for building the Fuzzy Multidimensional Index was applied to the 17 Mediterranean countries involved in the PRIMA program using these 11 indicators.
4. Construction of the Fuzzy Multidimensional Index
After dataset analysis, we selected the most suitable indicators to measure the performance of Mediterranean countries towards the four SDGs related to agro-food sustainability according to PRIMA program. To weight and aggregate these indicators into the Fuzzy Multidimensional Index that appropriately reflects the multidimensional nature of sustainable development and the SDGs, we developed a new method based on an innovative fuzzy approach. In order to assess progress towards sustainability as envisaged in the PRIMA program, we propose an innovative fuzzy approach to weight and aggregate a set of indicators into the Fuzzy Multidimensional Index that captures the multidimensional and interrelated nature of sustainable development.
The need for the new methodology springs from the idea that the indicators for the SDG framework may cover more than one specific goal at the same time
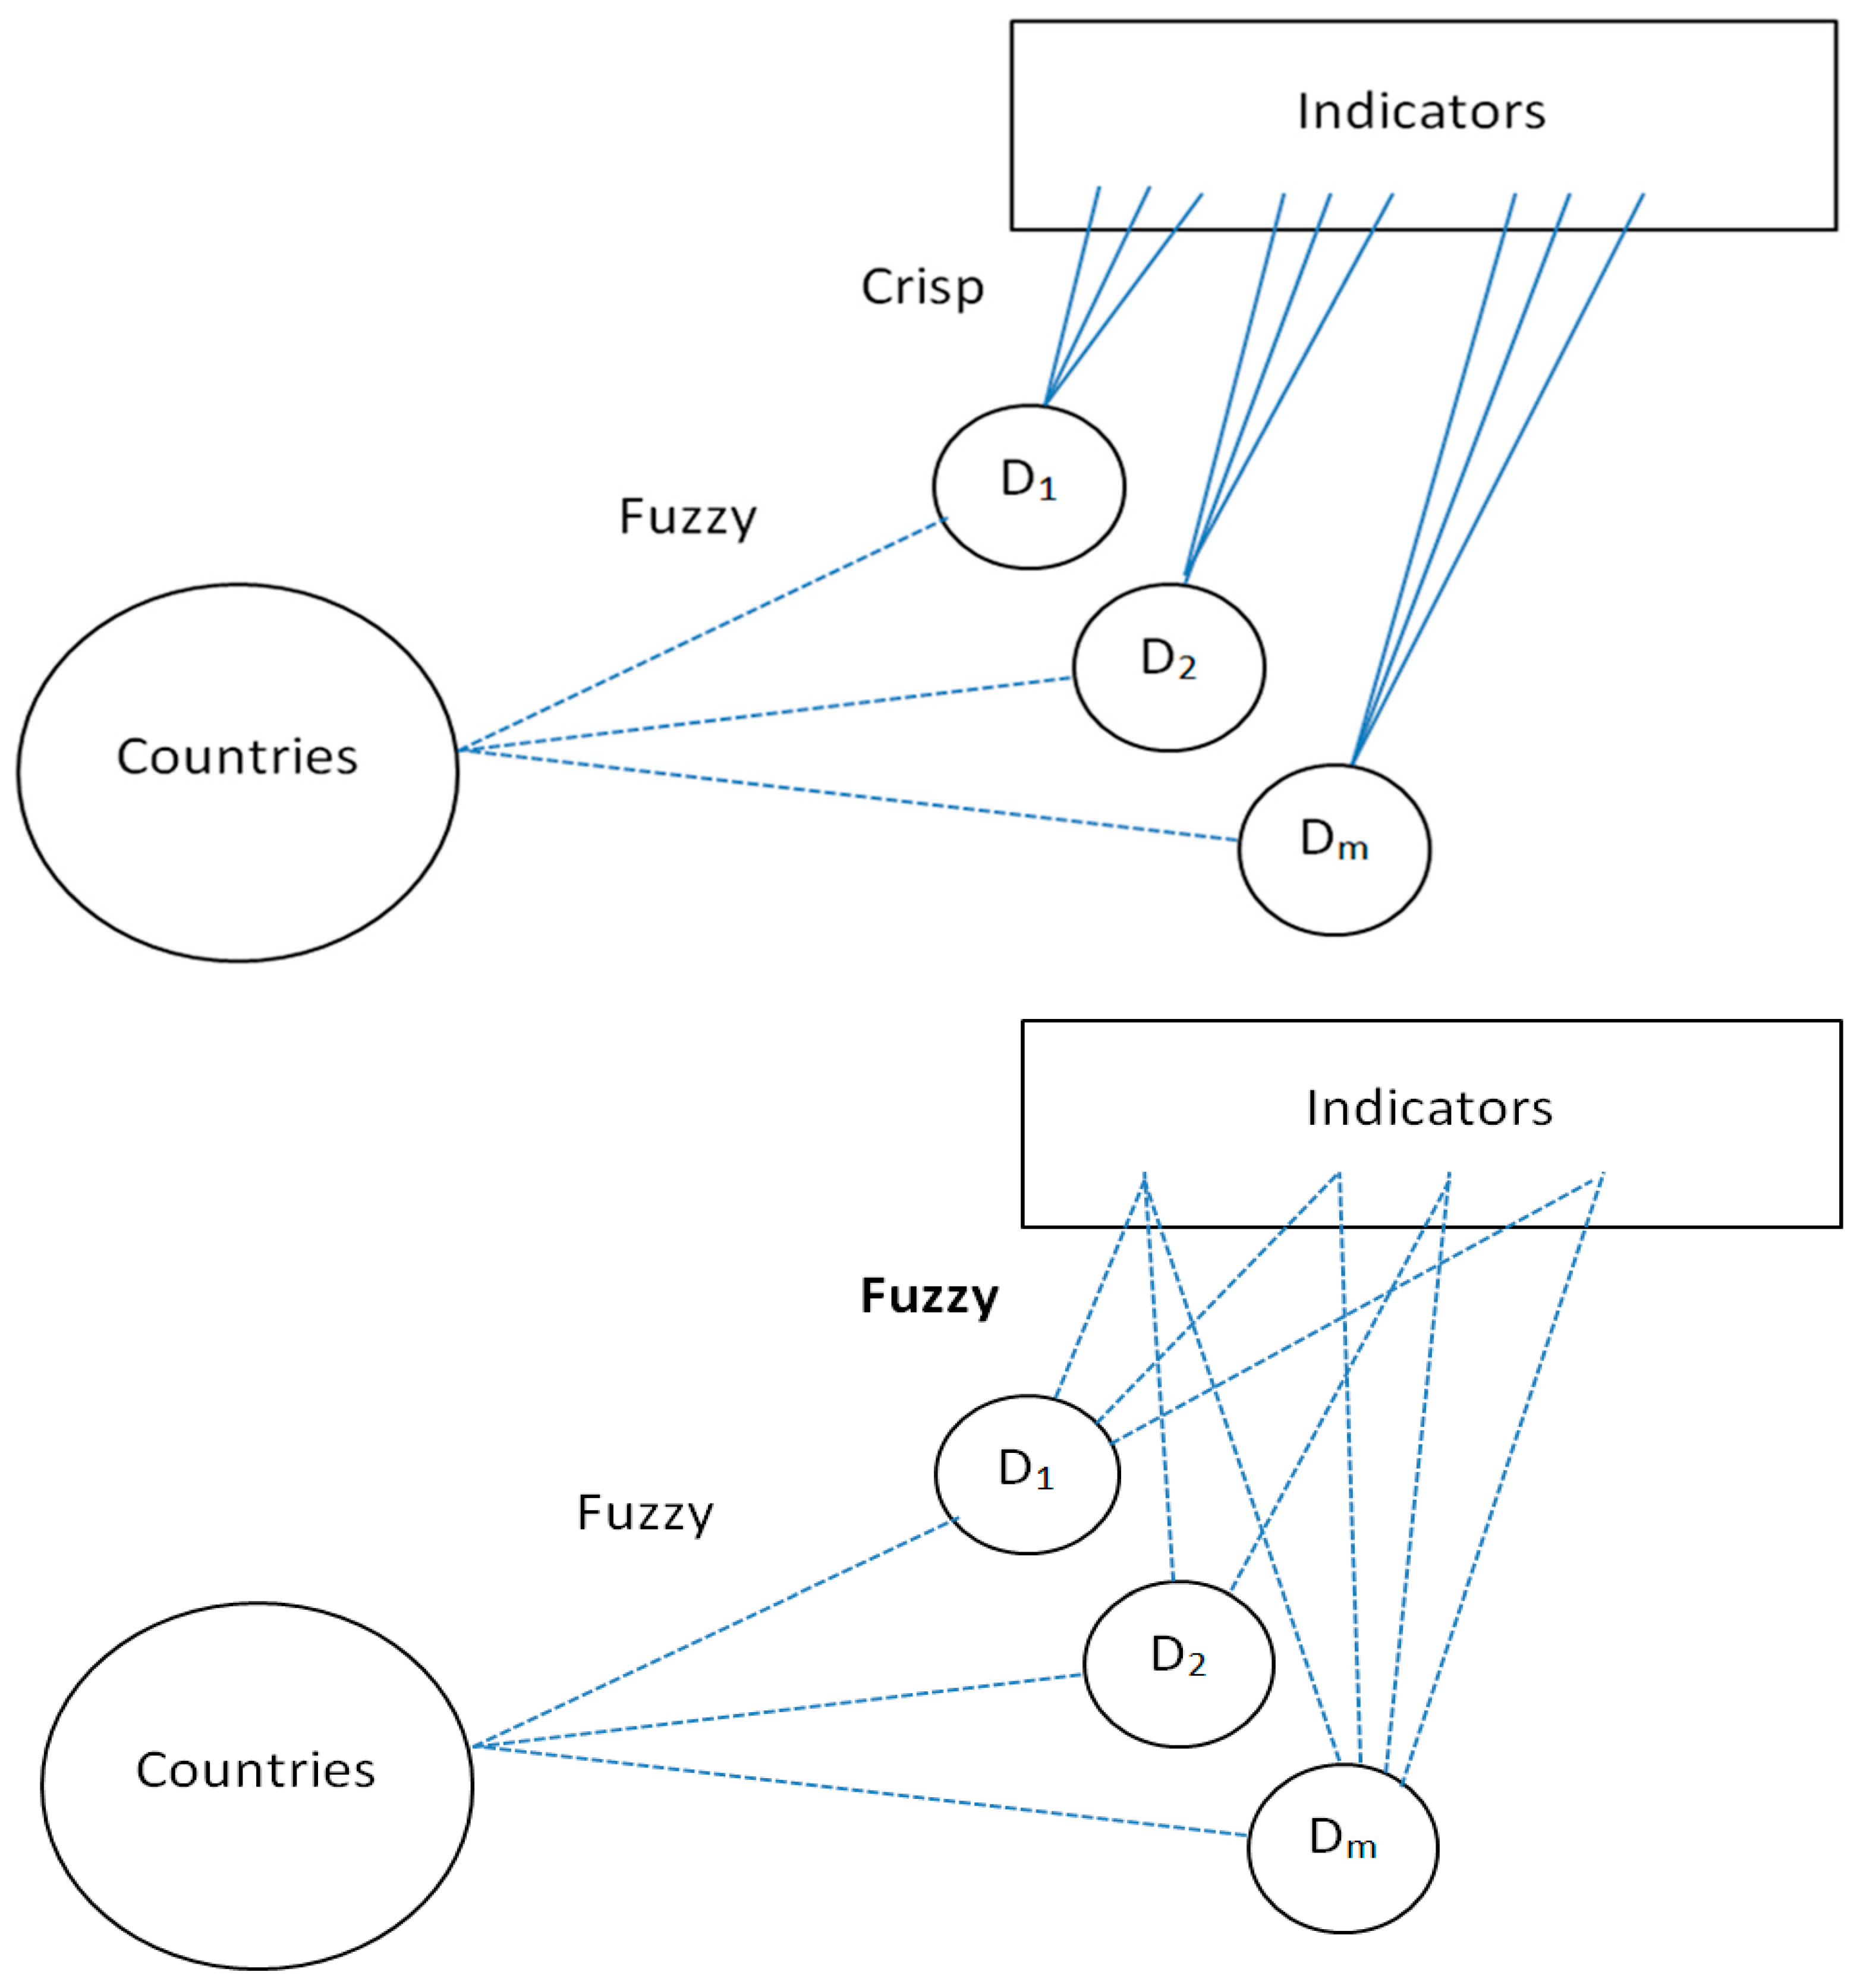
The dimensions of the Fuzzy Multidimensional Index make it possible to consider an indicator’s membership of more than one dimension as a matter of degree, replacing the conventional crisp membership to a single dimension of classical binary logic.
Figure 2 compares the traditional fuzzy approach (Betti et al. [
19], top) and the proposed innovative fuzzy approach (bottom). In both approaches, the statistical units, in this case countries, belong to all the dimensions identified according to a certain membership function, but in the innovative fuzzy approach the indicators belong to all or almost all the dimensions to different degrees and no longer exclusively to a single dimension, as in crisp logic. The steps are described in detail below.
a. Selection of Indicators to Measure Agro-Food Sustainability in the Mediterranean Area
We used 11 indicators identified by the PRIMA program described in paragraph 3.5. Since missing data in our analysis may make it difficult to examine agro-food sustainability in the Mediterranean region, introducing bias and affecting the statistical quality of the results, we estimated the missing values for northern and southern Mediterranean countries on the basis of their respective mean. This enabled us to proceed with the analysis using standard techniques for complete data.
Appendix A gives the values of these selected indicators for each country along with the imputed missing values (highlighted in red).
b. Normalizing the Indicators to the [0, 1] Interval
We normalized the indicators to a 0 to 1 scale, where 0 indicates the best performance, alias the highest sustainability, and 1 the worst performance or lowest sustainability.
Indicators for which a higher value denotes a better performance (“Land use”, “Cereal yield”, “Agriculture VA”, “Crop water productivity”, “Rural population using safely managed water and sanitation services” and “R&D expenditures”) were normalized into the [0;1] interval using the following formula.
where
is the value of the
j-th indicator (
for the
i-th country (
) and max/min
are the maximum and minimum values of each indicator in the 17 Mediterranean countries. On the contrary, indicators for which a higher value indicates a worse performance (“Population overweight”, “Fertilizer consumption”, and “Freshwater withdrawal”) were transformed using this formula:
As an exception, the indicator “GHG emissions per sq. Km”, was normalized using the first instead of the second formula due to its strong negative correlation with the first dimension emerging from factor analysis (factor loading: −0.5).
a. Exploratory Factor Analysis to Identify Underlying Dimensions of Mediterranean Agro-Food Sustainability
Latent dimensions explaining interrelationships between indicators were identified by EFA using Statistical Analysis Software (SAS).
b. Calculation of Indicator Weights (Factor Loadings)
The innovative character of the new fuzzy approach can be found in this step. According to our particular weighting system, the indicators for SDGs may belong to more than one dimension with a correlation represented by the factor loadings; this is somewhat similar, in a classical fuzzy approach, to the proposal of Belhadj [
47]. Hence, the weights assigned to the selected indicators are their factor loadings. In this paper, we have proposed a membership function considering a threshold of zero; in this way, indicators may belong to more than one dimension with different degrees, represented by the factor loadings greater than zero, and not exclusively to the dimension with the highest factor loading, as in the crisp approach.
Concerning the ‘prevalence-correlation’ method used for the calculation of weights in the context of poverty evaluation, we do not use this weighting system since the dispersion of an indicator is not meaningful in this case; nor is the correlation of one indicator with the others of a given dimension, since we already consider a sort of “correlation weights”, that is the factor loadings. Moreover, the indicators may not only be correlated with the others in a specific dimension, but also with those of other dimensions, according to the proposed membership function.
c. Calculation of Scores for Each Dimension
The indicators for each country are aggregated over each dimension to calculate the country scores for each dimension through a weighted mean, using weights calculated above.
d. Calculation of the Overall Score
The overall Fuzzy Multidimensional Index measuring agro-food sustainability in each country is calculated as the arithmetic mean of scores for each dimension.
We used this step-by-step procedure to build the Fuzzy Multidimensional Index by applying the new methodology to the 17 Mediterranean countries using the indicators identified by the PRIMA program in order to assess agro-food sustainability in the Mediterranean region.
5. Empirical Analysis
After indicators selection and normalization, we used EFA to identify the underlying dimensions. Starting from the correlation matrix of the selected indicators, we identified four dimensions as appropriate to explain interrelationships between indicators and hence describe Mediterranean agro-food sustainability.
The indicators “Rural population using safely managed water services” and “Rural population using safely managed sanitation services” showed the highest correlation (0.80). Both measure the percentage of rural population using interrelated types of services (water and sanitation). “GHG emissions per sq. km” and “Research and development expenditures” were also strongly correlated (0.70). In fact, when R&D expenditure is high, GHG emissions are usually also high. This is normally the case in industrialized countries and vice versa in developing countries. The correlation was also significant (0.70) for the indicators “Cereal yield” and “Crop water productivity” as well as for “Agriculture value added” and “Annual freshwater withdrawal for agriculture” since all these indicators are a measure of agriculture productivity.
In order to determine the number of factors to include, we used the following three statistical/heuristic criteria.
- −
Eigenvalues greater than one rule [
48,
49]: only factors with associated eigenvalues greater than one should be included (it is only meaningful to include components that explain at least the amount of variance accounted by the observed variables which are standardized and hence their variance is equal to one).
- −
Cumulative proportion of variance exceeding 70–75%: only factors that explain at least this share of the original variability should be included since a 25–30% loss of variability can generally be traded for a reduction in the number of dimensions.
- −
Scree plot (with eigenvalues on the y axis and number of factors on the x axis) “elbow rule”: the number of factors to select coincides with the point where the slope of the curve starts to flatten out (the elbow).
Table 9 shows the eigenvalues associated with each factor in descending order, along with their difference and, the proportion and cumulative proportion of the original variability explained by each factor. According to the eigenvalues-greater-than-one rule, the first four factors may be included since their eigenvalues are 3.7845, 2.1887, 1.680, and 1.1171, while the eigenvalue of the fifth factor is less than one (0.8243).
The four factors together explain a large proportion of the original variance (80%). Moreover, the scree and variance plots show that the curve becomes flatter after factor 4. Four factors may therefore be considered appropriate to explain Mediterranean agro-food sustainability.
To calculate the weights for the indicators by the new methodology, we first investigated any differences in factor loading matrixes from the factor analysis to determine the most suitable solution for the proposed innovative fuzzy approach. We analyzed the factor loading matrix with four factors considering nonrotated and rotated solutions. The nonrotated factor loading matrix with four factors was the most appropriate for the proposed multidimensional methodology. We decided to include the number of factors indicated by factor analysis, run with a default eigenvalue of 1, instead of arbitrarily limiting the number of factors to be included. We also chose the nonrotated solution since rotation would tend to convert the proposed fuzzy approach back to a crisp logic. Indeed, the most common rotation method, varimax rotation, maximizes the variance of the squared loadings of each factor increasing high loadings and decreasing low loadings so that new factors are strongly associated with few original variables and weakly associated with the other variables, thus facilitating factor interpretation. However, this tends to polarize the factor loadings to the extremes of their range (zero or one) missing intermediate factor loadings which are meaningful for the innovative fuzzy approach. In conclusion, we have opted for the nonrotated solution with four factors. We then calculated the weights for the indicators by the innovative methodological proposal selecting all factor loadings consistent with a given threshold according to the proposed membership function (in this case a zero threshold), in all dimensions. As shown in
Table 10, almost all the indicators belong simultaneously to more than one dimension, not solely to the dimension with the highest factor loading as in the classical crisp approach commonly used in factor analysis (
Table 11).
For the indicator “Population overweight”
Table 10 shows a membership function of 0.52 in the first dimension (Factor 1), 0.69 in the second, and 0.25 in the fourth one. This indicator does not belong to the third dimension since the factor loading in this case was less than zero. The highest degree of membership (0.7) is in dimension 2 followed by 0.5 in dimension 1 and the lowest degree in dimension 4. The indicator “Forest area and agriculture” is strongly associated with the second dimension (0.7), showing degrees of membership of 0.3 and 0.1 in the first and third dimensions respectively, and no membership in the fourth dimension (D4). “GHG emissions” is mainly related to D3 (0.7), followed by D1 (0.5) and D4 (0.3). “Cereal yield” is the only indicator belonging to only one dimension, showing a particularly high correlation with the first dimension (0.8). “Agriculture value added” and “Freshwater withdrawal” have high membership in D1 (0.7) and lower in D2 and D3. “Fertilizer consumption” and “crop water productivity” are highly correlated with D2 and D1, respectively, and less so with D3 and D4, and D1 and D2, respectively. “Rural population using safely managed water services” and “Rural population using safely managed sanitation services” are both significantly associated with D1 (0.7) and less with D4. Finally, “R&D” has the highest membership function (0.9) in D3 and also belongs to D1 to a low degree (0.1).
Thus EFA has identified four dimensions including the following indicators.
- −
Dimension 1: all the indicators except indicator 6 (Fertilizer consumption).
- −
Dimension 2: indicators 1 (Population overweight), 2 (Forest and agricultural area), 5 (Agriculture value added), 6 (Fertilizer consumption), 7 (Crop water productivity), and 8 (Freshwater withdrawal).
- −
Dimension 3: 2 (Forest and agricultural area), 3 (GHG emissions), 5 (Agriculture value added), 6 (Fertilizer consumption), 8 (Freshwater withdrawal), and 11 (R&D).
- −
Dimension 4: 1 (Population overweight), 3 (GHG emissions), 6 (Fertilizer consumption), 7 (Crop water productivity), 9 (Rural population using safely managed water services), and 10 (Rural population using safely managed sanitation services).
In conclusion, the indicators belong to all or almost all the dimensions to varying degrees, given by factor loadings greater than zero. The innovative fuzzy approach makes it possible considering the dimensions identified by factor analysis as fuzzy sets, while the indicators may belong simultaneously to more than one dimension.
Table 11 shows the factor loadings selected by the traditional crisp approach.
According to the classical crisp approach and considering a threshold of 0.55, the first factor is strongly related to the indicators “Cereal Yield”, “Agriculture value added”, “Crop water productivity”, “Freshwater withdrawal”, “Rural population using safely managed water services”, and “Rural population using safely managed sanitation services”, while the second factor is positively associated with “Population overweight”, “Forest and agricultural area”, and “Fertilizer consumption”, and the third factor has large positive loadings with “GHG emissions” and “R&D”, showing a particularly high correlation with the latter (0.96). None of the indicators belong to the fourth dimension, where factor loadings are low. Following the crisp approach, the dimensions are only described by indicators with the highest factor loadings, so an indicator only belongs to one specific dimension and makes it possible to capture the many interrelated dimensions at the core of sustainable development and the SDGs.
The indicators were weighted and aggregated as described in steps 5 and 6, calculating the country scores for each dimension and the overall Fuzzy Multidimensional Index.
Table 12 ranks the 17 Mediterranean countries in our analysis according to their scores in the Fuzzy Multidimensional Index, and also shows scores in the various dimensions, where 0 indicates the best performance, that is the highest sustainability, and 1 the worst performance, i.e., the lowest sustainability. The results show that NMCs generally perform better in the overall index and across the four dimensions than SEMCs, which are in the lowest positions, except for Israel whose results are similar to those of NMC.
According to the Fuzzy Multidimensional Index, Slovenia, France, Israel and Italy are the top performers and seem to be the most agro-food sustainable countries. They are followed by Portugal, Croatia, Spain and Greece in the second quartile. Cyprus, Tunisia, Turkey, and Morocco are in lower positions in the third quartile. Malta, Algeria, Lebanon, Egypt, and Jordan appear to have the least sustainable agro-food systems. In summary, most NMCs are in the best positions except for Cyprus and Malta. All the SEMCs perform worse, except for Israel which has similar patterns to the NMCs.
The scores of the countries, classified on the basis of the overall ranking, over the four dimensions are shown in the radar chart in
Figure 3.
Most country performances are particularly negative in the third dimension, which is mainly described by investments in R&D and GHG emissions. Only Israel performs well in this dimension due to its high R&D expenditure. Slovenia, France, and Italy are in the top positions, though with much higher scores than Israel, while Egypt performs worst of all in this dimension. In the other dimensions, the scores of the NMCs and Israel, which are on the right of the radar chart, are generally closer to zero than those of the SEMCs, on the left, further from zero. In terms of the first dimension, which chiefly refers to agriculture productivity and water management, Slovenia, France, and Italy are the best performers, while Jordan, Algeria, and Morocco are the worst. On the second dimension, mostly covering aspects related to nutrition (“population overweight”) and the sustainable management of land (“forest and agricultural area” and “fertilizer consumption”), again, Slovenia, France, and Italy show the highest performance followed by other NMCs and in this case also by some SMCs such as Morocco and Tunisia due to their positive performance in “fertilizer consumption”, whereas Malta, Jordan, and Egypt have the lowest rankings.
Finally, regarding the fourth dimension, which may be thought of as intensive production since it is characterized primarily by the indicators “fertilizer consumption”, “GHG emissions”, and “crop water productivity”, Italy is the top performer, followed by Israel, France, and Slovenia, while Morocco, Jordan, and Lebanon have the bottom rankings.
Table 13 shows the scores of the countries by dimension, the sum of their scores over the four dimensions, and the minimum and maximum scores.
Most countries, especially those in the first three quartiles, have the maximum score in the third dimension expressing their negative performance in that dimension. The exception is Israel which has its minimum score in the third dimension. The third dimension mean score and range (0.79) are in fact the highest, the latter due to the significant gap existing between Israel with the minimum score and the other countries, specifically Egypt with a considerably higher score (0.95). By contrast, the variability third-dimension country scores around the mean are the lowest (25%).
In the other dimensions, the mean values of which are more similar, the coefficient of variation is highest in the second dimension, making the level of dispersion of country scores around the mean seem greater. Slovenia, France and Italy show minimum scores in the second, first, and third dimension, respectively. Italy is the most sustainable country in the fourth dimension.
Compared to other top-ranking countries, Israel by contrast has its highest score in the second dimension. The lowest-rankings countries report high scores across all dimensions, with minimum and maximum values varying by country. The maximum scores of Lebanon, Egypt, and Jordan, on the whole the least sustainable countries, are in the fourth, third and second dimensions, respectively.
The overall Fuzzy Multidimensional Index and the country scores for each dimension show that there are significant divergences between NMCs and SEMCs, the former generally being more sustainable in terms of agro-food sustainability than the latter, excluding Israel.
6. Conclusions and Further Research
This paper describes a new methodology to capture the multidimensional nature of sustainable development and SDGs in the context of the 2030 Agenda. It introduces an innovative fuzzy approach to aggregate sets of SDGs indicators into a multidimensional index for sustainability assessment. Success in steering the world towards sustainability depends on the development of methods that capture the multidimensionality of the SDGs and that detect their interrelations, thus providing proper estimates of sustainability. Since today the sustainability of Mediterranean agro-food system is severely threatened by environmental, economic, and social challenges, we propose this multidimensional method for building a Fuzzy Multidimensional Index to measure the agro-food sustainability performance of Mediterranean countries in-line with the PRIMA program.
In order to construct the Fuzzy Multidimensional Index, we analyzed the statistical quality of the main datasets available for the SDG indicators. We selected suitable statistically sound indicators, weighting, and aggregating them using an innovative fuzzy approach. The proposed methodology is based on fuzzy set theory, which is designed to capture the complexity and multidimensionality of social and other dynamics, expressing truth in degrees rather than dichotomies.
Indicators were weighted and aggregated within and across the dimensions to provide country scores in each dimension and an overall index. The study showed that the interrelated dimensions of sustainable development and SDGs are more readily captured by a methodology applied to dimensions which are fuzzy sets of SDGs indicators: instead of belonging to a single dimension, as in the classical crisp approach, the indicators may simultaneously belong to different dimensions to various degrees.
The empirical results of the new methodology applied to the 17 countries involved in the PRIMA program showed that the agro-food system is generally more sustainable in northern than in southern and eastern Mediterranean countries, since the former countries perform better than the latter (except Israel) in the four dimensions and the overall Fuzzy Multidimensional Index. In conclusion, NMCs currently seem to have more sustainable agro-food patterns than SEMCs.
The methodology presented here differs from the most important ones present in literature (e.g., SDSN or BCFN Foundation approaches) since it constructs composite or multidimensional indicators having these main characteristics: (i) dimensions are not predefined a priori; instead, they are identified by factor analysis, and then validated by confirmatory analysis; (ii) aggregation of single indicators into a dimension is performed by a weighting system which takes into account measurement errors, redundancies and other characteristics of such indicators, following a “prevalence-correlation” method well established in the literature of composite indicators, and which is not based on the subjectivity of a certain pool of experts; and (iii) fuzzy set operators are able to maximize the information contained in the ultimate dimensions, by defining specific measures of intersection or union.
These characteristics are particularly important, since it gives the possibility of identifying the key independent factors that determines the sustainability status of a system. This identification has policy consequences as it can enhance the efficacy of strategies for improvement of indicators (and ultimately of the systems) in the direction of the SDGs. At policy level, these results can be useful for encompassing integrated strategies for the sustainable use of agricultural resources, such as water, soil, and fertilizers. Individual countries can implement integrated agricultural policies favoring solutions with low environmental impact and aimed at reducing greenhouse gas emissions in the agricultural sector. At the international level, countries in the Mediterranean area can use these analyses to implement programs to help the rural population living in poverty, or with incentives for the installation of local energy plants from renewable sources such as solar, miniwind or micro-hydroelectric, making the most of the last case, the water resource both to produce energy and to irrigate fields or other agricultural uses.
The major limitation of this study consists in the fact that the construction of an index to assess agro-food sustainability in the Mediterranean region is quite complicated, since not all the necessary data is readily available or updated in all countries, especially those around the south-eastern shores. An effort to improve data collection and statistical capacity in the region is therefore of primary importance. Further research may be needed to identify additional meaningful indicators so as to prove a more comprehensive picture of sustainability in the area. Moreover, another effort should be put in collecting relevant information at microlevel (individuals, households, communes, or municipalities) rather that at macro level: in this regards, it has already proven that fuzzy indicators perform better that crisp one in terms of sampling variability and standard errors [
50,
51].
Another limitation consists in the simple membership function adopted in the paper; this is mainly due to the limited number of item indicators, and often to limited number of the characters in each item; further developments proposal may help to improve our method.
However, we are aware that this study is only a start towards the complex and ambitious task of building a Fuzzy Multidimensional Index to measure the sustainability of Mediterranean. The PRIMA program will be a first step towards the implementation of innovative solutions, by funding international cooperation projects between countries on both sides of the Mediterranean for a decade.

 ,
, 


