Sustainability Implications of the Incorporation of a Biogas Trapping System into a Conventional Crude Palm Oil Supply Chain


Abstract
1. Introduction
- The environmental, economic, and social sustainability performance of incorporating a biogas trapping system into a typical crude palm oil supply chain.
- The level of improvement it would bring to the overall sustainability performance of crude palm oil production in Malaysia.
- The flexibility of the POSA framework [25] in responding the changes in technology and strategies in the supply chain.
2. Methodology
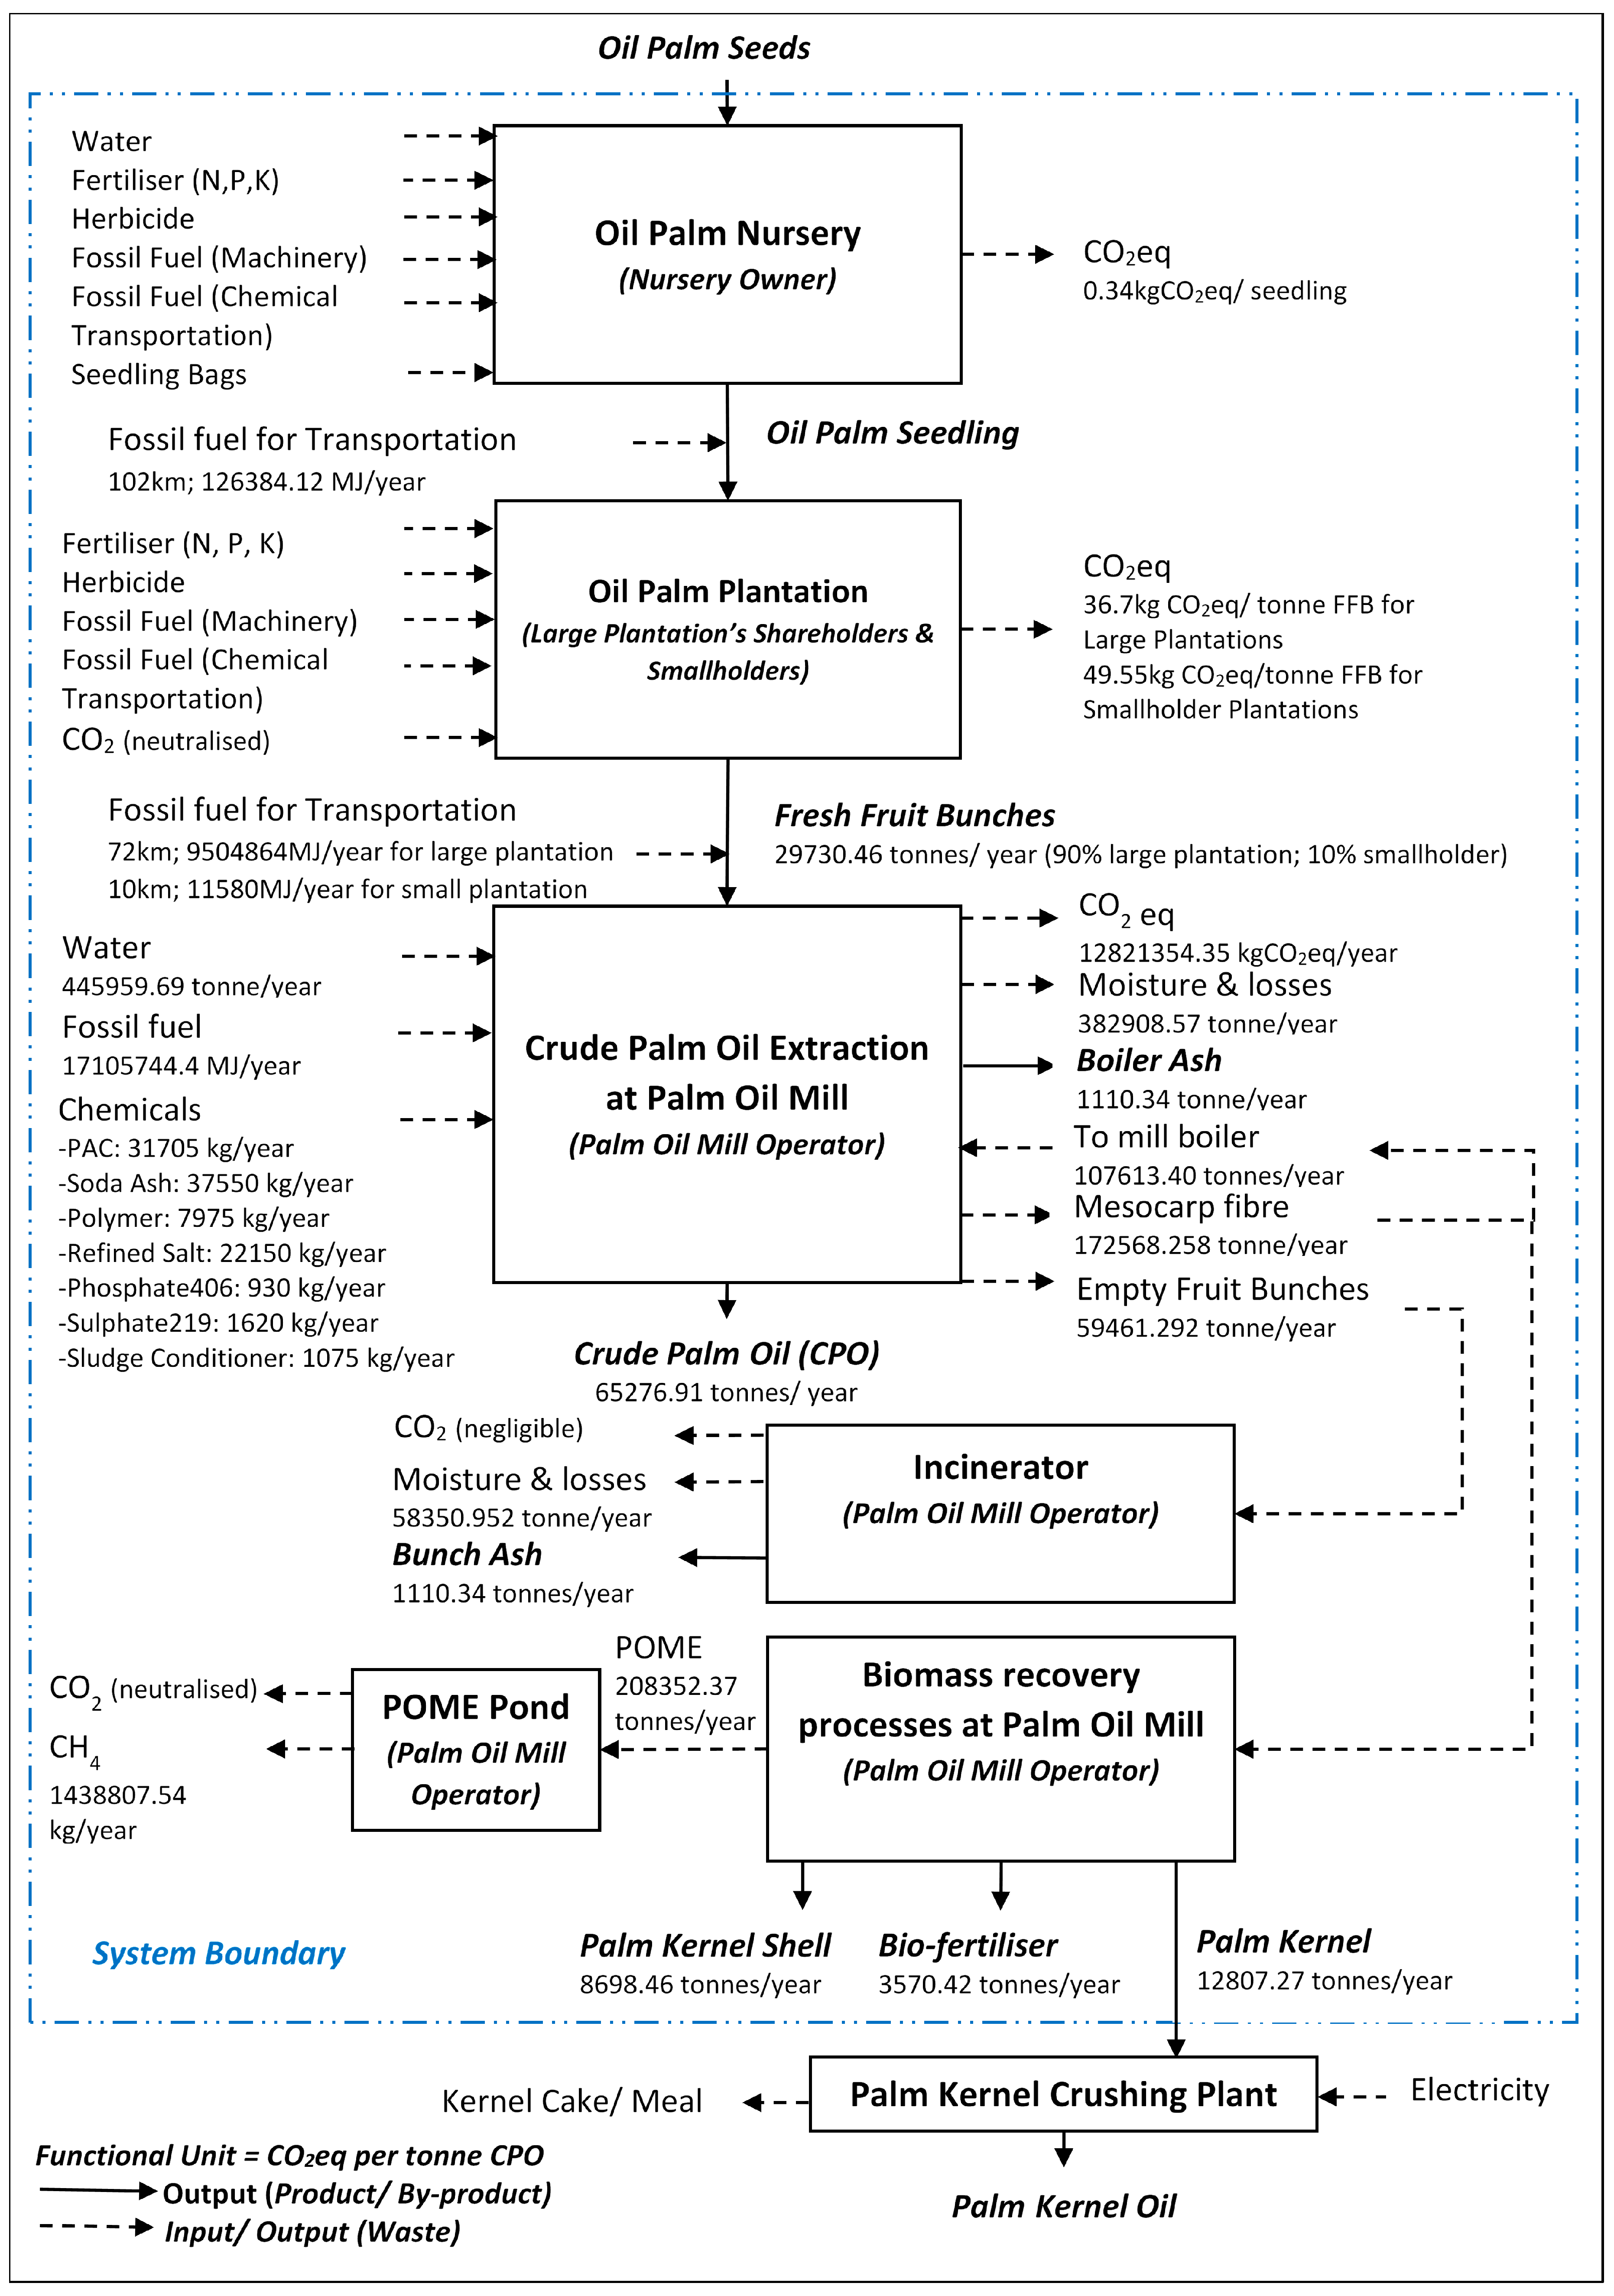
3. Review of the Baseline Crude Palm Oil Supply Chain
- For every tonne of FFB processed, 0.7–1.0 m3 of raw POME is generated [11]; in this study 0.8 m3 POME per tonne FFB was used.
- Density of POME is 0.876 tonne/m3 [28](assumptions i and ii were used to calculate the amount of POME generated in this study, i.e., 0.7008 tonne of POME per tonne of FFB processed. In Lim and Biswas [26], one tonne of POME is assumed to be generated from every tonne of FFB processed, which was a less conservative estimate)
- Five tonnes of water are consumed for every tonne of CPO produced, and more than 50% of water consumed is discharged as POME [29,30](assumption iii considers water loss along the palm oil mill processes, i.e., leakages, steam release, vents, etc. in addition to water discharged as POME for total water consumption. Lim and Biswas [26] did not consider this water loss throughout the milling process in calculating the water consumption)
4. The KUBOTA Biogas and Polishing Plant
5. Sustainability Implications of Incorporating a Biogas Plant
5.1. Environmental Sustainability Performance Measures
5.2. Economic Sustainability Performance Measures
5.3. Social Sustainability Performance Measures
5.4. The Overall Sustainability Assessment
6. Discussion
7. Conclusions
Author Contributions
Funding
Acknowledgments
Conflicts of Interest
Nomenclature
| AGR | Actual Growth Rate |
| BGPP | Biogas cum Polishing Plant |
| BOD | Biochemical Oxygen Demand |
| CO2eq | Carbon Dioxide Equivalent |
| COD | Chemical Oxygen Demand |
| CPO | Crude Palm Oil |
| DOE | Department of Environment |
| EFB | Empty Fruit Bunches |
| FFB | Fresh Fruit Bunches |
| GHG | Greenhouse Gas |
| HPI | Higher Performance Indicator |
| KPI | Key Performance Indicator |
| m3 | cubic meter |
| mg/L | Milligram per litre |
| MJ | Mega joule |
| MT/hr | Metric tonne per hour |
| Nm3 | Normal Cubic Meter |
| PM | Performance Measure |
| POME | Palm Oil Mill Effluent |
| POSA | Palm Oil Sustainability Assessment |
| SGR | Sustainable Growth Rate |
References
- Enden, S.V.D. Smallholders and Sustainable Palm Oil Production: A Better Understanding between Policy Arrangements and Real-Life Practices a Case Study of the Siak Smallholders Site, Riau Province. Master’s Thesis, Wageningen University, Wageningen, The Netherlands, 2013. [Google Scholar]
- Lyndon, N.; Razak, N.; Azima, A.M.; Junaidi, A.B.; Sivapalan, S. Empowerment of the bidayuh rural community oil palm smallholders: A case study in serian district, sarawak, Malaysia. Mediterr. J. Soc. Sci. 2015, 6, 55. [Google Scholar] [CrossRef]
- Rival, A.; Levang, P. Palms of Controversies—Oil Palm and Development Challenges; Center for International Forestry Research (CIFOR): Bogor, Indonesia, 2014. [Google Scholar]
- Varsha, V.; Stuart, L.P.; Clinton, N.J.; Sharon, J.S. The impacts of oil palm on recent deforestation and biodiversity loss. PLoS ONE 2016, 11, e0159668. [Google Scholar]
- Colchester, M. Palm Oil and Indigenous People in South East Asia; The International Land Coalition: Rome, Italy, 2011. [Google Scholar]
- WWF. Palm Oil & Biodiversity Loss. Available online: http://wwf.panda.org (accessed on 31 March 2017).
- Reijnders, L.; Huijbregts, M.A.J. Palm oil and the emission of carbon-based greenhouse gases. J. Clean. Prod. 2008, 16, 477–482. [Google Scholar] [CrossRef]
- Mohd Kusin, F.; Akhir, N.I.M.; Mohamat-Yusuff, F.; Awang, M. The impact of nitrogen fertilizer use on greenhouse gas emissions in an oil palm plantation associated with land use change. Atmósfera 2015, 28, 243–250. [Google Scholar] [CrossRef]
- BBC. Bbc Biogas and Polishing Plant (Kubota System); Bhd, B.B.S., Ed.; BBC Sdn Bhd: London, UK, 2018. [Google Scholar]
- Foo, K.Y.; Hameed, B.H. Insight into the applications of palm oil mill effluent: A renewable utilization of the industrial agricultural waste. Renew. Sustain. Energy Rev. 2010, 14, 1445–1452. [Google Scholar] [CrossRef]
- Rahayu, A.S.; Karsiwulan, D.; Yuwono, H.; Trisnawati, I.; Mulyasari, S.; Rahardjo, S.; Hokermin, S.; Paramita, V. Handbook Pome-to-Biogas Project Development in Indonesia; Winrock International: Little Rock, AR, USA, 2015. [Google Scholar]
- Madaki, Y.S.; Lau, S. Palm oil mill effluent (pome) from Malaysia palm oil mills: Waste or resource. Int. J. Sci. Environ. Technol. 2013, 2, 1138–1155. [Google Scholar]
- Wong, K.K. Application of ponding systems in the treatment of palm oil mill and rubber mill effluents. Pertanika 1980, 3, 133–141. [Google Scholar]
- Rupani, P.F.; Singh, R.P.; Ibrahim, M.H.; Esa, N. Review of current palm oil mill effluent (pome) treatment methods: Vermicomposting as a sustainable practice. World Appl. Sci. J. 2010, 10, 1190–1201. [Google Scholar]
- Wicke, B.; Dornburg, V.; Junginger, M.; Faaij, A. Different palm oil production systems for energy purposes and their greenhouse gas implications. Biomass Bioenergy 2008, 32, 1322–1337. [Google Scholar] [CrossRef]
- Intergovernmental Panel on Climate Change. Climate Change 2014: Mitigation of Climate Change: Working Group iii Contribution to the Fifth Assessment Report of the Intergovernmental Panel on Climate Change/Edited by Ottmar Edenhofer [and Fifteen Others]; Cambridge University Press: New York, NY, USA, 2014. [Google Scholar]
- MPOB. National Key Economic Areas (NKEA) National Biogas Implementation (EPP5) Biogas Capture and Cdm Project Implementation for Palm Oil Mills; Malaysian Palm Oil Board (MPOB): Bandar Baru Bangi, Malaysia, 2014.
- Choo, Y.M. Public Consultation on Mandatory Installation of Biogas Facilities in Palm Oil Mills; Palm Oil Board: Bandar Baru Bangi, Malaysia, 2013.
- BorneoPost. Palm oil mills’ biogas capture implementation in sarawak a major challenge—Soppoa. Borneo Post Online. 5 November 2014. Available online: http://www.theborneopost.com/2014/11/05/palm-oil-mills-biogas-capture-implementation-in-sarawak-a-major-challenge-soppoa/ (accessed on 15 October 2018).
- Stichnothe, H.; Schuchardt, F. Comparison of different treatment options for palm oil production waste on a life cycle basis. Int. J. Life Cycle Assess. 2010, 15, 907–915. [Google Scholar] [CrossRef]
- Nasution, M.A.; Wibawa, D.S.; Ahamed, T.; Noguchi, R. Comparative environmental impact evaluation of palm oil mill effluent treatment using a life cycle assessment approach: A case study based on composting and a combination for biogas technologies in north sumatera of indonesia. J. Clean. Prod. 2018, 184, 1028–1040. [Google Scholar] [CrossRef]
- Vijaya, S.; Ma, A.; Choo, Y. Capturing biogas: A means to reduce green house gas emissions for the production of crude palm oil. Am. J. Geosci. 2010, 1, 1. [Google Scholar] [CrossRef]
- Hansen, S.B.; Olsen, S.I.; Ujang, Z. Greenhouse gas reductions through enhanced use of residues in the life cycle of Malaysian palm oil derived biodiesel. Bioresour. Technol. 2012, 104, 358–366. [Google Scholar] [CrossRef] [PubMed]
- Lim, C.I.; Biswas, W. An evaluation of holistic sustainability assessment framework for palm oil production in Malaysia. Sustainability 2015, 7, 16561–16587. [Google Scholar] [CrossRef]
- Lim, C.I.; Biswas, W.K. Development of triple bottom line indicators for sustainability assessment framework of Malaysian palm oil industry. Clean Technol. Environ. Policy 2017, 20, 1–22. [Google Scholar] [CrossRef]
- Lim, C.I.; Biswas, W. Sustainability assessment for crude palm oil production in Malaysia using the palm oil sustainability assessment framework. Sustain. Dev. 2018, 1–17. [Google Scholar] [CrossRef]
- Lim, C.I.; Biswas, W.; Samyudia, Y. Review of existing sustainability assessment methods for Malaysian palm oil production. Procedia CIRP 2015, 26, 13–18. [Google Scholar] [CrossRef]
- Ali, E.N.; Tay, C.I. Characterization of biodiesel produced from palm oil via base catalyzed transesterification. Procedia Eng. 2013, 53, 7–12. [Google Scholar] [CrossRef]
- Latif Ahmad, A.; Ismail, S.; Bhatia, S. Water recycling from palm oil mill effluent (pome) using membrane technology. Desalination 2003, 157, 87–95. [Google Scholar] [CrossRef]
- Bala, J.D.; Lalung, J.; Ismail, N. Palm oil mill effluent (pome) treatment ‘‘microbial communities in an anaerobic digester’’: A review. Int. J. Sci. Res. Publ. 2014, 4, 1–24. [Google Scholar]
- Wahidul, K.B. Life cycle assessment of seawater desalinization in western australia. World Acad. Sci. Eng. Technol. 2009, 56, 369–375. [Google Scholar]
- Puthankattil, V. Kubota’s biogas plant design more efficient, saves land space. Borneo Post Online. 10 December 2012. Available online: http://www.theborneopost.com/2012/12/10/kubotas-biogas-plant-design-more-efficient-saves-land-space/ (accessed on 15 October 2018).
- Jørgensen, P.J. Biogas-Green Energy •Process • Design • Energy Supply• Environment; PlanEnergi and Researcher for a Day 2009. Available online: http://www.lemvigbiogas.com/BiogasPJJuk.pdf (accessed on 10 May 2018).
- ISO. ISO 14040:2006-Environmental Management—Life Cycle Assessment—Principles and Framework; International Organization for Standardization: Geneva, Switzerland, 2006. [Google Scholar]
- ISO. ISO 14044:2006-Environmental Management—Life Cycle Assessment—Requirements and Guidelines; International Organization for Standardization: Geneva, Switzerland, 2006. [Google Scholar]
- Abdullah, R. Ghg emission for crude palm oil supply chain with and without biogas capture facility. Oil Palm Ind. Econ. J. 2013, 13, 27–37. [Google Scholar]
- Majid, R.A.; Esa, H. The use of boiler fly ash for bod, tss and colour reduction of palm oil mill effluent. Palm Oil Eng. Bull. 2017, 125. [Google Scholar]
- Othman, H.; Mohammed, A.T.; Dolmat, M.T. Bunch ash: An efficient and cost-effective k-fertilizer source for mature oil palm on peat under high rainfall environment. MPOB Transf. Technol. 2005, 254. [Google Scholar]
- Abas, R.; Abdullah, R.; Hawari, Y. Economic feasibility study on establishing an oil palm biogas plant in Malaysia. Oil Palm Ind. Econ. J. 2013, 13, 14–21. [Google Scholar]
- GasMalaysia. Tariff and Rates. Available online: http://www.gasMalaysia.com/index.php/our-services/at-your-service/bills-payments/tariff-rates (accessed on 1 July 2018).
- Arora, L.; Kumar, S.; Verma, P. The anatomy of sustainable growth rate of indian manufacturing firms. Glob. Bus. Rev. 2018, 19, 1050–1071. [Google Scholar] [CrossRef]
- Inc.com. Sustainable Growth. Available online: https://www.inc.com/encyclopedia/sustainable-growth.html (accessed on 10 September 2018).
- Mohd Nahar, O. Present Status of Odour Management in Malaysia; Research and Development Seminar 2014; International Atomic Energy Agency (IAEA): Bangi, Malaysia, 2014. [Google Scholar]
- Kreith, F.; Goswami, D.Y. Handbook of Energy Efficiency and Renewable Energy/Edited by Frank Kreith and d. Yogi Goswami; CRC Press: Boca Raton, FL, USA, 2007. [Google Scholar]
- Vallero, D.A. Green Engineering and Sustainable Design Aspects of Waste Management; Elsevier: New York, NY, USA, 2011; pp. 11–21. [Google Scholar]
- Ismail, A. The effect of labour shortage in the supply and demand of palm oil in Malaysia. Oil Palm Ind. Econ. J. 2013, 13, 15–26. [Google Scholar]
- Sime Darby Plantation’s q3 Earnings slip 39% on Lower ffb Production, Cpo Price. The Sun Daily, 31 May 2018.
- SEC. Employee Stock Options Plans. Available online: https://www.sec.gov/fast-answers/answers-empopthtm.html (accessed on 15 October 2018).
- Cain, S.A. The species-area curve. Am. Mid. Nat. 1938, 19, 573–581. [Google Scholar] [CrossRef]
- Birrell, S.J.; Hummel, J.W. Real-time multi isfet/fia soil analysis system with automatic sample extraction. Comput. Electron. Agric. 2001, 32, 45–67. [Google Scholar] [CrossRef]


| Sust. Obj. | Headline Performance Indicator (HPI) * | Key Performance Indicator (KPI) * | Performance Measures (PM) * | PM Values without Biogas Trapping | PM Values with Biogas Trapping | |||
|---|---|---|---|---|---|---|---|---|
| Env. | 1 | Natural Capital Conservation | 1.1 | Climate Change | 1.1.1 | GHG Emission (kgCO2eq per tonne CPO) | 0.814 | 0.196 |
| 1.2 | Air, Water and Soil Quality | 1.2.1 | NOx emission intensity from palm oil mill | 0 | 0 | |||
| 1.2.2 | Biological Oxygen Demand of water discharged from POME pond | 22.25 | 17 | |||||
| 1.2.3 | Soil Nitrate Level measured through pH in waterway | 92 | 92 | |||||
| 1.3 | Waste Generation | 1.3.1 | % biomass waste recovery/recycling | 81.809% | ≈100% | |||
| 1.4 | Biodiversity | 1.4.1 | Plantation Practice (Number of best practices met) | 3.5/6 | 3.5/6 | |||
| 1.4.2 | Land Use | Planted on formal agricultural land | Planted on formal agricultural land | |||||
| 1.4.3 | Species loss | 12% voted 1, 5% voted 2, 39% voted 3, 34% voted 4, 10% voted 5 | 12% voted 1, 5% voted 2, 39% voted 3, 34% voted 4, 10% voted 5 | |||||
| 1.5 | Resources Consumption | 1.5.1 | Energy (Fossil fuel and biomass) consumption intensity (Output/Input energy ratio) | 2.45 | 2.56 | |||
| Eco. | 2 | Business Continuity and Resiliency | 2.1 | Productivity efficiency | 2.1.1 | Plantation yield (tonne FFB/hectare) | 25.55 | 25.55 |
| 2.1.2 | Mill production efficiency (tonne CPO per tonne FFB) | 0.2196 | 0.2196 | |||||
| 2.2 | Business Continuity | 2.2.1 | Actual Growth Rate (deviation from sustainable growth rate) | −4% | −7% | |||
| 3 | Sharing of Economic Power | 3.1 | Relative Poverty | 3.1.1 | Average annual income per worker (% of national average income) | 26.95 | 26.95 | |
| 3.2 | Local community inclusion and distribution of wealth | 3.2.1 | Employment opportunity for the local (% of local employment) | 31.33 | 31.33 | |||
| 3.2.2 | Smallholders’ equity | 10% | 10% | |||||
| Soc. | 4 | Social Wellbeing | 4.1 | Meeting Essential Human Needs | 4.1.1 | Workers’ accessibility to water supply | 100% | 100% |
| 4.1.2 | Workers’ accessibility to health care | 100% | 100% | |||||
| 4.1.3 | Provision of sanitation facilities to workers | 100% | 100% | |||||
| 4.1.4 | Provision of housing facilities to workers | 100% | 100% | |||||
| 5 | Social Equity | 5.1 | Local community empowerment and engagement | 5.1.1 | Sharing of information with the local community | 32% voted 1, 10% voted 2, 36% voted 3, 22% voted 4, 0% voted 5 | 32% voted 1, 10% voted 2, 36% voted 3, 22% voted 4, 0% voted 5 | |
| 5.1.2 | Fair Partnership and Community involvement in decision making | 19% voted 1, 20% voted 2, 29% voted 3, 27% voted 4, 5% voted 5 | 19% voted 1, 20% voted 2, 29% voted 3, 27% voted 4, 5% voted 5 | |||||
| 5.1.3 | Level of community acceptance to plantation and mill activities | 85% agreement | 85% agreement | |||||
| Source of Emission | GHG Emission (kgCO2eq) | |||
|---|---|---|---|---|
| Without Biogas Trapping | With Biogas Trapping | |||
| Smallholder FFB | 1.47 × 10⁶ | 2.77% | 1.47 × 10⁶ | 11.48% |
| Large Plantation FFB | 9.82 × 10⁶ | 18.49% | 9.82 × 10⁶ | 76.55% |
| Water | 1.23 × 10² | 0.00% | 1.23 × 10² | 0.00% |
| Fossil Fuel consumed by mill | 1.50 × 10⁶ | 2.83% | 1.50 × 10⁶ | 11.73% |
| Methane from POME | 4.03 × 10⁷ | 75.86% | N/A | N/A |
| Chemical for Water Treatment Plant | 2.45 × 10⁴ | 0.05% | 2.45 × 10⁴ | 0.19% |
| Chemical for biogas/polishing plant | N/A | N/A | 6.21 × 10³ | 0.05% |
| Total | 5.31 × 10⁷ | 100.00% | 1.28 × 10⁷ | 100.00% |
| ID | Description | Formula | Unit | Without BGPP | With BGPP |
|---|---|---|---|---|---|
| a. | Sales figure from starting point | RM | 11,547,410 | 11,547,410 | |
| b. | Most recent sales figure | RM | 12,199,346 | 12,576,410 | |
| c. | Total Sales throughout the year | RM | 177,959,338 | 182,484,110 | |
| d. | Total Assets at year end | RM | 70,737,661 | 82,337,661 | |
| e. | Dividend | RM | 4,282,930 | 5,569,167 | |
| f. | Net Income | RM | 9,392,273. | 13,437,045 | |
| g. | Total Debt at year end | RM | 40,123,436 | 51,723,436 | |
| h. | Total Assets at year end | RM | 70,737,661 | 82,337,661 | |
| i. | Asset Utilization Rate | c/d | % | 252% | 222% |
| j. | Profitability Rate | f/c | % | 5% | 7% |
| k. | Financial Utilization Rate | g/l | % | 131% | 169% |
| l. | Total Equity | h - g | RM | 30,614,225 | 30,614,225 |
| m. | Return on Equity | I* j* k | 0.17 | 0.28 | |
| n. | Dividend Rate | e/f | % | 45.60% | 41.45% |
| o. | Business Retention Rate | 1 - n | % | 54.40% | 58.55% |
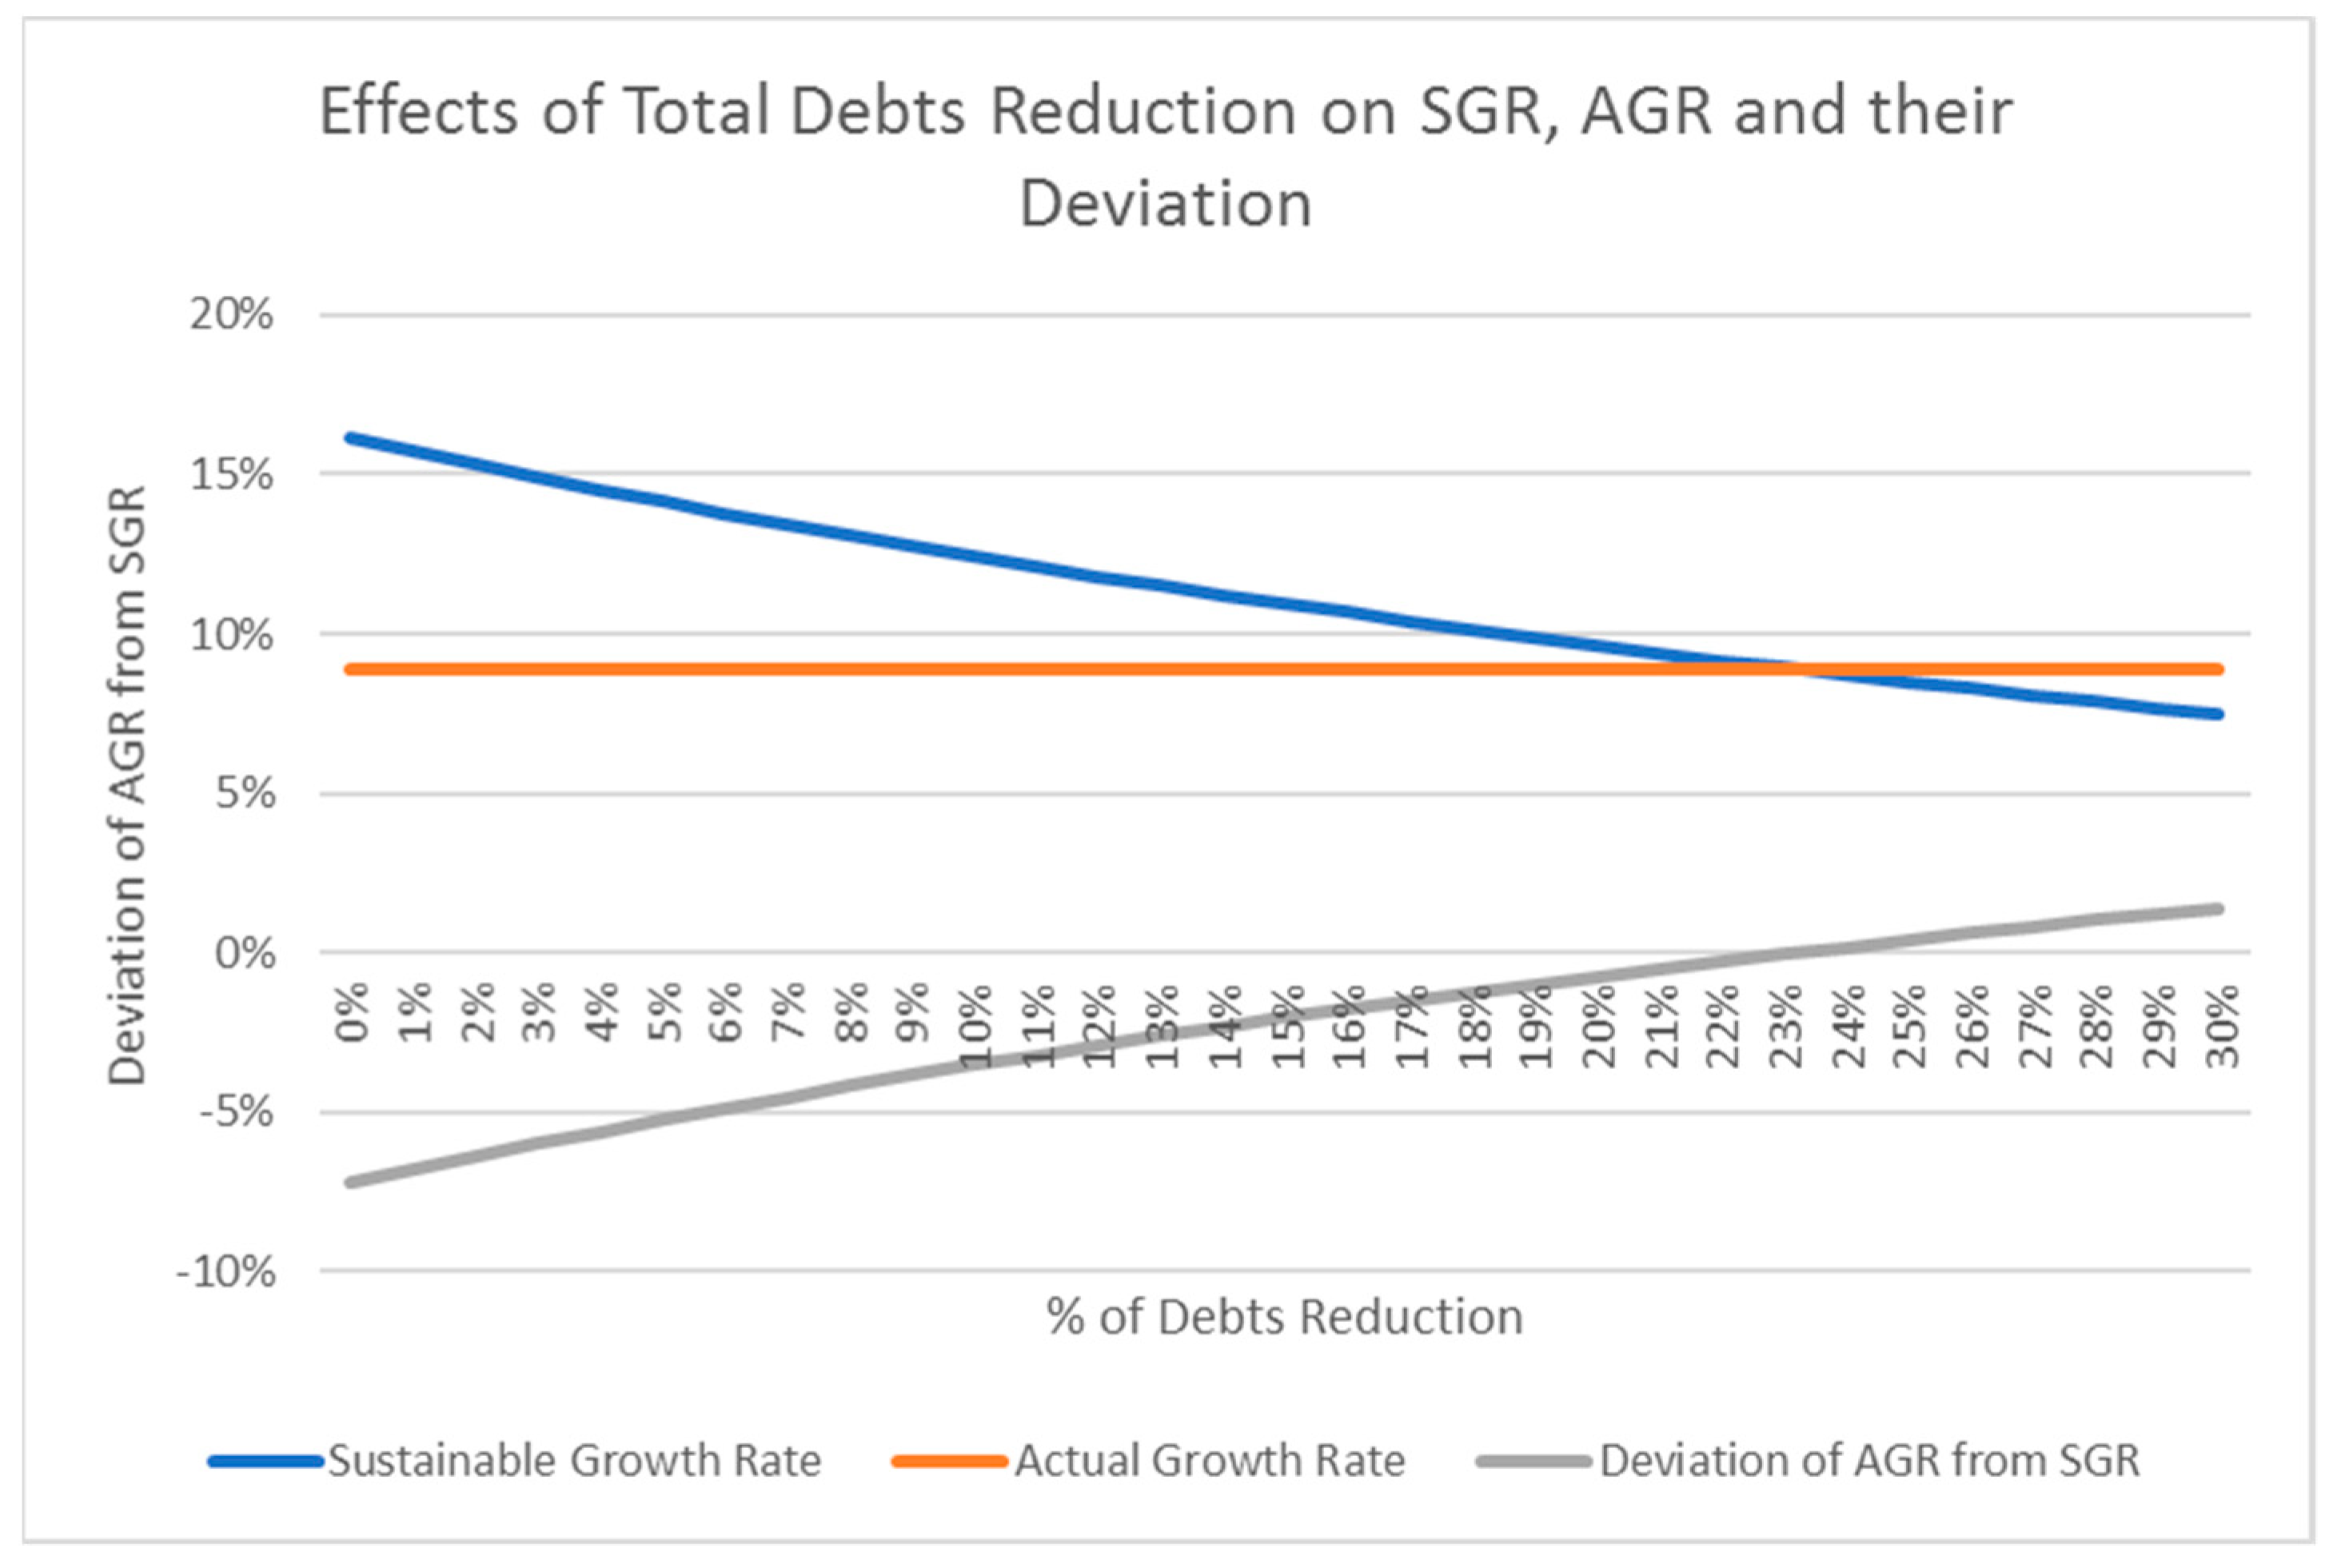
| p. | Sustainable Growth Rate | m * o | % | 10% | 16% |
| q. | Actual Growth Rate | (b - a)/a | % | 6% | 9% |
| r. | Actual Growth Rate deviation from Sustainable Growth Rate | q - p | % | −4% | −7% |
| Sust. Obj. | Headline Performance Indicator | Key Performance Indicator | Performance Measures | Ranking for PM | Overall Weight for PM | Score for KPI | Score for HPI | Score for Sust. Obj. | Score for Overall Sust. | |||
|---|---|---|---|---|---|---|---|---|---|---|---|---|
| Env. | 1 | Natural Capital Conservation | 1.1 | Climate Change | 1.1.1 | GHG Emission | 4(2) | 0.045 | 4.00 | 3.54 (2.94) | 3.54 (2.94) | 3.59 (3.47) |
| (2.00) | ||||||||||||
| 1.2 | Air, Water and Soil Quality | 1.2.1 | NOx emission intensity from palm oil mill | 5(5) | 0.0393 | 5.00 (5.00) | ||||||
| 1.2.2 | Biological Oxygen Demand of water discharged from POME pond | 5(5) | 0.0447 | |||||||||
| 1.2.3 | Soil Nitrate Level measured through pH in waterway | 5(5) | 0.0444 | |||||||||
| 1.3 | Waste Generation | 1.3.1 | % Biomass waste recovery/recycling | 5(4) | 0.045 | 5.00 (4.00) | ||||||
| 1.4 | Biodiversity | 1.4.1 | Plantation Practice | 2(2) | 0.0463 | 2.68 (2.68) | ||||||
| 1.4.2 | Land Use | 3(3) | 0.0447 | |||||||||
| 1.4.3 | Species loss | 3(3) | 0.0538 | |||||||||
| 1.5 | Resources Consumption | 1.5.1 | Energy (Fossil fuel and biomass) consumption intensity (Output/Input energy ratio) | 1(1) | 0.0415 | 1.00 (1.00) | ||||||
| Eco. | 2 | Business Continuity and Resiliency | 2.1 | Productivity efficiency | 2.1.1 | Plantation yield | 5(5) | 0.0476 | 5.00 (5.00) | 4.00 (4.50) | 2.88 (3.13) | |
| 2.1.2 | Mill production efficiency | 5(5) | 0.0485 | |||||||||
| 2.2 | Business Continuity | 2.2.1 | Actual Growth Rate | 3(4) | 0.0447 | 3.00 (4.00) | ||||||
| 3 | Sharing of Economic Power | 3.1 | Relative Poverty | 3.1.1 | Average annual income per worker | 2(2) | 0.0452 | 2.00 (2.00) | 1.76 (1.76) | |||
| 3.2 | Local community inclusion and distribution of wealth | 3.2.1 | Employment opportunity for the local | 2(2) | 0.0471 | 1.52 (1.52) | ||||||
| 3.2.2 | Smallholders’ equity | 1(1) | 0.0439 | |||||||||
| Soc. | 4 | Social Wellbeing | 4.1 | Meeting Essential Human Needs | 4.1.1 | Workers’ accessibility to water supply | 5(5) | 0.0471 | 5.00 (5.00) | 5.00 (5.00) | 4.34 (4.34) | |
| 4.1.2 | Workers’ accessibility to health care | 5(5) | 0.0476 | |||||||||
| 4.1.3 | Provision of sanitation facilities to workers | 5(5) | 0.0474 | |||||||||
| 4.1.4 | Provision of housing facilities to workers | 5(5) | 0.046 | |||||||||
| 5 | Social Equity | 5.1 | Local community empowerment And engagement | 5.1.1 | Sharing of information with the local community | 3(3) | 0.0425 | 3.68 (3.68) | 3.68 (3.68) | |||
| 5.1.2 | Fair Partnership and Community involvement in decision making | 3(3) | 0.0433 | |||||||||
| 5.1.3 | Level of community acceptance to plantation and mill activities | 5(5) | 0.0444 | |||||||||
© 2019 by the authors. Licensee MDPI, Basel, Switzerland. This article is an open access article distributed under the terms and conditions of the Creative Commons Attribution (CC BY) license (http://creativecommons.org/licenses/by/4.0/).
Share and Cite
Lim, C.I.; K. Biswas, W. Sustainability Implications of the Incorporation of a Biogas Trapping System into a Conventional Crude Palm Oil Supply Chain. Sustainability 2019, 11, 792. https://doi.org/10.3390/su11030792
Lim CI, K. Biswas W. Sustainability Implications of the Incorporation of a Biogas Trapping System into a Conventional Crude Palm Oil Supply Chain. Sustainability. 2019; 11(3):792. https://doi.org/10.3390/su11030792
Chicago/Turabian StyleLim, Chye Ing, and Wahidul K. Biswas. 2019. "Sustainability Implications of the Incorporation of a Biogas Trapping System into a Conventional Crude Palm Oil Supply Chain" Sustainability 11, no. 3: 792. https://doi.org/10.3390/su11030792
APA StyleLim, C. I., & K. Biswas, W. (2019). Sustainability Implications of the Incorporation of a Biogas Trapping System into a Conventional Crude Palm Oil Supply Chain. Sustainability, 11(3), 792. https://doi.org/10.3390/su11030792