Abstract
In Ethiopia, there have been increased efforts to promote market-oriented vegetable production. Given that food security is a crucial issue in Ethiopia, the question is whether market-oriented vegetable production will actually help farmers to become more food secure. Using a mixed methods approach, the present research gathered empirical evidence on the determinants of participation in the vegetable business and its food security impacts in the Raya Azebo district. The Heckman two-stage selection model was used to identify factors affecting participation in the vegetable business and its effects on several food security outcomes. A thematic analysis was applied to the qualitative data. The results show that a farmer’s participation in the vegetable business increased significantly with adequate household productive resources (e.g., land size and access to irrigation), cooperative memberships and access to extension services. On the other hand, the age of the head of household, the market distance and risk perceptions significantly decreased participation. Additionally, the results indicate participation in the vegetable business results not only in higher food availability and access but also in lower food variety and diet diversity scores. Participation has less of an impact on per capita kilocalorie consumption and child anthropometric measures of food security. The policy implication is that, while Ethiopia is going ahead with inclusive market-driven approaches to food security, alternative mechanisms must be put in place to address the negative impacts and to empower those living in the most vulnerable conditions.
1. Introduction
Food security has been a top priority and global concern for decades [1]. Ethiopia is one of the world’s most food insecure countries: it ranks 174th out of 188 countries on the Human Development Index [2,3,4]. To address this problem, the Ethiopian government has been promoting various private- and state-led agricultural commercialization strategies [5].Private-led commercialization often operates in areas that are rich in resources and is mainly concerned with linking smallholder farmers to markets. Although private-led agricultural investment may have some positive impacts at the macro level, it has been criticized in terms of marginalizing family farmers and found weak in including resource-poor smallholder farmers in the business ventures [6].
On the other hand, state-led market orientation strategies are aimed at creating enabling conditions to facilitate smallholder market orientation in areas where private firms are virtually absent. In recent decades, these efforts in the drought-prone lowland areas have been in the form of investing in large-scale irrigation projects, thus modernizing the agricultural sector and incentivizing smallholder farmers to enter the cash crop business [7,8,9,10]. As a result, areas that received irrigation infrastructures have become centres for market-oriented vegetable development [11].
However, empirical studies have produced mixed results concerning the impacts of such strategies on food security. Although several authors found that participation improves farmers’ income and food security [12,13,14,15], the question of who participates remains unanswered. Some scholars [16,17] report mixed effects of cash cropping on food security. Other evidence indicates negative links between cash cropping and food security [17,18,19], as food security can be related to consumption habits, the allocation of income within households, the food supply at local markets and intensified vulnerability to changes in food prices [20]. Overall, findings on the nexus between smallholder farmers’ participation and food security are mixed and vary in time and space, which calls for continuous site-specific studies.
Despite the hype surrounding the role of state-led irrigation interventions in facilitating market orientation and improving food security, empirical evidence from Ethiopia is also limited. As the strategy has become a major pillar in the country’s agricultural development, it is important to address this knowledge gap. The present research, therefore, investigated factors that affect a farmers’ participation in the vegetable business and its food security impacts in three selected villages in the Raya Azebo district, northern Ethiopia. Understanding these effects is important to shed light on the ongoing debate on whether state-led efforts to promote market orientation will help to reduce food insecurity in Ethiopia. Towards this end, a detailed socioeconomic study among both vegetable producers and non-producer farmers in the state-led irrigation intervention areas was conducted using various qualitative and quantitative tools.
This paper contributes to understanding the effects of agricultural development strategies that are aimed at having sustainable effects on food security by integrating farmers into the agricultural value chains. This paper is relevant to these development challenges in at least three ways. First, the findings presented in this paper are relevant to Ethiopia’s policy of facilitating smallholder farmers’ commercialization by examining multiple factors that affect participation. Second, the paper contributes to the literatures that advocate for more inclusive business models by exploring the existing state-led interventions to promote smallholders’ market orientation rather than those that focus either on large-scale farmers-led agribusiness development or on state-led broad-based agricultural development programmes. Third, this paper contributes to the market orientation-based impact evaluation literature by determining whether participation in cash cropping translates into higher food security impacts.
2. Literature Review
2.1. The State of Food Security
Food security exists when all people at all times have physical, social and economic access to sufficient, safe and nutritious food to meet their dietary needs and food preferences and can thus live an active and healthy life [21,22]. The four pillars of food security are availability, access, utilization and stability [20,21]. For many decades, food security has been a top priority and global concern [1]. It is included in the UN Sustainable Development Goal of zero hunger by 2030. In developing countries, food insecurity is one of the most pressing issues, as more than one in seven people are victims of food insecurity [23]. Africa remains the region with the highest prevalence of food insecurity. Sub-Saharan Africa accounts for a large share of victims of food insecurity: more than 30%of the population is undernourished [24]. Ethiopia, Tanzania, Nigeria, Kenya and Uganda are the countries with the highest number of people in a state of hunger [2].
2.2. Smallholders, Cash Crops and Food Security
Although cash cropping is often viewed as a way to improve food security due to its comparative advantages over other farming practices, the practice is debatable because of its inclusion process and impacts. In the literature, there is a discussion about the potential benefits of supporting farmers to grow cash crops in terms of generating income and healthy food [25]. For instance, the empirical evidence on smallholder cash cropping in various African countries shows that, due to an increase in income, farmers and farm labourers are able to improve their food access, availability, utilization and stability [13]. A nationwide study on fruit and vegetable production in many African countries further revealed the positive impact on the food security of the people engaged in the sector, as well as on that of urban and rural consumers [12]. Scholars further reported the existence of complementarities between food and cash crop production through increased access to technologies and input–output markets, which in turn improved the productivity of other crops through household-level synergies and regional spill over effects, thereby improving food security [8,15,26].
In addition to serving local markets, cash crop production also has a niche export market that generates high returns [13]. In relation to this, a study in Senegal showed the significant role of export-oriented fruit in income, food security and female off-farm wage employment, which led to increased female bargaining power in the household [27].
The effects of cash crop vegetable cultivation on smallholder’s food security have been widely studied. For example, several authors found that participation in the vegetable business improves farmers’ income, food access, availability and consumption [12,13,28,29]. The production of vegetables is found to stimulate exports, the development of rural labour markets and female wage employment in companies. Evidence also supports the positive effects of vegetable production on income due to a higher market value and profitability [30]. With relatively better cropping intensity; vegetables generate more farm income compared to other crops. Moreover, vegetables are sources of vitamins, minerals and antioxidants that are important for human health [31]. It has also been noted that the promotion of vegetable production increases food availability at local markets and enhances its consumption. This leads to a reduction in hidden hunger, i.e., dietary health problems related to micronutrient deficiency [31].
Vegetables have a high export potential and can substantially contribute to foreign exchange earnings. In 2013, for example, Ethiopia exported 220,213 tons of vegetables and generated USD 438 million [30]. Furthermore, the development of a processing industry and the intensive production practices of vegetable crops also contribute to employment creation [32]. As such, smallholders’ vegetable production is perceived as an important economic activity in Ethiopia [30]. These findings highlight the potential of smallholders’ engagement in cash cropping to improve food security for society as a whole. Despite the increasing importance of vegetables in the Ethiopian economy, there is inadequate knowledge on the impacts of the vegetable business on several dimensions of food security—especially in the Raya Azebo district targeted in the present study.
There are, however, also arguments against cash cropping. One argument challenges the participation process with claims that smallholders are excluded from value chains or are included only on adverse terms due to productive resource constraints [33]. The literature on smallholder cash cropping shows that participation in such schemes is influenced by a multitude of factors operating at different scales that make the transition from subsistence to market-oriented production less easy [34,35]. Case studies in India showed that institutional variables—such as access to market information and finance, as well as distance to market—were decisive factors influencing farmers’ decisions to participate in supermarket supply chains [36]. Smallholder farmers often lack the access to the inputs and the credit needed to buy these inputs [6,37,38]. The literature describes how, in the absence of a supportive input–output market, resource-poor farmers hardly benefit from commercial agriculture [33]. Moreover, some scholars indicate the importance of the demographic characteristics of the household, their education, the farm size and their social networks in determining farmers’ participation in commercial rice farming [34].
Farm households in developing countries live in highly risky and imperfect markets and suffer great variation in their productive resources. Engaging in cash cropping business in the face of such imperfection is difficult for the resource-poor households. Social networks can help individuals access resources, thus enhancing one’s social network is considered essential for engaging in cash cropping business. Social networks that facilitate sharing and redistribution may help mitigate the impact of resource shocks [39]. A previous research found a positive effect of social network on technology adoption and market participation [40]. This is due to the fact that networks enable farmers to learn new practices from the information provided by interpersonal ties [40]. Moreover, farmers are more likely to participate in cash cropping if they have better access to informal finance through social networks because social networks enable them to finance their investments in new inputs and their technology acquisitions. Increased access to useful social networks has also become a crucial resource that provides social support to all individuals within the community [41,42]. The spread of information about the benefits of the adoption of technological innovations is significantly facilitated by the participation of individuals within their social networks [43]. Having reliable input–output information could dramatically change the way farmers go about their cash crop business. Recent studies have shown that social networks are an important determinant of social learning and information spillover as an important driving force in the wake of cash cropping [40].
In addition, there are situations in which some risk-averse farmers exclude themselves from commercial farming, preferring to pursue their existing livelihood strategies [33]. Several studies have shown that switching to cash crops may result in less land, labour and capital being devoted to food crops and hence may reduce the production of food crops [26]. For instance, a study in northern Ghana revealed a negative relationship between the extent of cash crop farming and measures of food access, availability and utilization [17]. Chege et al. [16,44] reported that commercialization had mixed effects on food utilization in different areas of Kenya, namely a positive impact in high potential areas and a negative impact in the arid area, which is already food deficit. Other findings indicated the absence of a significant association between cash crop orientation and food security [19]. Overall, the literature revealed that the relationship between cash cropping and food security varies significantly across geographical areas, crop choice and existing local and global social structures [45,46].
2.3. Analytical Framework
In this study, considering the specificity of the study area and the empirical findings mentioned above, farmers’ participation in the vegetable business was presumed to be influenced by their household characteristics; level of social networks; resources endowment; and external institutional environments, such as irrigation, the availability of credit, extension and the market and transport services in which the famers operate (Figure 1). Similarly, the effect of the vegetable business on food security can be influenced by various factors. For example, promoting cash cropping through remunerative price incentives can make a substantial contribution to food security through its income functions. However, factors like the high price of inputs, income allocation to non-food expenditures, increased market prices and increased availability of food crops at the local market, and household knowledge of nutrition can make cash cropping ineffective at contributing to food security gains regardless of increases in household earnings.
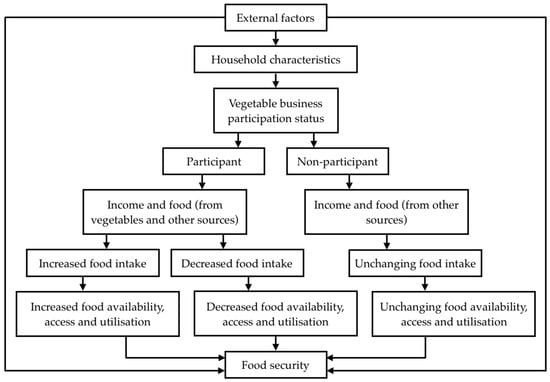
Figure 1.
The analytical framework on the link between the vegetable business and food security.
3. Context of the Study
3.1. Agriculture, Irrigation and Food Security Policies in Ethiopia
Ethiopia’s estimated population of over 100 million makes it the second most populous nation in Africa. The nation is agro-ecologically and ethnically diverse and dominantly agrarian [47]. Agriculture is the backbone of Ethiopia’s economy, accounting for 36% of the GDP, 70% of export earnings, 76% of the livelihood of the country’s workforce and nearly 80% of the employment in rural areas [48]. On average, crop production makes up 60% of the sector’s outputs, whereas livestock accounts for 27% and other areas, e.g., the services and industry sectors contribute 13%of the total agricultural value added. The sector is dominated by small-scale farms (85%). There are about twelve million individual smallholder farmers, with an average farm size from 0.5 hectares to 2 hectares; currently, 95 percent of the total area is under agricultural use, producing up to 90 percent of the country’s food crops [48].
In Ethiopia, the land is owned by the state [49,50,51]. Farmers access land mainly through state-mandated peasant associations. Access is conditional on the proof of permanent physical residence and the ability to keep the farm operational. Qualified farmers have long-term usufruct rights to the land. At the same time, different rental contracts are also often informally arranged with varied land use, transfer rights and degrees of enforcement [52]. Local land rental markets such as sharecropping and cash rental arrangements are on the rise. An estimated 15 to 30 percent of rural households choose these markets as a way to pool resources and risks (e.g., land for labour or land for oxen). It is expected that population growth; infrastructure development in transport, irrigation and marketplaces; the increasing commercialization of agriculture; and overall growth of the rural economy will favour the expansion of land markets in the future [52].
Since the mid-1990s, agricultural development-led industrialization (ADLI) has been the country’s leading development strategy [53,54]. The main arguments used to justify ADLI as an overarching economic policy are that improving the performance of smallholder agriculture could lead to the improved performance of the nation’s entire economic sector. As small-scale farmers are fundamental to the implementation of ADLI, building their capacities through public extension service delivery is a major policy instrument [55]. Extension services are provided at farmer training centres in every village free of charge. The extension service provision also includes home-to-home advice, training, on-farm demonstrations, experience-sharing field-days and the dissemination of information through the media. These activities have led to a tremendous increase in the use of fertilizer and improved seeds over the past two decades. This occurred despite the removal of all input subsidies since 1997/1998 [55].
ADLI policies and strategies also rely on the conditions that are being created through irrigation development. Government policy documents identify irrigation as a vital tool to stimulate sustainable economic growth and rural development. Irrigation is considered as a cornerstone to food security and poverty reduction [56]. The Ministry of Water Resources and its frontline regional bureaus are in charge of the water sector policy, the planning, water resources regulation, the development and use, and the implementation of medium and large-scale irrigation. In Ethiopia, the irrigation infrastructure is developed and maintained by the state and provided freely to smallholder farmers. After the setup of the infrastructure, smallholders only cover their farm management/operation costs [57].
Both chronic and acute food insecurities are widespread problems in Ethiopia. In the last few decades, several millions of people required immediate food assistance. For instance, official figures [47] show that in the last five years, about 12% of the population suffered from food insecurity; of these people, 7.3 and 4.8 million were affected by chronic and transitory food insecurity, respectively.
Another indicator of food insecurity is the prevalence of hunger and under-nutrition, which remain highly problematic in Ethiopia. For example, Ethiopia’s 2018 Global Hunger Index (GHI) score was 29.1, which is at the upper end of the serious threats category. The level of hunger is also high. In 2018, 21.4% of children under five were considered underweight, which contributes to a 5.5% child mortality. In the same year, 38.4% of children suffered from child stunting as a result of inadequate diets, and 9.9% suffered from wasting [58]. The majority of the population consumes a poor-quality diet that lacks a diverse range of foods and provides inadequate amounts of key nutrients [59].
Ethiopia is also one of the world’s 66 countries that have not been self-sufficient in food for decades [60]. Food self-sufficiency generally refers to the extent to which a country can satisfy its food needs from its own domestic production. The self-sufficiency ratio for Ethiopia was 83% in 2010 [60]. Evidence indicates Ethiopia has increasingly relied on international trade for some of its food consumption needs, as shown by a high food import dependence [61]. Major imports are wheat, rice and sorghum. In 2016, Ethiopia imported USD 723.92 million worth of wheat, USD 133.56 million worth of rice and USD 59.15 million worth of sorghum. At the same time, Ethiopia is exporting coffee, sesame, fruits and vegetables. In 2016, for example, coffee earned Ethiopia USD 844 million, followed by sesame (USD 349 million) and fruits and vegetables (USD 237 million) [62]
Rainfall variability is the critical failure factor for food security in most parts of the country. For instance, the number of food insecure people during the 2016 El Nino event amounted to more than 17.4% of the total population; thus, drought-induced food insecurity has become a major development threat to the country [2]. Especially in the drought-prone dryland areas, food insecurity is closely related to a vulnerability to weather shocks [14], during which crop failure is common, triggering various degrees of human and livestock harm [9,63]. An improved access to irrigation has, therefore, been provided in recent decades as a form of food security intervention [47]. The implicit assumption behind improving the access to irrigation is that it will solve the food insecurity problem by structurally changing traditional rain-fed subsistence farming into profitable year-round market-oriented farming [64].
Irrigation development is instrumental to food security as it enhances productivity; provides opportunities for climatic change adaptation; contributes to wealth creation; and enhances income, food access, consumption and growth of the local economy by creating farm and non-farm employment opportunities [53,54,65]. Studies indicate that irrigation benefits the poor through higher productions, higher yields, lower risks of crop failure and year-round farm and non-farm employment. Irrigation enables smallholders to adopt more diversified cropping patterns and to switch from low-value subsistence production to high-value market-oriented production [53]. Irrigation-led technological changes are the key drivers of productivity growth in the agricultural sector, which in turn has a substantial impact on economic growth.
Furthermore, in south Africa and Kenya, linking irrigation with the market orientation has further optimized the benefits of irrigation beyond the smallholders; in addition, access to water security has increased farmers’ confidence [28,66]. The literature reveals that irrigation generates an average income of about 323 USD /ha after accounting for the annual investment replacement cost net gross margin from irrigation (60USD/ha) which is more than twice as high as the gross margin from rain-fed agriculture [54]. In Ethiopia, smallholder irrigated agriculture is estimated to contribute about 262.3 million USD yearly incomes, which accounts for about 4.46 percent of the agricultural GDP in 2005/2006 and 1.97 percent of the total overall GDP. Irrigation is expected to boost cash cropping, which in turn is expected to improve food security [54].
3.2. The Study Area Context
Raya Azebo is one of the five districts that make up the southern zone of Tigrai National Regional State (see Figure 2). In 2017, the district had a total of 32,360 households and a population of 135,870 (67,687 males and 68,183 females); thus, each household was made up of an average of 4.20 persons. Mixed farming is the dominant practice. The total area of cultivated land in the district is 38,421 hectares. Sorghum, teff, maize, barley and chickpeas are the major crops cultivated in the district. Rain-fed agriculture has long been the most dominant form of agriculture; irrigated farming is a fairly recent arrival [67].
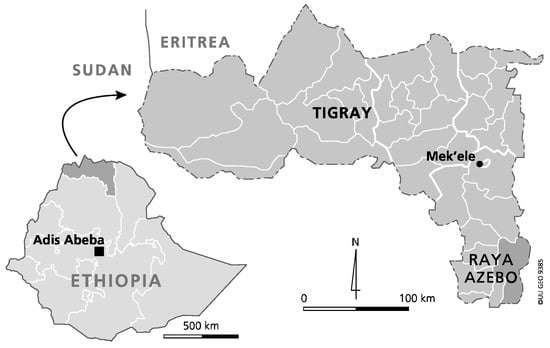
Figure 2.
A map of the study area.
3.3. The Vegetable Business in Raya Azebo
Raya Azebo is located in the Raya Valley, which is known for its fertile soil and untapped groundwater potential, as well as for the droughts that occur roughly every 10 years, triggering various degrees of human and livestock harm that result in either migration or premature loss of life [9,63]. Because of this, the valley has been targeted by the regional government for irrigation-based, market-oriented vegetable and fruit development. So far, over ETB 100 million (~ USD 3.7 million) have been invested in developing about 100 wells with the potential to irrigate 3000 hectares of land and benefit over 13,000 farmers [68]. Surface water diversions from seasonal rivers and streams and groundwater extraction from deep wells using furrow irrigation, sprinkler and drip water lifting devices have been developed. In this study, the irrigation infrastructure is developed and maintained by the state and provided freely to smallholder farmers. After the setup of the infrastructure smallholders only cover their farm management/operation costs [64].
In the last 10 years, the development of irrigation has led to the expansion of vegetables, which have become important components of new rural livelihoods. Hence, the area is considered a development corridor for commercial agriculture [63]. Following this development, land rental markets tend to be more active and rental price increased enormously. This increase in the land rental market has created a lot of opportunities. On the one hand, the increase in the land rental market provides an additional venue to access money for the landholder by substituting incomplete factor markets. On the other hand, the expansion of the land rental market provides opportunities for accessing land to landless farmers. The production of hot peppers has a long history in the area, whereas onion and tomato are new arrivals and some farmers are sceptical about growing them, despite their interest in engaging in irrigated crop production [63].
3.4. Vegetable Marketing
To understand the structure of the vegetable value chain, one must also understand the trading process and the various actors involved in it. In the study area, there are six vegetable business market channels, all operating on an ad hoc negotiation basis (see Figure 3). Smallholder farmers often sell their products to multiple buyers, which change according to seasonal demands. Spot market traders in the district market are the major vegetable buyers. Thus, the majority of the vegetables produced are channelled through these spot market traders who either sell the vegetables to local consumers or sell them onto regional or national wholesalers, sometimes for export to Djibouti, which neighbours Ethiopia to the east. The vegetable transaction process starts at the farm gate, where farmers sell their vegetables to any buyer offering a good price. In some cases, farmers obtain some services, such as loans, from these buyers. Spot market traders often aggregate the vegetables into sizable quantities and then send them to the next buyer for the next exchange. In the study area, there are occasions when farmers suffer from a lack of buyers and from price volatility, as sometimes the production from other regions flood the markets.
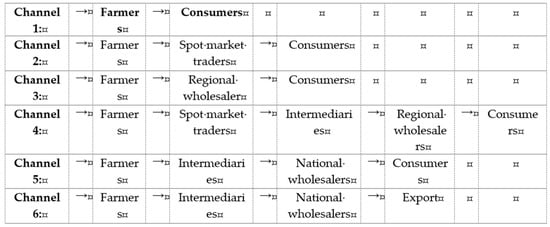
Figure 3.
The vegetable market channels.
4. Methodology
The major objectives of this study are to investigate the factors that affect participation in the vegetable business and its food security impacts in the Raya Azebo district. In this case study, both quantitative and qualitative research approaches were used, as triangulated (mixed) techniques improve the accuracy of data by allowing for cross-validated findings [69,70]. As the research design gives equal weight to both approaches, the data collection was conducted concurrently. In the results section, the data generated by each approach are presented separately, but they are merged again in an interpretation in order to draw valid conclusions about the research problem [17,33,71].
The present study employed three interdependent data collection methods. First, at the start of the investigation, one key informant interview (KII) was conducted in each tabia, to gain an impression of the study area. In the Tigrai region, the tabia is the lowest administrative unit. Second, to further understand the impact of vegetable production on food security, two rounds of focus group discussions (FGDs) were conducted in 2016 and 2017, respectively, with vegetable farmers (6 FGDs) and non-vegetable farmers (6 FGDs) in each of the three selected villages; in total, 49 farmers participated in the discussions. Moreover, one FGD was held with five officials who work closely with the sector. Each FGD and KII was transcribed the same evening or the following day by the FGD facilitator (researcher) according to the identified thematic issues, such as livelihoods, crop production, marketing, institutional development and food security trends before and after participation in cash cropping. Finally, a household survey was conducted using multistage sampling procedures. In the first stage, based on documents obtained from district officials, a list of tabias and their status in terms of their involvement in the vegetable business was generated. Of the 18 tabias in the district, the ten that were involved in the vegetable business were shortlisted for inclusion in the study. Although both vegetable producers and non-producer farmers live in these ten tabias, the tabias that did not produce vegetables were excluded from the sampling frame, as they did not accommodate both producer and non-producer farmers. As all ten tabias are similar regarding their access to infrastructure and other socioeconomic issues, three were randomly selected using a simple random sampling technique. Following this, farmers in the three selected tabias (Kara Adishabo, Wargba and Hade Alga) were stratified into producer and non-producer categories to allow for comparison. Finally, following a proportion to sample size probability sampling procedure, a total of 270 households were randomly selected; of these, 103 were participants and 167 were non-participants in the vegetable business.
Descriptive statistics and the Heckman two-stage model were used for quantitative analysis. First, descriptive statistical methods such as arithmetic means and percentages were used to describe and examine the respondents’ socioeconomic characteristics. Second, the Heckman two-stage model was used for econometric analysis to determine the factors that influence participation in the vegetable business and the effects of participation on several food security outcomes. The Heckman two-step model involved the estimation of two equations. The first dependent variable is whether a household participated in the vegetable business or not, and the second dependent variable indicates the effect of participation on several food security outcomes. The food security outcomes are conditional on the vegetable business decisions. Therefore, there may be a systematic difference between farmers, depending on whether they participate in the vegetable business. This may generate a sample selection bias. To overcome this problem the Heckman’s two-step approach was applied [34,72].
The two-step approach can only be used when the correlation between the two error terms is greater than zero; it will correct the problem of selection bias. The Heckman two-step approach fits well, as long as we used the probit model in the first stage so as to determine the factors affecting participation in the vegetable business.
In the second stage, ordinary least square OLS was applied to examine the food security effects. The probit model provides the value of the inverse mills ratio (IMR), which is the ratio of the ordinate of a standard normal distribution to the tail area of the distribution [76]. The IMR term corrects the problem of selection bias. If the IMR is not statistically significant, then sample selection bias is not a problem while a statistically significant value of IMR means that a significant difference exists between the vegetable business participants and non-participants. This method has been applied for analyzing the market participation and welfare impacts [34].Based on theoretical and empirical literatures reviews, variables that capture individual socioeconomic characteristics and spatial differences are identified to find a possible explanation for the observed participation and food security impacts (see Table 1).

Table 1.
The synthesis of the study variables and measurement indicators.
Previous authors have suggested the need for reporting an estimate of the magnitude of the differences between groups as well as the significance of the effects. Such an approach is relevant for evaluating the impacts of the development intervention [77,78]. Various methods have been described for estimating the magnitude of an effect size (ES). For practical simplicity and its strength in applied research, Cohen’s ds were used for calculating ES. Following Cohen [78], in this study, the effect sizes were calculated as a mean difference between the vegetable participant and the non-participant farmers divided by the variability among the sample (i.e., Cohen’s d). Cohen suggested that d = 0.2 be considered a “small” effect size, 0.5 represents a “medium” effect size and 0.8 a “large” effect size. This means that if two groups’ means do not differ by 0.2 standard deviations or more, the difference is minor even if it is statistically significant. According to Cohen, a “small effect size” is one in which there is a real effect, but this can only be verified through careful study. A “large” effect size is an effect which is big enough, and/or consistent enough, that one may be able to see it “with the naked eye”. A large effect size is one which is very substantial.
Data generated from the FGDs were analysed using a thematic analysis, which is an inductive approach grounded in the participants’ views [69,70]. The thematic analysis provides a flexible and useful research tool that has the potential to provide a rich and detailed yet complex account of the data. It is a method for identifying, analysing and interpreting various aspects of the research topic/themes within the data. A theme captures something important about the data in relation to the research question and represents some level of patterned response or meaning within the dataset [69].
5. Results
5.1. Characteristics of the Sample Households
Table 2 presents the characteristics of the sample households. The descriptive results indicate that the heads of participant households were younger (37.92 years) than the heads of non-participant households (42.84 years). The participant households also had more livestock (5.35) than non-participant households (4.68). In terms of the size of the owned land, the participants (1.03 ha) had more land than the non-participants (0.97ha). Moreover, in relation to the annually operated size of the land, the participant households cultivated more land (1.31ha) by renting/sharecropping arrangements than the non-participant households (0.97ha). With regards to the access to irrigation, 41.32% of the non-participant and 86.41% of the participant farmers had access to irrigation facilities on their own farm plots. Vegetable producer farmers had 5.3 family members while non-participants had5.32, with dependency ratios of 1.08 and 1.02, respectively.
Table 2.
The characteristics of the sample households.
In terms of loans, 24.53% of participant and 20.43% of non-participant households had access to loans. The participant households owed more money (ETB 1805.73) compared to the non-participant households (ETB 1204.55). In the study area, households that attended formal schooling are considered literate while those who did not attend such schooling are illiterate. Based on such a categorisation, about 30% of the participant and 17% of the non-participant households were literate. The study also looked at social networking mechanisms, that is, multipurpose cooperatives, savings and credit cooperatives, and Equbi (informal saving groups). We also found that 76.79% of participant and 51.5% of non-participant households were members of a multipurpose cooperative. About 59% of the participants and 38% of non-participants were also members of saving and credit cooperatives. In terms of membership in Equbi, 55.48% of the participants and 39.27% of the non-participants were members. The study also examined farmers’ mechanisms for extension services access, that is, training, development agent advice, exposure visits, host demonstrations and agricultural radio programmes broadcasted locally. We found that 29.05% of the non-participant and 39.81% of the participant farmers had access to training. An estimated8.74% of the participantand3% of the non-participant farmers attended exposure visits. Only 7.8% of the vegetable and 1.8% of the non-vegetable farmers hosted on farm extension demonstrations. Finally, 68.03% of the participants and 53.3% of the non-participants were actively listening to agricultural radio programmes broadcasted locally.
The number of male-headed households in the participant group was higher than that of female-headed households: 20.36% of the non-participant and 18.45% of the participant households were female-headed. In connection to the participation in off-farm/non-farm livelihood trajectories, 52.38% of the non-participant and34.91% of the participant households also engaged in areas outside agriculture (e.g., petty trade) as alternative livelihood trajectories. On the market day, the non-participant households travelled for up to five hours to access marketing services, while the non-participant households travelled for up to four hours.
5.2. Factors Affecting Smallholder Farmers’ Participation in the Vegetable Business
5.2.1. Quantitative Results on Factors Affecting Participation in the Vegetable Business
Table 3 presents the factors that affect participation in the vegetable business based on the Heckman first stage model. The regression result indicates the presence of enough information in the model to explain the factors affecting participation in the vegetable business (χ2 = 113.88, p = 0.00).
Table 3.
The binary probit regression results on the factors affecting inclusion in the vegetable business.
Land size: Based on the regression results, the land size has a positive and significant effect on participation in the vegetable business. The variable was statistically significant with less than a 5percent probability level in the model. The marginal effect of land size (hectare) indicated that as the size of land increases by one hectare from its mean value; the chance of inclusion in the vegetable business increases by 11 percentage points, as land is among the basic productive resources for cash cropping.
Distance from the district market (hours): Distance from the district market influences participation in the vegetable business negatively and significantly. The variable was statistically significant with p < 0.01 in the model. The marginal effect of this variable indicated that as the walking distance to the district market centre from the residence increases by 1hour from the mean value, the probability of inclusion in the vegetable business decreases by 5 percent. The literature also shows a decrease in the rate of farmers’ commercialization with an increase in the distance from markets. Proximity is therefore an important factor in a farmer’s decision to become cash crop-oriented as it facilitates the spatial integration of the product and factor markets [80]. Better market connections reduce the transaction costs caused by information asymmetry and increase the availability and uses of the support services, which can promote value chain development [81,82]. An empirical study [83] in Ethiopia found that access to markets and a shorter distance from rural towns affect the purchase of inputs by rural households.
Ownership of an irrigated plot: The result shows that a household’s ownership of an irrigated plot has a significant effect on vegetable business inclusion at less than a 1 percent probability level. The marginal effect of irrigation indicated that as a given farmer owns the irrigation, the probability of inclusion in the vegetable business increases by 46 percent compared to households who have no access. This indicates the significant role of such facilities for shifting towards cash cropping.
Age of the household head (years): Based on the regression results, the age of the respondent is found to influence the inclusion negatively and significantly, implying less involvement from older people, and vice versa. The marginal effect of age indicated that as a farmer’s age increases by 1 year from the mean value, the probability of inclusion in the business model decreases by 0.6 percent. The model result showed that households headed by younger individuals are more likely to engage in the vegetable business than those headed by older people.
Membership in a multipurpose cooperative: The results show that being a member in a multipurpose cooperative has a significant effect on vegetable business inclusion at less than a 10% probability level. The marginal effect of the multipurpose cooperative indicated that as a farm becomes members cooperative, the probability of inclusion in the vegetable business increases by 14 percent compared to households who are not members of such cooperatives.
Membership in a saving and credit cooperative: The results show that being a member in a saving and credit cooperative has a significant effect on vegetable business inclusion at less than a 1% probability level. The marginal effect of the saving and credit cooperative indicated that as a farmer becomes a member in a saving and credit cooperative, the probability of inclusion in the vegetable business increase by 27 percent compared to households that are not members of such a cooperative.
Hosting an extension demonstration: This influences farmers’ inclusion in the vegetable business in a positive way (p < 5%). The marginal effect of hosting an extension demonstration indicated that as a farmer become a host, the probability of inclusion in the vegetable business increase by 36 percent compared to households who do not host such demonstration. Households who had such an experience are expected to have positive attitudes to try new practices including cash crop farming. Moreover, this implies that extension supports the provision of new technologies that enhances farmer knowledge and therefore extension services encourage farmer participation in the vegetable cash crops. This result is in line with that of Reference [84] in Myanmar.
5.2.2. Qualitative Explanations of Factors Affecting Farmer’s Participation in the Vegetable Business
Participation and non-participation in the vegetable business is explained by livestock ownership, the availability of plots with access to irrigation, social networks and other factors such as perceived production and market risks. The importance of livestock in facilitating the vegetable business was supported by the results of the FGDs: participant households had larger herd sizes than non-participant households. Findings based on the discussions with both participant and non-participant farmers reveal that livestock are essential productive resources for the vegetable business as sources of power and finance through the sale of live animals or their products. As one non-participant said,
“Livestock—especially oxen—are important productive resources. If you do not have oxen, it is difficult to engage in the vegetable business, as it requires frequent ploughing. Now, hiring oxen for a day is expensive, and not everyone can afford to”.(52-year-old male farmer in Wargba tabia)
From the FGD data we examined, livestock serve as a proxy for economic well-being and are important for engaging in the vegetable business. This finding is consistent with previous studies [32] that found larger livestock sizes as the determinants for engaging in cash cropvalue chains.
Social networks: The findings from the FGDs show that household participation in cooperatives, local administrations, and informal savings and credit groups allow farmers to get better access to services such as training, credit and inputs. However, non-participant farmers often did not participate in such institutions due to various social, historical and economic reasons. To be a member of a multipurpose cooperative, saving and credit cooperative or Equbi, one has to pay an initial membership fee, as well as some monthly charges as per the rules of the particular group. As stated by a non-participant female farmer,
“I often work as a wage labourer, but if you join a cooperative, you need to go to frequent meetings, which restrict mobility. Moreover, to be part of such institutions, you need to pay a fee”.(48-year-old female farmer in Hade Alga tabia)
Farmers know that such groups are important in the provision of services, including knowledge and skills. However, looking for a different type of job was mentioned as constraining the membership of local working groups. For example, a participant in an FGD said the following:
“I often look for a job as a casual labourer. It is often uncertain; if you are part of such groups you may spend time in meetings, which may result in missing some days of work. This is a matter of having to live for today; otherwise I will not have anything to eat”.(39-year-old male farmer in Kara Adishabo tabia)
Irrigation plot ownership in the study area: Rainfall is unreliable, which makes the cultivation of input-intensive vegetables a risky business. To grow such crops, farmers require a reliable supply of water so that they can cultivate more land all year round. Irrigation is thought to provide a fertile ground for growing vegetables. As a participant in one the FGDs said,
“If you happen to have a plot of land where the government installed irrigation, you are at least half way to being involved in vegetable farming”.(44-year-old male farmer in Wargba tabia)
Most farmers who had irrigated plots leased out parts of them to other farmers but still wanted to participate in the vegetable business by self-financing. For example, a participant in an FGD said that,
“If your farm is in a water abundant area, you will cultivate these crops on small plots by leasing some of your land to finance your inputs”.(34-year-oldfemalefarmer in Kara Adishabo tabia)
Another farmer echoed the importance of such facilities:
“It’s a matter of chance. Those who have irrigation are able to choose between growing vegetables on their land or making money by leasing it out to others. But, we donot have that choice: we are dependent on rain to make our crops grow, and if the rain does not come, we work for those who have irrigation”.(32-year-old female farmer in Hade Alga tabia)
Another qualitative explanation given for not participating was that the vegetable business is risky, as it is susceptible to both biophysical and market risks. The FGD participants also said that farmers who have irrigation facilities but do not use the opportunity are weak farmers. In the words of a participant in an FGD,
“Some farmers fear the complexity and its initial cost of land rent without actually evaluating the situation. Such households are typically made up of women and the elderly, and they often lack awareness of these new crops. They have been growing cereals for years and years and fail to see the possible future gains. They are concerned about the money they would have to invest”.(56-year-old male farmer in Wargba tabia)
In relation to this, farmers mentioned the need for capacity building, as most farmers have limited knowledge of how to produce cash crops using modern irrigation facilities. A non-participant farmer said,
“If the government develops irrigation for us, we don’t know how to use it for vegetables, so we may cultivate maize or teff until we get the chance to learn how to grow vegetables”.(48-year-old male farmer in Wargba village)
Perceived production risks: As explained by the FGD participants, the risk of diseases is one of the issues that discouraged households from engaging in the vegetable business, especially those whose crops had been affected by an unknown pest in the past. Most of the last crops of vegetables had been infected by downy mildew, which had reduced the expected yield considerably. In the study area, farmers use pesticides, but most of the pesticides available in the area are said to beineffective. The damage caused by this disease was also mentioned by another participant:
“We get affected by the vegetable pest. […] We produce this crop by investing a lot of money, but then, we sell it and buy food; otherwise we have to sell our animals to buy some food. So unless we have got the treatments, it is difficult to rely on this business”.(60-year-old male farmer in Wargba tabia)
Perceived market risks: The capacity to gain more benefits from the vegetable business was reported to be influenced by market risks. FGD participants mentioned an excess supply of vegetables in the market and a lack of capacity to compete with big investors in the market. Low prices at the time of sale were consistently mentioned as a challenge. In the study area, farmers use pesticides, but most of the available pesticides are said to be ineffective. Most smallholders tend to produce similar crops, often biannually, and this increases the product supply and leads to a price drop. This was described by a participant in the vegetable business as follows:
“The challenge with the market is often linked to price drops during the harvest, and once the harvest is over the price increases; vegetable overproduction often makes the price drop, and supply by traders from faraway makes it difficult to sell our vegetables”.(37-year-oldfe male farmer in Hade Alga tabia)
Low prices are worsened by a dependence on middlemen to sell products. The smallholders said that they know these middlemen take advantage of the limited opportunities they have to sell elsewhere. An FGD participant (included household) stated,
“There is always a buyer. The problem is how much they pay, and they always take advantage. We do not have problems selling it. The problem is that the price is fixed by middlemen and they pay whatever they want. Nowadays, there are a lot of vegetables coming from central Ethiopia, and this is making the price drop. Hence, in some seasons, most fail to obtain what they had hoped for”.(29-year-old female farmer in Kara Adishabo tabia)
5.3. Food Security Impacts of Participation in the Vegetable Business
5.3.1. Quantitative Impact Results
Table 4 presents the results of the effect size. Based on the calculated effect sizes results (ES, d), the effect size was considered as large (above 0.80) for income, food availability, access and income; moderate (above 0.5) for food variety and diet diversity as well as for WAZ; small (from 0.28–0.4) for consumption per capital, WAZ and WHZ. The effect sizes on income and the food security outcomes found in this paper were comparable as indicated by various scholars such as Reference [78].
Table 4.
The differences in the income and food security outcomes between participants and non-participants of the vegetable business.
Before the introduction of the vegetable business, mixed food crop–livestock farming and forest products (e.g., wild fruits, charcoal and fuel wood) were the three important livelihood strategies. Since the introduction of vegetable production following the installation of irrigation facilities (which started in 2009), the herd size and forest product benefits have decreased. Now, vegetable farming, wage income, petty trade and vegetable merchandizing are important livelihoods in non-participant households. In participant households, vegetables are the dominant income source. In both types of household, livestock and staple food crop production still play substantial roles.
Table 5 presents the income differentials between the participant and non-participant households. A large proportion of the income of participant households was generated from vegetables (75%), whereas that of the non-participant households was from staple food crops (56%). For the participant households, non-agricultural income contributed about 20% of the annual income, whereas that of the non-participant households contributed 4%. The non-agricultural income sources of the non-participant households included wage incomes from vegetable producers, vegetable merchandizing (produced by the participant households) and petty trades for the labourers who work on vegetable farms. The total annual income of the participant households was 4.4times (ETB 51718.6) as much as that of the non-participant households (ETB 18495.63), showing the substantial income contribution of vegetables for farmers who participate in the vegetable business.
Table 5.
The income differentials among the participant and non-participant households.
The Heckman second stage model is used to analyse the effect of the vegetable business on several food security outcomes. The results are shown in Table 6.
Table 6.
The second stage ordinary least square (OLS) result: the determinants of a farmer’s food security.
Food availability: The Heckman second step equation for food availability shows that land size, amount of loan and membership in Equbi (informal saving group) were statistically significant in influencing the food availability. The coefficient of loan size is negative and significant. This means that farmers who have sizeable loans are faced with lower levels of food availability. It is likely that higher loan repayments reduce the amount that these households can spend on consumption. A higher land size has a positive and significant effect on a household’s food availability. It means an increased land size could enable farmers for better harvest, which in turn is a positive result on the food availability of the farmers. Membership in Equbi increases the food availability of farmers because a being member of Equbi helps farmers in getting the required money for consumption and other uses.
The value of inverse mills ratio (IMR) was significant and positive in the case of food availability, which means that the error terms of both the selection equation and outcome equation were correlated positively. Hence, participation in the vegetable business is related to a higher household food availability positively and significantly.
Food access: The Heckman second step equation on food copping scores (indicators of food access) showed that age, amount of loan and access to irrigation were all statistically significant in influencing food access at less than a 10% probability level. The coefficient of age was positive and significant indicating that aged farmers had higher food copping scores or lower food access. The coefficient of loan size is positive and significant, implying that farmers with a large amount of loan had employed higher food copping scores. Access to irrigation decreases food copping scores or increases food access. This could be due to the potential of irrigation in increasing production and reducing risks of crop loss resulting in improved food access.
The value of IMR was significant and negative in the case of the food copping score, which indicates that the error term of both the selection equation and outcome equation were correlated negatively. Hence, participation in the vegetable business is related to a lower copping score or a higher food access. This shows the presence of sample selection bias and therefore justifies the use of the Heckman’s two stage model. In addition, the result shows that food access of the household depends on vegetable business participation.
Food variety and diet diversity score: The value of IMR was significant and negative in both the food variety score (FVS) and diet diversity score (DDS) regression results, which means that the error term of both the selection equation and outcome equation were correlated negatively. Hence, participation in the vegetable business is related to lower food variety and diet diversity scores. This shows the presence of sample selection bias and therefore justifies the use of the Heckman’s two stage model. In addition, the result shows that the FVS and DDS of household decreased with vegetable business participation. The negative relationship between FVS and DDS and participating in the vegetable business could be associated with increased family labor engagement in the intensive vegetable production and the higher operation costs of the crop. In the study area, most farmers grow one or two vegetables (often onion and tomato) to be sold on the market. This limited crop diversification reduces food diversity within the household. In addition, poor nutritional knowledge from the farmers might contribute also to the negative relationship between cash cropping and food utilisation. The implication is that food security cannot be achieved through cash cropping alone. Rather, multiple development interventions in the financial, input and output markets sectors as well as in other rural development sectors are crucial.
5.3.2. Qualitative Impact Results
The FGD participants said that food insecurity was still a problem in their respective tabias, with substantial variability between the vegetable producer and non-producer households. Participant households pointed to the increase in their annual income since they had engaged in the vegetable business and compared it to non-participant households. Participant households said they had more physical assets and savings since getting involved in the vegetable business. Overall, participant farmers were better off in terms of benefits and were forward-looking, as illustrated by this statement from an FGD participant:
“From the income obtained from vegetables, I rented additional plots and got additional income. Before [vegetables], I did not have such ambitions [renting land]. Now I am looking for more land to rent to grow vegetables, as I found it helpful”.(41-year-old male farmer in Wargba tabia)
In the past, people had cultivated sorghum and maize once a year. Cereal crops were also said to demand less labour. However, after the introduction of irrigation, cropping frequency increased to two or three times a year, and the cropping pattern shifted to vegetables, which in turn helped to expand access to wage labour both within and outside the production areas. As described by an FGD participant,
“Since the introduction of [vegetables], there is always ploughing, harrowing, weed management […] and harvesting. In our village, there is work to do every day. If someone wants to work, a job is there. Some work 20 to 30 days a month, especially youths and landless women. [Farmers] work 8 to 20 days per month and generate good income in addition to what they produce from other farm activities”.(27-year-old male farmer in Hade Alga tabia)
FGD participants who were not participants in the vegetable business also said that they valued the contribution of the vegetable business to creating non-farm employment, and because of this opportunity local people were said to have been able to save money and improve their well-being (see Appendix). These participants described the impact on non-farm employment of participation in the vegetable business,
“Due to the increase in the number of wage labourers coming to our village, many snack, tea and coffee shops, local beverage houses, pool games and clothes sewing shops have been opened in the village. Especially women who do not have farms and do not engage in wage labour are benefiting a lot”.(31-year-old female farmer in Wargba tabia)
Food availability was said to have improved also for non-participant households after the expansion of the vegetable business. In relation to this, one of the participant farmers said,
“We often have enough food [from year-to-year] as people engage in multiple activities. This is true not only for participant households but also for most non-participant households. Our eating habits have changed. In the past, we had little choice—we ate the same type of food [injera (Injera is a pancake made with fermented cereal crop flowers (often teff and sorghum)) with shiro (Shiro is a stew made with roasted beans, peppers and various spice flowers.)] from breakfast to dinner—but now what we eat for breakfast is less likely to be what we eat for lunch or dinner”.(48-year-old female farmer in Hade Alga tabia)
FGD participants also mentioned the differences between participant and non-participant households concerning the kinds of foods eaten. Non-participant households also highlighted the positive contribution of the vegetable business to food utilization because of the easy accessibility of vegetables from neighbouring farmers and their reasonable prices, whereas in the past it had been difficult to find such crops in areas where they were not produced.
“Even if you do not produce the crop yourself, it is easy to get goods locally all the time. It is as easy as grabbing it from your garden. If a child cries for food, I can get it from a shop or from next door, as long as the money is there”.(50-year-old female farmer in Wargba tabia)
6. Discussion
6.1. Participation in the Vegetable Business
The present study shows the importance of considering a multitude of factors when trying to encourage smallholders to engage in cash cropping. This is because smallholders have long-term interwoven problems that require a series of interventions [33]. As indicated in the results section, the provision of irrigation facilities by the government has made a large contribution to the development of cash crops (vegetables, in this case). However, smallholder farmers’ participation in the vegetable business is not only determined by access to irrigation; the availability of productive resources (e.g., land size), farmers’ risk perceptions, cooperative memberships and the provision of extension services also matter.
As shown in Table 1, more than 41% of the non-participant households had access to irrigation but had not engaged in the vegetable business. This is because cash crops require additional productive resources to cover the extra costs compared to other staple food crops. However, the non-participant households, whether or not they had access to irrigated plots, often lacked productive resources to finance vegetable production; instead, they often allocated their family resources to the less remunerative staple food crops. This makes non-vegetable producers the least well-positioned to benefit from the opportunity, and they end up working as labourers for the households that do produce vegetables. Hence, building the asset base of poor households could be a better way to get them involved in and benefit from the vegetable business. In addition, farmers’ lack of experience in and risk perception of cash cropping, as opposed to the lifelong traditional rain-fed cereal-based farming known in the area, also prevented some households from engaging in the vegetable business. Because of this, even some of the non-participant farmers failed to see the possible future gains (or they did see them but did not have access to other resources) and were apprehensive about the complexity and costs associated with vegetable production, without actually knowing much about the potential benefits of irrigation, should the government provide them with it [63,85].
This finding can be partly attributed to the logic in which transforming smallholder subsistence farmers into commercial farmers would require multifaceted investment and the involvement of multiple actors in the areas of infrastructure development (e.g., irrigation), as well as institutional arrangements such as market- and sector-specific capacity development centres [86,87].This finding is consistent with previous studies [86,87] that noted that even with access to such resources as land, livestock and irrigation, knowledge-constrained farmers are unwilling to engage, or are incapable of engaging, in new commercial agricultures due to the perceived market and production risks.
As for the need for capacity building, non-participant farmers said that they wanted their own irrigation facilities but that if they did get them, they would not know how to use them. This applies to all farmers: the participants still needed training. Part of the reason for this gap is the lack of attention paid to commercial crops by frontline agricultural offices despite the interest of the top management in transforming traditional subsistence farming. Based on this result, this paper argues that inclusiveness in new commercially remunerative vegetable production needs to go beyond infrastructure (irrigation) inclusion. For example, it is essential to provide a needs assessment-based targeted capacity building to enable the effective participation and empowerment of local farmers, that is, to teach them commercial vegetable farming practices and entrepreneurial skills. We therefore argue that while the expansion of irrigation facilities is necessary, it is not the only way to increase smallholder farmers’ participation in the vegetable business. This is particularly important in promoting a socially inclusive business that demands new farming methods, as the vast majority of farmers in the Tigrai region and elsewhere in Ethiopia lack the capacity to use such opportunities [88]. The failure to integrate such a complementary (i.e., capacity building) intervention may be detrimental to the poor by promoting informal land markets that benefit those who are already better off [33].
Multipurpose cooperatives, savings and credit cooperatives and Equbi are social networking mechanisms, and farmer’s participation in such networks has a positive influence on his or her participation in the vegetable business. Social networks via cooperatives are vital in promoting the commercialization of smallholders in rural areas through their services provision and knowledge exchange [41,42]. This is because networked farmers often acquire new farm management skills and information from their networks.
However, not all farmers are part of these networks; especially resource-constrained farmers found it difficult to be part of the social networks due to their engagement in off-farm and non-farm activities and the financial contributions they would have to make. As a result, they lacked the benefits generated by such networks and could not use the opportunity. Thus, social capital development is vital to increase social inclusiveness and ensure the continuity of the development of the vegetable business [89]. This can be done either by establishing new networks that consider the practical difficulties faced by participant/non-participant households or by integrating the poor in the existing networks. The argument behind the need for social networks in the vegetable business sector is based on five interdependent presumed benefits:
- As the farmer-to-farmer networking outreach improves and involves all social groups in the rural areas, it will make the formal extension system to disseminate relevant knowledge easier.
- Increased networking will enable smallholder households to learn from their peers’ lessons and the best practices regarding the vegetable business.
- Improved farmers’ networks will enhance farmers’ negotiating power in input–output marketing processes, which will increase the benefits from non-agricultural activities for both the participant and the non-participant farmers.
- This economic empowerment will also contribute to improving the efficiency of vegetable production by reducing production and marketing risks and by creating special rural economic zones with numerous options for engagement.
- In the long run, improved farmers’ networks can create a fertile niche for private-sector service providers that can replace the public extension service and provide sustainable market access, as they have a greater potential to extend the outreach either to local processing or to external consumers. Such networks can also share such resources, for example oxen, seeds and irrigation facilities.
6.2. Impacts of the Vegetable Business on Household Food Security
The second stage regression indicates that age, education status, land size, loan size, Equbi and other cooperative memberships, access to irrigation and participation in the vegetable business significantly influence several food security outcomes. These results suggest that addressing food security requires an intervention at the household, institution and infrastructure levels. These interventions should include the availability of loans, functional linkages between different actors, access to inputs and social capital, and enabling institutional support systems.
The introduction of vegetables as cash crops had played a vital role in the livelihoods of both participant and non-participant households. Farm households were changing their livelihood trajectories from cereals to cash crops and from increased herd size and wild fruit/forest products to off-farm and non-farm activities. In participant households, the vegetable business was thriving, and in non-participant households, wage employment, vegetable merchandizing and petty trades were emerging livelihoods. The increased employment opportunities had played a crucial role in improving the food availability and access indices of food security for participant and non-participant households in different ways.
For the producers, cash cropping was a source of both food and finance. It comprised a large share of their livelihood portfolios and was a dependable source of income, even during weather shocks. Because of this, participant households had better food availability than previously, as did non-participant households. Particularly during unforeseen weather shocks, participant households had a stable food supply both from their own production and by purchasing food using their income from the vegetable business.
The introduction of the vegetable business in the study area had resulted in an increased labour demand and an influx of wage workers from other areas. This vegetable business-driven inflow of casual labourers also increased the spillover effects of the demand for casual labour both within the district and further afield. This, in turn, enhanced the purchasing power of both local people and those in adjacent areas, either through engaging in non-farm local business or as casual labourers, indicating the existence of development chains within and between different spaces in a given development corridor [90]. These chains of development opportunities, in turn, enabled non-participant households to secure a substantial proportion of their annual incomes, reflecting the substantial contribution of the vegetable business to non-participant households.
We therefore argue that the vegetable business provides benefits regarding food availability and access that go beyond the participant households. The benefits of such cash cropping should be evaluated beyond the income directly obtained from the sale of the commodity of interest (vegetables) and be seen in terms of the broad livelihoods of the whole society. This may include accounting for all off-farm wages and non-farm incomes generated by the vegetable business, which often indirectly benefit those who are not participants in the production of the commodity, as shown in this paper.
The differences in food availability and food access were significant between participant and non-participant households, signifying the important role of the vegetable business in such food security dimensions. The findings of this case study are consistent with the literatures that indicate that higher incomes from cash crop farming increase a household’s ability to obtain better food availability and access due to the higher family incomes with which they can purchase food [14]. However, the findings of this paper contradict those scholars who indicated negative relationships between cash crop production and food availability, access and utilization [17].
The impact of participation in the vegetable business on food utilization was less convincing. For instance, participation was significantly and negatively associated with food variety and diet diversity scores. However, the effects on calorie intake and child nutrition were non-significant. The negative and significant relationship between food utilisation (food variety and diet diversity score) and participation in the vegetable business can be justified based on two major reasons. First and foremost, participation in cash cropping reduces household saving and finances as cash cropping absorbs most of the household savings that might otherwise be used for purchasing different food items [26]. Second, shifting to cash cropping requires intensive efforts by all family members, including housewives who are usually responsible for food purchase and preparation. With less time to travel frequently to markets, they may face difficulties purchasing diverse food items that are not available locally [91,92].
However, the non-significant differences in calorie intake and child anthropometry between participant and non-participant households reflected the weak performance of the vegetable business, as increased income was not translated into the food calorie intake and child anthropometry measures. The absence of a significant impact on such food security dimensions might be due to the lack of proper nutritional knowledge and good local markets to supply adequate quantities of food items [20,93]. In fact, FGDs indicated that food security remained a challenge to various degrees across the villages, with households claiming to have insufficient food supplies due to an inadequate supply of diverse food items at local markets and a lack of financial access often caused by poor crop price incentives.
To address such imperfections, it is crucial to foster the state-of-the-art in vegetable production and marketing to reap the benefits of the vegetable business [74,94].This can be achieved through promoting pluralistic service deliveries by widening the vegetable business playground for private service providers. Similarly, a better arrangement in the output markets could increase farmers’ income substantially. For example, Kellyet al. [6] indicated the substantial role of integrating smallholder producers with different agribusinesses in increasing the producers’ income, which will also provide various indirect opportunities for casual labourers, local petty traders and consumers. Hence, the next step in the state-supported irrigation-based cash cropping should be to promote a more inclusive business model by using public–private partnership schemes that involve research, micro finance, seed suppliers, vegetable processing companies, consumer associations and farmers, as this will improve the direct and indirect food security outcomes achieved by the vegetable business so far. Towards this end, inclusive business instruments, such as contract farming arrangements with national traders and agribusiness, could be a point of departure [95].
7. Conclusions and Policy Implications
This study gathered the empirical evidence on the determinants of participation and food security impacts of vegetable business in the Raya Azebo district, northern Ethiopia. To do so, both qualitative and quantitative methods were employed. The quantitative data on the factors affecting participation in the vegetable business show that a household’s productive resources (e.g., land size and access to irrigation), access to extension services, membership in cooperatives and Equbi significantly increase the likelihood of a farmer’s inclusion. On the other hand, the age of the household head and the market distance significantly decreases inclusion. On top of these factors, participants in the in-depth focus groups further emphasized the importance of price incentives as vital conditions for inclusion or non-inclusion in the vegetable business.
The results further indicate that age, education status, land size, loan size, Equbi and cooperatives membership, access to irrigation and participation in vegetable business significantly influence several food security outcomes.
Both qualitative and quantitative results indicate that the rise of vegetable production makes a substantial contribution to food availability and access for society at large. This contribution occurs through wage income for labourers and through the income generated for the producers. However, there is a negative relationship between participation in the vegetable business and the scores for food variety and diet diversity. There is also a lack of relationship between consumption per capita and the different metrics of the nutrition components of food security. These remaining challenges indicate that current market facilitation and irrigation developments are not enough. We therefore recommend that other actors working on food, nutrition and rural livelihoods should be integrated.
We conclude that the vegetable business in Raya Azebo has made a substantial contribution to food availability and food access not only through the income generated by the producers but also through wage and petty trade incomes in the wider society, and that is likely to continue at least in the medium term. However, the vegetable business has not been able to address inequities in food security, and the contributions it makes are obviously most substantial for the participating households.
Our results have important policy implications for food security in particular and for inclusive development in general. Expanding the irrigation infrastructure is pertinent for food security, as it will enable some of the current non-participating farmers to become participants in commercially remunerative vegetable production. An additional potential strategy is for the government to facilitate the establishment of mechanisms that link smallholder producers with (inter)national agribusiness. It is commonly argued that this might improve market functions. This, in turn, is said to create job opportunities in the local area and beyond, ranging from farm operation to non-farm business opportunities for landless youths and landless women. However, the effects of such agribusiness-induced changes on inclusiveness and rural livelihoods are far from being fully understood and should be a focus of further research.
The implementation of this model of the inclusive market-driven approach must address head-on the fact that the poorest households, which form the majority of households, are not taking part; as such, households will participate only after their conditions become less vulnerable. The policy implication is that, while Ethiopia is going ahead with market-driven approaches to food security, alternative mechanisms must be put in place to empower those living in the most vulnerable conditions.
Author Contributions
K.G. designed this research, collected the data, analysed the result and wrote the draft article. M.L.; C.R.; A.Z. and G.v.W. participated in supporting the design, framing the overall data analysis, interpreting the results and reviewing the manuscript. All authors gave comments and approved the final manuscript.
Acknowledgments
This research was part of the research agenda of the Knowledge Platform Inclusive Development Policies. It was funded by the Netherlands Ministry of Foreign Affairs through NWO–WOTRO (Netherlands Organisation for Scientific Research–Science for Global Development). The support of NWO under the programme “Feeder road development for inclusive productive employment” in preparing this paper is acknowledged.
Conflicts of Interest
The authors declare that they have no conflict of interest.
Appendix A
Table A1.
The food consumption patterns among participant and non-participant households.
Table A1.
The food consumption patterns among participant and non-participant households.
| Food Items | Food Subgroups | Societal Preference | Use | Before Vegetable Production | Household Category | |
|---|---|---|---|---|---|---|
| Participants | Non- Participants | |||||
| Cereals | Sorghum | Second | Injera | Common dish | Sometimes | Common |
| Teff | Most | Injera | Sometimes | Common | Rarely | |
| Maize | Least | Bread | Sometimes | Rarely | Sometimes | |
| Wheat | Least | Bread | Sometimes | Rarely | Common | |
| Beans | Chickpea | Least | Stew in the form of shiro/splited bean | Common | Common | Sometimes |
| Fababean | Second | Stew in the form of shiro/splited bean | Sometimes | Common | Sometimes | |
| Field pea | Most | Stew in the form of shiro/splited bean | Sometimes | Common | Sometimes | |
| Lentil | Second | Splitedbean Stew | Sometimes | Common | Sometimes | |
| Grass pea | Least | Sometimes | - | Sometimes | ||
| Vegetables and fruits | Onion | Most | Spices/salad | Common | Common | Common |
| Tomato | Most | Salad | Rarely | Common | Common | |
| Cabbage | Most | Salad/stew | Rarely | Common | Common | |
| Papaya | Most | Raw | Rarely | Sometimes | Sometimes | |
| Mango | Most | Raw | Rarely | Sometimes | Sometimes | |
| Animal products | Dairyproducts | Most | Raw | Sometimes | Rarely | Rarely |
| Meat | Most | Stew | Sometimes | Rarely | Rarely | |
| Eggs | Second | Stew orotherforms | Sometimes | Rarely | Rarely | |
References
- Conceição, P.; Levine, S.; Lipton, M.; Warren-Rodríguez, A. Toward a food secure future: Ensuring food security for sustainable human development in Sub-Saharan Africa. Food Policy 2016, 60, 1–9. [Google Scholar] [CrossRef]
- Endalew, B.; Muche, M.; Tadesse, S. Assessment of food security situation in Ethiopia: A Review. Asian J. Agric. Res. 2015, 9, 55–68. [Google Scholar] [CrossRef]
- Devereux, S.; Sussex, I. Food Insecurity in Ethiopia; Institute for Development Studies: Brighton, UK, 2000. [Google Scholar]
- Human Development Reports. 2017. Available online: http://www.hdr.undp.org/ (accessed on 29 January 2019).
- Bekele, A.; Kassa, B.; Legesse, B.; Lemma, T. Effects of crop commercial orientation on productivity of smallholder farmers in drought-prone areas of the Central Rift Valley of Ethiopia. Ethiop. J. Agric. Sci. 2011, 21, 16–34. [Google Scholar]
- Kelly, S.; Vergara, N.; Bammann, H. Inclusive Business Models: Guidelines for Improving Linkages between Producer Groups and Buyers of Agricultural Produce; FAO: Rome, Italy, 2015. [Google Scholar]
- Fekadu, M.; Dandena, G. Review of the status of vegetable crops production and marketing in Ethiopia. Uganda J. Agric. Sci. 2006, 12, 26–30. [Google Scholar]
- Lilja, N.; Sanders, J.H. Welfare impacts of technological change on women in southern Mali. Agric. Econ. 1998, 19, 73–79. [Google Scholar] [CrossRef]
- Berhane, G.; Gebrehiwot, A.; Gebrezgiabher, T.; Berhe, K.; Hoekstra, D. Tropical Fruit Production through Value Chain Development Approach in Alamata Woreda, Northern Ethiopia: Experiences from IPMS; ILRI: Nairobi, Kenya, 2010. [Google Scholar]
- Paglietti, L.; Sabrie, R. Review of Smallholder Linkages for Inclusive Agribusiness Development; Best Practices in Investment Design (FAO) Eng No. 7; FAO Investment Centre: Rome, Italy, 2013. [Google Scholar]
- Von Braun, J.B.; Kennedy, E. Conceptual Framework; Johns Hopkins University Press: Baltimore, MD, USA, 1994. [Google Scholar]
- Joosten, F.; Dijkxhoorn, Y.; Sertse, Y.; Ruben, R. How Does the Fruit and Vegetable Sector Contribute to Food and Nutrition Security? LEI Wageningen UR: Wageningen, The Netherlands, 2015. [Google Scholar]
- Achterbosch, T.J.; van Berkum, S.; Meijerink, G.W.; Asbreuk, H.; Oudendag, D. Cash Crops and Food Security: Contributions to Income, Livelihood Risk and Agricultural Innovation; LEI Wageningen UR: Wageningen, The Netherlands, 2014. [Google Scholar]
- Negash, M.; Swinnen, J.F. Biofuels and food security: Micro-evidence from Ethiopia. Energy Policy 2013, 61, 963–976. [Google Scholar] [CrossRef]
- Govereh, J.; Jayne, T.S. Cash cropping and food crop productivity: Synergies or trade-offs? Agric. Econ. 2003, 28, 39–50. [Google Scholar] [CrossRef]
- Chege, C.G.; Andersson, C.I.; Qaim, M. Impacts of supermarkets on farm household nutrition in Kenya. World Dev. 2015, 72, 394–407. [Google Scholar] [CrossRef]
- Anderman, T.L.; Remans, R.; Wood, S.A.; DeRosa, K.; DeFries, R.S. Synergies and tradeoffs between cash crop production and food security: A case study in rural Ghana. Food Secur. 2014, 6, 541–554. [Google Scholar] [CrossRef]
- Vicol, M. Is contract farming an inclusive alternative to land grabbing? The case of potato contract farming in Maharashtra, India. Geoforum 2017, 85, 157–166. [Google Scholar] [CrossRef]
- Komarek, A. The determinants of banana market commercialisation in Western Uganda. Afr. J. Agric. Res. 2010, 5, 775–784. [Google Scholar]
- Von Braun, J. Agricultural commercialization: Impacts on income and nutrition and implications for policy. Food Policy 1995, 20, 187–202. [Google Scholar] [CrossRef]
- Shaw, D.J. World Food Summit, 1996. In World Food Security; Springer: Berlin, Germany, 2007; pp. 347–360. [Google Scholar]
- Food and Agriculture Organization. Rome Declaration on World Food Security and World Food Summit Plan of Action: World Food Summit 13–17 November 1996, Rome, Italy; FAO: Rome, Italy, 1996. [Google Scholar]
- Godfray, H.C.J.; Beddington, J.R.; Crute, I.R.; Haddad, L.; Lawrence, D.; Muir, J.F.; Pretty, J.; Robinson, S.; Thomas, S.M.; Toulmin, C. Food security: The challenge of feeding 9 billion people. Science 2010, 327, 812–818. [Google Scholar] [CrossRef]
- Food and Agriculture Organization; IFAD. Economic Growth is Necessary But Not Sufficient to Accelerate Reduction of Hunger and Malnutrition: The State of Food Insecurity in the World 2012; FAO: Rome, Italy, 2012; pp. 1–65. [Google Scholar]
- Von Braun, J.; Kennedy, E.T. Agricultural Commercialization, Economic Development, and Nutrition; International Food Policy Research Institute (IFPRI) by Johns Hopkins University Press: Baltimore, MD, USA, 1994. [Google Scholar]
- Wiggins, S.; Henley, G.; Keats, S. Competitive or Complementary? Industrial Crops and Food Security in Sub-Saharan Africa; Overseas Development Institute: London, UK, 2015; 41p. [Google Scholar]
- Maertens, M.; Verhofstadt, E. Horticultural exports, female wage employment and primary school enrolment: Theory and evidence from Senegal. Food Policy 2013, 43, 118–131. [Google Scholar] [CrossRef]
- Muriithi, B.W.; Matz, J.A. Welfare effects of vegetable commercialization: Evidence from smallholder producers in Kenya. Food Policy 2015, 50, 80–91. [Google Scholar] [CrossRef]
- Barrett, C.B.; Bachke, M.E.; Bellemare, M.F.; Michelson, H.C.; Narayanan, S.; Walker, T.F. Smallholder participation in contract farming: Comparative evidence from five countries. World Dev. 2012, 40, 715–730. [Google Scholar] [CrossRef]
- Emana, B.; Afari-Sefa, V.; Dinssa, F.F.; Ayana, A.; Balemi, T.; Temesgen, M. Characterization and assessment of vegetable production and marketing systems in the Humid Tropics of Ethiopia. Q. J. Int. Agric. 2015, 54, 163–187. [Google Scholar]
- Adish, A. Micronutrient Deficiencies in Ethiopia: Present Situation and Way Forward; LEI Wageningen UR: Wageningen, The Netherlands, 2014. [Google Scholar]
- Hunde, N.F. Opportunity, Problems and Production Status of Vegetables in Ethiopia: A Review. J Plant Sci. Res. 2017, 4, 172. [Google Scholar]
- Tobin, D.; Glenna, L.; Devaux, A. Pro-poor? Inclusion and exclusion in native potato value chains in the central highlands of Peru. J. Rural Stud. 2016, 46, 71–80. [Google Scholar] [CrossRef]
- Rabbi, F.; Ahamad, R.; Ali, S.; Chandio, A.A.; Ahmad, W.; Ilyas, A.; Din, I.U. Determinants of commercialization and its impact on the welfare of smallholder rice farmers by using Heckman’s two-stage approach. J. Saudi Soc. Agric. Sci. 2017, in press. [Google Scholar] [CrossRef]
- Technoserve’s, C.I. Case Study: The Return on Investment fromSmallholder Technoserve’s coffee initative; The initative for smallholder finance: New York, NY, USA, 2015. [Google Scholar]
- Nandi, R.; Gowdru, N.V.; Bokelmann, W. Factors Influencing Smallholder Farmers in Supplying Organic Fruits and Vegetables to Supermarket Supply Chains in Karnataka, India: A Transaction Cost Approach. Int. J. Rural Manag. 2017, 13, 85–107. [Google Scholar] [CrossRef]
- Likoko, E.; Kini, J. Inclusive business—A business approach to development. Curr. Opin. Environ. Sustain. 2017, 24, 84–88. [Google Scholar] [CrossRef]
- Vorley, B.; Lundy, M.; MacGregor, J. Business Models that are Inclusive of Small Farmers; Agro-Industries for Development, CABI for FAO and UNIDO: Wallingford, UK, 2009; pp. 186–222. [Google Scholar]
- Dercon, S.; Krishnan, P. In sickness and in health: Risk sharing within households in rural Ethiopia. J. Polit. Econ. 2000, 108, 688–727. [Google Scholar] [CrossRef]
- Hoang, L.A.; Castella, J.-C.; Novosad, P. Social networks and information access: Implications for agricultural extension in a rice farming community in northern Vietnam. Agric. Hum. Values 2006, 23, 513–527. [Google Scholar] [CrossRef]
- Gurven, M.; Jaeggi, A.V.; von Rueden, C.; Hooper, P.L.; Kaplan, H. Does market integration buffer risk, erode traditional sharing practices and increase inequality? A test among Bolivian forager-farmers. Hum. Ecol. 2015, 43, 515–530. [Google Scholar] [CrossRef]
- Haagsma, R.; Mouche, P.V. Egalitarian norms, economic development, and ethnic polarization. J. Comp. Econ. 2013, 41, 719–744. [Google Scholar] [CrossRef]
- Thuo, M.; Bell, A.A.; Bravo-Ureta, B.E.; Lachaud, M.A.; Okello, D.K.; Okoko, E.N.; Kidula, N.L.; Deom, C.M.; Puppala, N. Effects of social network factors on information acquisition and adoption of improved groundnut varieties: The case of Uganda and Kenya. Agric. Hum. Values 2014, 31, 339–353. [Google Scholar] [CrossRef]
- Chege, J.W.; Nyikal, R.A.; Mburu, J.; Muriithi, B.W. Impact of Export Horticulture Farming on per Capita Calorie Intake of Smallholder Farmers in Eastern and Central Provinces in Kenya. Int. J. Food Agric. Econ. 2015, 3, 65. [Google Scholar]
- Jha, S.; Bacon, C.M.; Philpott, S.M.; Ernesto Méndez, V.; Läderach, P.; Rice, R.A. Shade coffee: Update on a disappearing refuge for biodiversity. BioScience 2014, 64, 416–428. [Google Scholar] [CrossRef]
- Donovan, J.; Poole, N. Changing asset endowments and smallholder participation in higher value markets: Evidence from certified coffee producers in Nicaragua. Food Policy 2014, 44, 1–13. [Google Scholar] [CrossRef]
- Productive Safety Net Programme Phase IV Programme Implementation Manual. Available online: https://europa.eu/capacity4dev/resilience_ethiopia/document/productive-safety-net-programme-phase-iv-programme-implementation-manual-ministry-agricultu (accessed on 29 January 2019).
- Ethiopia at a Glance. Available online: http://www.fao.org/ethiopia/fao-in-ethiopia/ethiopia-at-a-glance/en/ (accessed on 17 January 2019).
- Rahmato, D. Land to Investors: Large-Scale Land Transfers in Ethiopia; African Books Collective: Oxford, UK, 2011. [Google Scholar]
- Wubneh, M. Policies and praxis of land acquisition, use, and development in Ethiopia. Land Use Policy 2018, 73, 170–183. [Google Scholar] [CrossRef]
- Rahmato, D. Land Tenure and Land Policy in Ethiopia after the Derg; Land Tenure Project, Institute of Development Research, Addis Ababa University: Addis Ababa, Ethiopia, 1994. [Google Scholar]
- Teklu, T. Rural land, emerging rental land markets and public policy in Ethiopia. Afr. Dev. Rev. 2004, 16, 169–202. [Google Scholar] [CrossRef]
- Hagos, F.; Makombe, G.; Namara, R.; Awulachew, S.B. Does Access to Small Scale Irrigation Promote Market Oriented Production in Ethiopia? IWMI: Colombo, Sri Lanka, 2008. [Google Scholar]
- Hagos, F.; Jayasinghe, G.; Awulachew, S.B.; Loulseged, M.; Yilma, A.D. Agricultural water management and poverty in Ethiopia. Agric. Econ. 2012, 43, 99–111. [Google Scholar] [CrossRef]
- Ethiopia. Irrigation Market Brief. Available online: http://www.fao.org/3/a-i5196e.pdf (accessed on 17 January 2019).
- Growth and Transformation Plan (GTP) 2010/2011–2014/2015. Available online: http://www.ethiopians.com/Ethiopia_GTP_2015.pdf (accessed on 17 January 2019).
- Shumuye, M.Y. The Role of the Developmental State in Northern Ethiopia’s Raya Valley Groundwater Irrigation Project: An Institutional Economics Perspective; Stellenbosch University: Stellenbosch, South Africa, 2017. [Google Scholar]
- 2018 Global Hunger Index. Forced Migration and Hunger. Available online: https://reliefweb.int/report/world/2018-global-hunger-index-forced-migration-and-hunger (accessed on 17 January 2019).
- Gebru, M.; Remans, R.; Brouwer, I.; Baye, K.; Melesse, M.; Covic, N.; Habtamu, F.; Abay, A.H.; Hailu, T.; Hirvonen, K. Food Systems for Healthier Diets in Ethiopia: Toward a Research Agenda; IFPRI: Washington, DC, USA, 2018. [Google Scholar]
- Van Ittersum, M.K.; Van Bussel, L.G.; Wolf, J.; Grassini, P.; Van Wart, J.; Guilpart, N.; Claessens, L.; de Groot, H.; Wiebe, K.; Mason-D’Croz, D. Can sub-Saharan Africa feed itself? Proc. Natl. Acad. Sci. USA 2016, 113, 14964–14969. [Google Scholar] [CrossRef]
- Luan, Y.; Cui, X.; Ferrat, M. Historical trends of food self-sufficiency in Africa. Food Secur. 2013, 5, 393–405. [Google Scholar] [CrossRef]
- Agriculture in Ethiopia—Major Crops and Cereals with Production, Trade, and Consumption Analysis, Trends and Forecasts (2017–2022). Available online: https://www.mordorintelligence.com/industry-reports/agriculture-in-ethiopia (accessed on 17 January 2019).
- Berhane, G.; Gebrehiwot, A.; Berhe, K.; Hoekstra, D. Commercialization of Vegetable Production in Alamata Woreda, Northern Ethiopia: Processes and Impact; ILRI: Nairobi, Kenya, 2010. [Google Scholar]
- Domenech, L. The Impact of Irrigation on Nutrition, Health, and Gender: A Review Paper with Insights for Africa South of the Sahara; International Food Policy Research Institute (IFPRI): Washington, DC, USA, 2013; Volume 1259. [Google Scholar]
- Mengistie, D.; Kidane, D. Assessment of the impact of small-scale irrigation on household livelihood improvement at Gubalafto District, North Wollo, Ethiopia. Agriculture 2016, 6, 27. [Google Scholar] [CrossRef]
- Taruvinga, A.; Muchenje, V.; Mushunje, A. Determinants of rural household dietary diversity: The case of Amatole and Nyandeni districts, South Africa. Int. J. Dev. Sustain. 2013, 2, 2233–2247. [Google Scholar]
- Meles, K.; Nigussie, G.; Belay, T.; Manjur, K. Seed system impact on farmers’ income and crop biodiversity in the drylands of southern Tigray. DCG Rep. 2009, 54, 1–76. [Google Scholar]
- Raya Azebo district office of Agriculture and Rural Development: Annual report. Raya Azebo, Mekoni: Tigray, Ethiopai, 2016.
- Braun, V.; Clarke, V. Using thematic analysis in psychology. Qual. Res. Psychol. 2006, 3, 77–101. [Google Scholar] [CrossRef]
- Limon, G.; Fournié, G.; Lewis, E.G.; Dominguez-Salas, P.; Leyton-Michovich, D.; Gonzales-Gustavson, E.A.; Gonzalez, A.E.; Cabezas, A.H.; Pinto, J.; Rushton, J. Using mixed methods to assess food security and coping strategies: A case study among smallholders in the Andean region. Food Secur. 2017, 9, 1019–1040. [Google Scholar] [CrossRef][Green Version]
- Creswell, J.W.; Plano Clark, V.L.; Gutmann, M.L.; Hanson, W.E. Advanced mixed methods research designs. Handb. Mixed Methods Soc. Behav. Res. 2003, 209, 240. [Google Scholar]
- Heckman, J. Shadow prices, market wages, and labor supply. Econom. J. Econom. Soc. 1974, 679–694. [Google Scholar] [CrossRef]
- Bilinsky, P.; Swindale, A. Months of Adequate Household Food Provisioning (MAHFP) for Measurement of Household Food Access: Indicator Guide; Food and Nutritional Technical Assistance Project, Academy for Educational Development: Durham, UK, 2007. [Google Scholar]
- Kennedy, G.; Ballard, T.; Dop, M.C. Guidelines for Measuring Household and Individual Dietary Diversity; Food and Agriculture Organization of the United Nations: Rome, Italy, 2011. [Google Scholar]
- World Health Organization Anthro 2005 Software and Macros; World Health Organization: Geneva, Switzerland, 2005.
- Econometric Analysis. Available online: https://spu.fem.uniag.sk/cvicenia/ksov/obtulovic/Mana%C5%BE.%20%C5%A1tatistika%20a%20ekonometria/EconometricsGREENE.pdf (accessed on 17 January 2019).
- Rhea, M.R. Determining the magnitude of treatment effects in strength training research through the use of the effect size. J. Strength Cond. Res. 2004, 18, 918–920. [Google Scholar]
- Cohen, J. Statistical Power Analysis for the Behavioral Sciences, 2nd ed.; Erlbaum Associates: Hillsdale, MI, USA, 1988. [Google Scholar]
- Storck, H.; Doppler, W. Farming Systems and Farm Management Practices of Smallholders in the Hararghe Highlands; Wissenschaftsverlag Vauk Kiel: Kiel, Germany, 1991. [Google Scholar]
- Ulimwengu, J.; Funes, J.; Headey, D.; You, L. Paving the way for development. In The Impact of Transport Infraestructure on Agricultural Production and Poverty Reduction in the Democratic Republic of Congo; International Food Policy Research Institute Discussion Paper; International Food Policy Research Institute: Washington, DC, USA, 2009; Volume 840. [Google Scholar]
- The Impact of Infrastructure on Agricultural Productivity. Available online: https://ideas.repec.org/p/phd/dpaper/dp_2012-12.html (accessed on 22 February 2018).
- Zhu, D.; Porter, A.L. Automated extraction and visualization of information for technological intelligence and forecasting. Technol. Forecast. Soc. Chang. 2002, 69, 495–506. [Google Scholar] [CrossRef]
- Dercon, S.; Hoddinott, J. Livelihoods, Growth, and Links to Market Towns in 15 Ethiopian Villages; IFPRI: Washington DC, USA, 2005. [Google Scholar]
- Kyaw, N.; Ahn, S.; Lee, S. Analysis of the Factors Influencing Market Participation among Smallholder Rice Farmers in Magway Region, Central Dry Zone of Myanmar. Sustainability 2018, 10, 4441. [Google Scholar] [CrossRef]
- Chuchird, R.; Sasaki, N.; Abe, I. Influencing Factors of the Adoption of Agricultural Irrigation Technologies and the Economic Returns: A Case Study in Chaiyaphum Province, Thailand. Sustainability 2017, 9, 1524. [Google Scholar] [CrossRef]
- Jouanjean, M.-A. Targeting Infrastructure Development to Foster Agricultural Trade and Market Integration in Developing Countries: An Analytical Review; Overseas Development Institute: London, UK, 2013; pp. 1–26. [Google Scholar]
- Ulimwengu, J.; Funes, J.; Headey, D.; You, L. Paving the way for development: The impact of road infrastructure on agricultural production and household wealth in the Democratic Republic of Congo. In Proceedings of the 2009 Annual Meeting, Milwaukee, WI, USA, 26–28 July 2009; pp. 26–28. [Google Scholar]
- Chanyalew, D.; Adenew, B.; Mellor, J. Ethiopia’s Agriculture Sector Policy and Investment Framework: Ten Year Road Map (2010–2020); Ministry of Agriculture and Rural Development: Addis Ababa, Ethiopia, 2010.
- Spielman, D.J.; Hartwich, F.; Grebmer, K. Public-private partnerships and developing-country agriculture: Evidence from the international agricultural research system. Public Adm. Dev. 2010, 30, 261–276. [Google Scholar] [CrossRef]
- Zoomers, A.; Westen, G.V. Introduction: Translocal development, development corridors and development chains. Int. Dev. Plan. Rev. 2011, 33, 377–388. [Google Scholar] [CrossRef]
- Bacon, C.M.; Sundstrom, W.A.; Gómez, M.E.F.; Méndez, V.E.; Santos, R.; Goldoftas, B.; Dougherty, I. Explaining the ‘hungry farmer paradox’: Smallholders and fair trade cooperatives navigate seasonality and change in Nicaragua’s corn and coffee markets. Glob. Environ. Chang. 2014, 25, 133–149. [Google Scholar] [CrossRef]
- Donovan, J.; Poole, N. Asset building in response to value chain development: Lessons from taro producers in Nicaragua. Int. J. Agric. Sustain. 2013, 11, 23–37. [Google Scholar] [CrossRef]
- Von Braun, J.; Kennedy, E. Commercialization of Subsistence Agriculture: Income and Nutritional Effects in Developing Countries; International Food Policy Research Institute: Washington, DC, USA, 1986. [Google Scholar]
- Vermeulen, S.; Cotula, L. Over the heads of local people: Consultation, consent, and recompense in large-scale land deals for biofuels projects in Africa. J. Peasant Stud. 2010, 37, 899–916. [Google Scholar] [CrossRef]
- Chamberlain, W.; Anseeuw, W. Inclusive Businesses in Agriculture: What, How and for Whom? Critical Insights Based on South African Cases; Sun Press: Stellembosh, South Africa, 2017. [Google Scholar]
© 2019 by the authors. Licensee MDPI, Basel, Switzerland. This article is an open access article distributed under the terms and conditions of the Creative Commons Attribution (CC BY) license (http://creativecommons.org/licenses/by/4.0/).