Article

How Environmental Beliefs Affect Consumer Willingness to Pay for the Greenness Premium of Low-Carbon Agricultural Products in China: Theoretical Model and Survey-based Evidence

1
School of Public Economics and Administration, Shanghai University of Finance and Economics, Shanghai 200433, China
2
China Institute for Urban Governance (CIUG) & School of International and Public Affairs (SIPA), Shanghai Jiao Tong University (SJTU), China
*
Author to whom correspondence should be addressed.
Sustainability 2019, 11(3), 592; https://doi.org/10.3390/su11030592
Submission received: 31 December 2018 / Revised: 16 January 2019 / Accepted: 18 January 2019 / Published: 23 January 2019

Abstract

:
The increase in the supply of low-carbon agricultural products is crucial to reduce carbon emissions, but the production of such products incurs additional input costs and thus the crux of the low-carbon agricultural products market development lies in how such cost can be shared in a reasonable manner. The increase of consumer willingness to pay and the premium level that consumers would pay for green products hold the key to address this challenge. For that reason, this paper first constructs a behavioral game model to explore how environmental beliefs would affect consumer willingness to pay for the greenness premium. Then, the paper proceeds with empirical analyses on factors influencing consumer willingness to pay for the greenness premium by using micro-survey data of Chinese consumers when facing the choices of low-carbon rice in the cities of central China. The empirical research suggests that, although the average greenness premium that Chinese consumers are willing to pay for low-carbon agricultural products is low, the greenness premium will be stronger when consumers have higher environmental beliefs. We also find the impacts of environmental beliefs on the willingness to pay as well as the greenness premium levels that consumers are willing to pay for low-carbon agricultural products increase with education attainment and family income, but do not change with age. Findings in this study carry several important policy implications. To encourage green consumption that facilitates green production, the government should devote attempts to promote consumers’ environmental beliefs and also apply differentiated public policy that targeting at different types of consumers.

1. Introduction

As the country with the largest population and the second-largest economy in the world, China has a crucial responsibility in combating the challenges of global climate change, and the Chinese government has been working proactively to shoulder its international obligations of energy saving and carbon emission reduction. For example, in November 2009, the Chinese government officially promised to lower the carbon emission per GDP unit in 2020 by 40%–45% compared with that in 2005, and fulfill the goal to achieve 60%–65% reduction by 2030. On the press conference of November 26, 2018, the Chinese state council announced that this goal had been achieved three years in advance of the original plan. Meanwhile, at the 19th national congress of the Chinese Communist Party in 2017, “green development” was formally established as one of the five major developmental ideologies that guides national development in the next decades. However, currently both the policy concerns and academic discussions of green development in China generally focus on the manufacturing industry, though few are related to traditional agriculture (Horrigan et al., 2002; Hopper, 1976) [1,2]. Nonetheless, according to the Fourth and Fifth IPCC Assessment Reports, the amount of greenhouse gases such as carbon dioxide emitted by agricultural production is only next to that by thermoelectric production and has consistently become the second largest emission source of all the global greenhouse gases (IPCC, 2007,2013) [3,4]. There is also research suggesting that greenhouse gas emission from agricultural production accounts for approximately 17% of the aggregate emission in China (Li, 2011) [5]. Therefore, the developing of low-carbon agriculture is a key to decide whether China could achieve the objective of carbon emission reduction.
Nonetheless, as in the cases of low-carbon manufacturing production, the production of low-carbon agricultural products also incurs additional costs due to the investment on carbon emission reduction. The survival of the low-carbon agricultural market is thus crucially dependent on whether and how much of such additional costs can transform into the price premium, the “greenness premium”, that consumers are willing to pay. Only a successful transformation of consumption pattern into “green consumption” can boost the growth of the low-carbon product market. It has become common for consumers to pay the greenness premium for low-carbon agricultural products in advanced economies. For example, over 79% of Americans, around 80% of Germans, and more than 67% of Dutch frequently purchased low-carbon agricultural products with a high price premium relative to ordinary ones (Li, 2011) [6]. However, as the low-carbon agricultural market in China is still immature, there is little information on whether and how much Chinese consumers are willing to pay for the greenness premium of low-carbon agricultural products [6].
The existing literature has put forward extensive attempts to understand consumer motivations underlying the purchase of environmentally friendly products and services as well as the price premium they are willing to pay for such goods and services (Caswell, 1998; Kimura et al., 2010) [7,8]. The relationship between psychological constructs (i.e., values, concerns, beliefs) and pro-environmental purchase has attracted growing attention in this strand of research (Newman & Fernandes, 2016; Ting and Cheng, 2017) [9,10]. In the literature, environmental beliefs have been either understood as value orientations that assist individuals in their adaptation to environmental changes (Gadenne, et al., 2011) [11], or peoples’ feelings of moral obligation to conduct environmental actions and perceptions about the extent to which their behavior affects the environment (Corraliza & Berenguer, 2000; Whitmarsh, 2009) [12,13]. Gadenne et al. (2011) constructed a conceptual framework of consumer environmental behavior, and their empirical work found there are strong but varying associations between environmental attitudes and environmental behaviors [11].
A number of empirical research has attempted to investigate consumer willingness to pay for the greenness premium and its influencing factors. For instance, according to a survey on China by Zhou and Wu (2012), consumers could accept at most a 26.33% price increase for low-carbon pork, if the emission reduction is applied in the process of agricultural product production [14]. Shuai et al. (2014) explored the heterogeneity in the willingness to pay for low-carbon products for different consumers in China and found education level and household income significantly influence consumer willingness to pay [15]. Given the significant information asymmetry between consumers and producers in the low-carbon product market, the carbon labelling scheme has been introduced to alleviate this problem. Many researchers have found carbon labelling impacts the decision-making of shoppers (e.g., Harris 2007; Howard 2006) [16,17]. Further, Vanclay et al. (2011) and Upham et al. (2011) found via a scenario-based experiment that consumers tend to purchase low-carbon agricultural products with carbon labelling, particularly those relatively cheap ones [18,19].
Nonetheless, so far, the impacts of environmental beliefs on consumer willingness to pay for the greenness premium has been largely ignored in the literature. According to Hobbs (2005), Tan et al. (2014), Zhao et al. (2015), and Tait et al. (2016), carbon labelling itself has no value except for the value of information regarding the guarantee for reducing carbon emissions that is contained in the labelling, but such value varies substantially with individual environmental beliefs [20,21,22,23]. Beattie et al. (2009) studied the relationship between consumers’ attitudes towards low-carbon products and their low-carbon consumption and found that positive consumer awareness about low-carbon products is positively correlated with their low-carbon consumption [24]. Additionally, the environmental protection related information that the low-carbon products contain contributes to the creation of value in the minds of consumers. Based on a national sample of 1225 mail surveys, O’connor et al. (1999) examined the relationship between risk perceptions and willingness to address climate change, and found that the recognition of the causes of global warming is a powerful predictor of behavioral intentions [25]. Note that the “environmental beliefs” in this paper refer to consumers’ senses, perception, and cognition regarding the environmental effect brought about by their behaviors including consumption behaviors (O’connor et al., 1999; Albarracín & Wyer, 2000) [25,26]. Belief is the foundation of consumer attitude towards their consumption products (Bodur et al., 2000; Bang et al., 2000) [27,28], and is highly conditional on the attributes, functions, and effectiveness of these products (Ajzen & Fishbein, 1980; Ajzen & Madden, 1986) [29,30].
Building upon previous research, this paper first constructs a behavioral game model of the consumption of low-carbon agricultural products based on a cognitive game to explore how “environmental beliefs” affect consumer willingness to pay for the greenness premium. Second, this paper empirically investigates the relationship between environmental beliefs and the consumer willingness to pay the greenness premium. The empirical work is based on the micro-survey data of 615 households when facing the choices of low-carbon agricultural products in the Changsha-Zhuzhou-Xiangtan city cluster that located in central China.
Our study extends the existing literature in several ways. First, through constructing a behavioral game model we are able to explore how environmental beliefs would affect consumer willingness to pay for the greenness premium systematically in a theoretical framework. Following the existing literature, we argue that environmental belief is an important factor in the choice of environmentally friendly goods in China too. The 19th CPC (Chinese Communist Party) National Congress on October 2017 pointed out that the state should encourage simple, moderate, green, and low-carbon ways of life, and promote “green consumption”. Hence, there is a strong need to explore the key factors influencing consumer willingness to pay and the greenness premium level theoretically from the perspective of environmental beliefs. Such research would be very helpful to put forth well-targeted measures for the advancement of “green consumption”. Second, this paper for the first time empirically studies the connections between environmental beliefs and consumer willingness to pay for the greenness premium of low-carbon agricultural products in China. The development of the low-carbon agricultural market is of crucial importance for carbon emission reduction in China, but there are few empirical studies on the consumer demand for low-carbon agricultural products. Third, we present evidence on the differentiated impacts of “environmental beliefs” on both the willingness to pay and the greenness premium level across different consumers. We find that high-educated and high-income consumers are generally associated with higher “environmental beliefs”, and these consumer groups tend to pay a higher greenness premium for low-carbon agricultural products. The findings above can help to distinguish consumers with different tendencies to consume green agricultural products and then would be of considerable use in improving the design of differentiated public policy to promote “green consumption”.
The rest of this paper is organized as follows. Section 2 contains the construction of a behavioral game model of agricultural product choice as well as the buildup of the econometrics model. Section 3 introduces data collection, discusses the design of the questionnaire, variable selection, and the statistical characteristics of samples. Section 4 presents the regression results and our discussions of these findings. Section 5 concludes the paper with our policy recommendations.

2. The Theoretic Model
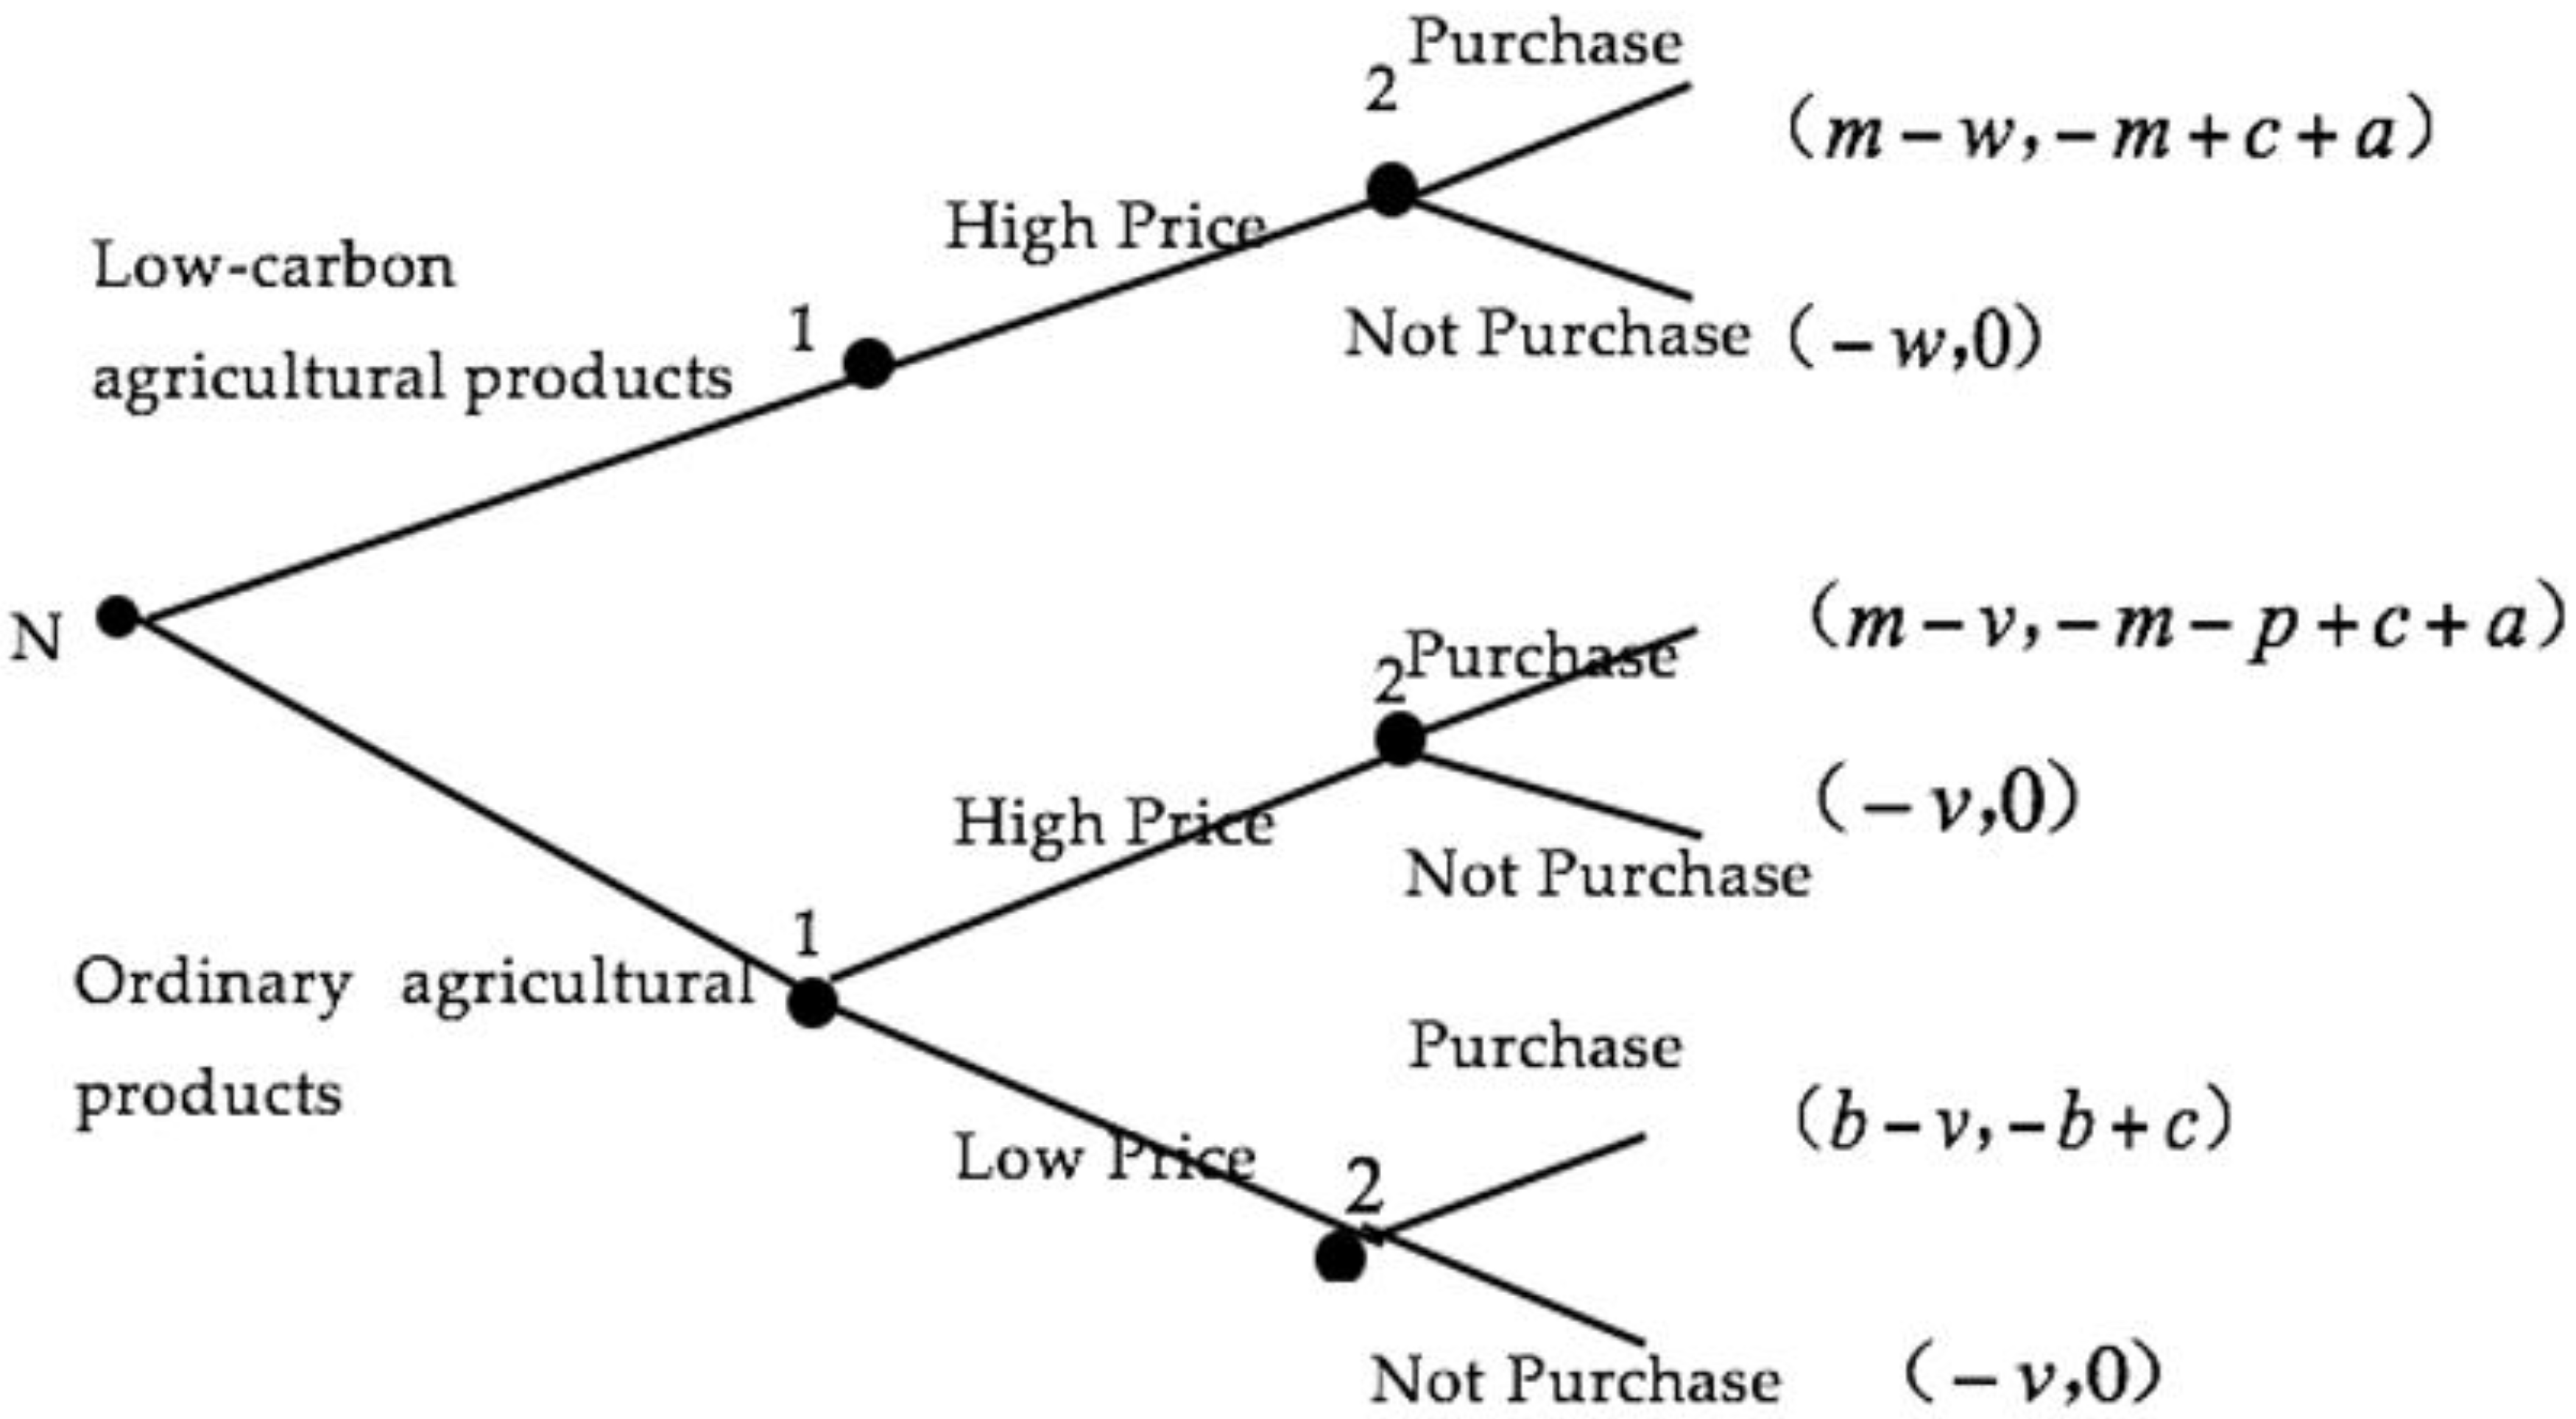
2.1. The Game Model

As the low-carbon agricultural products have the attributes of credence goods such that consumers can hardly distinguish them from the ordinary ones from the appearance (Emons, 1997) [31], high level of information asymmetry exists between producers and consumers. As Akerlof (1970) has suggested for the lemon market, generally producers have more information than consumers do in the agricultural product market [32]. The former knows the carbon emission of each product better than the latter, while the latter do not have access to the actual carbon emission in the production process. Consequently, the only way for consumers to avoid risks and losses caused by information asymmetry is to lower the reserve price that they are willing to pay. Thus, in the unified market where the low-carbon agricultural products and ordinary products coexist, the more costly low-carbon ones will gradually withdraw because they require more input but cannot be sold at higher prices. When that happens, only ordinary agricultural products with comparatively high carbon emissions remain, which will further depress consumer cognition of the low-carbon agricultural product market and then lead to the complete reduction of this market. It is thus straightforward to predict that, due to high information asymmetry in the agricultural product market, consumers would have low willingness to pay for the low-carbon agricultural products.
Nonetheless, previous literature has suggested that environmental beliefs may exert an influence over a households’ decision-making in the purchase of the low-carbon agricultural products (Kimura et al., 2010) [8,18,19]. Therefore, this paper introduces the impact of “environmental beliefs” in the analysis of consumers’ choice of agricultural product.

2.1.1. The Game Set Up

Suppose there are two types of agricultural products on the market: The low-carbon products and the ordinary products. For producers, selling the low-carbon agricultural products would involve comparatively higher costs that are marked as w; selling the ordinary products would involve a standard cost that is marked as v. Meanwhile, selling the low-carbon products and ordinary ones will generate revenue m and b, respectively, assuming m w ,   b v . For consumers, purchasing the low-carbon agricultural products will cost m but will in return receive certain health yields c and moral yields a. Moral yield is consumers’ personal perception of the “environmental effect” from the purchase of low-carbon agricultural products. It is reasonable to assume that the stronger the “environmental beliefs” the higher the moral yields. That is to say, the moral yields parameter a exemplifies the intensity of an individual consumer’s “environmental beliefs”. On the other hand, purchasing the ordinary products will cost b and receive nutrition yields c but no moral yields. Implicitly, we assume that the taste and quality of the low-carbon agricultural products and the ordinary ones are the same, only the amount of carbon emissions during their production process is different. Emissions of the former are substantially lower than the latter. However, if consumers purchase counterfeit products (meaning the ordinary agricultural products that imitate the low-carbon ones), consumers will suffer from additional losses p.
To simplify the analysis, we further assume consumers cannot distinguish between the low-carbon agricultural products and the ordinary ones from the appearance, or it would entail high cost for consumers to identify “genuine” low-carbon products from the ordinary ones.

2.1.2. The Game Structure

(1) Game tree. The game tree is structured as shown in Figure 1. This paper adopts the Harsanyi Transformation to convert the incomplete information game into an imperfect information game. The N in Figure 1 represents “Nature”, and the player 1 and 2 represent the producer and the consumer, respectively. The producer can sell either at high price or at low price when selling the ordinary agricultural products. However, as the low-carbon products are associated with high production cost, the producer would always sell them at high price. Correspondingly, when the consumer finds that the producer is selling agricultural products, he has two options: Purchase or not purchase.
(2) Strategy set. The model involves two players, the producer and the consumer. The strategy set of the producer is:
S-seller = {selling dishonestly, selling honestly}
To be exact, the first is: The producer chooses to sell the ordinary products as low-carbon products at high price. The second is: The producer will sell the products at the price that corresponding to their carbon-emission quality, i.e., at high price only when the products are low-carbon ones and at low price otherwise.
The strategy set of the consumer is:
S-consumer = {purchase, not purchase}
(3) Game matrix. Suppose α represents the probability of being low-carbon agricultural products for agricultural products sold on the market, and (1-α) the probability of being ordinary products. Implicitly, we assume all involved parties have the same judgement on the probability distribution of products. β refers to the probability of selling the products at high price while (1-β) the probability at low price. In summary, a game matrix is constructed as shown in Figure 2.

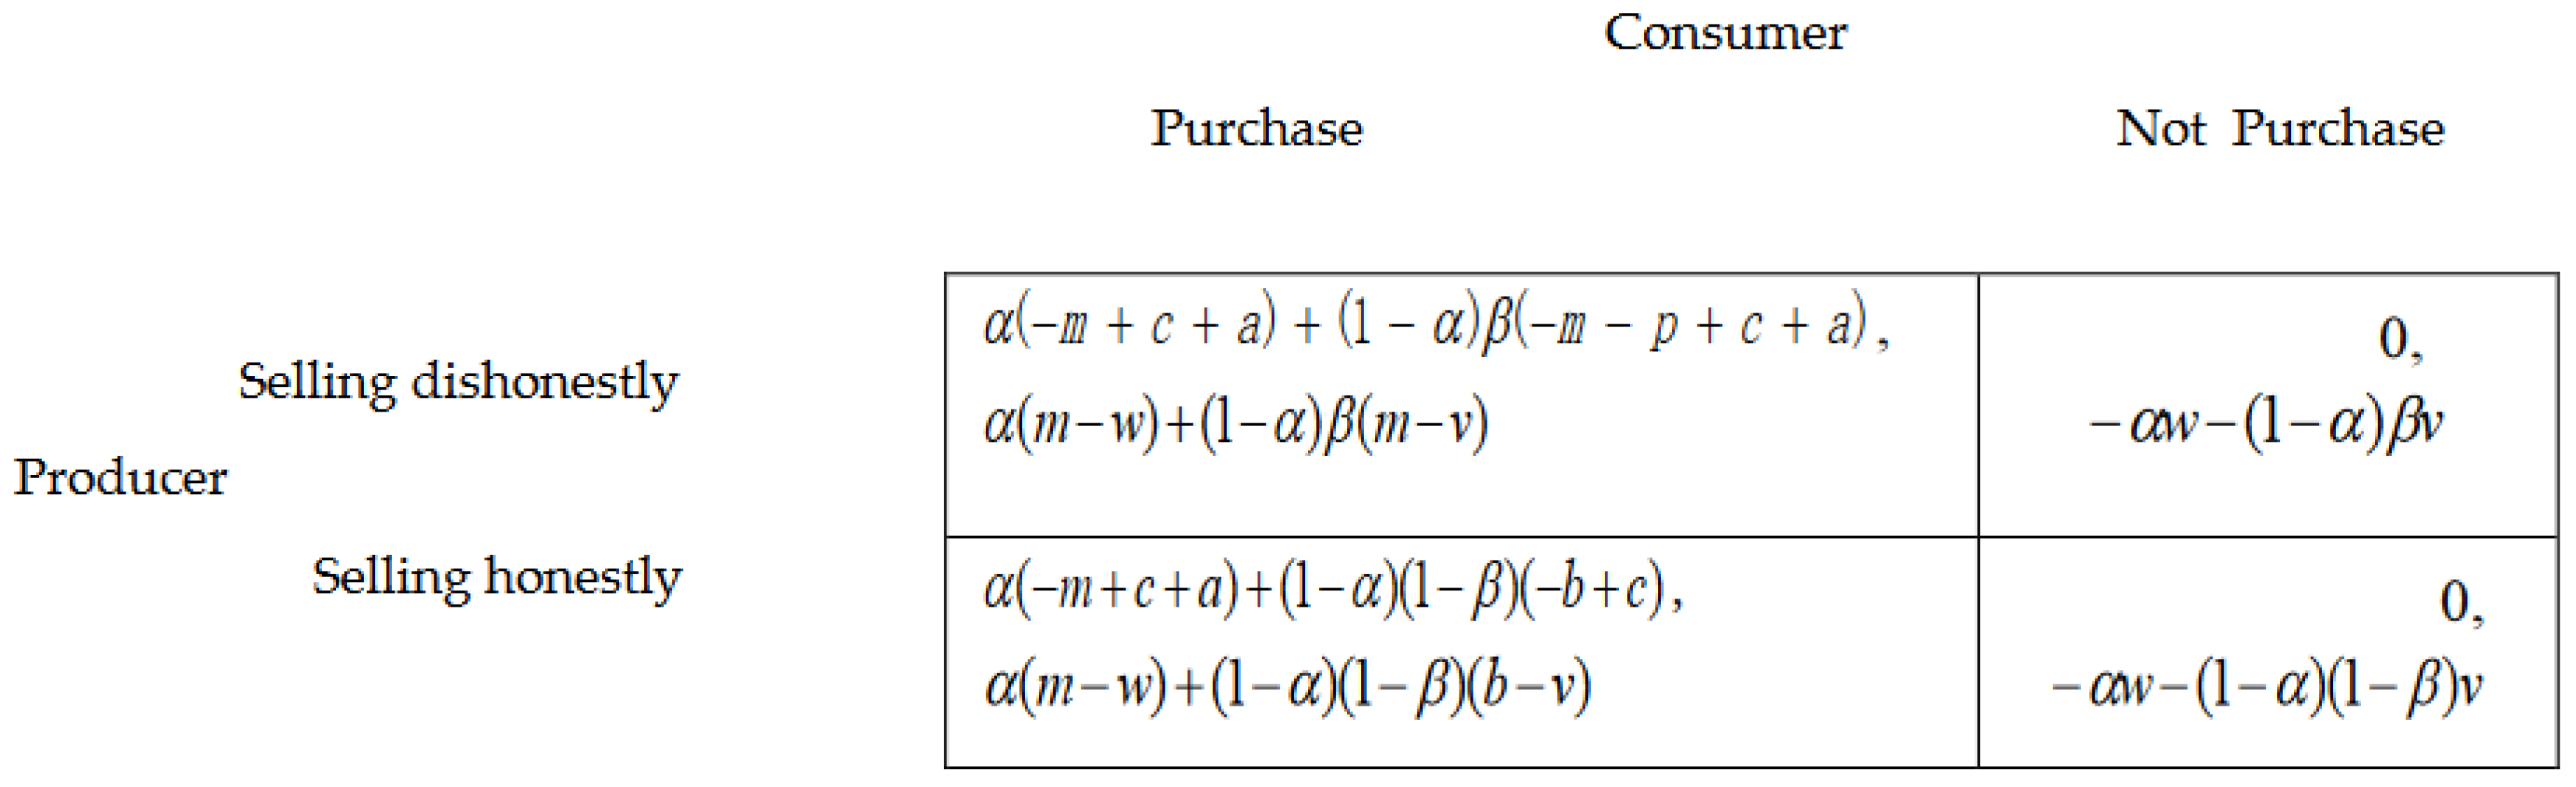
2.1.3. The Equilibrium Condition

According to the equilibrium condition:
{ α ( m + c + a ) + ( 1 α ) β ( m p + c + a ) = 0 α ( m + c + a ) + ( 1 α ) ( 1 β ) ( b + c ) = 0 α ( m w ) + ( 1 α ) β ( m v ) = α ( m w ) + ( 1 α ) ( 1 β ) ( b v ) α w ( 1 α ) β v = α w ( 1 α ) ( 1 β ) v ,
After applying numerical reasoning to pick out dominating strategy, we can determine that (deduction details can be found in the Appendix A):
When α ( p + m c a ) ( b c ) p ( b c ) + ( p + m c a ) ( m + c + a ) ,   β ( m c a ) ( c b ) p ( b c ) + ( p + m c a ) ( m + 2 c + a b ) , the consumer’s dominant strategy is to purchase;
While whatever the parameter α takes, as long as β 0.5 ,   or   β b v m + b 2 v , the producer’s dominant strategy is to sell honestly.
The analysis above suggests that, the high information asymmetry on the agricultural product market significantly depresses the consumers’ probability of choosing the low-carbon agricultural products as well as the greenness premium level that consumers are willing to pay conditional on purchase. The analysis also implies that, consumers’ environmental beliefs will have a striking impact on his or her decision-making regarding purchases of the low-carbon agricultural products.
First, the larger the “environmental beliefs” parameter a is, the higher the probability that the consumer’s dominant strategy is choosing to buy low-carbon products. This implies that, the stronger the “environmental beliefs” that one consumer has, the more likely the consumers will be willing to purchase low-carbon products and pay the greenness premium. Second, the higher the probability parameter β of the producers choosing to sell the products at high price whatever the product is, the lower the probability of the consumers choosing to buy the low-carbon products. Alternatively, the higher the low-carbon products are priced, the less willing the consumers will be to buy them. That is because the consumers wish to avoid more losses of being cheated in an expensive green market.
Meanwhile, the existing research has shown that different types of consumers may manifest substantial differences in the consumption pattern of green products (Vanclay et al., 2011; Gadema & Oglethorpe, 2011) [18,33]. Based on the above analysis as well as findings of the existing literature, we propose the hypothesis below:
H1. 
Resulting from high information asymmetry in the low-carbon agricultural product market, consumers willing to choose and the greenness premium level for low-carbon products are both low.
H2. 
The enhancement of the “environmental beliefs” can serve to mitigate the negatives of information asymmetry, and thus increase consumers’ willingness to choose as well as the greenness premium level that they are willing to pay. Specifically, the stronger the “environmental beliefs”, the more the consumers will be willing to purchase low-carbon agricultural products and the higher the greenness premium level that they would pay.
H3. 
“Environmental beliefs” have different influences over the consumer willingness to pay and the greenness premium level. Particularly, different consumers would be associated with different impacts of “environmental beliefs” on consumers’ willingness to choose and the greenness premium level that they are willing to pay.

2.2. The Econometrics Model

To verify the abovementioned hypothesis empirically, this paper first constructed a multivariable model to demonstrate what determinates the utility of purchasing agricultural products (low-carbon or ordinary products). The model is as follows:
U = α + β X + γ Y + δ Z + ε
In this model, U stands for the utility of purchasing agricultural products; X represents the socioeconomic characteristics s of consumers, primarily including gender, age, education, and monthly family income; Y shows the “environmental beliefs” of consumers; Z manifests the cognitive variables of carbon labelling; ε is the random error term. Below, 1 and 0 are deployed to represent the purchase of low-carbon agricultural products and the ordinary products respectively.
Hence, the utility of purchasing low-carbon agricultural products is:
U 1 = α 1 + β 1 X 1 + γ 1 Y 1 + δ 1 Z 1 + ε 1
While the utility of purchasing ordinary products is:
U 0 = α 0 + β 0 X 0 + γ 0 Y 0 + δ 0 Z 0 + ε 0
Therefore, the difference of utility is:
U = ( α 1 α 0 ) + ( β 1 X 1 β 0 X 0 ) + ( γ 1 Y 1 γ 0 Y 0 ) + ( δ 1 Z 1 δ 0 Z 0 ) + ( ε 1 ε 0 )
Suppose α = α 1 α 0 , β X = β 1 X 1 β 0 X 0 , γ Y = γ 1 Y 1 γ 0 Y 0 , δ Z = δ 1 Z 1 δ 0 Z 0 ,   a n d   ( ε 1 ε 0 ) , the difference of utility can be shown as:
U = α + β X + γ Y + δ Z + ε
As the result of rational utility maximum, the ratio of consumer willingness to pay for the premium of low-carbon agricultural products is:
P r o b ( Y = 1 ) = P r o b ( U > 0 ) = P r o b ( ε > ( α + β X + γ Y + δ Z ) )
Since the explained variable, “whether the consumer is willing to pay for the premium or not”, is a dichotomous variable, we run the logistics model where the residual follows logistic distribution. Thus:
P r o b ( Y = 1 ) = 1 1 1 + e α + β X + γ Y + δ Z = e α + β X + γ Y + δ Z 1 + e α + β X + γ Y + δ Z
In the logistic formula:
L o g i t ( p 1 ) = ln ( p 1 1 p 1 ) = α + β X + γ Y + δ Z
In Formula (8), l n ( p 1 / 1 p 1 ) is the natural logarithm of the occurrence of consumer willing to pay; p 1 refers to the probability of consumers willing to pay; α is a constant term, while β ,   γ ,   and   δ are the regression coefficients.
According to Ashby et al. (1989) [34], the greenness premium levels that consumers are willing to pay can be divided into different ranks. For that reason, this paper further constructed the ordered logistic regression model to explore the determinants of different premium levels that the consumer is willing to pay. The ordered logistic regression model is as follows:
L o g i t ( p i ) = ln [ p ( Y i ) ( 1 p ( Y i ) ) ] = α i ( β X + γ Y + δ Z )
In Formula (9), l n p i , i = 1 , 2 , 3 , 4 , 5 , indicating the probability of consumer willingness to pay at different premium levels; the meanings of the parameters and explanatory variables are same with what is stated in the aforementioned logistic model.

3. Data Source and Sample Analysis

To investigate the key factors that determine Chinese consumers’ willingness to choose as well as the greenness premium they are willing to pay conditional on purchasing low-carbon agricultural products, a survey of consumption of low-carbon rice was conducted between March and July of 2016 in the Changsha-Zhuzhou-Xiangtan city clusters, located in the central part of China. With proportional random sampling deployed, 660 questionnaires were filled, resulting in 615 valid samples and the validity rate being 93.18%. Targeting major buyers of rice in households, the survey was mainly implemented in supermarkets, communities, and farmers markets. Within the proportional random sampling framework, the number of questionnaires distributed in the aforementioned three locations were 270, 210, and 180, respectively.
The questionnaire was designed on the basis of analyzing and comparing the questionnaires previously used in domestic and foreign studies, combined with inputs from the in-depth interviews with local consumers. In the survey, we took the proportional random sampling method to control the sampling error. The sampling framework was designed with assistance from survey experts. To control the systematic errors, we carefully designed the questionnaire to fit the purpose and content of our investigation. We also conducted two pilot investigations before implementing the formal survey and modified the questionnaire based on the feedback of pilot surveys and experts’ suggestions. Meanwhile, we implemented the survey with assistance from professional survey agents. Finally, we tested the reliability and validity of the data collected from the survey and compared them with data from other sources, and the results showed that tour data has good quality in terms of both reliability and validity.

3.1. The Reliablity and Validity of Questionnaire

The questionnaire is composed of four sets of information about consumer respondents: socioeconomic characteristics, environmental beliefs, cognitions towards carbon labelling, and willingness to choose the low-carbon rice as well as the premium level that consumers are willing to pay, conditional on purchase. As the “environmental beliefs” and cognition of carbon labelling involve multiple indexes, this paper chose to employ the Cronbach’s alpha coefficients to test the internal consistency of the questionnaire data. The bigger the coefficient of Cronbach’s alpha, the better the relevance between the questions, the stronger the internal consistency, and the higher the reliability of the questionnaire. The test results show that the Cronbach’s alpha coefficient of the questionnaire is 0.76, thus indicating that the reliability of the “environmental beliefs” and cognition of carbon labelling variables conform to the statistical requirements.
This paper also utilized factor analysis to carry out a test on the validity of the variables of multiple indexes. As the results in Table 1 show, the values of KMO (Kaiser-Meyer-Olkin) tests are all greater than 0.70, the Bartlett’s tests are all associated with significance levels well below 0.01, the factor loading values are all greater than 0.50, and the cumulative variance contribution rates are all above 50%. These results indicate that the validity of the “environmental beliefs” and cognition of carbon labelling variables are in line with statistical requirements. To summarize, the test results indicate the reliability and validity of the questionnaire design are in line with research requirements.

3.2. Sample Characteristics

From the statistics in Table 2, the surveyed samples are found to have the following characteristics: two thirds of rice-purchasers are females, 67.80% of the respondents are aged between 20 and 39, 66.35% of them were educated for more than nine years, and 62% of the interviewed households have a monthly income between 3,000 and 7,000 Chinese yuan (CNY) (Note: The average exchange rate of CNY versus USD was 6.56:1 in 2016.). These features of samples are in accordance with the major characteristics of the rice consumers in China in terms of the ratio of genders, age, education and income, thus suggesting the sample data is representative.
The information from Table 3 shows that Chinese consumers have a considerable level of “environmental beliefs” or would have quite high moral yields from consuming green products. They recognize the significance of mitigating carbon emissions, but their cognitive ability to distinguish green products is generally not very strong. With regards to the question “consumer cognition towards global climate change”, 549 out of the 615 respondents (89.27% of the total) agreed that it has at least a small impact on daily life, and among them, 63.89% agree that global climate change has at least a moderate impact. As for the question “consumer cognition of the distinction between low-carbon agricultural products and the ordinary ones”, 98.86% of the respondents answered that ordinary rice is more polluting. When it comes to the question “consumer cognition of the environmental effect of low-carbon agricultural products”, 90.73% of the respondents said purchasing low-carbon ones is conducive to ease climate change, and only 9.27% had opposite views.
Carbon labelling has been widely adopted to promote the low-carbon emission production [16,17]. By labelling the amount of GHG emissions during the life cycle of the green commodities in a quantitative manner, consumers can be informed about how much they can contribute to the carbon emission reduction if purchasing the green products [21,22]. According to our survey, Chinese consumers’ cognition and trust of carbon labelling is still generally low. Only 7.80% of the respondents said they had a “very good understanding” of carbon labelling, 35.61% said they had a “moderate understanding”, while 32.36% and 24.23% of respondents thought they had “fewer understanding” and “no understanding” of carbon labelling, respectively. Additionally, only 44.07% expressed their trust in carbon labelling. See Table 4 below.
Methods that utilize consumer willingness to pay for the value of environmental resources include, Contingent Valuation Method (CVM), cost of illness approach, auction on the pilot market, conjoint analysis, market approach, responsibility cost method, and trade analysis (Caswell, 1998) [7]. Among them, the application of CVM in the assessment of environmental values is generally acknowledged as the most mature and appropriate research method [35]. This paper adopts the CVM double-bounded dichotomous choice method to inquire if consumers are willing to purchase low-carbon rice when the price is fixed. In the survey, the interviewers first made it clear to the consumers that the taste and quality of low-carbon and ordinary rice are the same and only the carbon emissions released during production is different, with the carbon emissions of the former greatly lower than those of the latter. The consumers were also informed that carbon emissions could cause global climate change. Furthermore, relevant data and cases were displayed to illustrate the health hazards that global climate change would bring about, giving the consumers a clearer idea of the scenario. Later, the consumers were asked if they would be willing to purchase low-carbon rice when the initial price P0 was 2 CNY per half kilogram, the same as the average price of the ordinary rice. If the consumers said “yes”, then they were asked if they would still be willing to purchase at prices higher with a certain range than that of the ordinary price such as 2.2, 2.4, 2.8, 3.6, and 4 CNY. Should the consumers say “no”, then the survey would end.
In accordance with the result in Table 3, 567 out of the 615 respondents said they would be willing to pay a higher price for the low-carbon rice than the ordinary ones, representing 92.20% of the total. Nonetheless, up to 85.89% of them were only willing to pay for less than 40% of the greenness premium and the population-weighted average level of greenness premium is 28.06% (i.e., 1.12 CNY per kilogram), far from covering the 75% additional costs of producing low-carbon rice. Note that the production of the low-carbon rice will incur 75% additional cost (3 CNY per kilogram) due to the investment on carbon emission reduction. Meanwhile, even when the prices of the low-carbon agricultural products and the ordinary ones are the same, 48 respondents or 7.80% of the total samples still chose to purchase the ordinary products (cf. Table 5). The reasons that the Chinese consumers were unwilling to pay for the premium of the low-carbon agricultural products may include: (1) insufficient cognition towards agricultural carbon emissions and the significance of green agriculture; (2) consumers thought environmental protection is the government’s responsibility and all the additional costs shall be covered by the state; (3) affected by consumption habits, the consumers felt reluctant to try new things; (4) they were not sure if the low-carbon agricultural products were safe or not and therefore did no dare to purchase. These observations provide intuitive justifications for hypothesis 1.

3.3. Variable Selection and Statistics Description

This paper conducted an empirical analysis by employing both the logistic model (the explained variable is whether consumers are willing to pay for the premium of the low-carbon rice) and the ordered logistic regression model (the explained variable is the premium levels of consumers willing to pay for the low-carbon rice). The explanatory variables of both models include consumers’ demographic and socioeconomic characteristics, their “environmental beliefs”, and their cognitions of carbon labelling. See Table 6 for the specific meaning, range, and descriptive statistics of these variables.

4. Empirical Results and Discussions

We carried out logistic and ordered logistic regression models in the empirical analysis. As the economic meaning of the regression coefficient of discrete choice models is difficult to interpret, we chose to provide and discuss the coefficient estimations of the marginal effects of the unit changes of the explanatory variables over the consumer willingness to pay or the premium levels that the consumers are willing to pay for the low-carbon rice. Therefore, this paper also reports the marginal effects of the influencing factors for model 1.

4.1. Benchmark Analysis

The benchmark estimation results of model 1 and model 2 are shown in Table 7 and Table 8, respectively. The overall performance of both models is good, with the goodness of fit for both being over 60% and the p value of significance test is well less than 0.01 for both. Moreover, the p value of the parallel line hypothesis test of model 2 is 0.065, meaning wherever the break point of the response variable is, the regression coefficient of the independent variables in the model 2 would remain consistent. This supports the application of the ordered logistic regression model.
Estimation results of model 1 and 2 show that the influencing factors of consumer willingness to pay for the low-carbon rice and those of the greenness premium levels are highly interrelated but somewhat different. The direct impacts of age, education, income are largely as intuitively expected and not the focus of this paper; we will thus skip further discussions of these variables.
We find there are positive relationships between consumer’s willingness to pay for the greenness premium and the consumer’s “environmental beliefs”. The marginal effect result shows that, holding else equal, every one level of increase in the “consumer cognition toward global climate change” will be associated with on average 7.7% higher probability of willingness to pay for the greenness premium. Further, for every one unit of increase in “consumer cognition towards the distinction between the low-carbon agricultural products and the ordinary ones” and “consumer cognition toward the environmental effect of the low-carbon agricultural products”, the probability of consumer willingness to pay will rise by 12.4% and 8.3%, respectively. These findings suggest that, the stronger the consumer’s “environmental beliefs”, the more incentive in the pursuit for environmental quality, the higher the attention to the carbon contained in the agricultural products, and the more likely the consumers will be willing to pay for the greenness premium.
Moreover, consumers’ cognition toward carbon labelling is positively associated with consumer willingness to pay for the low-carbon agricultural products. For every one unit of increase in “consumer understanding of carbon labelling”, the probability of consumer willingness to pay will go up by 12.8% on average. Besides, the marginal effect coefficient of the “environmental beliefs” and the cognition toward carbon labelling is considerably higher than that of the other explanatory variables. That is to say, the “environmental beliefs” and the cognition toward carbon labelling are the significant factors influencing consumer willingness to pay.
The impacts of consumer’s “environmental beliefs’ and cognition toward carbon labelling on the greenness premium levels of the low-carbon agricultural price are generally consistent with those of the consumer willingness to pay. Generally, the stronger the “environmental beliefs”, the more the consumers will be willing to contribute their own parts to emission reduction and the higher the premium level will be. For example, the probability of the greenness premium levels of consumers recognizing the distinction between low-carbon agricultural products and the ordinary ones increasing by one unit is 12.64 times that of those who do not have any recognition ability in this regard. The findings above provide support to hypothesis 2.
Additionally, the more the consumers understand and trust carbon labelling, the more they will be assured the environmental value of low-carbon rice and the higher the greenness premium levels the consumers are willing to pay. The probability of the greenness premium levels of consumers understanding carbon labelling well increasing by one unit is 4.76 times that of those who do not have any understanding in this regard.

4.2. The Heterogeneity Analysis

To investigate the different impacts of “environmental beliefs” from different consumer groups on the willingness to pay and the greenness premium levels, this paper split subsamples from the perspective of age, education, and family monthly income. The estimation results from the willingness model that was carried on different consumer groups are reported in Table 9.
First, we find that the correlations of “environmental beliefs” and willingness to pay for low-carbon agricultural products increases with education attainment. Among low-educated consumers (with degrees below junior college), there are no significant correlations between the environmental belief variables “consumer cognition towards global climate change”, “consumer cognition towards the environmental effect of the low-carbon agricultural products”, and their willingness to pay. On the contrary, among high-educated consumers (with degrees of junior college and above), there are significant correlations between their environmental belief variables and their willingness to pay. Second, we also find the correlations of “environmental beliefs” and willingness to pay for low-carbon agricultural products increases with family income. The correlations between “environmental beliefs” and willingness to pay for low-carbon agricultural products are generally insignificant among low-income consumers (those with family monthly income less than 5000 CNY), but very strong among high-income consumers (those with family monthly income no less than 5000 CNY). In addition, we observe that the correlations of “environmental beliefs” and willingness to pay for low-carbon agricultural products do not change much across different age groups.
The estimation results of the premium level model carried out on different consumer groups are shown in Table 10. Again, we find that the correlations of “environmental beliefs” and the greenness premium levels that consumers are willing to pay for low-carbon agricultural products increase with the education attainments. Among low-educated consumers (with degrees below junior college), there are no significant correlations between the environmental belief variables “consumer cognition towards global climate change”, “consumer cognition towards the environmental effect of the low-carbon agricultural products”, and the premium levels they are willing to pay for low-carbon agricultural products. On the contrary, among high-educated consumers (with degrees of junior college and above), there is a significant correlation between their environmental belief variables and their premium levels they are willing to pay. Further, we again find the correlations of “environmental beliefs” and the premium levels they are willing to pay for low-carbon agricultural products increase with family income. The correlations between “environmental beliefs” and the premium levels they are willing to pay for agricultural product are generally insignificant among low-income consumers (those with family monthly income less than 5000 CNY), but very strong among high-income consumers (those with family monthly income no less than 5000 CNY). Finally, it is again shown that the correlations of “environmental beliefs” and the premium levels that consumers are willing to pay for low-carbon agricultural products do not change much across different age groups.
In sum, we find that education attainment and family income play significantly positive roles in augmenting the impacts of environmental beliefs on the willingness to pay as well as the premium levels that consumers are willing to pay for low-carbon agricultural products. This suggests that the correlations between environmental beliefs and the willingness to pay as well as the premium levels that willing to pay for low-carbon agricultural products would vary significantly across consumers with different socioeconomic characteristics. Thus, we provide empirical support to hypothesis H3.

5. Conclusions and Policy Implications

The development of the low-carbon agriculture industry can effectively reduce the emissions of agricultural greenhouse gases, which is of particular significance for China to realize its goals of emission reduction in 2020 and 2030. However, green production requires consumers switching to green consumption and willing to pay a greenness premium for green products so that the additional input costs of producing green products could be covered and recycled. Therefore, it would be of great value to investigate the influence of “environmental beliefs” on consumer willingness to pay and the greenness premium. Such a study will help in designing the implementation of the relevant policies. To that end, this paper first constructed a behavioral game model to explore how environmental belief affects consumer willingness to pay for the greenness premium. Then, the paper proceeded with empirical analyses on factors influencing consumer willingness to pay for the greenness premium by using micro-survey data of Chinese consumers when facing the choices of low-carbon agricultural products in cities of central China.
The theoretic analysis shows: First, resulting from the high information asymmetry in the green product market, consumer willingness to pay for the price premium of green products is generally low. Second, the augmentation of consumers’ “environmental beliefs” can improve the consumer willingness to pay for the greenness premium Third, the impacts of environmental belief on the greenness premium that consumers are willing to pay would vary significantly across different groups of consumers.
Our empirical works confirm the predictions of our theoretic model. Based on analyzing the behavior responses when facing choices of low-carbon rice from 615 respondents in central China, we find consumers’ “environmental beliefs” have a positive impact on consumer willingness to pay for the greenness premium as well as the premium levels that consumers are willing for the low-carbon agricultural products. To be exact, holding else equal, every one unit of increase in the “consumer cognition toward global climate change”, “consumer cognition towards the distinction between the low-carbon agricultural products and the ordinary ones” and “consumer cognition toward the environmental effect of the low-carbon agricultural products” will be associated with an increase in the probability of the willingness to pay for the greenness premium by 7.7%, 12.4%, and 8.3%, respectively. We also find the impacts of environmental belief on the willingness to pay as well as the greenness premium levels that consumers are willing to pay for low-carbon agricultural products would increase with education attainment and family income, but do not change with age.
Our research findings have direct policy implications on how the government and the industry of green products can work together to encourage “green consumption”. To be concrete, three strategies deserve considering: (1) The state should encourage public media and public schools to educate more knowledge of the “green value” and then improve the public’s cognition as well as beliefs with respects to environmental protection. For example, the public agencies can actively use the Internet and other modern information platform to step up free education programs of environment protection including the environmental values of green products; (2) the firm should formulate differentiated strategies to encourage “green consumption” when targeting different consumer groups. For example, high-educated or high-income consumers who already have high environmental beliefs and cognition toward the low-carbon products should be the primary targeting group of green products. On the other hand, the firms of green products should set a relatively lower price when they enter a market segment dominated with the consumers associated with lower environmental beliefs or lower cognition of carbon labelling; (3) the government should provide well-designed policy to stimulate both production and consumption of green products. In addition to policies such as preferential loans, tax incentives, and fiscal subsidies should be utilized to lower the production cost of the green products, the government should also try hard to alleviate the information and then guarantee the consumer ability to pay and improving their willingness to pay as well as the premium level.
Due to the constraints of our research design, particularly the sampling techniques, there are still several deficiencies in the current research: (1) Limitations in the survey areas. This paper only investigated a limited number of consumers in the Changsha-Zhuzhou-Xiangtan city cluster due to the high survey costs, but it would be of great interest to expand this study to the wider context of the whole country with a larger sample size. (2) Insufficiency in measuring heterogeneity. Due to the limitations of data, we have only examined the heterogeneity of consumer’s age, education attainment, and income class. It would be of great value to explore how the heterogeneity vary with other demographic characteristics of consumers. (3) The problem of internal validity of the relationship between key variables. For example, there may be desirable to apply structural model to address the potential endogeneity between willingness-to-pay and environmental beliefs in the follow-up research. In short, this paper is just a beginning and the research can have further expansions in several directions, including those abovementioned.

Author Contributions

J.C. and S.Z. drafted the manuscript. J.C. and S.Z. contributed to the construction of the model and polished the language. J.C. designed the framework and research methodology. S.Z. assisted in data collection and data analysis. All authors read and approved the final version of the manuscript.

Funding

This research is supported by the NSFC-ESRC Joint Funding (NSF71661137004), the National Natural Science Foundation of China (NSF71573166) and the Fundamental Research Funds for the Central Universities (CXJJ-2018-361).

Acknowledgments

We would like to thank the editor of the journal and the two anonymous referees for their very professional comments and helpful suggestions that greatly improve the quality of our paper.

Conflicts of Interest

The authors declare no conflict of interest.

Appendix A: The Deduction of Dominating Strategy

We use a simple numerical way to identify the strategic dominance and Nash equilibria in a 2*2 pay-off matrix. The rule goes as follows: A player is always choosing the “best” strategy among a multitude of options by comparing his or her strategies to see which one is producing better payoffs.
We apply this rule to the game matrix presented in Table 1. For the agricultural product consumer,
(1).
if α ( m + c + a ) + ( 1 α ) β ( m p + c + a ) and α ( m + c + a ) + ( 1 α ) ( 1 β ) ( b + c ) are always equal to 0, choosing “Purchase” always gives the same outcome as choosing “Not Purchase” no matter what the producers do. (Strategy “Purchase” is equivalent to “Not Purchase”);
(2).
if α ( m + c + a ) + ( 1 α ) β ( m p + c + a ) and α ( m + c + a ) + ( 1 α ) ( 1 β ) ( b + c ) are always greater than 0, choosing “Purchase” always gives a better outcome than choosing “Not Purchase” no matter what the producers do. (Strategy “Purchase” strictly dominates “Not Purchase”)
(3).
if α ( m + c + a ) + ( 1 α ) β ( m p + c + a ) and α ( m + c + a ) + ( 1 α ) ( 1 β ) ( b + c ) are always less than 0, choosing “Purchase” always gives a worse outcome than choosing “Not Purchase” no matter what the other player(s) do. (Strategy “Not Purchase” strictly dominates “Purchase”).
For the agricultural product producer,
(1).
if α ( m w ) + ( 1 α ) β ( m v ) is always equal to α ( m w ) + ( 1 α ) ( 1 β ) ( b v ) and α w ( 1 α ) β v is equal to α w ( 1 α ) ( 1 β ) v , choosing “Selling dishonestly” always gives the same outcome as choosing “Selling honestly” no matter what the consumers do. (Strategy “Selling dishonestly” is equivalent to “Selling honestly”)
(2).
if α ( m w ) + ( 1 α ) β ( m v ) is always greater than α ( m w ) + ( 1 α ) ( 1 β ) ( b v ) and α w ( 1 α ) β v is always greater than α w ( 1 α ) ( 1 β ) v , choosing “Selling dishonestly” always gives a better outcome than choosing “Selling honestly” no matter what the consumers do. (Strategy “Selling dishonestly” strictly dominates “Selling honestly”)
(3).
if α ( m w ) + ( 1 α ) β ( m v ) is always less than α ( m w ) + ( 1 α ) ( 1 β ) ( b v ) and α w ( 1 α ) β v is always less than α w ( 1 α ) ( 1 β ) v , choosing “Selling dishonestly” always gives a worse outcome than choosing “Selling honestly” no matter what the consumers do. (Strategy “Selling honestly” strictly dominates “Selling dishonestly”).
In sum, we can know that:
When α ( m + c + a ) + ( 1 α ) β ( m p + c + a ) and α ( m + c + a ) + ( 1 α ) ( 1 β ) ( b + c ) are both greater than 0, or equivalently α ( p + m c a ) ( b c ) p ( b c ) + ( p + m c a ) ( m + c + a ) ,   β ( m c a ) ( c b ) p ( b c ) + ( p + m c a ) ( m + 2 c + a b ) , agricultural product consumer’s dominant strategy is to purchase;
When α ( m w ) + ( 1 α ) β ( m v ) is less than α ( m w ) + ( 1 α ) ( 1 β ) ( b v ) and α w ( 1 α ) β v is less than α w ( 1 α ) ( 1 β ) v , that is, whatever the parameter α takes, as long as β 0.5 ,   o r   β b v m + b 2 v , the dominant strategy for the producer is “Selling honestly”.

References

  1. Horrigan, L.; Lawrence, R.S.; Walker, P. How sustainable agriculture can address the environmental and human health harms of industrial agriculture. Environ. Health Perspect. 2002, 110, 445–456. [Google Scholar] [CrossRef] [PubMed]
  2. Hopper, W.D. The development of agriculture in developing countries. Sci. Am. 1976, 235, 196–205. [Google Scholar] [CrossRef]
  3. Intergovernmental Panel on Climate Change. Climate Change 2007: Mitigation of Climate Change Contribution of Working Group III to the Fourth Assessment Report of the Intergovernmental Panel on Climate Change; Cambridge University Press: Cambridge, UK, 2007. [Google Scholar]
  4. Intergovernmental Panel on Climate Change. Climate Change 2013: Mitigation of Climate Change Contribution of Working Group III to the Fourth Assessment Report of the Intergovernmental Panel on Climate Change; Cambridge University Press: Cambridge, UK, 2013. [Google Scholar]
  5. Li, X.H. Overview of Studies on Low-Carbon Agriculture. Agric. Econ. Sci. Technol. 2011, 22, 11–13. (In Chinese) [Google Scholar]
  6. Jin, M.; Zhao, C. Analysis on the Green Agricultural Product Consumer Intent and Consumer Behaviors. Chin. Rural Econ. 2008, 5, 44–55. (In Chinese) [Google Scholar]
  7. Caswell, J.A. Valuing the benefits and costs of improved food safety and nutrition. Aust. J. Agric. Res. Econ. 1998, 42, 409–424. [Google Scholar] [CrossRef] [Green Version]
  8. Kimura, A.; Wada, Y.; Kamada, A.; Masuda, T.; Okamoto, M.; Goto, S.I.; Tsuzuki, D.; Cai, D.; Oka, T.; Dan, I. Interactive effects of carbon footprint information and its accessibility on value and subjective qualities of food products. Appetite 2010, 55, 271–278. [Google Scholar] [CrossRef]
  9. Newman, T.P.; Fernandes, R. A re-assessment of factors associated with environmental concern and behavior using the 2010 general social survey. Environ. Educ. Res. 2016, 22, 153–175. [Google Scholar] [CrossRef]
  10. Ting, D.H.; Cheng, C.F.C. Developing pro-environmental behaviour: Ecotourism fieldtrip and experiences. Int. J. Sustain. High. Educ. 2017, 18, 1212–1229. [Google Scholar] [CrossRef]
  11. Gadenne, D.; Sharma, B.; Kerr, D.; Smith, T. The influence of consumers’ environmental beliefs and attitudes on energy saving behaviours. Energy Policy 2011, 39, 7684–7694. [Google Scholar] [CrossRef]
  12. Corraliza, J.A.; Berenguer, J. Environmental values, beliefs, and actions: A situational approach. Environ. Behav. 2000, 32, 832–848. [Google Scholar] [CrossRef]
  13. Whitmarsh, L. Behavioural responses to climate change: Asymmetry of intentions and impacts. J. Environ. Psychol. 2009, 29, 13–23. [Google Scholar] [CrossRef] [Green Version]
  14. Wu, Y.H.; Wu, L.F. Study on willingness to pay for the low-carbon agricultural products in urban—taking low carbon pork as an example. Rural. Technol. Econ. 2012, 8, 4–12. (In Chinese) [Google Scholar]
  15. Shuai, C.M.; Ding, L.P.; Zhang, Y.K.; Guo, Q.; Shuai, J. How consumers are willing to pay for low-carbon products—Results from a carbon-labeling scenario experiment in China. J. Clean. Prod. 2014, 83, 366–373. [Google Scholar] [CrossRef]
  16. Harris, S.M. Does sustainability sell? Market responses to sustainability certification. Manag. Environ. Qual. Int. J. 2007, 18, 50–60. [Google Scholar] [CrossRef]
  17. Howard, P.H. Central Coast consumers want more food-related information, from safety to ethics. Calif. Agric. 2006, 60, 14–19. [Google Scholar] [CrossRef] [Green Version]
  18. Vanclay, J.K.; Shortiss, J.; Aulsebrook, S.; Gillespie, A.M.; Howell, B.C.; Johanni, R.; Maher, M.J.; Mitchell, K.M.; Stewart, M.D.; Yates, J. Customer Response to Carbon Labelling of Groceries. J. Consum. Policy 2011, 34, 153–160. [Google Scholar] [CrossRef]
  19. Upham, P.; Dendler, L.; Bleda, M. Carbon labelling of grocery products: Public perceptions and potential emissions reductions. J. Clean. Prod. 2011, 19, 348–355. [Google Scholar] [CrossRef]
  20. Hobbs, J.E.; Bailey, D.V.; Dickinson, D.L.; Haghiri, M. Traceability in the Canadian Red Meat Sector: Do Consumers Care? Can. J. Agric. Econ. Rev. Can. Dagroecon. 2005, 53, 47–65. [Google Scholar] [CrossRef]
  21. Tan, M.; Tan, R.; Khoo, H.H. Prospects of carbon labelling—A life cycle point of view. J. Clean. Prod. 2014, 72, 76–88. [Google Scholar] [CrossRef]
  22. Zhao, R.; Zhong, S. Carbon labelling influences on consumers’ behavior: A system dynamics approach. Ecol. Indic. 2015, 51, 98–106. [Google Scholar] [CrossRef]
  23. Tait, P.; Saunders, C.; Guenther, M.; Rutherford, P.; Miller, S. Exploring the impacts of food label format on consumer willingness to pay for environmental sustainability: A choice experiment approach in the United Kingdom and Japan. Int. Food Res. J. 2016, 23, 1787–1796. [Google Scholar]
  24. Beattie, G.; Sale, L.; McGuire, L. Information of Carbon Labelling and Consumer Response; Final Project Report; The University of Manchester Sustainable Consumption Institute: Manchester, UK, 2009. [Google Scholar]
  25. O’connor, R.E.; Bard, R.J.; Fisher, A. Risk perceptions, general environmental beliefs, and willingness to address climate change. Risk Anal. 1999, 19, 461–471. [Google Scholar] [CrossRef]
  26. Albarracín, D.; Wyer, J.R. The cognitive impact of past behavior: Influences on beliefs, attitudes, and future behavioral decisions. J. Pers. Soc. Psychol. 2000, 79, 5–22. [Google Scholar] [CrossRef] [PubMed]
  27. Bodur, H.O.; Brinberg, D.; Coupey, E. Belief, affect, and attitude: Alternative models of the determinants of attitude. J. Consum. Psychol. 2000, 9, 17–28. [Google Scholar] [CrossRef]
  28. Bang, H.K.; Ellinger, A.E.; Hadjimarcou, J.; Traichal, P.A. Consumer concern, knowledge, belief, and attitude toward renewable energy: An application of the reasoned action theory. Psychol. Mark. 2000, 17, 449–468. [Google Scholar] [CrossRef]
  29. Ajzen, I.; Fishbein, M. Understanding Attitudes and Predicting Social Behavior. Englewood Cliffs; Prentice Hall: Englewood, NJ, USA, 1980. [Google Scholar]
  30. Ajzen, I.; Madden, T.J. Prediction of goal-directed behavior: Attitudes, intentions, and perceived behavioral control. J. Exp. Soc. Psychol. 1986, 22, 453–474. [Google Scholar] [CrossRef]
  31. Emons, W. Credence Goods and Fraudulent Experts. RAND J. Econ. 1997, 28, 107–119. [Google Scholar] [CrossRef]
  32. Akerlof, G.A. The Market for “Lemons”: Quality Uncertainty and the Market Mechanism. Q. J. Ecol. 1970, 84, 488–500. [Google Scholar] [CrossRef]
  33. Gadema, Z.; Oglethorpe, D. The use and usefulness of carbon labelling food: A policy perspective from a survey of UK supermarket shoppers. Food Policy 2011, 36, 815–822. [Google Scholar] [CrossRef]
  34. Ashby, D.; West, C.R.; Ames, D. The ordered logistic regression model in psychiatry: Rising prevalence of dementia in old people’s homes. Stat. Med. 1989, 8, 1317–1326. [Google Scholar] [CrossRef]
  35. Xiong, K.; Kong, F.; Zhang, N.; Lei, N.; Sun, C. Analysis of the Factors Influencing Willingness to Pay and Payout Level for Ecological Environment Improvement of the Ganjiang River Basin. Sustainability 2018, 10, 2149. [Google Scholar] [CrossRef]
Figure 1. The game tree.
Sustainability 11 00592 g001
Figure 2. Game matrix.
Sustainability 11 00592 g002
Table 1. The test results of questionnaire validity.
ItemsKMO testBartlett’s testFactor loadingCumulative variance contribution rate (%)Sig. of Bartlett’s test
Respondent’s cognition towards global climate change0.735127.6250.59173.6210.000
Respondent’s cognition of the distinction of agricultural products0.761113.5170.61276.2520.000
Respondent’s cognition of the environmental effect of low-carbon agricultural products0.811179.2720.58569.8370.000
Respondent’s understanding toward carbon labelling0.783146.8760.67376.2550.000
Respondent’s trust in carbon labelling0.795161.3560.59871.2970.000
Table 2. Descriptive statistics of the sample.
CharacteristicsClassificationNumberRatio
GenderMale20132.68%
Female41467.32%
Under 19304.88%
20~2918930.73%
Age30~3922837.07%
40~499615.61%
50 and above7211.71%
Middle school or below14723.90%
EducationHigh school19832.20%
College21034.15%
Graduates or above609.75%
3000 CNY and under10517.07%
Family income (month)3001~5000 CNY21635.12%
5001~7000 CNY16827.32%
7000 CNY and above12620.49%
Franchised stores6310.24%
Channels to purchaseSupermarkets41767.81%
Farmers markets9916.10%
Others365.85%
Table 3. Consumers’ “environmental beliefs”.
Cognition towards Global Climate Change
Impact of Climate ChangeBigModerateSmallNone
Number of Respondents10229115666
Percentage16.58%47.31%25.37%10.73%
Cognition of the Distinction between Low-carbon Products and the Ordinary Ones
PollutionOrdinary Rice is More PollutingLow-Carbon Rice is More Polluting
Number of Respondents6087
Percentage98.86%1.14%
Cognition of the Environmental Effect of Low-Carbon Agricultural Products
Environmental EffectBigModerateSmallNone
Number of Respondents18624912357
Percentage30.24%40.49%20.00%9.27%
Table 4. Consumers’ cognition of carbon labelling.
Understanding towards Carbon Labelling
UnderstandingVery GoodModerateFewerNone
Number of Respondents48219199149
Percentage7.80%35.61%32.36%24.23%
Whether to Trust Carbon Labelling
TrustNoYes
Number of Respondents344271
Percentage55.93%44.07%
Table 5. Consumer willingness to pay for the premium of low-carbon rice.
Price (CNY)Proportion Exceeding the Initial Price (%)Persons Willing to PurchaseProportion (%)
2.210%22740.04%
2.420%19233.86%
2.840%6811.99%
3.680%468.11%
4.0100%346.00%
Table 6. Variable setting and descriptive statistics.
VariablesRangeImplication and ExplanationModel 1Model 2
Mean Std DevMean Std Dev
Dependent variables
Willingness to pay0–1Whether consumers are willing to pay for the premium of the low-carbon rice (0 = No; 1 = Yes)0.920.035
The premium level willing to pay1–5The premium level that consumers willing to pay for low-carbon rice (1 = 10%; 2 = 20%; 3 = 40%; 4 = 80%; 5 = 100%)2.060.037
Control variables
Sex0–10 = Male; 1 = Female0.670.0290.630.026
Age1–51 = Under 19; 2 = 19~29; 3 = 30~39; 4 = 40~49; 5 = 50 and above2.990.0683.230.079
Monthly income1–41 = 3000 CNY and below; 2 = 3001~5000 CNY; 3 = 5001~7000 CNY; 4 = 7000 CNY above2.510.0472.780.059
Education1–41 = middle school and under; 2 = high school; 3 = junior college or university; 4 = graduate or above2.300.0422.520.057
Purchase ways1–41 = others;2 = farmers market;3 = supermarkets; 4 = franchised stores2.820.0643.130.074
Understanding towards carbon labelling (understanding)1–41 = none; 2 = fewer; 3 = moderate; 4 = very good2.270.0392.490.051
Consumer trust in carbon labelling (trust)0–10 = no; 1 = yes0.410.0120.450.013
Cognition towards global climate change (influence)1–41 = none; 2 = small; 3 = moderate; 4 = big2.700.0562.810.059
Cognition towards the difference of products (difference)0–10= low-carbon rice is more polluting; 1= ordinary rice is more polluting0.990.01410.012
Cognition towards the environmental effect of the low-carbon rice (function)1–41= none; 2 = small; 3 = moderate; 4 = big2.920.0713.090.072
Table 7. Benchmark estimation results of the logistic model (model 1). Dependent variable: Willingness to pay the greenness premium (Y/N).
VariableRegression CoefficientStandard DeviationMarginal Effect
age0.1070.0920.036
sex-0.0540.047-0.012
income0.677 ***0.1120.198 ***
education0.3570.3040.107
way0.0970.0890.033
understand0.369 ***0.1020.128 ***
trust0.501 ***0.1370.186 ***
influence0.235 **0.0990.077 **
difference0.342 ***0.1240.124 ***
function0.276 **0.1180.0083 **
constant0.583 **0.256
Note: *, **, and *** represent the significance at the 10%, 5%, and 1% levels, respectively. LR = 78.021, McFadden R2 = 0.639, Observation size = 615, Prob>chi2 = 0. 0000, Log likelihood = -67.325.
Table 8. Benchmark estimation results of the ordered logistic regression model (model 2). Dependent Variable: The Price Premium that Willing to Pay (Discrete Values of 1–5).
VariableRegression Coefficient Standard Deviation
female0.2170.196
age (19~29)0.1530.132
age (30~39)0.3060.257
age (40~49)0.3980.363
age (50 and above)0.5390.471
income (3001~5000 CNY)0.597 **0.246
income (5001~7000 CNY)0.723 **0.351
income (7000 CNY above)2.577 ***0.501
high school0.439 *0.258
junior college or university0.8620.721
graduate or above1.327 ***0.402
way (farmers market)0.1960.153
way (supermarkets)0.3220.255
way (franchised stores)0.4720.403
understand (fewer)0.561 **0.279
understand (moderate)0.732 **0.351
understand (very keen)1.561 ***0.413
trust (yes)2.136 ***0.328
influence (small)0.985 **0.482
influence (moderate)1.781 **0.851
influence (big)3.425 ***0.593
difference (ordinary rice is more polluting)2.537 ***0.459
function (small)0.602 **0.297
function (moderate)0.793 **0.395
function (big)1.315 ***0.313
threshold value (premium is 10%)0.1960.139
threshold value (premium is 20%)0.4120.276
threshold value (premium is 40%)0.6850.503
threshold value (premium is 80%)0.7230.529
Note: (1) For explanatory variables, the group with the lowest value is set as the benchmark group; for the dependent variable, the benchmark group is “the premium level is 100%”; (2) *, **, and *** represent the significance at the 10%, 5%, and 1% levels, respectively. LR = 89.276, McFadden R2 = 0.692, Observation size = 567, Prob>chi2 = 0.0000, Log likelihood = −86.323.
Table 9. Estimation results of determinants of willingness to pay across different groups.
VariableUnder Junior CollegeJunior College and aboveFamily Monthly Income less than 5000 CNY Family Monthly Income 5000 CNY and aboveAged less than 30 YearsAged 30 Years and above
Regression CoefficientRegression CoefficientRegression CoefficientRegression CoefficientRegression CoefficientRegression Coefficient
influence0.117
(0.083)
0.347 **
(0.139)
0.089
(0.073)
0.521 ***
(0.176)
0.198 **
(0.097)
0.256 **
(0.125)
difference0.203 *
(0.107)
0.463 ***
(0.141)
0.159
(0.127)
0.621 ***
(0.155)
0.285 **
(0.059)
0.379 ***
(0.086)
function0.132
(0.096)
0.392 **
(0.192)
0.106 *
(0.062)
0.469 ***
(0.128)
0.201 **
(0.093)
0.292 **
(0.143)
control variablesYesYesYesYesYesYes
constant0.926 ***
(0.215)
0.785 ***
(0.163)
0.821 ***
(0.186)
0.502 ***
(0.103)
0.899 ***
(0.197)
0.626 ***
(0.152)
LR63.82179.52561.73280.63968.61774.012
McFadden R20.5260.6510.5180.7010.6230.639
Obs.345270321294219396
Note: *, **, and *** represent the significance at the 10%, 5%, and 1% levels, respectively.
Table 10. Estimation results of determinants of price premium levels across different groups.
Under Junior CollegeJunior College and aboveFamily Monthly Income 5000 CNY and underFamily Monthly Income 5000 CNY above29 Years Old and under30 Years Old and above
Regression CoefficientRegression CoefficientRegression CoefficientRegression CoefficientRegression CoefficientRegression Coefficient
influence (small)0.863 *
(0.502)
2.102 ***
(0.583)
0.679 *
(0.358)
3.103 ***
(0.751)
0.963 **
(0.469)
1.302 **
(0.628)
influence (moderate)1.327 **
(0.659)
3.465 ***
(0.892)
1.103 **
(0.498)
4.011 ***
(0.949)
1.896 **
(0.956)
2.172 **
(1.063)
influence
(big)
2.016 **
(0.867)
4.263 ***
(1.012)
1.821 **
(0.765)
4.568 ***
(1.304)
3.179 ***
(0.873)
3.623 ***
(1.087)
difference (ordinary rice is more polluting)1.522 **
(0.751)
3.468 ***
(0.913)
1.179 **
(0.585)
3.823 ***
(0.796)
2.125 ***
(0.403)
2.768 ***
(0.521)
function (small)0.515 *
(0.269)
1.023 ***
(0.306)
0.359 *
(0.196)
1.625 ***
(0.401)
0.627 **
(0.298)
0.687 **
(0.323)
function (moderate)0.723 *
(0.379)
1.653 ***
(0.407)
0.576 *
(0.309)
2.023 ***
(0.516)
0.789 **
(0.387)
0.912 **
(0.451)
function
(big)
0.922 **
(0.461)
1.891 ***
(0.623)
0.858 **
(0.423)
2.519 ***
(0.697)
1.015 ***
(0.301)
1.558 ***
(0.363)
Threshold value
(premium is 10%)
0.149
(0.101)
0.258
(0.177)
0.139
(0.092)
0.267
(0.178)
0.192
(0.131)
0.211
(0.146)
Threshold value
(premium is 20%)
0.303
(0.229)
0.483
(0.353)
0.285
(0.221)
0.487
(0.359)
0.416
(0.289)
0.436
(0.318)
Threshold value
(premium is 40%)
0.578
(0.392)
0.713
(0.501)
0.526
(0.389)
0.732
(0.591)
0.656
(0.561)
0.702
(0.523)
Threshold value
(premium is 80%)
0.617
(0.468)
0.801
(0.596)
0.598
(0.473)
0.837
(0.612)
0.729
(0.528)
0.763
(0.612)
LR87.353110.25979.658113.15599.627101.323
McFadden R20.6510.7580.6250.7890.7120.733
Number305262283284192375
Note: (1) Explanatory variables with the lowest values are set as the benchmark group; the benchmark group of the explained variables is “the premium level is 100%”; (2) *, **, and *** represent the significance at the 10%, 5%, and 1% levels, respectively.

