1. Introduction
Agricultural and food products most often have a complex structure and exhibit complex behavior during processing. These determine the suitability for processing and constitute the basic quality criterion for acceptance by contractors and customers. This also applies to wheat grains. Wheat grain has a multi-layered and complex structure that depends on the genetic characteristics, the environment, and the specific cultivation conditions. The individual components of its structure exhibit different mechanical properties, including resistance to external loads and resistance to the formation and propagation of cracks. It results, on the one hand, in different susceptibilities of the varieties to the production of flour and, consequently of bread, biscuits, or pasta, and on the other hand, in the complexity and diversity of numerous grain processing technologies. Hence, the optimization of wheat breeding programs as well as the appropriate wheat selection for technology for many years required proper assessment of the technological quality of grain. However, the quality of wheat cannot be simply defined, since it changes depending on the farmer, grain dealer, seed company, milling industry, pasta industry, and consumer. For the farmers it can be yield or resistance to disease, for miller’s protein content, hardness, or many others. By knowing the quality, processors can avoid purchasing grain that does not meet their needs. There are a lot of methods used to determine the technological quality of kernels. A number of these are time consuming and expensive (farinograph, alveograph), and hence are often impractical to use as the way to pay producers premiums based on kernel quality expectations. Finding measures of wheat which can be conducted quickly and less expensively gives the opportunity to develop new approaches to predict kernel or dough behavior. Between them, the research on mechanical properties of kernels continues to expand.
Mechanical properties of wheat kernels are naturally associated with the conditions of mechanical separation of the endosperm and the outer bran layer, the breaking resistance of the bran or the breaking susceptibility of the endosperm itself, or starch and proteins. Khazaei and Mann [
1] stated that the relaxation data could be useful in estimating the susceptibility of materials to damage. Ponce-García et al. [
2] successfully applied rheological measurements to distinguish among wheat classes, varieties, and different moisture contents. The test on intact kernels was used by Figueroa et al. [
3,
4] to establish relationships among protein composition, viscoelasticity of dough, and baking outcomes. However, there are many different conclusions and opinions regarding the scope of application of many studies. The reason for this is undoubtedly the differences arising from the use of different materials, equipment, procedures, detailed measurement conditions, and different methods of interpretation of results.
The interpretation of stress relaxation test results is most often based on rheological models (mechanical analogs) known from the rheology theory. According to these, food materials can be assumed to be composed of springs (representing ideal solids) and dashpots (considered ideal fluids) arranged in different ways. The most frequently used mechanical analogs are the Maxwell model, the Kelvin–Voigt model, and the standard linear model, SLM [
5]. The spring constants in the Maxwell model give information on the stiffness, that is, the solid nature of the sample. The dashpots constants represent the relaxation times of individual Newtonian elements. The Maxwell model is suitable for representing stress relaxation data, but it does not consider the equilibrium stress. For this reason, a generalized Maxwell–Wiechert model consisting of a few elements in parallel with a spring is better for describing the viscoelastic behavior of food [
5]. It was reported by Sozer and Dalgic [
6] that most viscoelastic foods do not follow the simple Maxwell model; therefore, it is necessary to use more complex models to describe their stress relaxation behavior.
The Peleg and Normand model has fewer constants than the Maxwell model, however it is a simple, quick, and effective method to handle stress relaxation data [
7]. According to Sozer et al. [
8], the Peleg and Normand equation can be a good alternative to the Maxwell model. The authors observed that at large deformations, the Maxwell model did not fit their data very well, and the Peleg and Normand model helped overcome this problem. Apart from its debated mathematical convenience, the Peleg and Normand simulation are easy to perform and analyze the results. Stress relaxation parameters were sensitive enough to account for the textural characteristics of raw, dried, and cooked noodles [
9,
10,
11]. Lewicki and Łukaszuk [
12] concluded that the rheological properties, based on the Peleg model, strongly correlated with the moisture content and reflected the changes in the distribution of components and structure of apple tissue during convective drying. On the other hand, Buňka et al. [
13] stated that only the parameter expressing the extent of material relaxation provided an adequate description of the actual changes occurring during the ripening of Edam cheese. The initial rate at which the stress relaxed provided no relevant description. Similarly, Singh et al. [
14] and Filipčev [
15] support the opinion of the inadequacy of parameter
k1 to follow textural changes or in differentiating various food products. Other authors found, however, that this parameter differed between various samples, such as cooked spaghetti [
8], cooked Asian noodles [
9], or wheat breads [
16].
More studies have reported rheological properties evaluated under large strains (e.g., 5% strain or greater) [
17]. This results from the fact that during real processing conditions, large deformations occur, resulting in the expected irreversible deformation, flow, or fracture of the material [
18]. Creep and relaxation tests for large deformations were carried out for various food products, but their results indicate different opinions on the adequacy and variability of parameters of various rheological models. Higher applied stress can result in faster relaxation, according to Guo et al. [
19], and larger proportion of the unrelaxed stress, according to [
20]. The constants of the Peleg and Normand model for steamed bread [
7] and bulk relaxation test of Jatropha curcas seeds [
21] significantly decreased with larger strains. Karaman et al. [
22] indicated a slightly more elastic behavior of cheese at higher compression levels. According to Khazaei and Mann [
1], the deformation level had a definite effect on the decay forces for Maxwell elements for buckthorn berries, whereas the effect on relaxation times was not always ambiguous and different for each Maxwell element. Also, Bargale and Irudayaraj [
23] stated that the effect of deformation level on relaxation time was stable and did not show a clear tendency. Moreover, Faridi and Faubion [
24], following Shelef and Bousso [
25], pointed to the independence of the relaxation parameters on the initial stress.
In summary, there are still different opinions on specific rheological measurements, and many particular cases must be treated individually. The goal of this study is the determination of the influence of the initial loading level on relaxation characteristics described by the model of Peleg and Normand. The effect was examined for different wheat types and varying moisture content.
2. Materials and Methods
2.1. Material Selection
Four wheat varieties were used in the experiments, two soft-type endosperms and two hard-type endosperms. Of these, two soft Polish cultivars (Zawisza and Wydma) and one hard SMH87 originated from the plant breeding station HR Smolice (harvested in 2015). The second hard variety was obtained from the pasta production company, Lubella. The names of the wheat varieties are denoted here as: Zawisza—SOFT1, Wydma—SOFT2, SMH87—HARD1, and wheat from Lubella—HARD2. The selection of both the soft-type and hard-type endosperm varieties was motivated by their confirmed significant differences in stress–strain behavior and fragmentation susceptibility.
2.2. Chemical Analyses
Chemical analyses were performed in the Central Agroecological Laboratory of the University of Life Sciences in Lublin, Poland. The Infratec™ 1241 (Foss, Denmark), a whole grain analyzer that uses near-infrared transmittance technology, was used to estimate the amounts of protein, wet gluten, starch, and Zeleny index. The apparatus uses a wavelength in the range of 570–1100 nm. From the batch sample about 200 g, 10 subsamples were scanned. The result of the analysis was the average of 10 measurements.
2.3. Moisture Determination
The initial moisture content of a batch sample of wheat kernels was determined by applying the air oven method. Three 5 g samples of grains were dried for over 2 h at a temperature of 130 °C, in accordance with the Polish Standard, PN-EN ISO 712:2012. The initial moisture content (
mi) was calculated according to the formula (wet basis):
where
Mw is mass of the sample before drying and,
Md is mass of the sample after drying.
Different moisture levels, i.e., 8%, 10%, 12%, 14%, 16%, 18%, and 20% (wet basis), were assigned in the experimental plan. To obtain the respective levels, each batch sample with known weight and moisture was dried at 40 °C until its weight corresponding to the driest sample (8%) was obtained. The batch sample was then divided into seven smaller samples, and to each of them, the required amount of water was added. The amount of water was calculated using simple mass balance equations.
2.4. Stress Relaxation Procedures
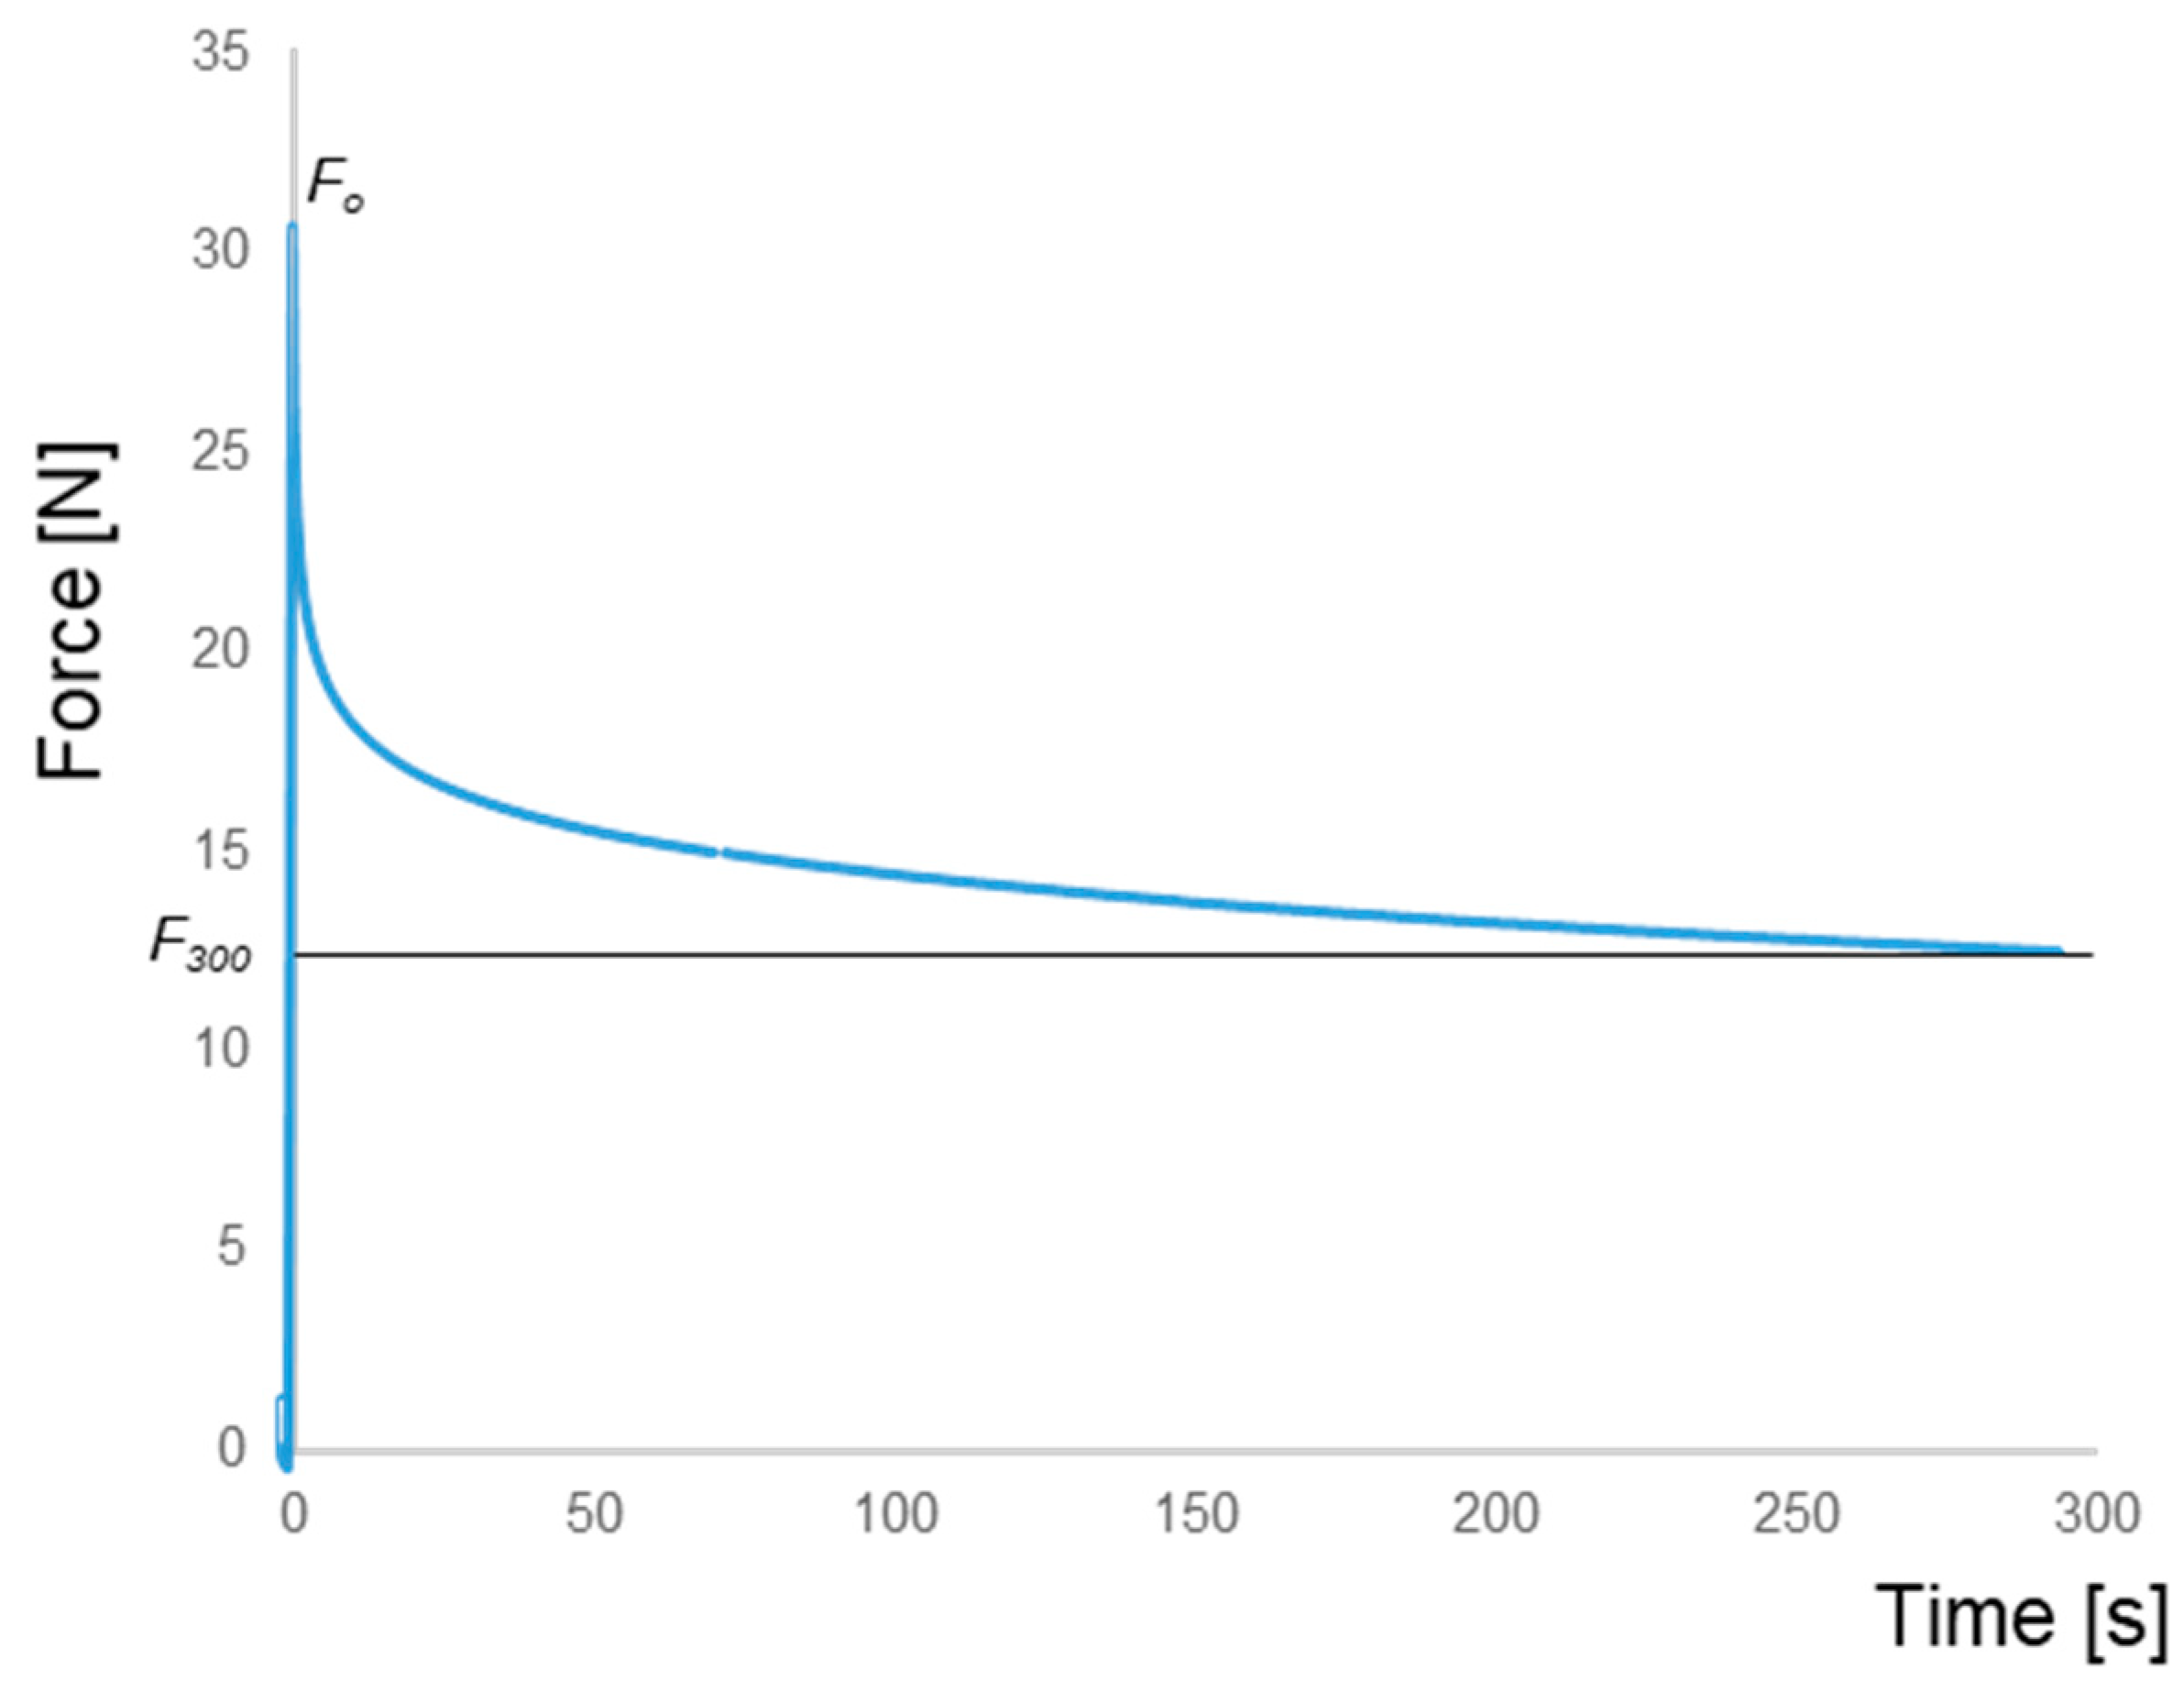
The measurements were performed in the laboratory of the Department of Food Engineering and Machines. A Zwick Z020 universal testing machine was used for relaxation measurements. It was equipped with 0.1 kN capture. Application of the 0.1 N capture with an accuracy grade of 0.5% resulted in a 0.5 N accuracy of force measurement. The machine was operated using the testXpert firmware supplied by Zwick (version 7.1). Measurements were carried out for all four wheat varieties with the seven specified levels of moisture content. A single kernel of wheat was placed with its ventral side on the bottom of the machine’s plate and then loaded axially until a required load level was obtained. The constant compression rate during the loading at 10 mm/min was adjusted. The strain (deformation) of the kernel was kept constant during next 300 s. The decreasing value of the loading force as a function of time was measured with the help of the testXpert software at a frequency of 100 Hz. Twenty replications were performed.
The experiments were conducted for four distinct initial load levels, i.e., 20 N, 30 N, 40 N, and 50 N. The maximum applied value (50 N) corresponds to about half of the value of the force causing kernel rupture (at ambient conditions) (
Figure 1).
2.5. Calculations and Statistical Analysis
Peleg and Normand [
26,
27] suggested that stress relaxation data could be calculated as normalized stress and fitted to formula (2). The formula has been used by many authors, and depending on the assumptions made, it is based on decay in stress, modulus, or force. Force, which was used in the study, is also a valid criterion [
28]. Hence, the relaxation of wheat kernel can be expressed in terms of force decay, as:
where
Fo is the initial loading force in Newtons at time
t = 0;
Ft is the force in Newtons at relaxation time
t;
t is the time of relaxation in seconds;
k1 and
k2 are constants; the reciprocal of
k1 determines the initial decay rate; and
k2 is the hypothetical value of the asymptotic normalized force.
The decay parameter
Y(t) was calculated according to:
where
F(300) – is the force established at 300 s.
k1 indicates how fast the material in question is relaxing in energy (at least initially). If the reciprocal of the
k1 represents the initial decay rate, then its value can be associated with a low rate of decay, indicating a pronounced elastic behavior. A higher value of
k1 suggests a harder, more solid-like material that dissipates less energy, thus needing more force to be compressed [
29]. Parameter
k2 represents the degree of solidity, and it varies between 1, for a material that is an ideal liquid, to infinity, for an ideal elastic solid where the stress does not relax at all [
27].
The constants of the Peleg and Normand model were estimated by fitting the experimental data to the above formulas using Excel software. Experimental data were analyzed using Statistica, Dell Inc. [
30] version 13. In all the analyses, a significance level at 0.05 was acquired.
3. Results
The chemical composition of wheat varieties is presented in
Table 1. Hard varieties had higher gluten and protein content. The amount of wet gluten was close to 34–35% for hard wheats and 25–26% for soft types. The protein amounts were close to 15% and 12%, respectively. Higher starch content was characteristic for soft wheats (near 71%) in comparison to hard ones (about 64%). Finally, the ability of the flour proteins to swell in an acid medium expressed by Zeleny index was about two times higher for hard wheats.
The amount of protein in soft, hard, and durum can vary according to the differences in grading systems in different countries. However, within a species, wheat cultivars are further classified in terms of protein content as soft wheats (protein content about 10%), hard (protein content higher than in soft), and durum (are generally high in gluten-producing proteins, 15%). Generally, soft wheat has been bred to yield flour containing less protein than hard wheats, about 8% to 11% versus 10% to 14% protein, respectively [
31]. Although the hardness is postulated to be strongly correlated with protein content [
32], soft wheats can have a higher protein content than the hard cultivars, or wheat lines with different protein content can have very close hardness scores [
33]. This all means that the cause of starch–protein adhesion is not straightforward, and is still being discussed [
32,
33,
34,
35].
3.1. The Force Decay
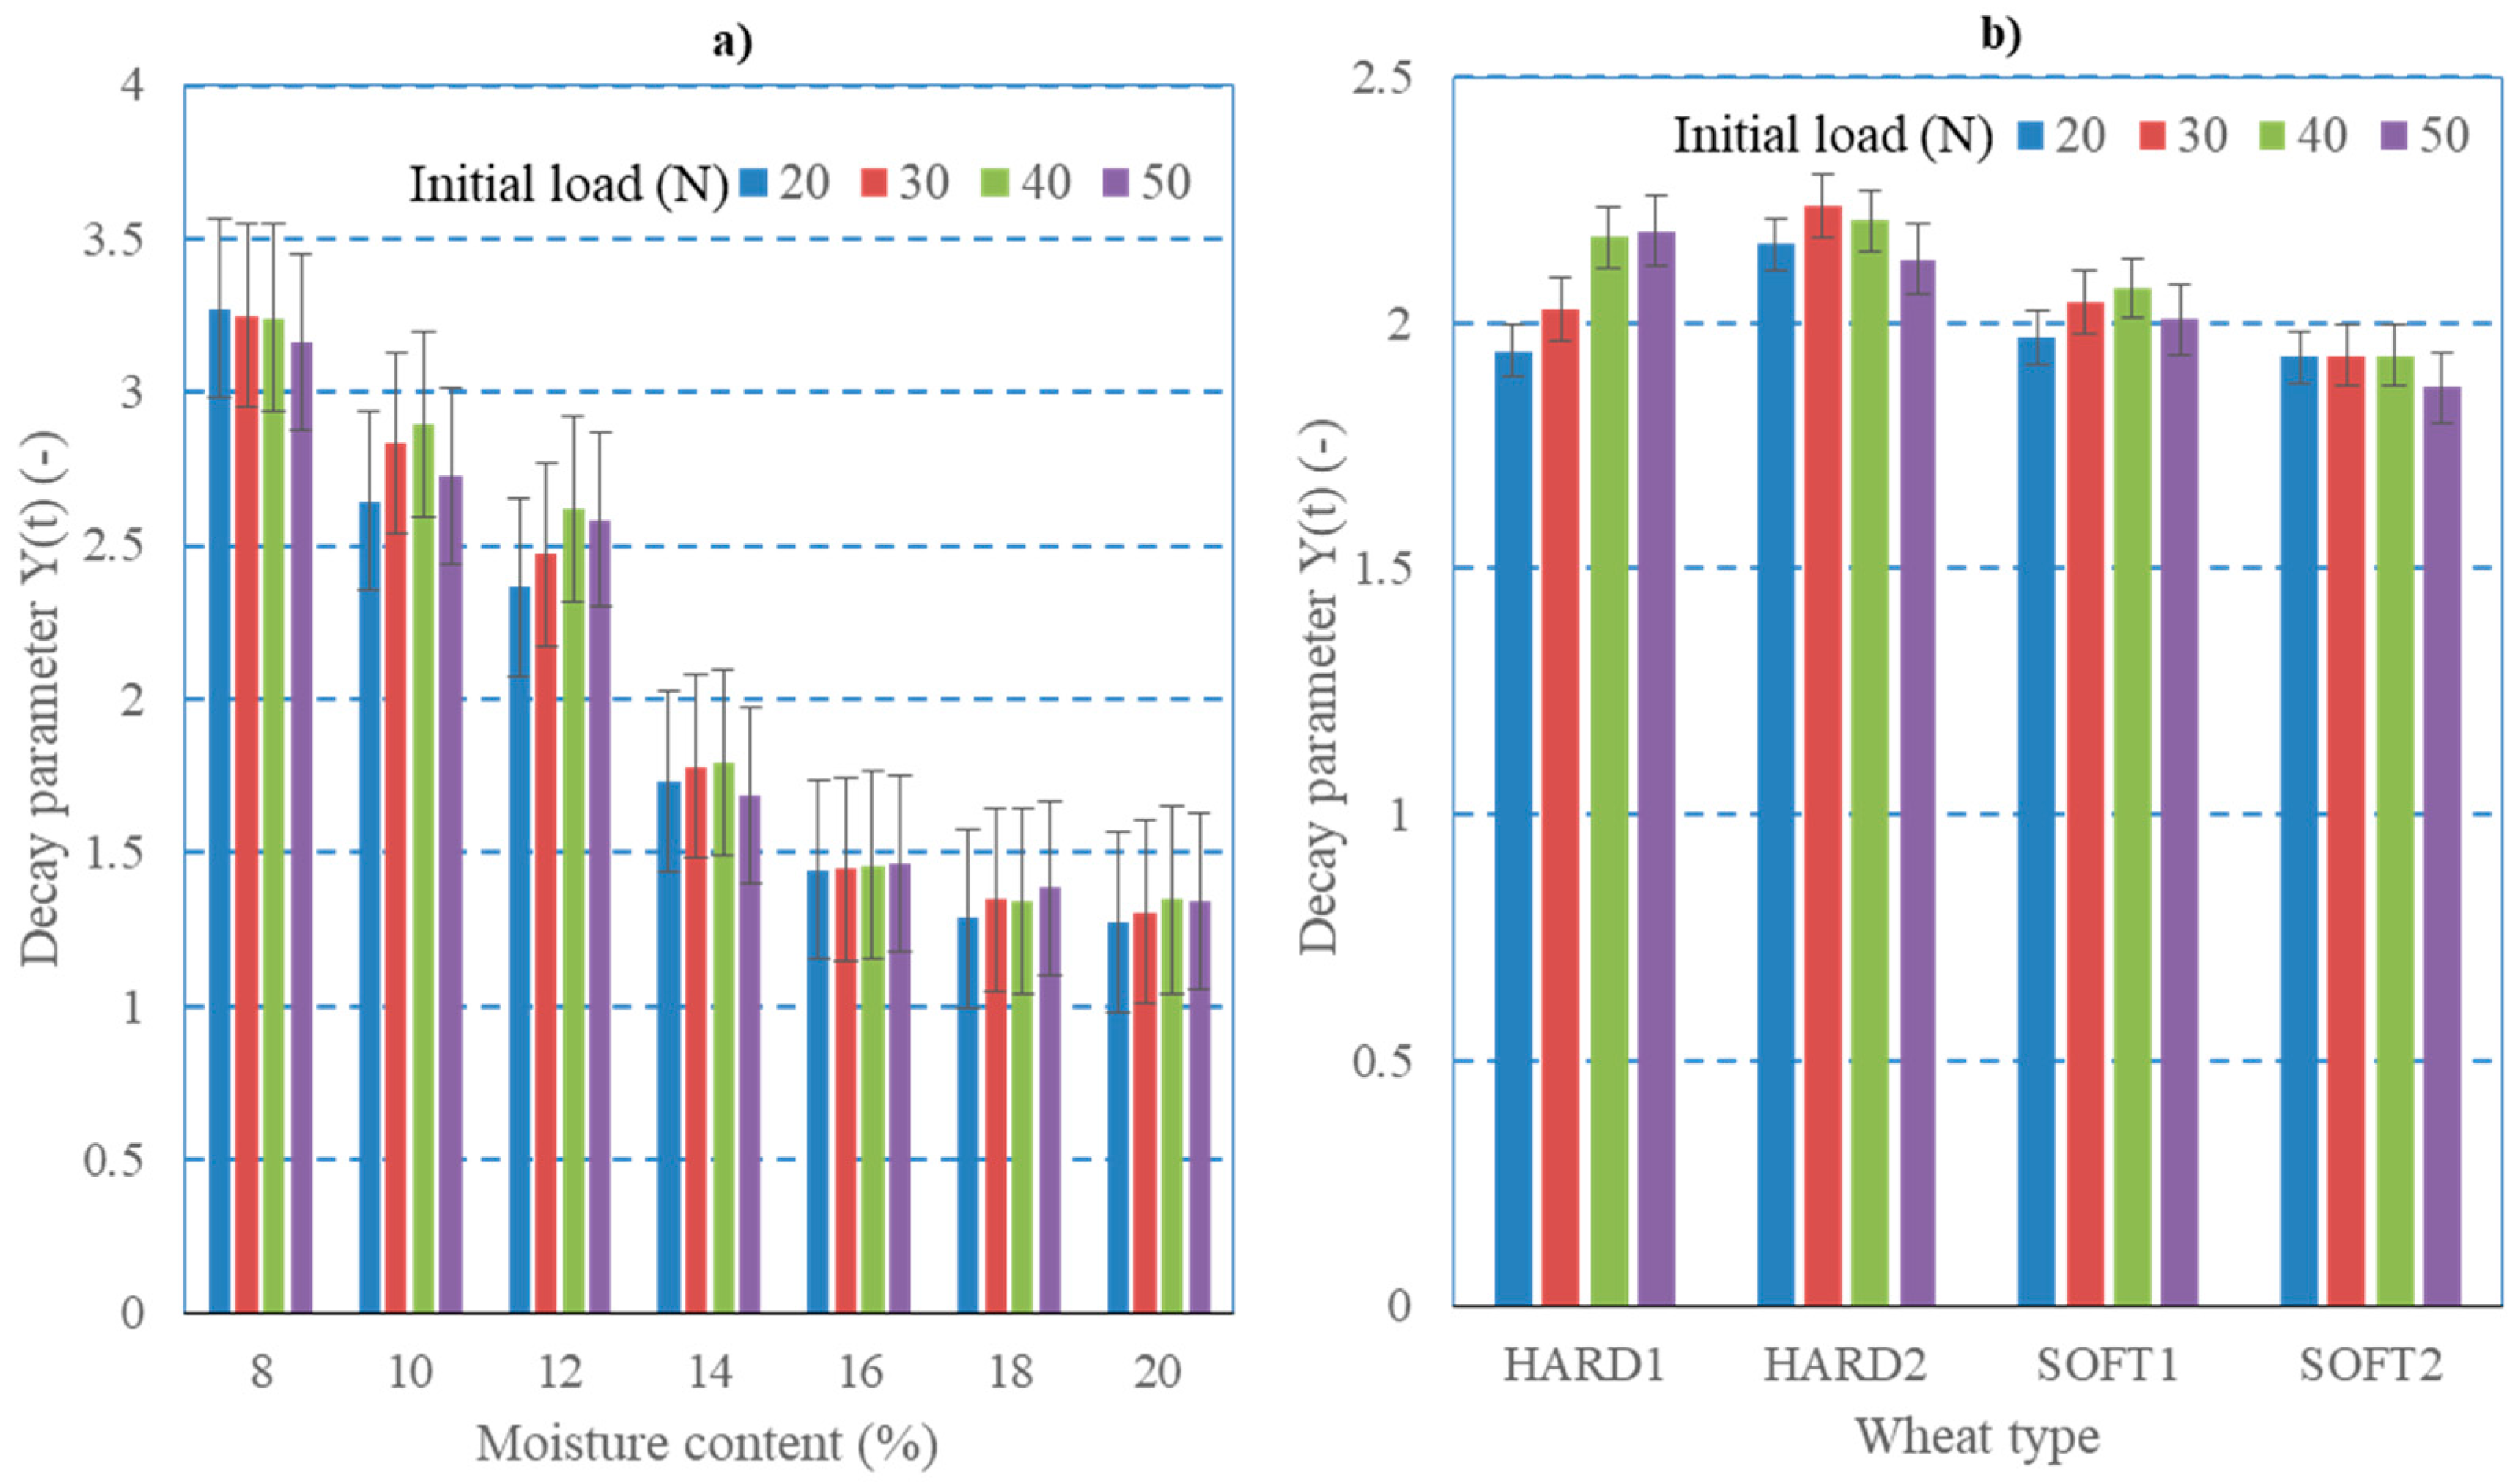
Figure 2 shows the effect of wheat variety and moisture on the force decay rate. The decay
Y(t) represents a rate of decline in the force as a result of relaxation. The Tukey test was used for the testing of hypotheses of means equality. Distinct letters denote groups for which the means differed significantly at
p < 0.05. Four groups were distinguished for studied cultivars. The highest values of the force decay rate were characteristic of hard wheats. The differences between the average values were particularly noticeable for lower grain moistures (up to 14%). For higher water amounts, the average values for hard and soft varieties were close. However, significant differences between soft and hard kernels were confirmed.
A considerable decline in the force decay was caused by increasing the moisture of kernels. Only for 18% and 20% moisture levels were the means were not statistically different, though the slower decline rate was observed already above 16%. The interactive effect between the two factors was also significant and confirmed by ANOVA analysis.
Figure 3 shows the effect of initial load level on the decay parameter for varied moisture and wheat type. For individual samples differing in moisture content, the effect of loading was not confirmed, although the significant effects of moisture, initial loads, as well as interaction of the two factors (moisture content × initial load) on the parameter were statistically evidenced by variance analysis. However, the effect of load was unclear both for hard and soft-type endosperm. In this case, two-way ANOVA proved no influence of initial load nor wheat type versus initial load interaction on the force decay rate
Y(t). Next,
Figure 4 shows the general effect of the initial loading level on the average values and the distribution of the decay parameter. Only slight variations of the parameter were observed for the initial loads applied. The averages ranged from 2.0 to 2.1, although some means were statistically different. The observed small decrease in decay for 50 N loading might be caused by higher plastic deformation for moist kernels. Apart from the averages, the variability of individual results represented by their histograms (
Figure 4b) was also similar. The scale parameter of the distributions was found to be also similar and not statistically dependent on the initial loading. The two-fold higher number of observations in the range of 1.0–1.5 was a reason for wheat softness at higher moistures (at 18–20%) and fact that the decay tended to unity for softer (liquid) materials.
The results of three-way ANOVA analysis are presented in
Table 2. There were seven null hypotheses with the analysis: (1–3) the population means of each of the three independent factors are equal; (4–6) there is no interaction between all possible combinations of two factors; and (7) there is no interaction between all three factors. The F-statistic is the mean square for each main effect, and the interaction effect divided by the within variance is simply a ratio of two variances. A large F ratio means that the null hypothesis is wrong (the data are not sampled from populations with the same mean)—variation among group means is more than you would expect to see by chance. In our case, all seven hypotheses were wrong. From the three analyzed main effects, the initial load was less significant (lowest F = 22.4). The highest effect was evidenced for the kernel moisture contents (largest F = 4783.6). It is necessary to remark that although there was very little or limited influence of loading level on the decay parameter, the latter was interactively dependent on all the two-way and all the three-way interactions, i.e., moisture, wheat variety, and the initial load (
Table 2). However, the interaction of the studied initial load with the two other factors was the lowest. The “
p” column presents the statistical significance level (i.e.,
p-value) of the three-way ANOVA. It can be seen that the statistical significance level of all seven hypotheses was close to zero (
p = 0.0000). This value is <0.05 (i.e., it satisfies
p < 0.05), which means that there was a statistically significant effect.
3.2. Coefficients k1 and k2
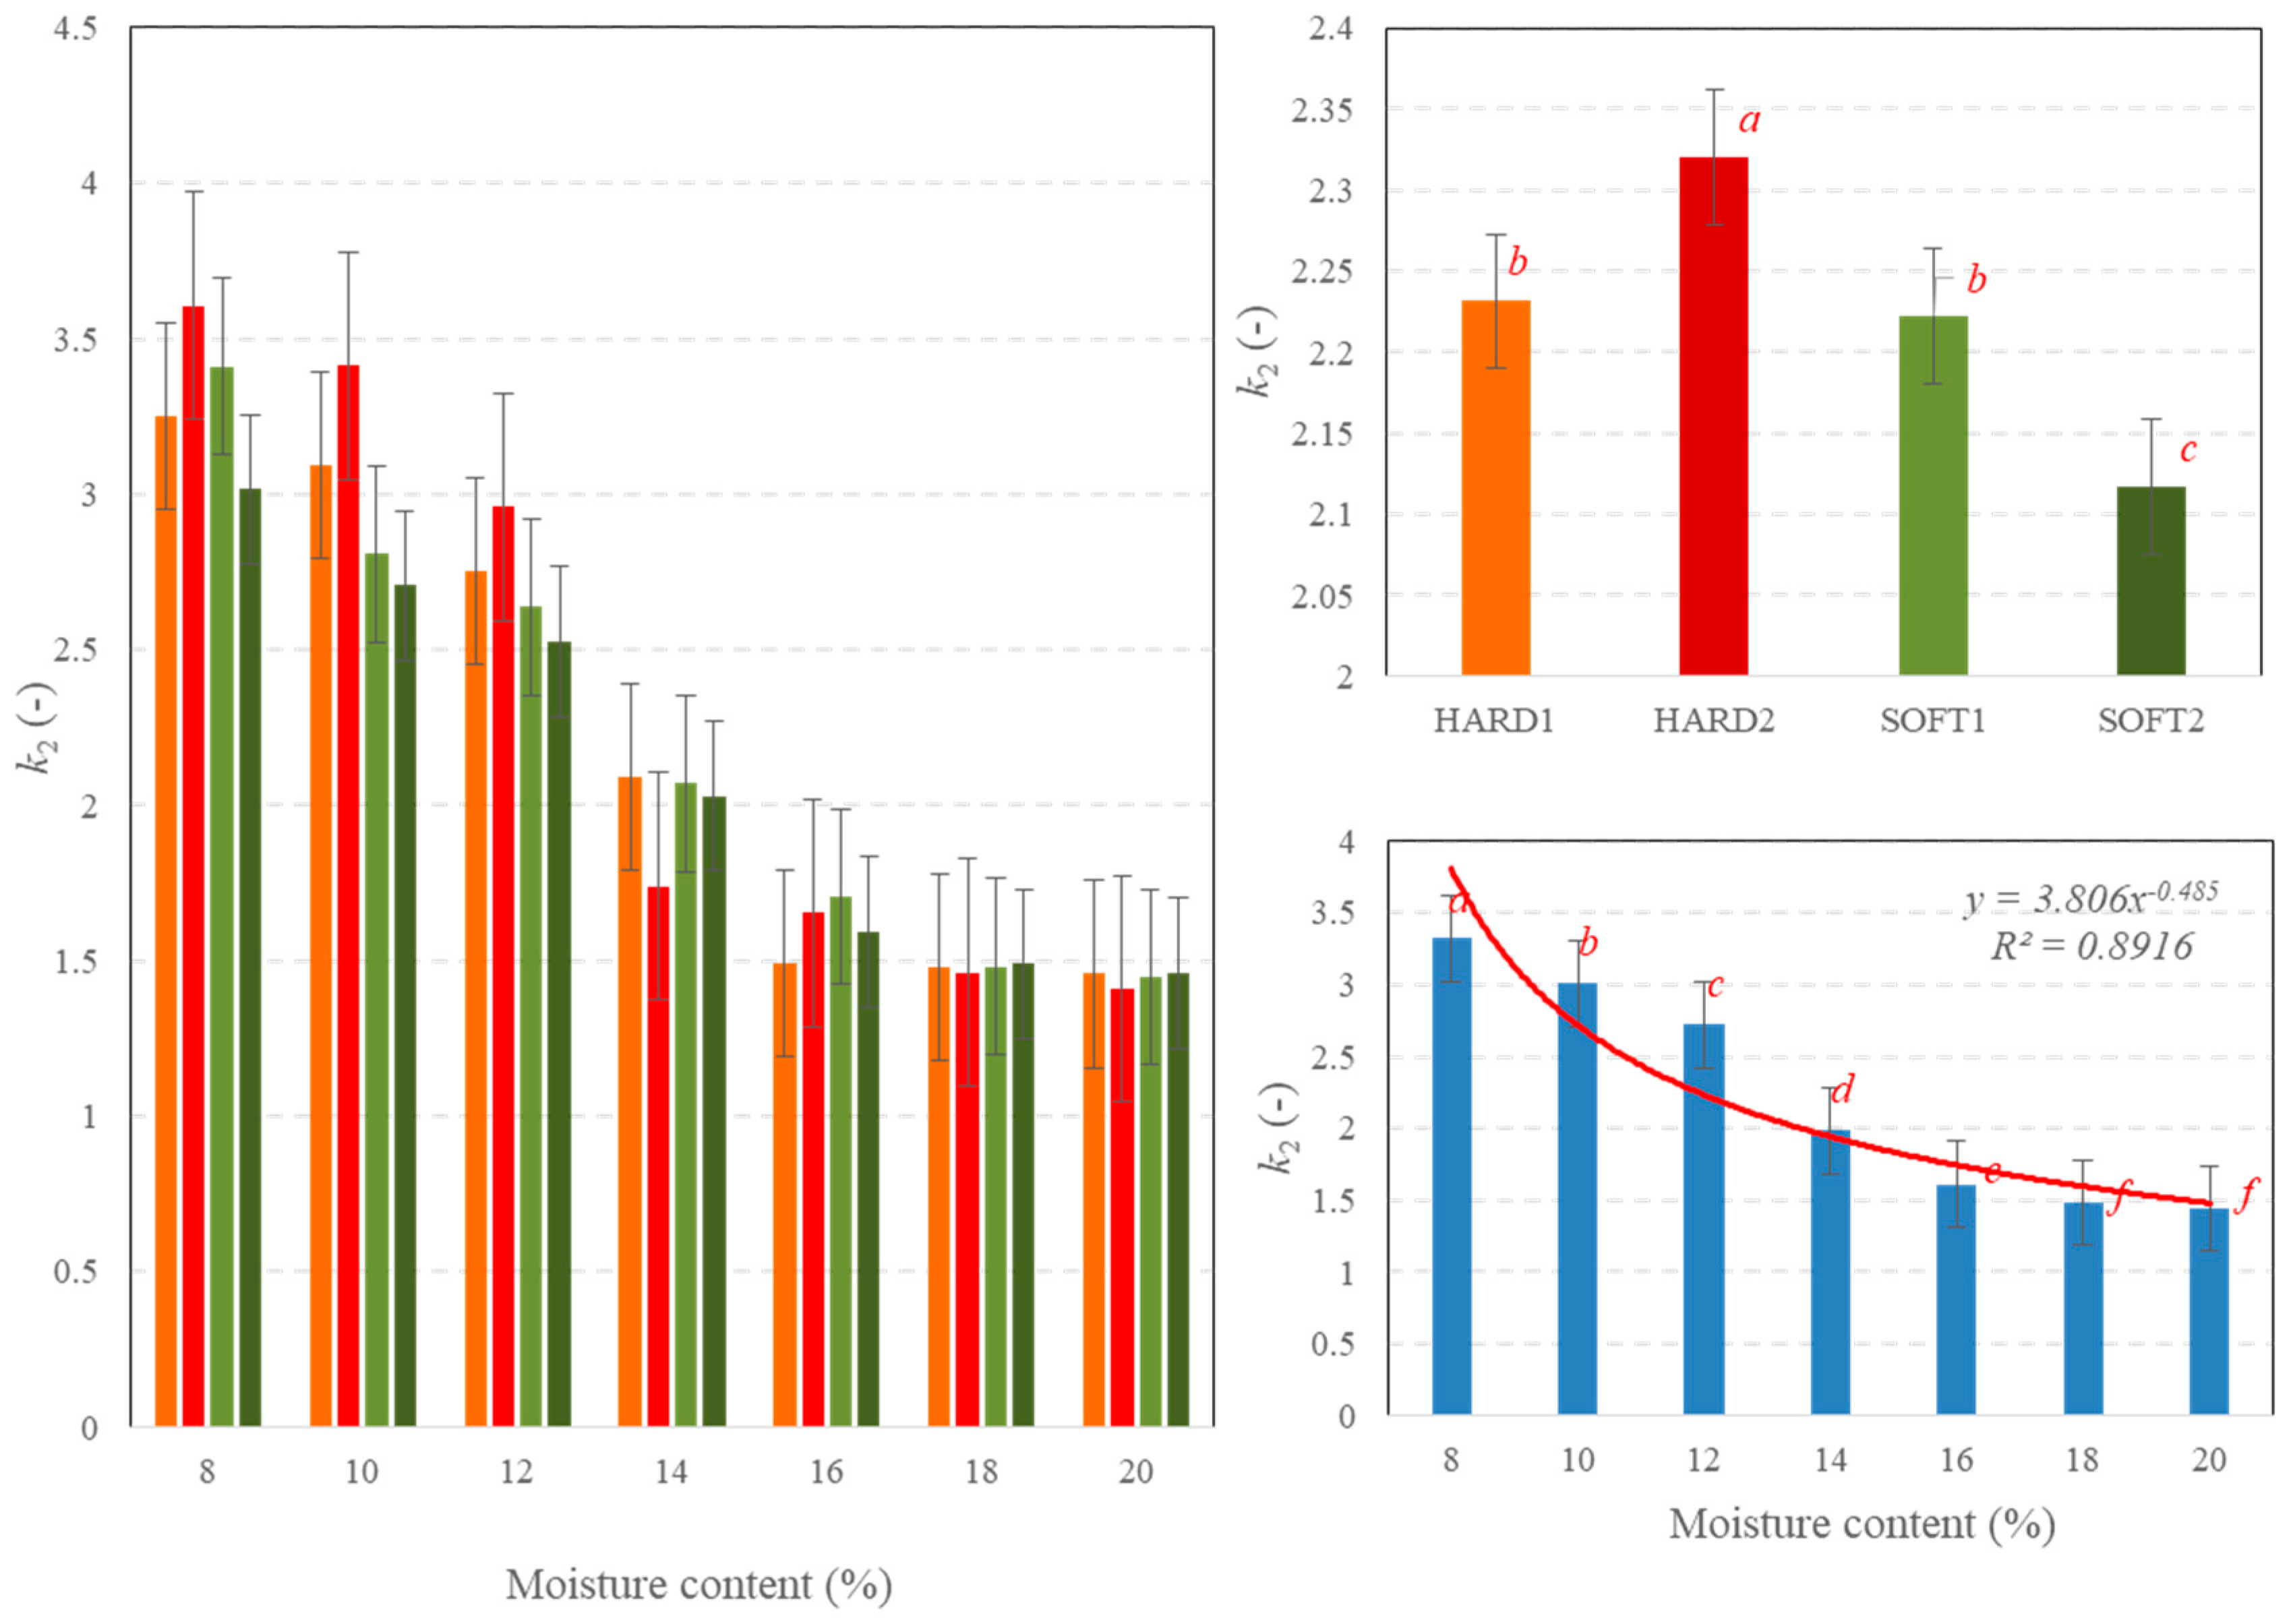
Figure 5 and
Figure 6 show the effect of moisture content on the coefficients
k1 and
k2 of the model presented by Peleg and Normand. Values of
k1 decreased with an increase in the kernel moisture content from about 17.0 to 5.0. The means of
k1 were significantly different for each moisture level, although the relationship was not proportional. A relatively fast decrease in the parameter with moisture rising up to 14% was noticeably slower for higher water levels, with practically no difference at 18% and 20%. This was observed both for soft and hard type wheats. On the contrary, for low moisture levels, in the 8–12% range, the differences between the kernel types were very clear. The values of the
k1 parameter were evidently higher for the two hard varieties. In turn, for high moisture contents, these differences vanished completely. This is an interesting and noteworthy observation regarding the possibility of using the relaxation test to distinguish varietal differences. According to this, a too high moisture content may be the reason for disappearing differences in the values of Peleg and Normand parameters.
The values of parameter k2 decreased from about 3.3 to 1.4 together with the rise in the moisture contents used. The impact of both moisture and wheat type was very similar to the parameter k1 described above.
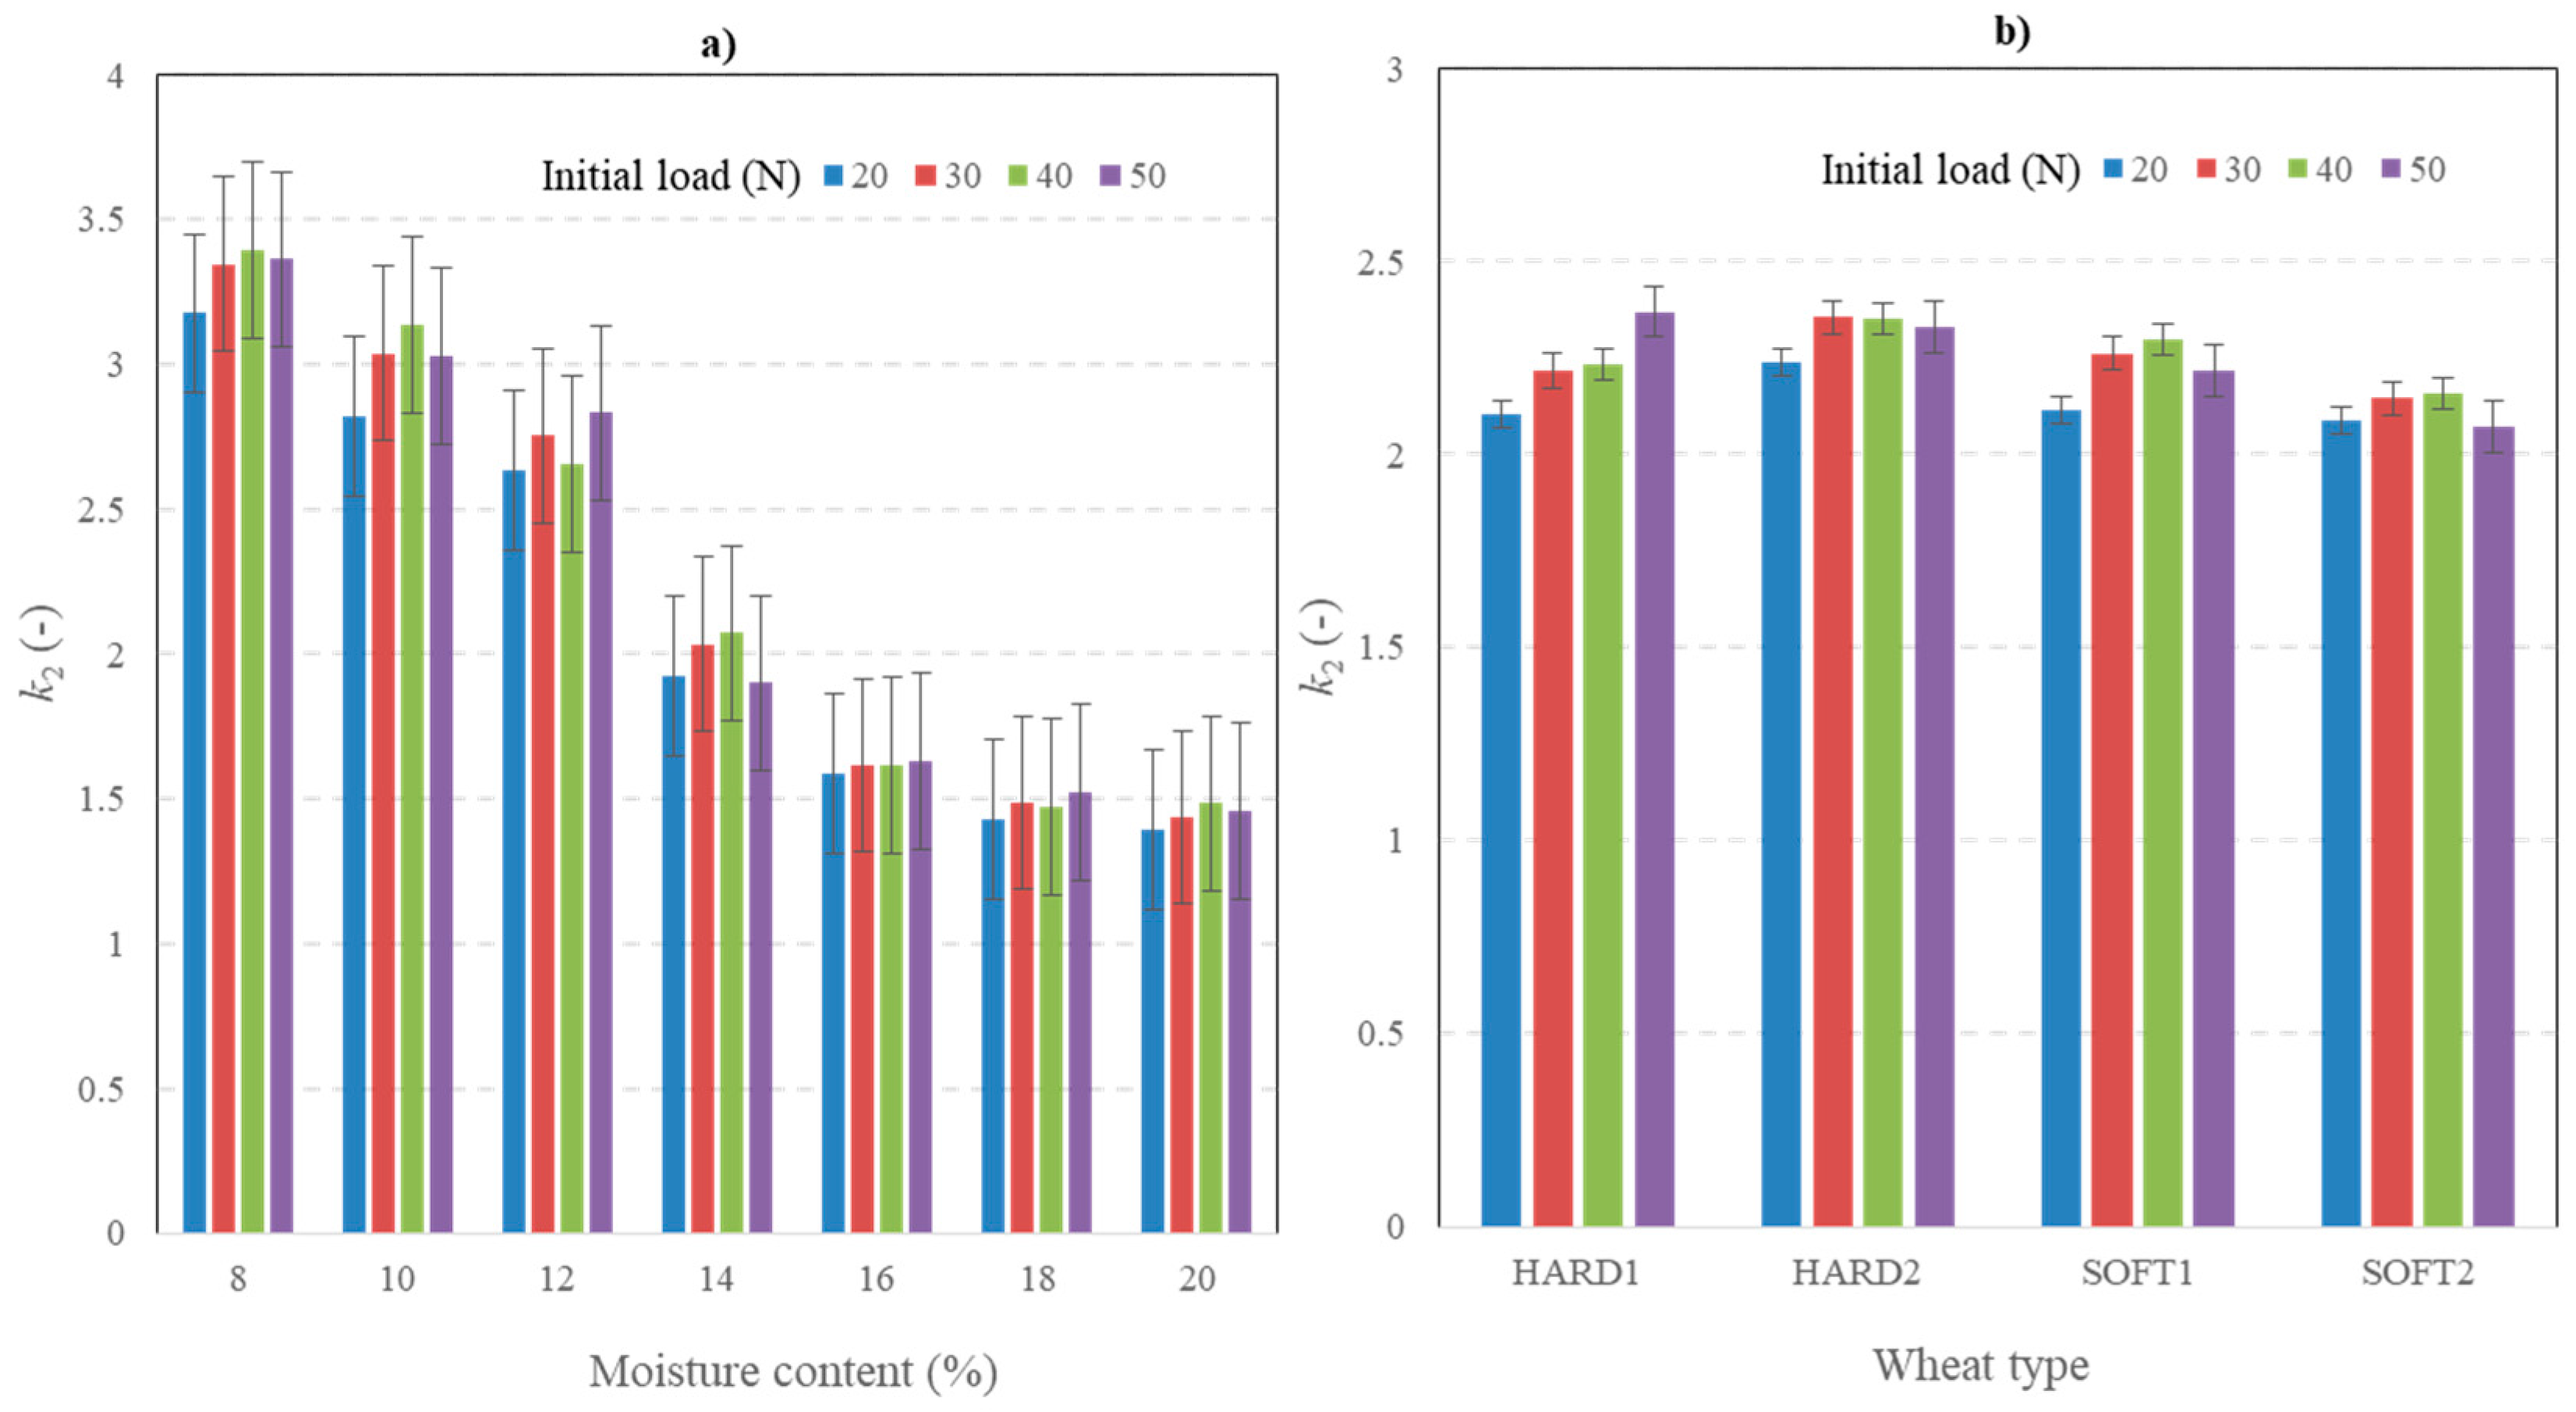
The effect of the loading level on the coefficients
k1 and
k2 is presented in
Figure 7 and
Figure 8.
The analysis for the individual moisture levels showed that the mean values of
k1 did not differ significantly. Some differences were noted for 14% and 20% moisture levels. One-way ANOVA, in which the data were completely randomized, did not confirm any significant effect of the initial load on
k1. However, two-way ANOVA, including both effects of the loading level and moisture level, confirmed their interaction on the values of the coefficient. The interactive effect was also confirmed for load and wheat type interaction. Similarly, three-way ANOVA analysis, which was the most appropriate for our three-factorial experiment, proved the interactive influence of the three analyzed factors, i.e., moisture, wheat variety, and load, on
k1 (
Table 3). Similarly, to the above analyzed decay parameter, from three factors, the initial load was less significant (F = 16.66). The highest effect was confirmed for wheat moisture (largest F = 2340.4). As for the previous analyses, the influence of wheat type was better evidenced than that of initial loading. K
1 was interactively influenced by all the two-way and all the three-way interactions, i.e., moisture, wheat variety, and the initial load (
Table 2). However, the interaction of the studied initial load with the two other factors was also the lowest.
In the case of
k2, the changing initial load had a more significant impact. We were able to distinguish two, three, and even four homogeneous groups, depending on the moisture level; however, no straightforward relationship was found. For
k2, main effects, like wheat type and load, were significant, but their interaction was not. Neither the load nor the interactive effect was significant (
p > 0.05). Finally, no effect of load was observed on the relaxation coefficients for either soft or hard endosperms. Like for
k1, the three-way ANOVA analysis proved the interactive influence of the three analyzed factors on
k2 (
Table 4). All the individual factors and interactive effects were confirmed to be statistically significant at very low
p-values (
p = 0.0000). All the observations for
k1 were similar, with two exceptions. The F-statistics for
k2 were higher (stronger effect), and the effect of load in this case was slightly higher (F = 70.6) than that of wheat type (67.8).
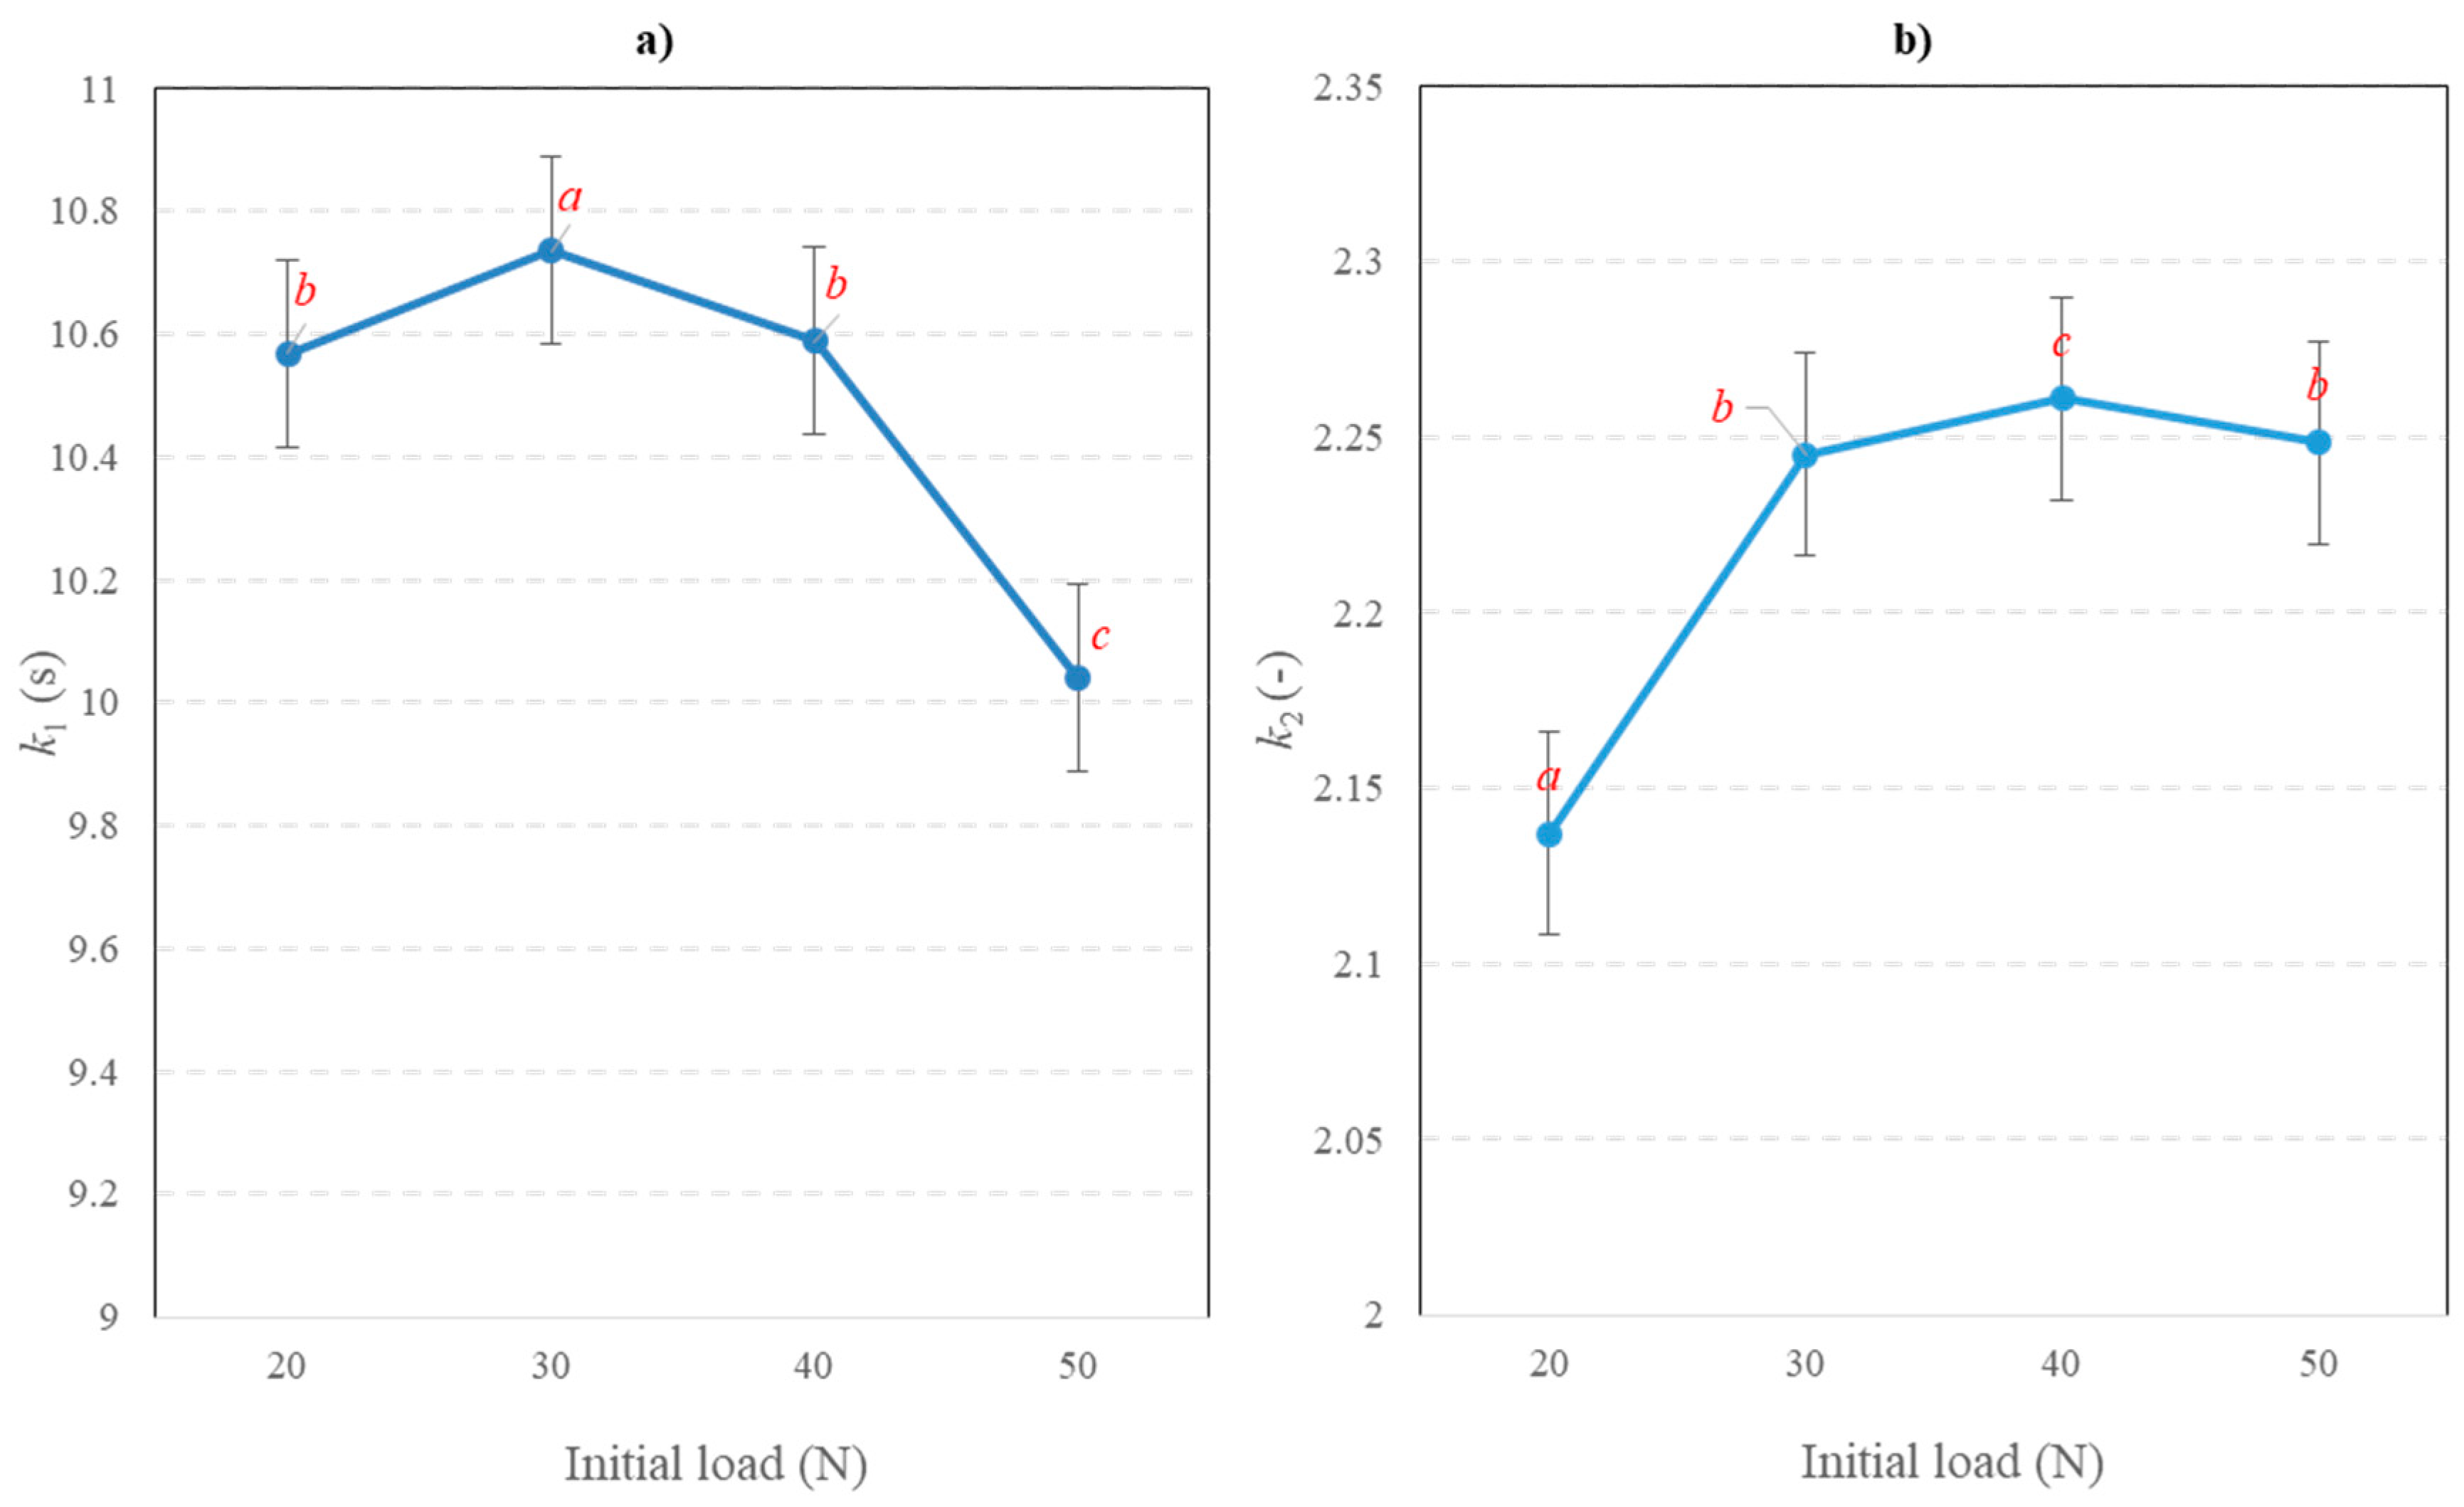
The overall effect of the initial load no the coefficients
k1 and
k2 is presented in
Figure 9. The values of the two constants changed only very little.
k1 ranged from 10.04 to 10.73 and
k2 from 2.14 to 2.27. The lowest and most statistically different value of
k1 was noted at 50 N, whereas in the range from 20 to 30 N, the means were very close. In turn, the lowest values of
k2 were obtained for the 20 N load level. The homogeneous groups marked in the figure were established by the tree-way ANOVA analysis.
Apart from the averages, we analyzed the variability of the individual model coefficients. Their distributions are presented in
Figure 10. In both cases the distributions were similar and not statistically dependent upon the initial loading. For example, the scale parameter of the exponential distributions was 0.093–0.099 for
k1 and 0.44–0.47 for
k2. Independent of the distribution fitting model applied (normal, lognormal, Weibull, or others) their parameters were very close and independent of the loading level.
Finally, the analyzed impact of the initial load on the model parameters can be compared with the wheat type, which, as observed, was very small or insignificant for higher moisture contents. The histograms of the parameters
k1 and
k2 are shown in
Figure 11. In the case of
k1, the distributions (medians) were clearly shifted towards higher values for hard wheats, with a slightly larger spreading (scale factor). However, in the case of
k2, the median values for the examined wheats were similar, with a slightly different scale factor.
4. Discussion
The observed decrease in
Y(t) with moisture means that for dry kernels, only a small amount of the initial force was relaxed, and the residual force established at 300 s was relatively high. In fact, as moisture content increases, the kernel becomes softer, and consequently, a lower force is required to maintain a certain deformation level [
1]. Water influences the rheological properties of both liquid and solid foods. It affects the response of solid foods to force [
36]. Ozturk and Takhar [
37] explained a decreasing trend in the values of relaxation constants as moisture level increased, with higher resistance to the relaxation of stresses at lower moisture levels. Samples with higher moisture content relaxed faster than the ones with lower moisture, as a result of the softening process. In the study, it was observed that an increase in the moisture content of kernels caused the force to decrease more quickly. This is due to the increased plasticity of the kernel and energy losses in non-recoverable deformations [
28,
38]. In the model of Peleg and Normand, the coefficient
k1 represents the reciprocal of the initial decay rate. This means that a high value of
k1 corresponds to a slower rate of force relaxation in the first few seconds. The coefficient
k2 represents the hypothetical value of the asymptotic normalized force (not relaxed). With an increase in moisture content, the residual force at the end of relaxation decreased, as did the values of the coefficient. This demonstrates that for moist samples, much more energy was relaxed and less energy was necessary to keep the deformation at a constant level. Similar results have also been reported in other research works [
28,
37].
Generally, well noticeable differences between hard and soft cultivars were observed and statistically confirmed. All three parameters, Y(t),
k1, and
k2, were statistically higher for the hard type endosperm, but the differences could be confirmed only at lower moisture levels and they diminished with increasing water content in kernels (especially above 16%). The changes in all obtained coefficients of
Y(t),
k1, and
k2, for the studied wheat variety were very slight, and no clear tendency was evidenced. According to Edwards [
39], the moisture sensitivity of starch strength, storage protein strength, and/or the strength of starch/protein adhesion may be responsible for differences in the strength of wheats with varying moisture contents. Such responses to water may be due to the structure of the endosperm and strength of the cell wall architecture. Soft and hard wheats exhibit the same trend with moisture content; however, they may do so at different response rates. A similar trend for soft and hard wheats was observed in our study, with little difference in rates, mainly for lower moisture contents. Glenn and Johnston [
35] pointed to no significant differences in any of the mechanical properties of the starch and protein components, either within a variety or among soft, hard, and durum wheat types, though mean values for each parameter were highest for durum and the lowest soft caryopses. Many studies have underlined the meaning of the overall porosity of the endosperm structure and indicated that endosperm strength is unrelated to the protein content [
40,
41]. Accordingly, endosperm can be very resistant, either at low protein or high protein content, depending on the adherence between the protein and starch granules. Also, Haddad et al. [
42] stated that relaxation tests make it possible to relate endosperm behavior to different types listed in materials science. However, their proposal for wheat classification was based only on the relationship between the rupture energy and the Young modulus. Following Ponce-Garcia [
43] the elastic, viscoelastic, and flow properties allow the indirect measurement of wheat characteristics related to the chemical composition, including nongluten components. The elastic behavior of intact kernels was related to the sedimentation volume and composition of glutenin. He demonstrated that hard wheats showed higher plastic deformation work than durum wheat kernels, and therefore had higher elastic properties [
44]. Some relationships between wheat hardness and Zeleny index and protein quality were observed in [
45]. In our study, we determined the basic chemical composition of wheats, however any conclusions on their relationship to measured rheological parameters were not direct or simply not justified. Some generalization based on wheat hardness may be briefly discussed here; nevertheless, the link between the biochemical studies and mechanical studies is not established.
Irrespective of the wheat softness, no obvious or very little effect (some interactions were observed) of the initial load on the model of Peleg and Normand was demonstrated. Strain level is postulated to be meaningful in relaxation experiments; however, no unique opinion in research literature exists. Some reports showed that the initial stress can influence the amount of unrelaxed energy [
20] and the relaxation speed [
19], which directly relates to the constants of the relaxation models [
21,
22,
23]. Lewicki and Spiess [
20] showed that the proportion of the unrelaxed stress is larger if the developed stress is higher. Guo et al. [
19] stated that higher applied stress can result in higher relaxation speed. The obtained results confirm those of Bargale and Irudayaraj [
23] on the uni-axial compression of barley kernels, in which the authors reported that the effect of the deformation level on relaxation time was consistent and did not show a clear trend. Also, according to Faridi and Faubion [
24] and Shelef and Bousso [
25], stress relaxation can be fairly independent of the initial stress. An analysis of the available research results allows one to state that many conclusions are true for specific circumstances only. These results demonstrate that wheat properties, which may differ very slightly, influence the relaxation characteristics more significantly than the level of loading applied. This allows a statement on its little meaning for wheat compression in the range of loads applied in the study. The results showed that this method could be a useful tool to distinguish among wheat classes, cultivars, and different moisture levels in the kernels.
To the above-mentioned different conclusions, the general opinion about the limited applicability of the Peleg and Normand model must be emphasized. To date, relaxation tests have had few practical applications, however the reasons for this seem to be not in the method itself but in the dependence of the outcomes on a number of experimental conditions (material properties, load, speed, rate of deformation, time) and research works, which cannot be easily compared. Moreover, the presented results underline the meaning of the interactive effect between various measurement conditions. Hence, the obtained parameters of the Peleg and Normand model must be examined or interpreted together with other, often very important, factors. One of these is the time of relaxation used for the model development. Only a few studies have reported the effect of relaxation time on the model parameters [
13,
46]. The dependence of the model parameters on the relaxation time and varied applicability to differentiate cheese samples was also reported in studies of Bunka et al. [
13]. Morales et al. [
46] observed that both
k1 and
k2 changed with relaxation time. The time significantly influenced the accuracy of both the rate the force decreased at the initial relaxation phase and the value of residual force. Depending on the relaxation time, the parameters were over or underestimated. Similar conclusions can be derived from the work of Al Aridhee [
47]. He demonstrated very strong dependences of the both model parameters on the relaxation holding time—
k1 significantly and linearly increased with time, whereas for longer relaxation periods
k2 decreased exponentially. For times approaching zero,
k2 increased to infinity. It must be added that the effect of time was quantitatively and qualitatively comparable to that of moisture contents.
5. Conclusions
The study led to a clear identification of the effect of wheat moisture and confirmed the influence of the wheat type on the Peleg and Normand model coefficients. The parameters k1 and k2, and the force decay Y(t), decreased with the increase in water content in the kernels. The relatively fast decrease in the parameter with moisture rising up to 14% was noticeably slower for higher water levels, with practically no difference at 18% and 20%. This was observed both for soft and hard type wheats.
The constants differed depending on the wheat hardness. The highest values of the force decay rate were characteristic of hard cultivars. For higher water amounts, the average values for hard and soft varieties were similar. On the contrary, for low moisture levels, in the 8–12% range, the differences between the grain types were very clear. This is an interesting and important observation regarding the possibility of using the relaxation test to distinguish varietal differences. According to this, too high moisture levels may be the reason for disappearing differences in the values of Peleg and Normand parameters.
The initial loading level had no effect or only a slight effect on the parameters of the Peleg and Normand model. The values of all three constants changed only very little. The effect was similar for all parameters, and none of the three analyzed parameters were influenced more than others. Apart from the averages, the distributions were very close and independent of the loading level. It must be added, however, that an interactive influence of moisture, wheat variety, and load level on the Peleg and Normand constants was statistically confirmed.
The research showed that in comparison to wheat moisture and wheat type, the influence of initial loading was very weak, ambiguous, or simply not present. Very small differences between the parameters of the Peleg and Norman model show the very weak influence of the initial load on wheat relaxation experiments, and the practical application of different loads will probably lead to similar results. It is reasonable to state that experiments on larger loads than those applied here may lead to the development and propagation of cracks, making the relaxation tests more difficult to control and interpret.
The grain protein content and protein quality aspects together with grain hardness explain most of the variation in wheat behavior. However, endosperm can be very resistant, either at low or high protein content. Thus, any relationships between wheat chemical composition and measured rheological parameters are not straightforward, and the link between the biochemical and mechanical studies has not been established yet.
Attempts to apply the Peleg and Normand model into practice need further study, including the influence of all relevant factors.


 ,
, 


