Article

Safety Guarantee System of Drinking Water Source in Three Gorges Reservoir Area and Its Application in Huangjuedu Drinking Water Source Area

1
MOE Key Laboratory of Resources and Environmental System Optimization, College of Environmental Science and Engineering, North China Electric Power University, Beijing 102206, China
2
Hebei Key Laboratory of Power Plant Flue Gas Multi-Pollutants Control, Department of Environmental Science and Engineering, North China Electric Power University, Baoding 071003, China
3
State Key Laboratory of Hydrology and Water Resources and Hydraulic Engineering Science, Nanjing 210029, China
*
Author to whom correspondence should be addressed.
Sustainability 2019, 11(24), 7074; https://doi.org/10.3390/su11247074
Submission received: 31 October 2019 / Revised: 1 December 2019 / Accepted: 5 December 2019 / Published: 10 December 2019
(This article belongs to the Special Issue Rural Sustainable Environmental Management)

Abstract

:
With China’s rapid economic growth and increasing speed of urbanization, water pollution accidents have become one kind of environmental pollution source in China and bring potential risk to urban drinking water safety. The Huangjuedu Drinking Water Source Area is an important water source in Chongqing City (Southwest China) and a water intake source for the Jiangnan Waterworks of the Chongqing Drinking Water Company. There are still risks of water pollution accidents caused by ship leakage, road traffic accidents, chemical plant leakage, etc. The safety of the drinking water area is related to regional residents’ health and life safety and also has a profound impact on economy development and social stability. To reduce the harmful impacts of water pollution, it is of great scientific value and practical significance to analyze the pollutant diffusion of water pollution accidents with the Three Gorges Reservoir Area drinking water source security platform. In this paper, a two-dimensional water quality monitoring model was applied, and the digital elevation model was incorporated into the geographic information system, which generated a computational grid. Then, the Three Gorges Reservoir Area drinking water source security platform was developed. The platform can predict the water flow velocity, pollutant concentration at the drinking water inlet, and the spatial and temporal distribution of pollutants in the whole water source area. Furthermore, a hypothetical ammonia nitrogen leak accident was analyzed using this safety platform. The ammonia nitrogen concentration at the intake of the drinking water source area was detected and analyzed by the security platform from the time of the accident until the concentration dropped to the background during four water periods under different wind direction conditions. The pollutants took 19, 22, 25, and 40 min to reach the water quality standard during the four water periods. Moreover, the diffusion of ammonia nitrogen in the southeast wind was faster than that in the southwest wind. The results showed that the platform is scientific and practical, and the prediction results are helpful for the Emergency Management Department to quickly and accurately predict the migration of ammonia nitrogen pollution and make corresponding plans under accident conditions.

1. Introduction

Drinking water safety is a major problem that affects human health and social stability. According to the World Health Organization (WHO) survey, 80% of diseases are associated with unsafe drinking water [1,2,3]. The safety of drinking water has always been a concern for people all over the world. Water is the source of life, constitutes an important part of the human body, and plays an important role in human health. Drinking water safety is essential to protect human health, and safety is the cornerstone of national security and social stability. The environmental safety of a drinking water source is closely related to the drinking water safety of a residents’ life, because water plants take water directly from drinking water sources. Environmental pollution accidents have caused water supply safety problems in countries including China, Japan, Korea, and Poland [4,5]. Water pollution accidents refer to the process by which water quality deteriorates over a period of time due to human factors or extreme weather. Water pollution incidents cause a large number of toxic and harmful substances to be discharged into the environment in a short time, seriously damaging the ecological environment and causing damage to the safety of drinking water [6,7]. Previous studies have sought to establish a basic theoretical system to predict and simulate pollution accidents and their influence areas [8].
The Three Gorges Project is a grand water conservancy project that plays an important role in China’s social and economic development. The Three Gorges Reservoir Area connects the upper and lower reaches of the Yangtze River, which is an important freshwater reservoir in China. There are millions of people living in the reservoir area, and there are many sources of drinking water [9]. In recent years, the urban population of the reservoir area has expanded rapidly, and the social economy has also developed rapidly. The Three Gorges Project Area is also threatened by various sudden water pollution accidents. Its annual navigation capacity is about 100,000 tons, including 100 hazardous chemical cargo ships and oil tankers carrying more than 3500 tons. The Three Gorges Reservoir area drinking water source security system is an important tool and platform to guarantee the safety of drinking water sources in the Three Gorges Project Area. The system has strong operability and realizes the visualization and information management of the management platform. It plays a monitoring and early warning role in water source data, with high efficiency and timeliness, ensuring the safety of drinking water supply. Therefore, it is important to establish a safety guarantee system to ensure the safety of the drinking water supply in the Three Gorges Project Area [10].
Zhang et al. (2013) combined the SD (System Dynamics) model with GIS (Geographical Information System) by integrating one-dimensional dynamic water quality model and introduced system dynamics into their water quality simulation calculation. A water quality model construction method based on system dynamics was proposed, and the spatio-temporal water quality model and simulation system were developed. The system applied the commonly used two-dimensional spatial analysis tools to the three-dimensional spatial data analysis. Through the analysis and expression of the integration of two and three dimensions, the analysis results of the traditional spatial analysis function not only retain the macroscopic display in the two-dimensional map but also increase the intuitive display in the three-dimensional map. The system dynamics water quality model was used to calculate the time-concentration series of each section, and the correlation analysis was performed according to the spatial position of each section. Computer software was then used to render the results in graded colors based on the concentration of pollutants in each section of the river at the current time on the timeline. The dynamic simulation and trend prediction of complex system behavior based on time and space are realized, and an efficient and convenient digital management tool for sudden water pollution accidents is established [11,12]. A.R. Slanghter (2017) added microbial water quality simulation function to the Water Quality System Assessment Model (WQSAM). WQSAM was used to assign the microbial water quality “characteristics” of non-point source input to the incremental flow portfolio for modeling and to assign them to the point source output according to similar characteristics. The purpose was to assess whether the simplified representation of processes affecting microbial water quality was accurate enough for water resource management. The results of the present study indicate that the system can reflect the variability of observed data in a watershed where data is scarce. Although the approach used is relatively simple, it has been argued that the uncertainty generated by the simplicity of the model will be no more or even less than that generated by the application of complex models to watersheds with sparse data [13].
However, these studies still had two major limitations. One is that previous studies rarely involve drinking water sources, especially after water pollution accidents, and analyze the water supply function of the intake and the whole drinking water source. Another is that the study area rarely involves the Three Gorges Reservoir area. Therefore, it is of great significance to assess the Three Gorges Reservoir area drinking water source security system. As an extension of previous efforts, the objective of this study is to develop a Three Gorges Reservoir area drinking water source security system for monitoring pollutant migration and diffusion in the area in order to provide support. By using the two-dimensional water quality monitoring model, based on FORTRAN language (The abbreviation of Formula Translation is the first high-level programming language designed for scientific, engineering problems or problems in business management that can be expressed with mathematical formulas) and TECPLOT visualization interface(One software with powerful data analysis and visual processing functions), considering that the model can visually present the spatial and temporal distribution of pollutants, a drinking water source security system in the Three Gorges Reservoir area is developed [2,14].
Ammonia nitrogen in water is decomposed into nitrite nitrogen by microbial action, and nitrite nitrogen in water in high concentrations can easily combine with protein to form nitrosamine, which is a strong carcinogen that is extremely adverse to the body, so we chose ammonia nitrogen pollutants as the research target [15,16]. The Huangjuedu Drinking Water Source Area is an important water source in Chongqing City (Southwest China) and the water intake source for the Jiangnan Waterworks of the Chongqing Drinking Water Company. Therefore, the process of translocation and transformation of ammonia nitrogen pollutants in the Huangjuedu Drinking Water Source Area was analyzed. The system provides a tool for the analysis and study of the time and space variation process of the diffusion and migration of ammonia nitrogen pollutants in the case of a hypothetical accident in order to improve the emergency response capacity of urban drinking water source areas, reduce property losses and social and economic hazards caused by accidents, and ensure the safety of drinking water for urban residents. In this study, the system was used to compare the diffusion and pollutant concentration changes of ammonia nitrogen pollutants during a dry period, flood period, falling period, and storage period. In addition, Chongqing is located in the subtropical monsoon climate zone, with southwest winds prevailing in summer and southeast winds prevailing in winter. The proposed system can provide positive decision support for the treatment of water pollution accident in Three Gorges Reservoir Region drinking water area and can also be used as a reference for researchers on the transport and transformation of pollutants in water.

2. Materials and Methodology

2.1. Methodology

2.1.1. Fundamental Mathematical Models of Water Quality

In the constant flow model, each parameter value does not change with time, while the non-constant flow model allows parameters to change with time. The constant and unsteady flow models mentioned here refer to both flow parameters (flow volume, velocity, and depth) and water quality parameters [17]. The values of the various parameters used in water quality models often have to be determined through field and laboratory studies. However, many rivers are usually hundreds or thousands of kilometers long, and the water depth is usually between a few meters or tens of meters. In addition, since most rivers are shallow and wide, all water parameters in the direction of water depth can be ignored in this study. Therefore, this study adopted the conserved water quality control equation and used computer software to edit the data into a visual system for research.
When wind shear stress and Coriolis force (the Coriolis force comes from the inertia of the object in motion, which is a description of the deviation of the linear motion of the particle in the rotating system due to inertia relative to the linear motion of the rotating system) are not considered, the conservation water quality control equation is adopted. The basic equations of water flow motion are shown as follows [18]:
h t + h u x + h v y = q ,
h u t + u h u x + v h u y = g h 2 x g h h b x g n 2 u u 2 + v 2 h 1 / 6 + x ε x h u x + y ε x h u y ,
h v t + u h v x + v h v y = g h 2 x g h h b y g n 2 v u 2 + v 2 h 1 / 6 + x ε y h v x + y ε y h v y ,
h c t + u h c x + v h c y = x E x h c x + y E y h c y + H S i ,
where x and y are the longitudinal and transverse flow distances (m) of the river, u is the velocity component in the x directions (m/s), and v is the velocity component in the y directions (m/s), t is the time(s), h represent river depth (m), z is the water level (m), H is the river bottom elevation (m), c is the concentration of pollutants (mg/L), x and y are the eddy viscosity coefficients in x and y directions, respectively (m2/s), g is the gravity (m2/s), Ex and Ey are the sums of discrete coefficient and turbulent diffusion coefficient in x and y directions, respectively (m2/s), n is roughness, q is interval inflow (m2/s), and Si is representative sink term (g/s).

2.1.2. Discrete Method

Equations (1)–(4) can be discretized based on the Finite Volume Method (FVM) [11], and then Equation (5) is obtained. Among them, the Semi-Implicit Method for Pressure-Linked Equation (SIMPLEC) method is adopted for discretization of the continuity equation and momentum equation, as shown in Table 1. In the calculation of model, the FVM equation is selected, and the SIMPLEC method is used to solve the flow field based on the isotopic grid theory.
Parameter values for Equation (5) are shown in Table 1 [19].
α P   ϕ p = α E ϕ E + α w ϕ W + α N ϕ N + α S ϕ S + b ,
Here α is the relaxation factor in SIMPLEC method.

2.2. System Development

Based on the above model, a two-dimensional water quality monitoring model based on FORTRAN language and TECPLOT visualization interface was used for the drinking water source area in the three gorges reservoir area [20,21,22]. Considering that the model can directly reflect the spatial and temporal distribution of pollutants, a security system for the drinking water source in Three Gorges Reservoir area was developed [23].
The upstream flow and downstream water level of the water source area are input into the platform, and the set parameters are input into the platform, such as roughness and diffusion coefficient, and the original data such as background concentrate ion and initial water depth are set. Through the calculation function of the platform, the spatial and temporal distribution of pollutants and the concentration of pollutants can be obtained, which can be expressed visually through different colors.

3. Model Application

3.1. Study Area

Considering the regional location, water supply demand, and other conditions, the Huangjuedu Drinking Water Source area (HJDWSA) was taken as the study area to simulate and predict the water quality of drinking water sources in the Three Gorges Reservoir area under accident conditions. HJDWSA belongs to the Chongqing section of the Yangtze River, which is a river-type water source area. Located in the Nanan District of Chongqing City (the largest city in the Three Gorges Reservoir area with 31 million people), it is one of the protected water bodies in the Three Gorges Reservoir Area. HJDWSA is located between 106°3’14”~106°47’2” E and 29°27’2”~29°37’2” N. The whole area is 1.2 km2, with a length of about 1200 m, and the width of the water source area is about 1000 m. The perennial average water level of HJDWSA is 166.20 m, the depth is about 30 m, and the flow of HJDWSA is about 3000~12,500 m3/s.
The HDJWSA water plant is the main water plant for Chongqing City. The plant withdraws 100,000 t/d of water via a floating boat on the shore and services 290,000 residents of the Nanan District of Chongqing City. The geographical location map of the study area is shown in Figure 1.

3.2. Source Term

Ammonia nitrogen is a typical water pollutant. In some cases, residents in the three gorges reservoir area will carry out water transportation of nitrogen fertilizer on the water source for economic reasons. Therefore, an ammonia nitrogen pollution accident in HJDWSA was assumed in the study [24].
In this scenario, a cargo ship carrying nitrogen fertilizer (with a nitrogen content of 35%) turned over at the middle of the 100 m upstream, which caused 100 tons of nitrogen fertilizer to be discharged within 15 min. Considering the influence of hydrological conditions on the process of pollutant migration and transformation, the year is divided into four water periods—a dry period, flood period, storage period, and flow period.

3.3. Accident Process Simulation

3.3.1. Boundary Conditions

In the prediction model, the upstream flow and downstream water level are usually selected as the boundary conditions of the model to ensure the accuracy of the calculated results [25,26]. In this study, taking HJDWSA as the research object, and according to the experience of other researchers, the daily flow of the Zhutuo hydrological station was selected as the upstream boundary, and the water level height of the Cuntan hydrological station was selected as the downstream boundary. Figure 2 presents the variation of daily flow of the Zhutuo hydrological station and the change of water level at the Cuntan hydrological station in 2015.
As can be seen from the chart of daily discharge and water level, the maximum daily flow at the Zhutuo hydrological station is 23,000 m3/s, which occurred in the flood period in September. The minimum daily flow was 2970 m3/s, which appeared in the dry period in February. The maximum water level of Cuntan hydrological station is 176.02 m appearing in the storage period of October. The minimum water level was 160.35 m, which appeared in the decline period in May. One month was selected for each of the four periods—the average flow velocities in the dry period, flood period, storage period, and fluctuation period were 3480 m/s, 12,500 m/s, 10,900 m/s, and 5170 m/s, respectively.

3.3.2. Initial Conditions

The background concentration of pollutants in the river is taken as the initial condition for the operation of the model. According to the surface water environmental quality standard (GB3838-2002), it is assumed that the concentration of background ammonia nitrogen in water body is 0.5 mg/L (Class II).

3.3.3. Determination of River Roughness

In order to solve the discrete equation, a constant flow rate is selected to calibrate the roughness of the channel and determine the roughness range of the study area. Roughness should be determined according to the observed value in 2015. In this study, ammonia nitrogen was taken as the index, and the main purpose of selecting constant flow to calibrate river roughness was to determine the roughness range and approximate the simulated value to the provided value through an iterative algorithm. In the process of ammonia nitrogen simulation, in order to solve the discrete equation, the river bed roughness and turbulent viscosity coefficients were calibrated by the flood period flow condition (flow Q = 12,500 m3/s, water level Z = 166.67 m), the value of bed roughness was obtained as n = 0.0854 [27], and the turbulent viscosity coefficient Vt = 0.05 [28].
The security platform also needs to define the transverse diffusion coefficient and the longitudinal diffusion coefficient. The empirical formula method was adopted, and methods of other scholars were used for reference [29], to obtained the transverse and longitudinal diffusion coefficients, which were 0.5 m2/s and 0.5 m2/s, respectively.

3.3.4. Parameter Calibration

After establishing the water quality safety prediction model, parameter calibration should be carried out to ensure the validity of the model [30,31]. According to a 2015 HJDWSA section on monitoring of water quality value as a result, the calculated results compared with the measured data, the calculated concentration field per hour, finally simulation at the water quality meet the requirements of class II water quality standard. Where the I\J axis represents the number of tables respectively, and the size of each grid represents 4 m. DEM grid size of HJDWSA is 4 m × 4 m, and the number of grids are 250 × 342. Here, 85,500 grid points are calculated, as shown in Figure 3.
Hydrological data of the dry period was Q = 3480 m3/s; Z = 169.86 m. By comparing the simulated and measured values of ammonia concentration, the accuracy of the transverse and longitudinal diffusion coefficients was verified [32,33,34]. The result shows that the average absolute error of the algorithm is less than 6% in the calculation of pollutant emergencies in the water source area. In conclusion, this platform can be used as a tool to simulate the diffusion of ammonia nitrogen pollutants in the HJDWSA [35].

4. Results and Discussion

This study had four water periods, and the spatial and temporal changes of assumed ammonia nitrogen pollution accident and the pollutant concentration changes were simulated in the HJDWSA. The time variation and spatiotemporal distribution of the concentration in the whole water area were obtained by simulation.

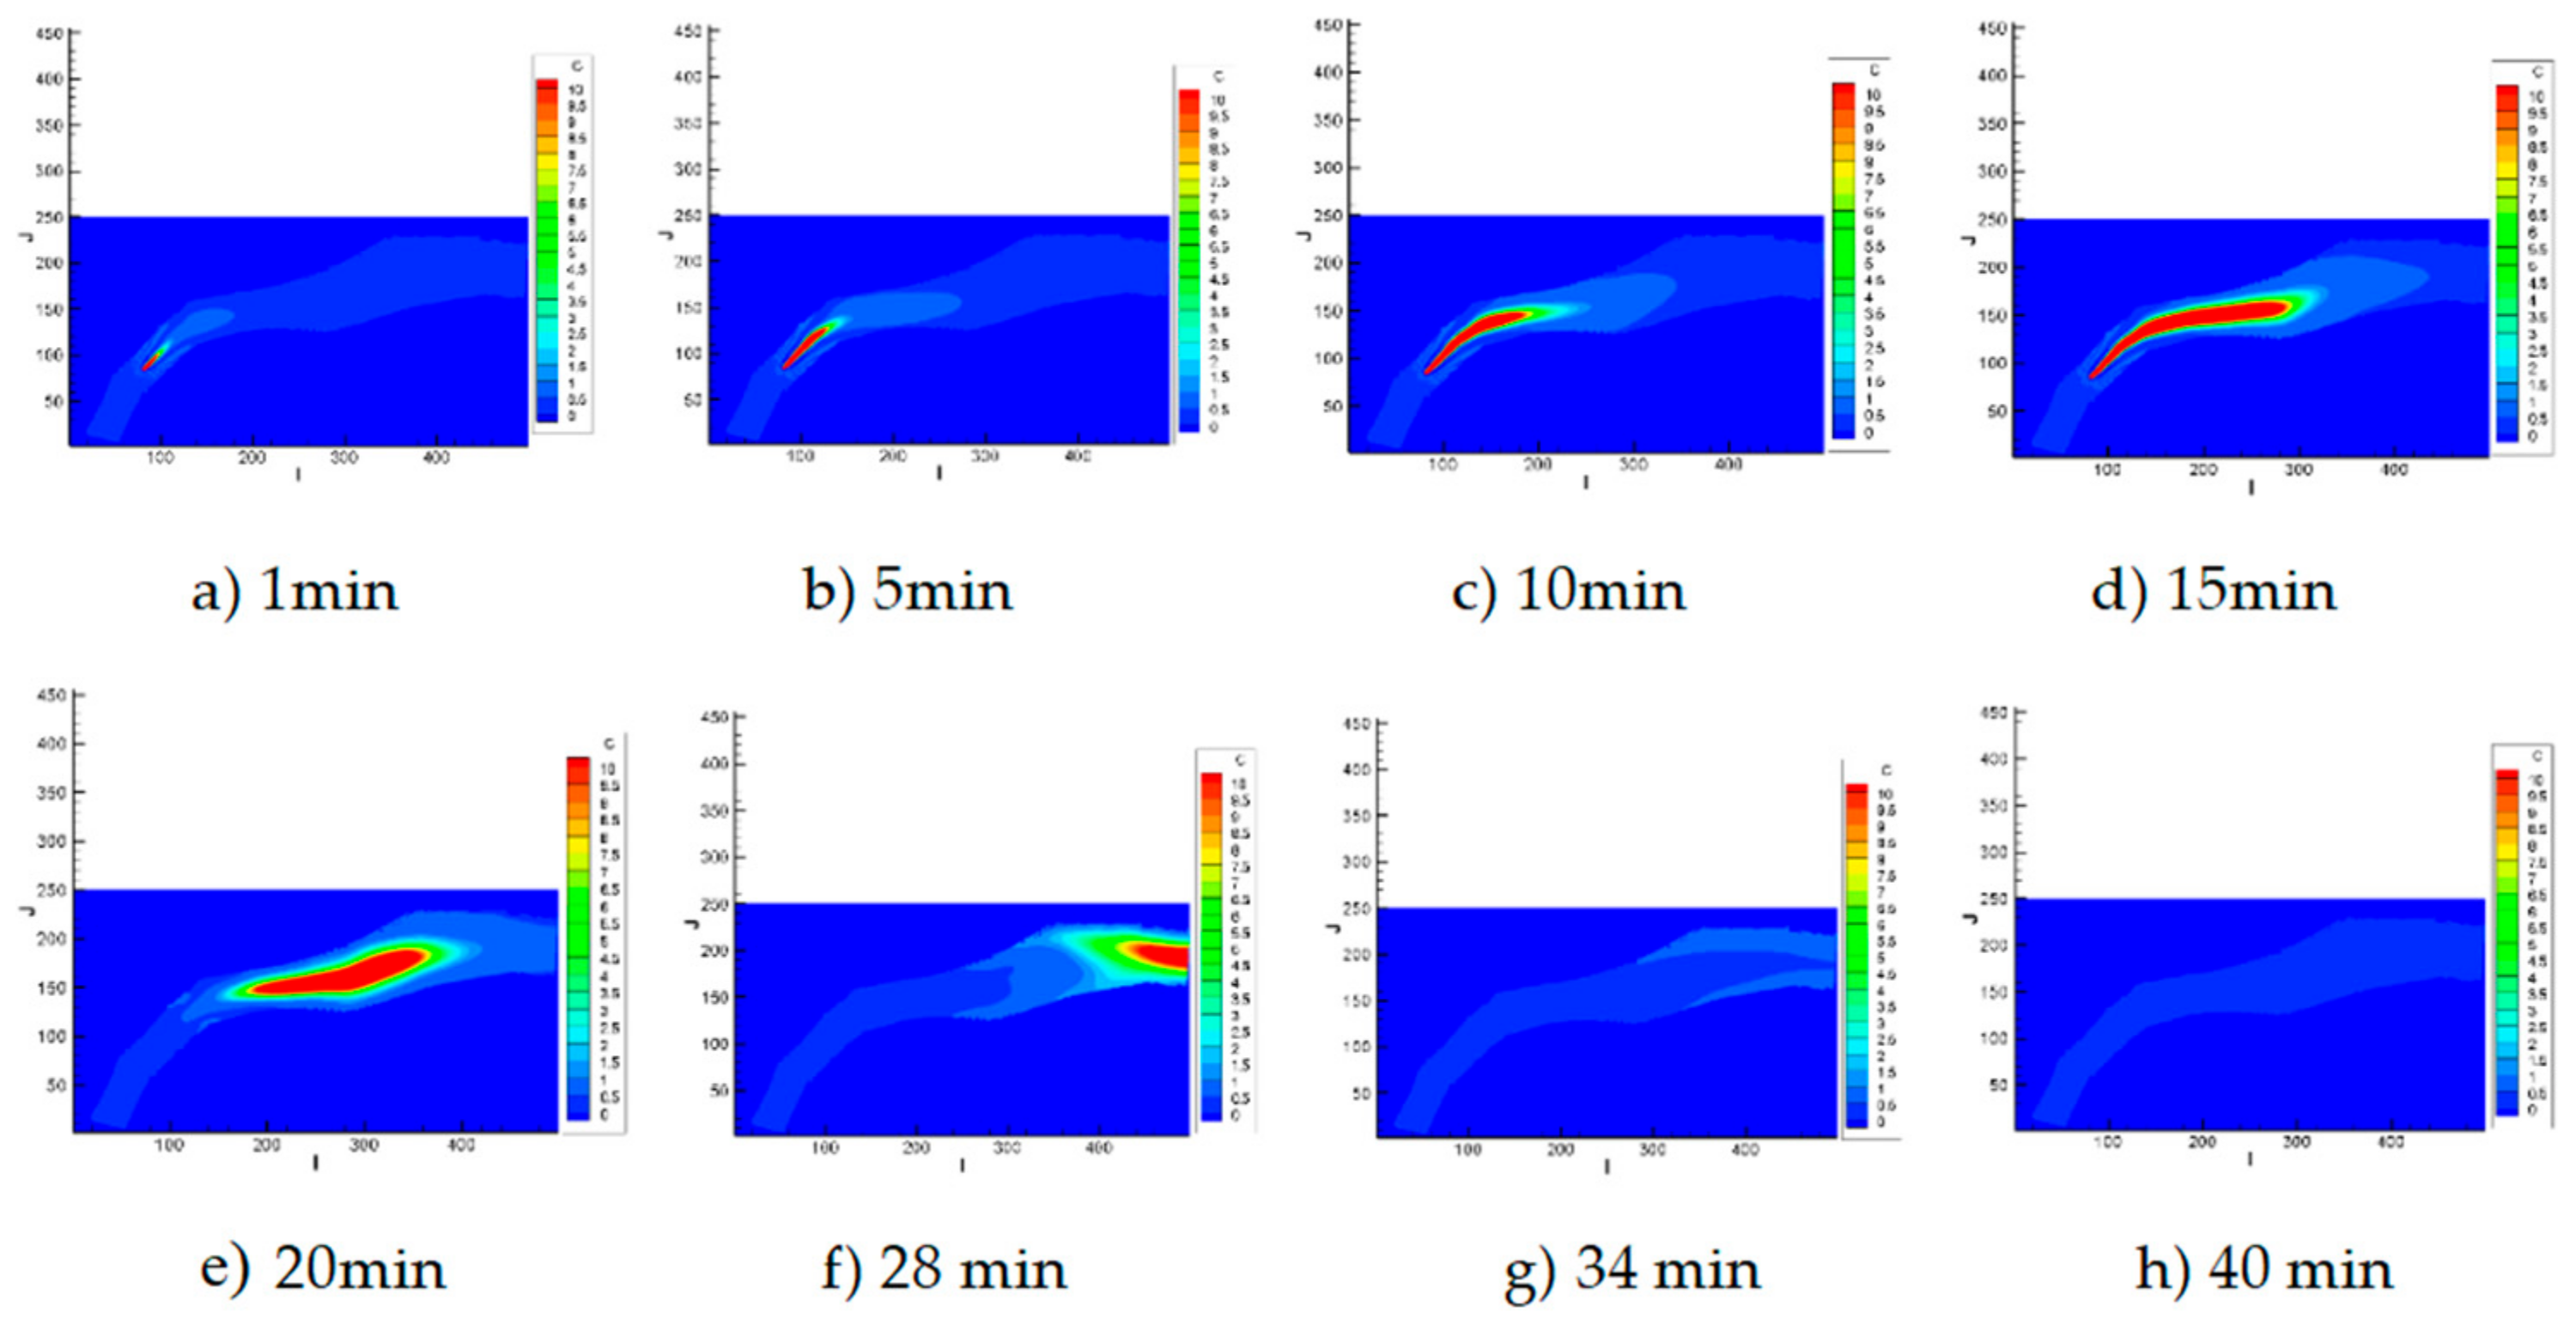
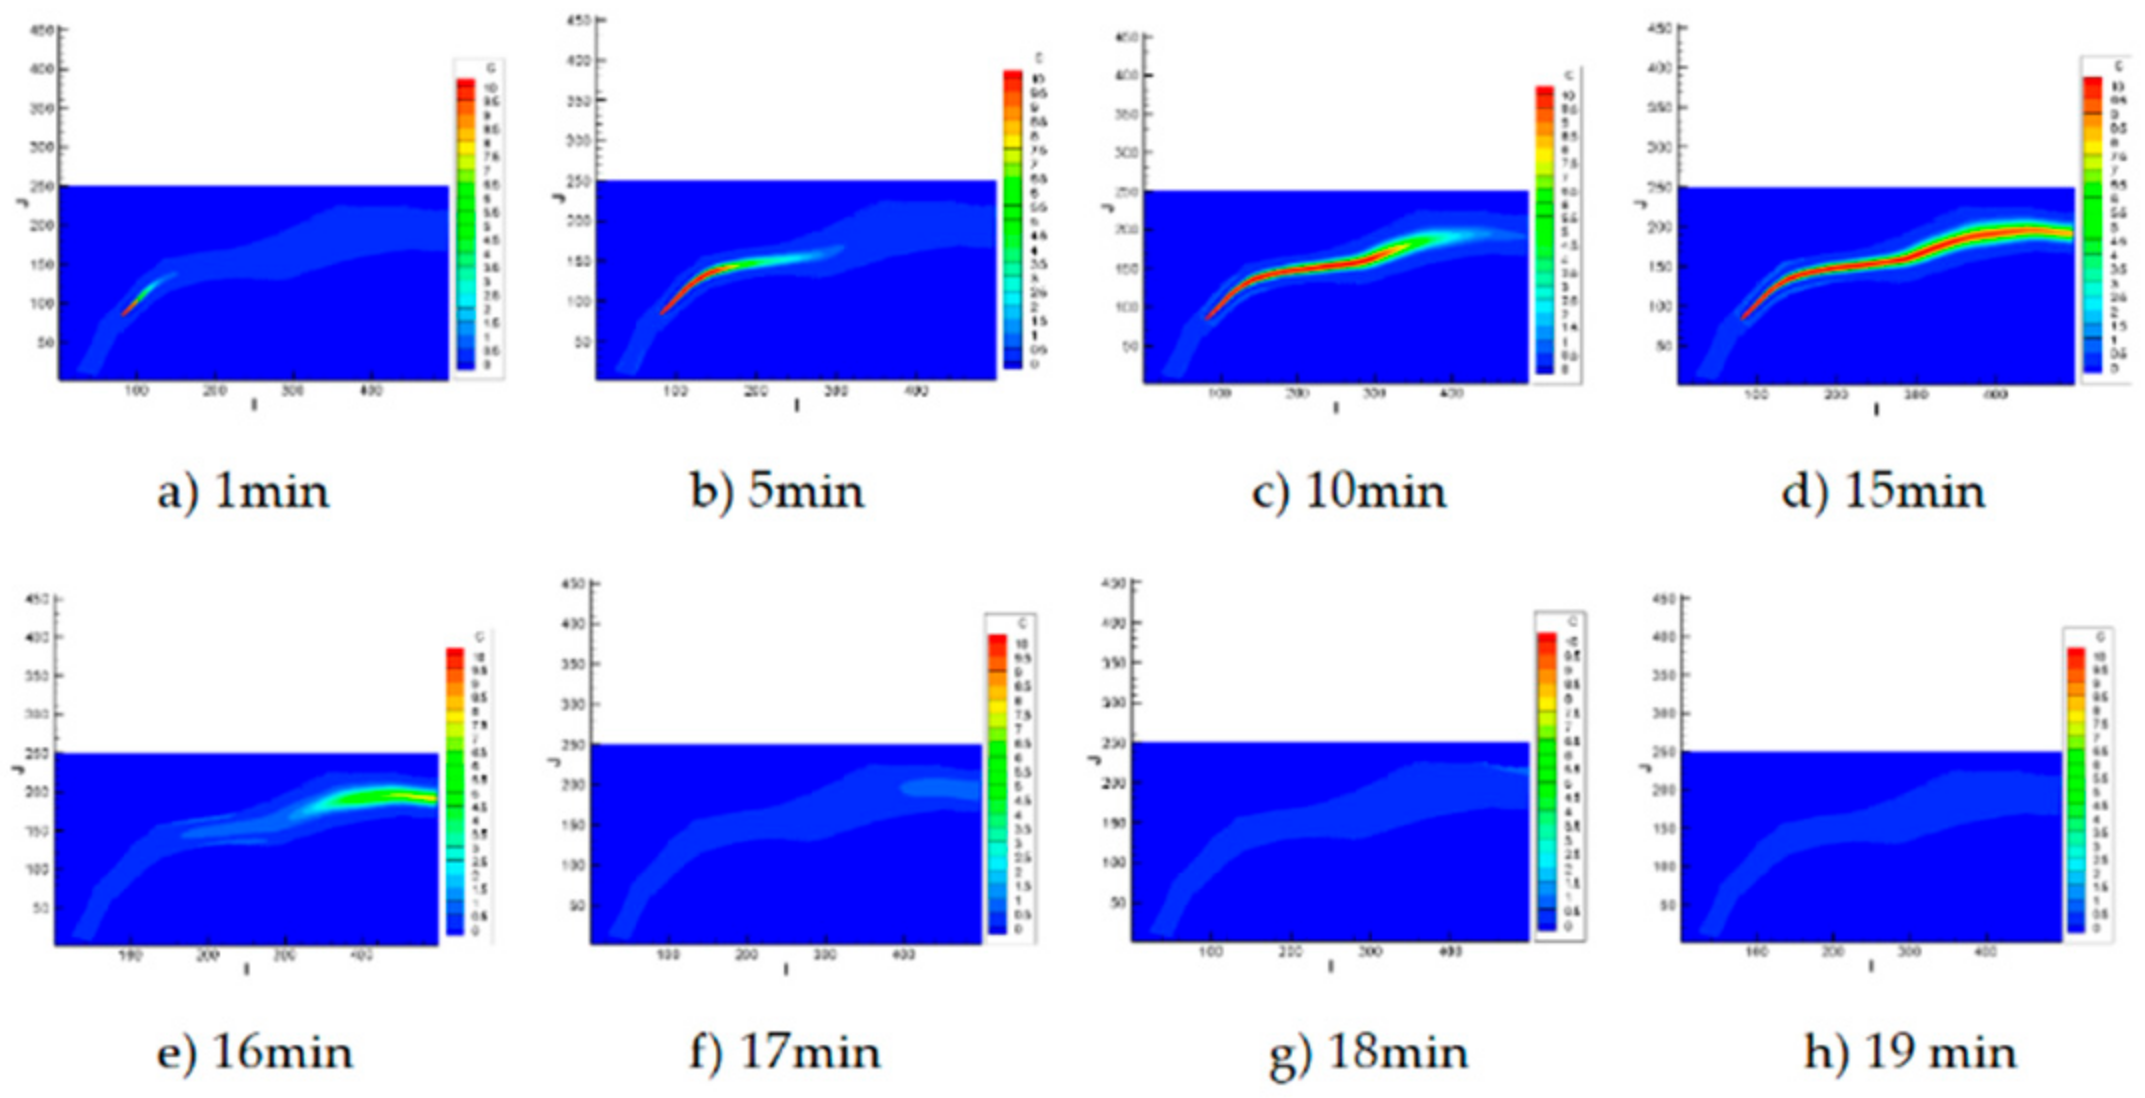
4.1. Spatiotemporal Variation of Ammonia Nitrogen Pollutant in Dry Period

As the HJDWSA is a protection zone, the standard is that the concentration of ammonia nitrogen in the whole water source area should be no more than 0.5 mg/L. Moreover, the water quality of the HJDWSA reached the standard for drinking water quality, and the initial concentration of the reservoir (Chongqing section) was 0.5 mg/L. Therefore, this study believes that the “acceptable” standard for the impact of the accident is when “the maximum concentration of water source is not more than 0.5 mg/L.” It can be seen that the excess duration of ammonia nitrogen caused by the accident in the water source during the dry period was 40 min—that is, the concentration of ammonia nitrogen in the whole water source decreased to the standard value within 40 min after the accident. The migration route of ammonia nitrogen pollutants in the dry period of HJDWSA after the accident is shown in Figure 4.
It can be seen that, in the continuous discharge stage of the pollution source, the maximum concentration was 162.32 mg/L, 170.08 mg/L, 170.89 mg/L, and 171.12 mg/L, respectively, 1, 5, 10, and 15 min after the accident. Once pollution occurs, pollutants begin to spread from the accident site to the surrounding area, so the concentration of ammonia nitrogen at the pollutant outlet is the highest. After the discharge of pollution sources was stopped, 20, 28, 34, and 40 min after the accident were selected as the research objects. The maximum concentration was 21.33 mg/L, 14.77 mg/L, 1.75 mg/L, and 0.5 mg/L, respectively. The position of high concentration was located in the middle of the river along with the migration of water flow. It can be found that, before the end of the discharge of the source, the maximum concentration of ammonia nitrogen pollutant increased because it was continuously discharged into the water body.

4.2. Spatiotemporal Variation of Ammonia Nitrogen Pollutant in Flow Period

The migration route of the ammonia nitrogen pollutant in the falling period is shown in Figure 5. This means that 25 min after the accident, the concentration of ammonia nitrogen in the whole water source fell to the standard value. It can be seen that the duration of excess ammonia nitrogen caused by accident in water source was 25 min during the extinction period. 18, 21, 23, and 25 min after the accident were predicted in the fluctuation period.
As can be seen, in the continuous phase emission sources, 1, 5, 10, and 15 min after the accident, the maximum concentration of pollution were 118.79 mg/L, 121.99 mg/L, 122.05 mg/L, and 122.28 mg/L. The maximum concentrations were 16.04 mg/L, 10.80 mg/L, 0.92 mg/L, and 0.5 mg/L, respectively, 18, 21, 23 and 25 min after stopping the pollution sources. With the migration of the water, its high concentration area is located in the middle of the river.
It can be seen that the diffusion range of ammonia nitrogen pollutant gradually increases with time, and the pollutant diffuse laterally downstream, diffusing longitudinally to both banks, and the distribution of pollutants forms a layered structure. Compared with the dry period, the ammonia flow rate is shorter than the dry period, so the ammonia nitrogen pollutant was shorter in the flow period, and the maximum concentration of pollutants is lower than the dry season.

4.3. Spatiotemporal Variation of Ammonia Nitrogen Pollutant in Flood Period

The temporal and spatial variation of ammonia nitrogen pollutants in the flood season is shown in Figure 6. It can be seen that the concentration of ammonia nitrogen in the whole water source dropped to the standard value 19 min after the accident.
In the continuous discharge stage of pollution sources, the maximum concentrations of pollution sources were 66.62 mg/L, 65.91 mg/L, 61.99 mg/L, and 61.51 mg/L within 1, 5, 10, and 15 min after the accident. The concentration of ammonia nitrogen in the discharge of pollution sources is the highest. The maximum concentrations were 8.10mg/L, 3.68 mg/L, 0.95 mg/L and 0.5 mg/L, respectively, 16, 17, 18 and 19 min after the discharge of pollution sources was stopped. As the water flows, the high concentration zone is located in the middle of the river.
Different from the dry period and the flow period, in the continuous discharge stage, the maximum concentration of ammonia nitrogen pollutants decreases slightly with time due to the fact that the water flow rate in the flood season is much higher than that in the dry period. Moreover, ammonia nitrogen pollutant migrates downstream with the flow, and the faster the flow, the faster the migration speed. Therefore, in the flood season, the water source reaches the standard value faster than the other three water periods

4.4. Spatiotemporal Variation of Ammonia Nitrogen Pollutant in Storage Period

The spatial and temporal changes of ammonia nitrogen pollutants during the storage period of HJDWSA are shown in Figure 7. They show that 22 min after the accident, the ammonia nitrogen concentration of the entire water source dropped to the standard value.
During the continuous discharge stage of pollution sources, the maximum concentrations of pollution sources were 77.12 mg/L, 85.45 mg/L, 85.87 mg/L, and 86.01 mg/L, respectively, within 1, 5, 10, and 15 min after the accident. After the discharge of the pollution source stopped, the accidents were selected for 18, 20, 21 and 22 min as the research object. The maximum concentrations were 10.39 mg/L, 4.56 mg/L, 1.51 mg/L, and 0.5 mg/L, respectively. With the migration of water, the concentration of ammonia nitrogen in the middle of the river is the highest.
As with the other three water periods, the maximum concentration of ammonia nitrogen contaminants remains at the origin of the accident, and the concentration of the river core is still the highest after the source has stopped discharging. When ammonia nitrogen pollutants spread to the riverbank, the diffusion speed is slowed down, so the concentration in the center of the river was higher than that on both sides. Comprehensive case of four water view, the highest migration speed of pollutants appeared in the flood period, while the lowest was in the dry period. This indicated that different hydrological periods have different degrees of influence on the diffusion of pollutants.

5. Conclusions

This study established a security system for drinking water sources in the Three Gorges Reservoir area. This system is based on the TEPLOT simulation platform of FOTRAN language, using a two-dimensional water quality monitoring model. The two-dimensional water quality monitoring model was used to analyze a hypothetical ammonia nitrogen pollution accident under the flow rate of the drinking water source area of Huangjuedu. This system was used to simulate the concentration and spatiotemporal variation of ammonia nitrogen pollutants. In this research, we simulated the migration and diffusion process of ammonia nitrogen pollutant in the drinking water source area during four water phases of the year, revealing the temporal and spatial changes of ammonia nitrogen.
The results show that the system can not only predict the impact of accidents on the water source but can also simulate the diffusion processes of pollutants in the study area, including pollution duration and pollutant concentration. Furthermore, the results showed that the security platform was visual, feasible, and scientific. According to the simulation results, from the longitudinal diffusion results of ammonia nitrogen pollutants in the water source area, we can see that there are four water periods—flood period, storage period, falling period, and dry period. The pollutants took 19, 22, 25, and 40 min to reach the water quality standard. In other words, different hydrological cycles affect the migration and transformation process of ammonia nitrogen pollutants after pollution accidents. At the continuous discharge stage, the concentration of ammonia nitrogen at the discharge point is the highest. The concentration in the river center is the highest after the discharge of pollution sources is stopped. According to the comprehensive situation of the four water periods, the pollutant migration velocity was the highest in flood period and the lowest in dry period. The results show that different hydrological cycles have different effects on the diffusion of pollutants, and the higher the water flow velocity, the less time it takes for the quality of the water source to reach the standard value.
This research developed a useful system for Three Gorges Reservoir region, which provides a tool users and managers can easily understand the influence process of accident on water source through. In addition, it also provides a reference for managers to carry out emergency work after water pollution accidents. However, there are still some areas for improvement in this study In the future, the influence of meteorological conditions on pollutant migration and ammonia nitrogen volatilization in water will be further considered.

Author Contributions

Formal analysis: X.D.; resources: X.D. and X.T.; investigation: X.T. and Q.Z.; data curation: X.T.; software, A.Z.; writing—original draft: X.D.; writing—review and editing: X.T.

Funding

This research was supported by the National Key R&D Program of China (2017YFC0404503) and the National Natural Science foundation of China (41601529).

Acknowledgments

We are very grateful to the National Key R&D Program of China (2017YFC0404503) and the National Natural Science foundation of China (41601529). The authors gratefully acknowledge the financial support of the programs and agencies.

Conflicts of Interest

The authors declare no conflicts of interest.

References

  1. Wang, X.; Wang, Z.; Yang, W.T.; Xi, X.; Shi, L.; Dong, W. Shortage of Water Resources in China and Countermeasures. J. Environ. Eng. 2014, 32, 1–5. [Google Scholar]
  2. Liu, R.Z.; Zhang, K.; Zhang, Z.J.; Borthwick, A.G.L. Water-Scale Environmental Risk Assessment of Accident Water Pollution: The Case of Laoguan River, China. J. Environ. Inform. 2018, 31, 87–96. [Google Scholar]
  3. Wantzen, M.K.; Alves, C.B.; Badiane, S.D. Urban Stream and Wetland Restoration in the Global South—A DPSIR Analysis. J. Sustain. 2019, 11, 49–75. [Google Scholar]
  4. Ren, Y.H.; Xiao, Y.T. Construction of emergency system for sudden water pollution accident. J. Environ. Sci. Manag. 2007, 32, 10–13. [Google Scholar]
  5. Boryczko, K.; Bartoszek, L.; Koszelnik, P.; Rak, J.R. A new concept for risk analysis relating to the degradation of water reservoirs. J. Environ. Sci. Pollut. R 2018, 25, 25591–25599. [Google Scholar] [CrossRef] [PubMed] [Green Version]
  6. Hou, J.; Hu, F.P. Emergency treatment of sudden water pollution accident. J. Jiangxi Chem. 2009, 9, 49–51. [Google Scholar]
  7. Tao, Y.; Ren, H.T.; Xia, J.X. Investigation on disposal effect of different countermeasure of sudden water pollution accident. J. Basic Sci. Eng. 2013, 21, 203–213. [Google Scholar]
  8. Zheng, H.Z.; Lei, X.H.; Shang, Y.Z. Sudden Water Pollution Accidents and Reservoir Emergency Operations: Impact Analysis at Danjiangkou Reservoir. J. Environ. Technol. 2018, 39, 787–803. [Google Scholar] [CrossRef]
  9. Lin, L.; Li, C.; Yang, W.J.; Zhao, L.Y.; Liu, M.; Li, Q.Y.; Crittenden, J.C. Spatial variations and periodic changes in heavy metals in surface water and sediments of the Three Gorges Reservoir, China. J. Chemosphere 2020, 240, 124837. [Google Scholar] [CrossRef]
  10. Khaiter, P.A.; Erechtchoukova, M.G. Conceptualizing an Environmental Software Modeling Framework for Sustainable Management Using UML. J. Environ. Inform. 2019, 34, 123–138. [Google Scholar] [CrossRef]
  11. Zhang, B.; Qin, Y.; Hao, Q.T. A temporal-spatial simulation and dynamic regulation system of water quality on sudden water pollution accidents. J. Wuhan Univ. 2013, 38, 1108–1112. [Google Scholar] [CrossRef]
  12. Zhang, B.; Qin, Y.; Huang, M.X. SD-GIS-based temporal-spatial simulation of water quality in sudden water pollution accidents J. Comput. Geosci. 2011, 37, 874–882. [Google Scholar] [CrossRef]
  13. Slaughter, A.R. Simulating Microbial Water Quality in Data-Scarce Catchments: An Update of the WQSAM Model to Simulate the Fate of Escherichia coli. Water Resour. Manag. 2017, 31, 4239–4252. [Google Scholar] [CrossRef]
  14. Hu, J.; Sun, L.; Li, C.H.; Wang, X.; Jia, X.L.; Cai, Y.P. Water Quality Risk Assessment for the Laoguanhe River of China Using a Stochastic Simulation Method. J. Environ. Inform. 2018, 31, 123–136. [Google Scholar] [CrossRef]
  15. Lu, D.L.; Li, K.Q.; Liang, S.K.; Lin, G.H.; Wang, X.L. A coastal three-dimensional water quality model of nitrogen in Jiaozhou Bay linking field experiments with modelling. J. Mar. Pollut. Bull. 2017, 114, 53–63. [Google Scholar] [CrossRef] [PubMed]
  16. Chen, Z.; Zhu, Z.; Yin, L. The Changing Water Quality Characteristics from Urban Drinking Water Sources in Guangdong, China. Water Resour. Manag. 2015, 29, 987–1002. [Google Scholar] [CrossRef]
  17. Malagó, A.; Vigiak, O.; Bouraoui, F.; Pagliero, L.; Franchini, M. The Hillslope Length Impact on SWAT Streamflow Prediction in Large Basins. J. Environ. Inform. 2018, 32, 82–97. [Google Scholar] [CrossRef] [Green Version]
  18. Chorin, A.J. Numerical solution of the Navier-Stokes equations. J. Am. Math. Comput. 1968, 22, 745–762. [Google Scholar] [CrossRef]
  19. Patanker, S.V.; Splding, D.B.A. Calculation procedure for heat, mass and momentum transfer in three dimensional parabloic flow. Int. J. Heat Mass Transf. 1972, 15, 1787–1806. [Google Scholar] [CrossRef]
  20. Sheng, Y.; Zhang, T.; Jiang, Z.Z. A stabilized finite volume method for the stationary navier–stokes equations Chaos Solitons and Fractals the Interdisciplinary. J. Nonlinear Sci. Nonequilib. Complex Phenom. 2016, 89, 363–372. [Google Scholar]
  21. Ding, X.W.; Zhu, Q.; Zhai, A.F.; Liu, L. Water quality safety prediction model for drinking water source areas in Three Gorges Reservoir and its application. J. Ecol. Indic. 2019, 101, 734–741. [Google Scholar] [CrossRef]
  22. Ding, X.W.; Wang, S.Y.; Jiang, G.H. A simulation program on change trend of pollutant concentration under water pollution accidents and its application in Heshangshan drinking water source area. J. Clean. Prod. 2017, 167, 326–336. [Google Scholar] [CrossRef]
  23. Nematian, J. An Extended Two-stage Stochastic Programming Approach for Water Resources Management under Uncertainty. J. Environ. Inform. 2016, 27, 72–84. [Google Scholar] [CrossRef]
  24. Ding, X.W.; Fang, P. Accident Trend Prediction of Heavy Metal Pollution in the Heshangshan Drinking Water Source Area Based on Integrating a Two-Dimensional Water Quality Model and GIS. J. Sustain. 2019, 11, 3998. [Google Scholar] [CrossRef] [Green Version]
  25. Versteeg, H.K.; Malalasekera, W. An Introduction to Computational Fluid Dynamics: The Finite Volume Method; Pearson Prentice Hall: New York, NY, USA, 1995; pp. 157–167. [Google Scholar]
  26. Blosch, E.; Shyy, W.; Smith, R. The role of mass conservation in pressure-based algorithm. Numer. Heat Transf. 1993, 24, 415–429. [Google Scholar] [CrossRef]
  27. Salma, T. A combined treatment method of novel Mass Bio System and ion exchange for the removal of ammonia nitrogen from micro-polluted water bodies. J. Chem. Eng. J. 2019, 378, 122217. [Google Scholar]
  28. Zhang, Y.J.; Zhang, Y.H.; Wang, L.J. Application of Emergency Water Environment Risk Area Partitioning in the Three Gorges Reservoir Environmental. J. Sci. Technol. 2015, 32, 15–21. [Google Scholar]
  29. Fu, J.C.; Hsu, M.H.; Duan, Y. Development of roughness updating based on artificial neural network in a river hydraulic model for flash flood forecasting. J. Earth Syst. Sci. 2016, 125, 1–14. [Google Scholar] [CrossRef] [Green Version]
  30. Qu, Z.G.; Tao, W.Q.; He, Y.L. Implementation of CLEAR Algorithm on Collocated Grid System and Application Examples. Numer. Heat Transf. 2004, 1, 65–96. [Google Scholar] [CrossRef]
  31. Zhang, Y.Y.; Xia, J. Study on optimal water and water quality scheduling model of sluice dam based on SWAT model. J. Hydroelectr. 2010, 29, 159–164. [Google Scholar]
  32. Brown, R.T. A Two-Dimensional Reservoir Water Quality Model: User’s Guide R. In Center for the Management, Utilization, and Protection of Water Resources; Tennessee Technological University: Cookeville, TN, USA, 1985. [Google Scholar]
  33. Chen, B.; Li, P.; Wu, H.J.; Husain, T.; Khan, F. MCFP: A Monte Carlo Simulation-based Fuzzy Programming Approach for Optimization under Dual Uncertainties of Possibility and Continuous Probability. J. Environ. Inform. 2017, 29, 88–97. [Google Scholar] [CrossRef]
  34. Zheng, M.S.; Ma, L.K.; Li, T.H.; Huang, R. Rapid Assessment Method for Eco-water Deficit in Catchments. J. Environ. Inform. 2017, 30, 149–160. [Google Scholar] [CrossRef]
  35. Morar, F.; Iantovics, L.B.; Gligor, A. Analysis of Phytoremediation Potential of Crop Plants in Industrial Heavy Metal Contaminated Soil in the Upper Mures River Basin. J. Environ. Inform. 2018, 31, 1–14. [Google Scholar]
Figure 1. The geographical location map of the Huangjuedu Drinking Water Source area (HJDWSA).
Sustainability 11 07074 g001
Figure 2. Daily flow and water level at hydrological stations in 2015.
Sustainability 11 07074 g002
Figure 3. Check chart of simulated and observed values of ammonia concentration.
Sustainability 11 07074 g003
Figure 4. Spatial and temporal distribution of ammonia concentration in dry period after the accident occurred.
Sustainability 11 07074 g004
Figure 5. Spatial and temporal distribution of ammonia concentration in flow period after the accident occurred.
Sustainability 11 07074 g005
Figure 6. Spatial and temporal distribution of ammonia concentration in flood period after the accident occurred.
Sustainability 11 07074 g006
Figure 7. Spatial and temporal distribution of ammonia concentration in storage period after the accident occurred.
Sustainability 11 07074 g007
Table 1. List of equation discrete coefficients.
Continuity EquationMomentum EquationWater Quality Equation
ϕ z u vc
α P α E + α W + α N + α S ( α E + α W + α N + α S + α P 0 S p Δ x Δ y ) / α
α E d ¯ e h e Δ y D e A P e + F e , 0
α w d ¯ w h w Δ y D w A P w + F w , 0
α N d ¯ n h n Δ x D n A P n + F n , 0
α S d ¯ s h s Δ x D S A P S + F S , 0
b u e * h e Δ y + u w * h w Δ y v n * h n Δ x + v s * h s Δ x + h p 0 h p * Δ x Δ y / Δ t + q Δ x Δ y S c Δ x Δ y + ϕ p 0 α p 0 + 1 α / α α p u p *
α p 0 h p 0 Δ x Δ y / Δ t
D e ε x h e Δ y / Δ x
P e F e / D e
S p g n 2 u 2 + v 2 / h 1 / 3 q K H
S c g h Z e Z w / Δ x c 0 H
u e * α n b u n b + b / α P e + g h Δ y / α P e Z P Z E
d ¯ e Δ y / α P P δ x e + / δ x e + Δ y / α p E δ x e / δ x e

