Article

Response of Anatidae Abundance to Environmental Factors in the Middle and Lower Yangtze River Floodplain, China

1
School of Life Sciences, University of Science and Technology of China, Hefei 230026, China
2
Co-Innovation Center for Sustainable Forestry in Southern China, College of Biology and the Environment, Nanjing Forestry University, Nanjing 210037, China
3
State Key Laboratory of Urban and Regional Ecology, Research Center for Eco-Environmental Sciences, Chinese Academy of Sciences, Beijing 100085, China
4
College of Resources and Environment, University of Chinese Academy of Sciences, Beijing 100049, China
*
Authors to whom correspondence should be addressed.
Sustainability 2019, 11(23), 6814; https://doi.org/10.3390/su11236814
Submission received: 2 September 2019 / Revised: 23 November 2019 / Accepted: 25 November 2019 / Published: 1 December 2019
(This article belongs to the Section Sustainable Agriculture)

Abstract

:
Understanding and predicting animal distribution is one of the most elementary objectives in ecology and conservation biology. Various environmental factors, such as habitat area, habitat quality, and climatic factors, play important roles in shaping animal distribution. However, the mechanism underlying animal distribution remains unclear. Using generalized additive mixed models, we analyzed the effects of environmental factors and years on the population of five Anatidae species: Tundra swan, swan goose, bean goose, greater and lesser white-fronted goose, across their wintering grounds along the Middle and Lower Yangtze River floodplain (MLYRF) during 2001–2016. We found that: (1) All populations decreased except for that of the bean goose. (2) The patch area was not included in any of the best models. (3) NDVI was the most important factor in determining the abundance of grazing geese. (4) Climatic factors had no significant effect on the species in question. Our results suggest that, when compared to habitat area, habitat quality is better in predicting Anatidae distribution on the basin scale. Thus, to better conserve wintering Anatidae, we should keep a sufficiently large area at the single lake, as well as high quality habitat over the whole basin. This might be achieved by developing a more strategic water plan for the MLYRF.

1. Introduction

Understanding and predicting animal distribution is one of the most elementary objectives in ecology and conservation biology. The animal distribution could be affected by various environmental factors, such as habitat area, habitat quality and climatic factors [1]. Despite endeavors to unravel such a fundamental problem during past decades, it still remains not fully understood. Changes in species abundance and distribution might be driven rapidly by local or global environmental changes [2,3], so addressing which is the main driver of species changes at multiple spatial scales is critical for taking conservation measures.
Eastern China is one of the most important wintering regions for migratory waterbirds, supporting over two million individuals, including more than one million Anatidae [4,5]. About 80% of these Anatidae winter within the wetlands in the Middle and Lower Yangtze River floodplain (MLYRF) [5]. However, the Anatidae population size has been declining continuously in this area [5,6]. Understanding how environmental factors affect animal population changes at large tempo-spatial scales, as shown for Anatidae in the MLYRF, is crucial for their conservation [7]. Some case studies have found that habitat area and quality play an important role in determining waterbird distribution in the MLYRF. Zhang et al. demonstrated that a larger patch area concentrated the larger number of grazing Anatidae at Shengjin Lake [8]. Guan et al. found a positive effect of habitat quality (including winter season vegetation index, habitat area and topographic wetness index) on geese density at Dongting Lake [9]. However, all these studies were conducted for one individual lake, and few studies were conducted at larger tempo-spatial scales within the MLYRF [10]. Such a comprehensive study is urgently needed.
The individual–area relationship, which describes the relationship between population density and patch area, has been successfully used to explain the distribution of Anatidae populations in wetland [8]. In MLYRF, grazing Anatidae mainly feed on recessional meadows after the drawdown of the water level, and tuber-feeding birds mainly forage on tubers of submerged macrophytes during wintering season [11,12]. Thus, we expect positive correlations between land/water area and Anatidae populations. As suggested by optimal foraging theory [13,14,15], food quantity and habitat heterogeneity could determine Anatidae distribution through forage intake limitations. As difficulties in handling long leaves and in locating bites with increasing biomass, the intake rate of Anatidae follows a bell-shaped curve with increasing food quantity, which maximizes at the intermediate biomass [15,16]. Habitat heterogeneity, such as the spatial variance of vegetation biomass or structure, generally increases the time needed to search for and handle food, thus, negatively affecting individual intake rates [17,18]. In addition, according to the allometry scaling law, the effects of food quantity and habitat heterogeneity would also differ among species with different body sizes [15,16,19].
Besides habitat, the distribution of birds can be affected by climatic factors, such as temperature and precipitation [20]. For example, a warmer climate is preferred by wintering birds, as more energy is consumed to compensate for colder ambient temperatures [21]. Precipitation is positively correlated with primary productivity within wetlands, which favors herbivores [22]. A high water level disfavors birds, such as tuber-feeders because a higher water level denies them access to the food hidden under the water [23].
In recent years, more and more ornithologists prefer to use contemporary statistical methods, such as generalized additive model. Zenzal et al. used generalized additive mixed model (GAMM) to investigate hummingbird migration across years [24]. La Sorte et al. used GAMM to investigate how land-use change affect avian species [25]. Wen et al. used GAMM to analyze the effects of climate and hydrology on waterbird population dynamics [2].
In this research, we aimed to investigate relationships between the environmental variables and population sizes of five Anatidae species in four key wintering areas in the MLYRF during 2001–2016: Tundra swan Cygnus columbianus, swan goose Anser cygnoides, bean goose A. fabalis, greater white-fronted goose A. albifrons and lesser white-fronted goose A. erythropus. Tundra swan and swan goose mainly feed on tubers of Vallisneria spiralis [12], whereas, the latter three species graze on recessional grasslands in wintering areas.

2. Materials and Methods

2.1. Study Area

This study was conducted in 43 wetlands in four key wintering areas (Poyang Lake, Dongting Lake, Shengjin Lake and Anqing Lakes) in the MLYRG (see Figure 1 and supplementary materials Table S1). The total area of the 43 lakes is ca. 2800 km2. This region has a subtropical monsoon climate that produces a large variation in precipitation among seasons. Wetlands here are characterized by annual recharge from summer rainfall, followed by water level recession in winter, which provides habitats for hundreds of thousands of wintering waterbirds.
Poyang Lakes, which are located in Jiangxi Province 28°24′–29°46′ N, 115°49′–116°46′ E), maintain a direct connection with the Yangtze River, which has a naturally fluctuating water level. The submerged area in the wet season (July to September, ca. 3600 km2) can be more than two times that in the dry season (November to February, ca. 1500 km2) [26]. This variation caused by water level fluctuation produces many types of habitats, such as ephemeral grasslands and mudflats.
Dongting Lakes lie in Hunan Province (28°44′–29°35′ N, 111°53′–113°05′ E), with an annual seasonal water level fluctuation up to 18 m (the variation between maximal and minimal water level). Similar to the Poyang Lakes, the water level fluctuation has not been disturbed in Dongting Lakes, so various habitat types are formed, such as marshes and mudflats. However, the construction of Three Gorges Dam may have prolonged the drought period in Dongting Lakes, since its operation in 2003 [27].
Shengjin Lake and Anqing Lakes are in Anhui Province (29°50′–30°58′ N, 116°07′–117°44′ E). These lakes are much smaller (the biggest is Huangda Lake with an area of ca. 270 km2) and lost their direct connection to the Yangtze River during the 1960s. Due to the different types of management at different lakes, various types of habitats exist as different lakes, such as recessional meadows in Shengjin Lake, and mudflats in Baidang Lake and Caizi Lake.

2.2. Census Data

Census data for the five studied Anatidae species were obtained from systematic surveys of these four areas. Wintering waterbirds were counted systematically from 2001 to 2016 (supplementary materials Table S1). In all the surveys, the “look–see” [28] method was used to identify and count all present waterbirds. The observers mostly reached the counting spots by car or on foot. Boats were sometimes used. Large Anatidae (like the swans and geese considered in this study) usually form large flocks during the non-breeding season, allowing their easy identification and counting [29]. Surveys were conducted by staffs from the nature reserve and by the authors using the same survey methods. Multiple teams were made up, and there were at least one experienced observer to guide the survey. It took 5–20 days to complete surveys. See Barter et al. [30] for more details.

2.3. Environmental Data

We used Landsat Thematic Mapper (TM) and Enhanced Thematic Mapper Plus (ETM+) surface reflectance (SR) products to extract the habitat features that might potentially affect the waterbird abundance in these areas. The current SR products are provided by the Landsat ecosystem disturbance adaptive processing system (LEDAPS) with satisfying quality and consistency [31].
We selected images that were acquired around our survey dates with less than 10% cloud cover (supplementary materials Table S2). Before processing, we employed a gap-filling method based on local linear histogram [32] matching to remove duplicated data and correct the loss in the ETM+ images, due to the failure of the scan line corrector in 2003. Afterwards, we geometrically corrected each image with an accuracy of fewer than 0.5 pixels.
Before image processing, we delineated the boundaries for all concerned wetlands according to their natural and artificial landscapes (Figure 1). We then applied supported vector machines (SVMs) to discriminate between water and land within each boundary. SVMs are supervised non-parametric statistical learning techniques that can produce higher accuracy classifications, even without larger training data sets [33]. For each image, we visually selected training sets based on the contrasting differences between pixels containing land or water. All pixels within the study sites were classified as land or water. Patch areas of land or water were then calculated by counting the related pixels. The normalized difference vegetation index (NDVI) derived from the SR products was, thus, extracted from the land as a surrogate of food abundance. We calculated the coefficient of variation (CV) of the NDVI as an index of habitat heterogeneity. Images were processed in ENVI 5.0 (Harris Geospatial Solutions, Broomfield, CO, USA) and ArcGIS 10.2 (Environmental Systems Research Institute, Redlands, CA, USA). We obtained averaged temperature and accumulated precipitation in January for 2001–2016 from Chinese Meteorological Administration.

2.4. Statistical Analysis

We used generalized additive mixed models (GAMMs) to model the effects of the patch area, food quantity, habitat heterogeneity, and climatic factors on swans and geese abundance with the survey site as the random factor. The patch area used for grazers (bean goose and greater and lesser white-fronted goose) was the land area, whereas, that used for tuber-feeders (tundra swan and swan goose) was the water area. “Year” was also included to account for the possible temporal correlation of surveys among the years. Usually, the count data contains excess zero records. Poisson distribution is often used to model such count data, but provides poorer performance compared with zero-inflated Poisson or negative binomial models [34]. Thus, based on the diagnosis by Wen et al. [2], we determined the probability distribution function of our count data to be negative binomial type I (NBI) or II (NBII). The general GAMM formulation is as follows:
g ( E ( Y ) ) = α + i = 1 n f i ( X i ) ,
where g(·) is a link function (e.g., NBI or NBII). E(Y) is the expected value of response variable Y. Xi is the matrix of explanatory variables with f i (·) as the cubic spine (cs) smoothing functions, and α is a constant.
We then followed a stepwise model selection procedure (for the limitations of this approach see Whittingham et al. 2006 [35]), initiated from a full model, including all predictor variables. Since some research suggested that variables with a p-values slight larger than 0.05 also included some useful information when modeling, hence, here variables with p-values higher than 0.1, estimated by a Chi-Squared test, were, thus, omitted. Afterwards, the model was compared with the full model based on generalized Akaike information criterion (GAIC). If the new model has a lower GAIC than the full model, the variable is neglected in subsequent procedures [2]. The goodness of fit of the selected models was evaluated with the pseudo-coefficient of determination (R2), which was used as a surrogate for R2. All statistical analyses were conducted in R 3.2.4 [36] with the GAMLSS package [37].

3. Results

3.1. Population Trends

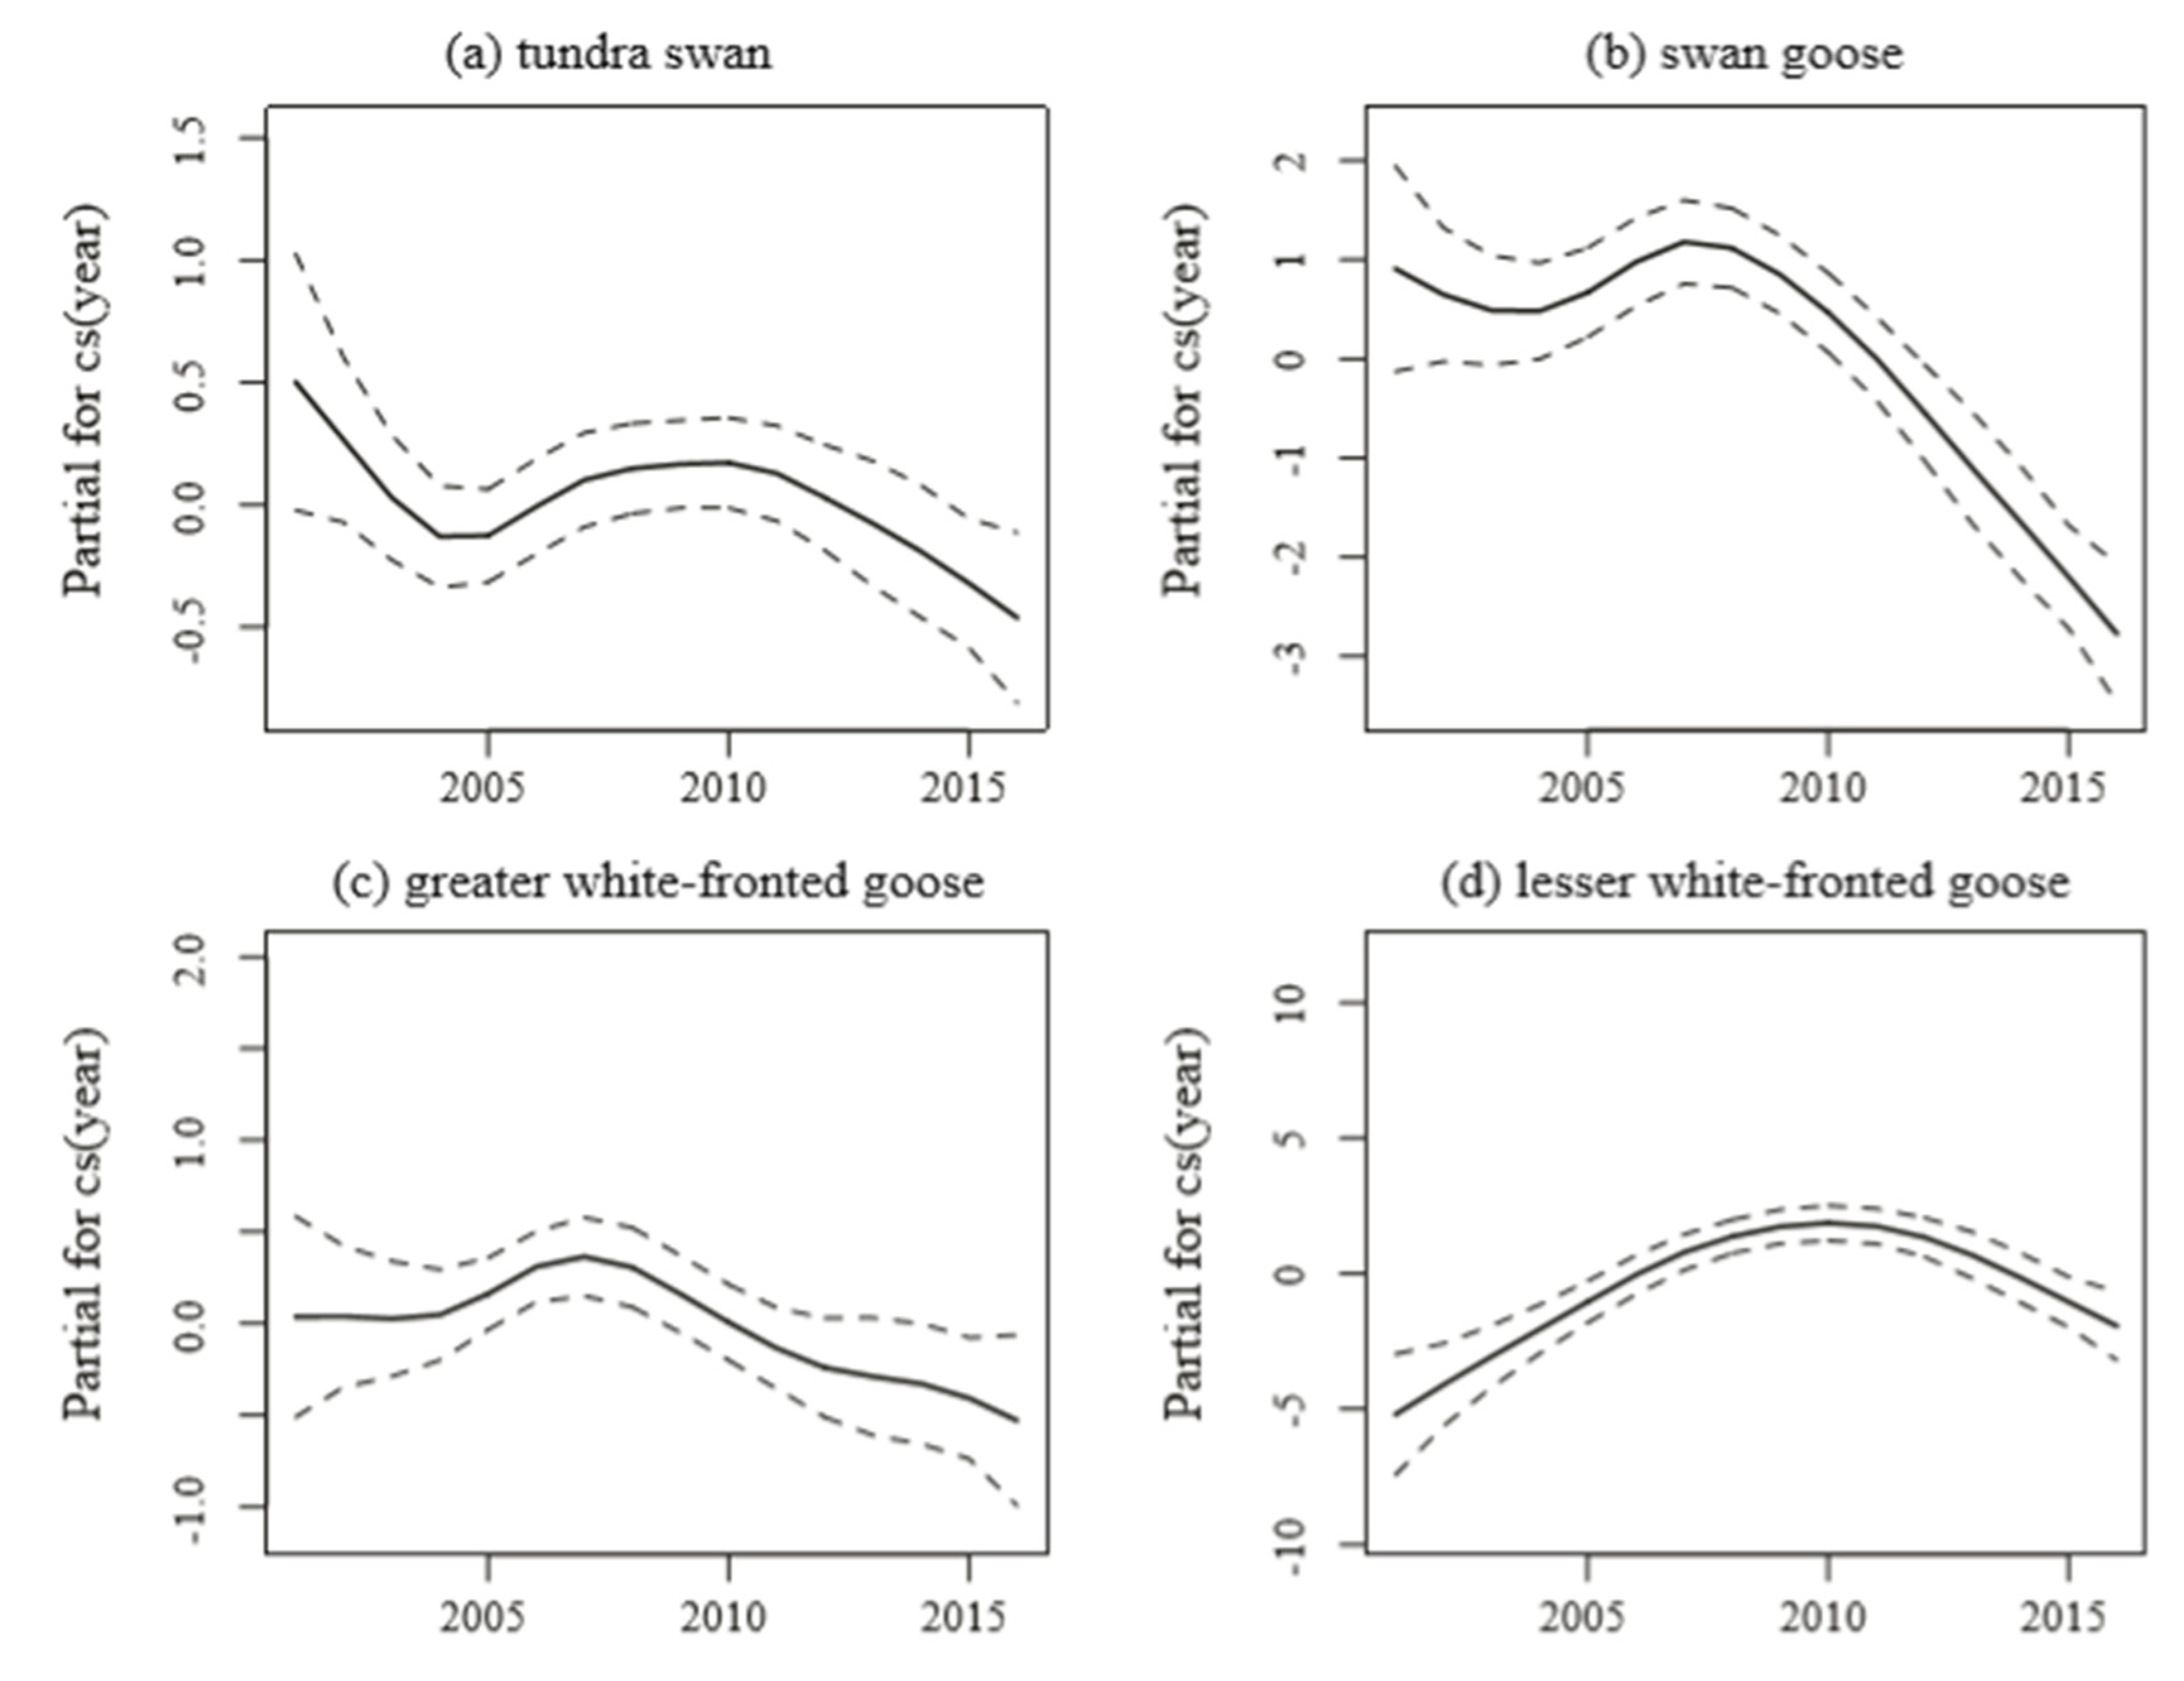
“Year” was included in all the best models except for bean goose. During 2001–2016 lesser white-fronted goose populations increased slightly (p < 0.05, Table 1) within the study area, while swan goose and greater white-fronted goose decreased (p < 0.05, see Table 1). Tundra swan tended to decrease as well, though the year effect did not reach statistical significance (p < 0.1, see Table 1).
For swan goose and greater white-fronted goose, the models showed the same pattern: The population size stopped decreasing around 2005, followed by a rise in 2006–2007, and then a sharper decline after 2007–2008 (Figure 2b,c). Tundra swan showed a similar trend, but compared with swan goose and greater white-fronted goose, tundra swan declined later, starting in 2010 (Figure 2a). The rate of decline was faster for swan goose (Table 1). The population of lesser white-fronted goose increased until 2010, then subsequently decreased (Figure 2d).

3.2. Impacts of Habitat-Related Variables

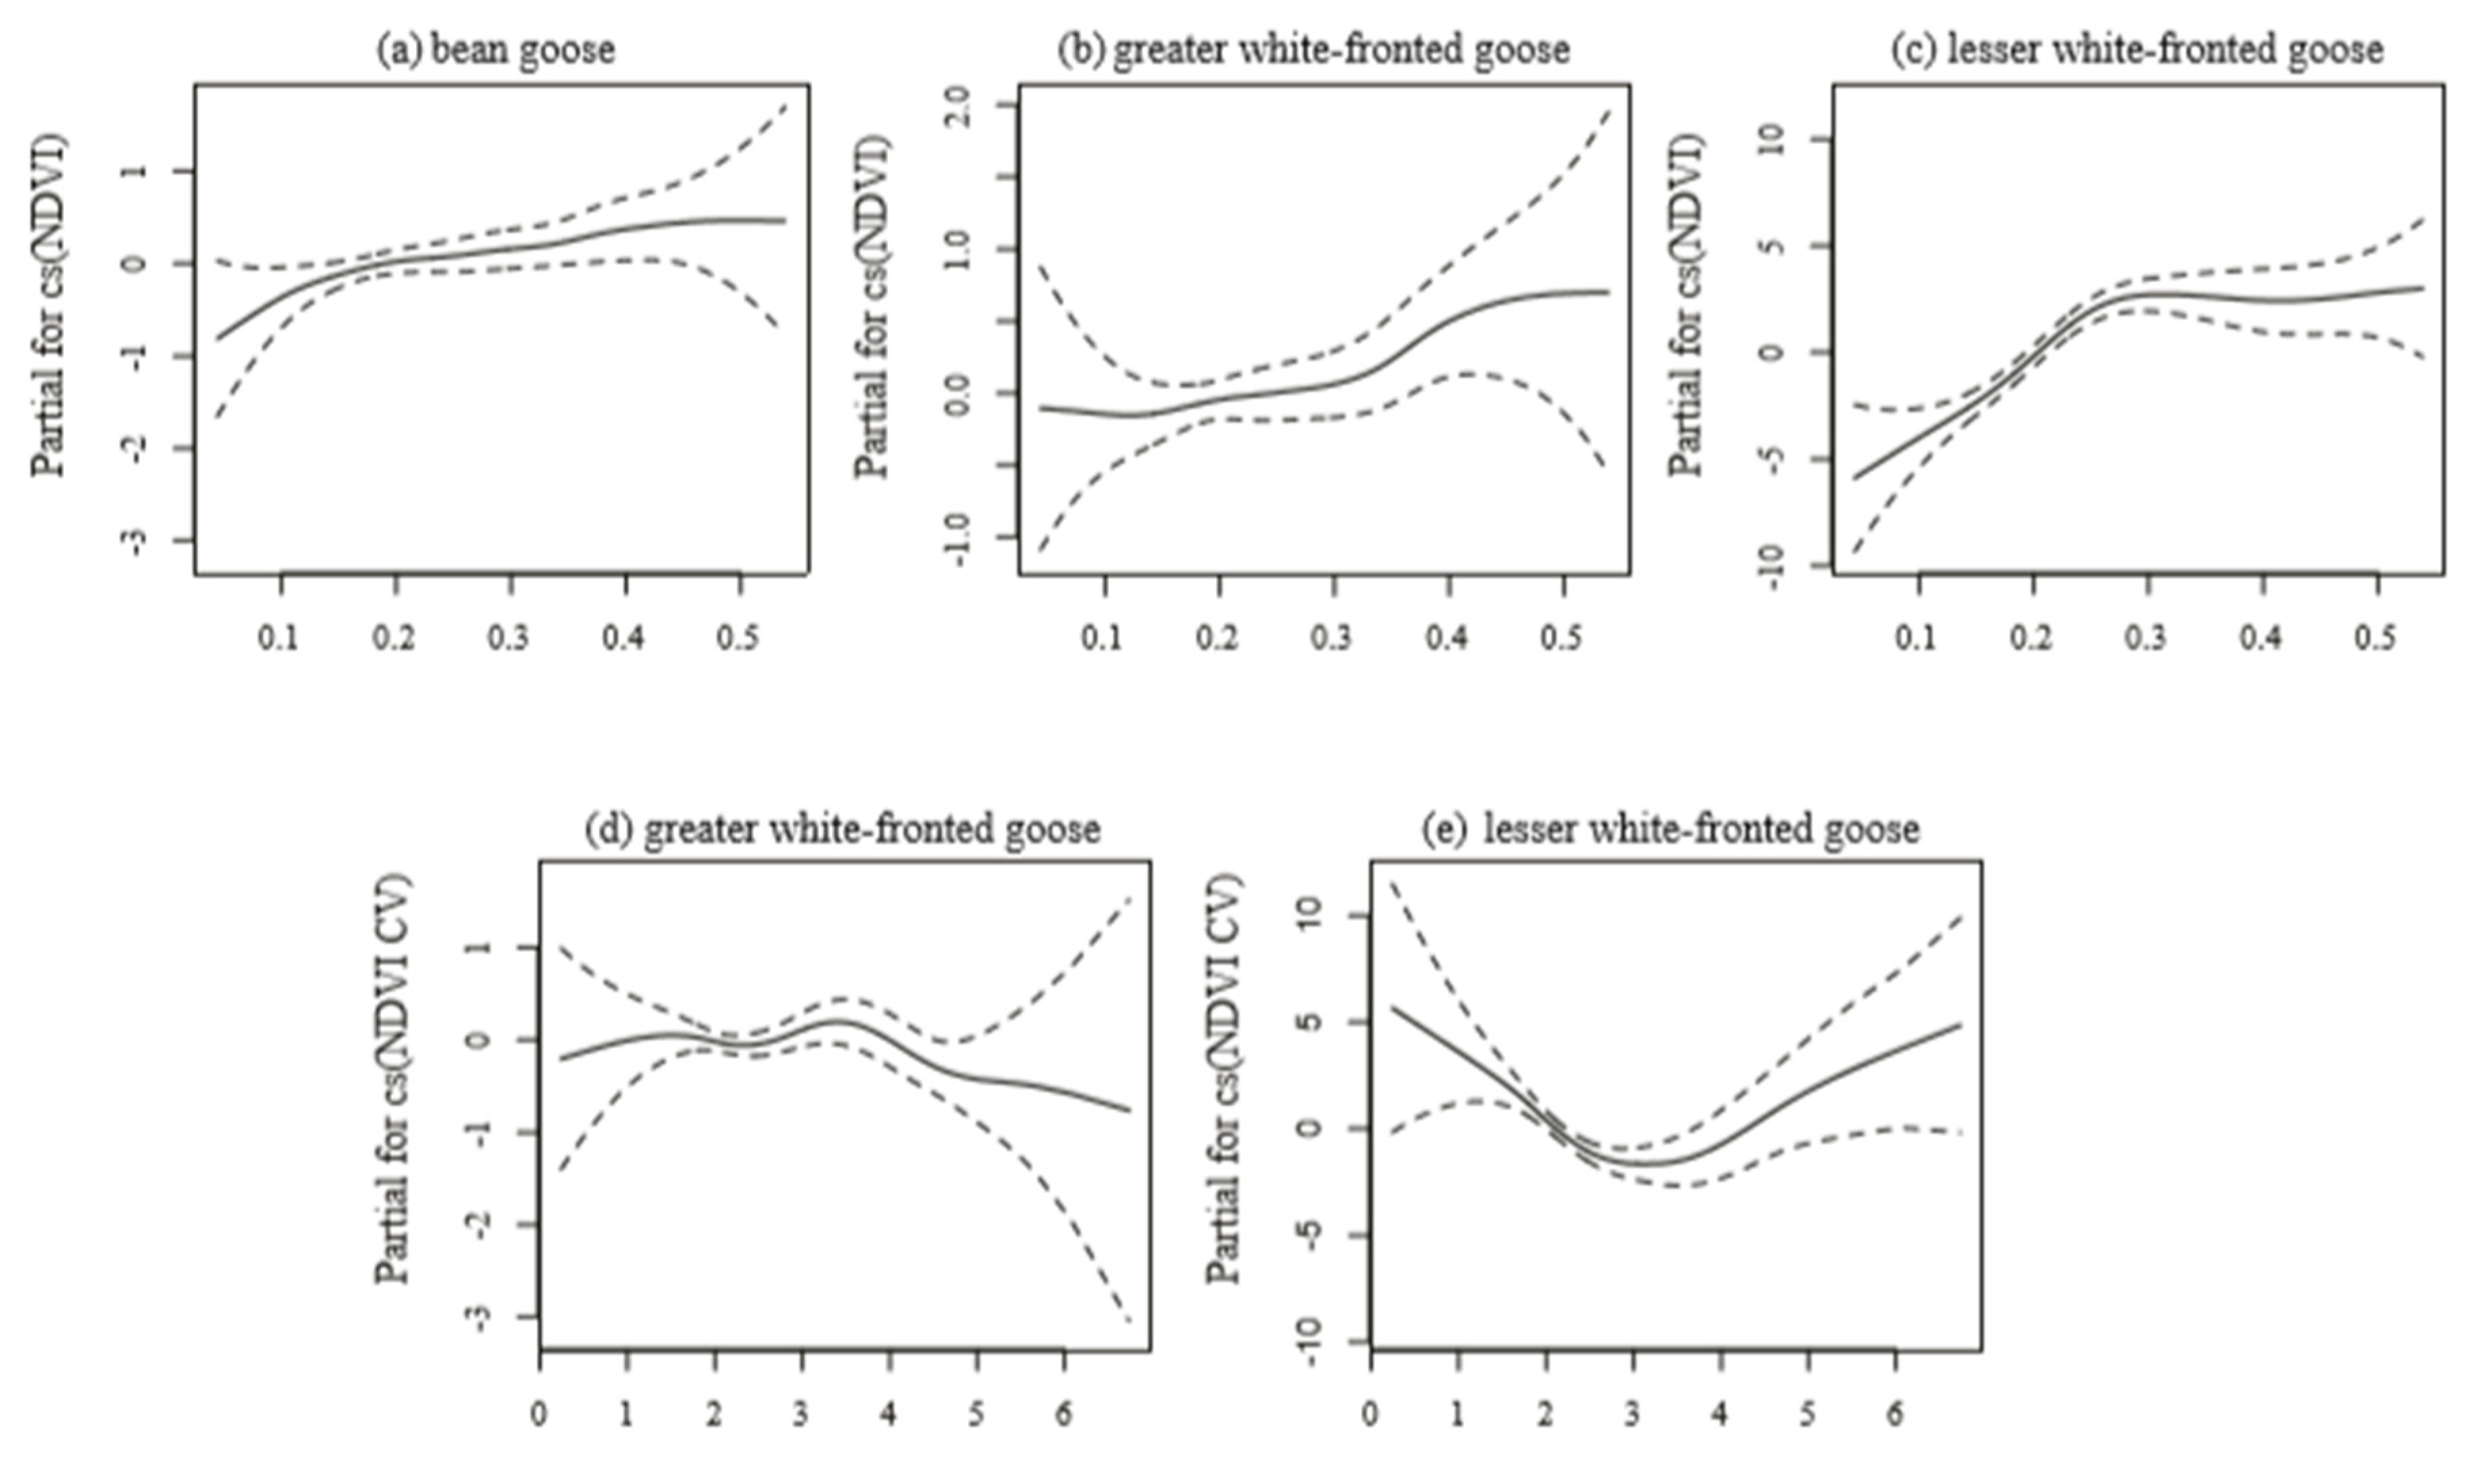
For grazing Anatidae (bean goose and greater and lesser white-fronted goose), NDVI was the most significant factor positively related to population abundance (Table 1). The three grazing species responded differently to the increasing NDVI: The population density of the larger species (bean goose and greater white-fronted goose) stopped increasing when NDVI reached 0.4 (Figure 3a,b), whereas, the smaller species, the lesser white-fronted goose, stopped at a lower NDVI value (0.28, Figure 3c).
The NDVI CV, which represented habitat heterogeneity, was negatively correlated to bean goose and lesser white-fronted goose (Figure 3e). The population of lesser white-fronted goose decreased until the NDVI CV was three (Figure 3e). The patch area (land/water) was not selected in the best models (Table 1). Besides, using a linear mixed model with the lake as a random factor, we found no significant relationship between the log-transformed land/water area and the year. (p = 0.23 for log(Land)~year and p = 0.77 for log (Water)~year).

3.3. Effects of Climatic Variables

Precipitation was positively related to the numbers of tundra swan and bean goose, whereas, temperature was negatively related to numbers of swan goose. Though included in the best models, the effects of precipitation or temperature were not significant (p > 0.1; Table 1).

4. Discussion

We analyzed the effects of environmental factors and year on five Anatidae species during 2001–2016. The results suggest that: (1) During the study period, most populations have been decreasing, except for bean goose. Swan goose declined the fastest over the study period, whereas, the number of lesser white-fronted goose declined quickly since around 2010. (2) The patch area was not included in any of the best models. (3) NDVI was the most important factor in determining the abundance of grazing geese. (4) Climatic factors had no significant effect on any species.
Populations of tundra swan, swan goose and greater white-fronted goose showed a clearly decreasing trend, and lesser-fronted goose population stopped increasing until 2010 (Figure 2). In eastern China, more than 80% of the population of these five species spend their non-breeding period in the four key areas studied here [6]. The generally decreasing trends suggest possible degradation within these four areas. Zhang et al. found that the population in the National Natural Reserves had a lower decreasing rate [10]. However, only 6% of wetlands are protected by National Natural Reserves in the MLYRF [38,39], which seems insufficient to improve the generally decreasing population trends, especially considering their current status. Notably, the population of tuber feeders (i.e., tundra swan and swan goose) decreased faster than that of grazers. Tundra swan and swan goose mainly forage on tubers of submerged macrophytes, which have been dying out in the wetlands of the MLYRF, due to intensive human activities in recent years [12]. The diminishing food resources likely explain the decline in tuber feeders. Grazing geese are affected by habitat changes, which might be a consequence of the hydrological changes caused by dam operation [40,41]. Our results suggest that tuber feeders are more sensitive to habitat degradation. The bean goose diet is relatively more diverse [42], and less sensitive to habitat changes. Thus, the population of bean goose showed no clear temporal trends.
The patch areas were not featured in the best models for any of the five species. This result is inconsistent with those reported by Connor et al. [43] and Zhang et al. [8], who found a positive effect for the patch area. We found no significant relationship between the log-transformed land/water area and the year, which might explain the lesser contribution from patch areas. We found NDVI to be the most important factor influencing grazing geese, which is similar to the findings of Zhang et al. [10]. The population size firstly increased, and then decreased with an increase in NDVI. Lesser white-fronted goose stopped increasing when the NDVI reached 0.28, whereas, bean goose and greater white-fronted goose stopped increasing at 0.4. Compared with the bigger bean goose and greater white-fronted goose, the NDVI value at which the species stopped increasing was lower for the lesser white-fronted goose, implying a possible effect of the allometry law [44,45]. The NDVI CV was generally negatively correlated with the bean goose population, but this correlation was not significant; this result is also in line with that of Zhang et al. [8]. As expected, the response of the lesser white-fronted goose population to the increasing NDVI CV was an inverted bell curve. Unlike the widely distributed sedge Carex meadow, the grass Alopecurus aequalis and the spikerush Eleocharis migoana, which are the main food sources of the wintering lesser white-fronted goose, are seldom found beyond the heterogeneous recessional grassland in East Dongting Lake [41]. Combined with heterogeneity negatively affecting the foraging efficiency of geese by increasing searching and handling time [17,18], we conclude that lesser white-fronted goose would favor a habitat with mild heterogeneity. In general, such results suggest that, mediated by the allometry law, geese might prefer habitats of higher quality to larger areas at basin scales [46,47].
Our study showed that wintering Anatidae in the MLYRF have generally declined. We also showed the important effects of NDVI (i.e., habitat quality) on grazing Anatidae at the basin scale. At this scale, patch area or climatic factors seem to play insignificant roles in determining Anatidae populations. According to Zhang et al., increasing the patch area by managing the water level of a lake would effectively protect wintering geese [8]. However, our results suggest that such management actions might not benefit wintering geese at the basin scale. To better conserve the wintering Anatidae, we need to integrate priorities at both the lake and basin scales, which means that enough patch areas should be retained at a single lake, as well as high habitat quality over the whole basin. As suggested by Zhao et al., reductions in grazing goose numbers at East Dongting Lake were correlated with declines in the availability of suitable sedge swards, caused by earlier water table recession, due to the commissioning of the Three Gorges Dam since mid-2003 [40]. Thus, habitat quality could be improved by hydrological regimes, especially the timing of water draw down [9]. In conclusion, we might benefit wintering Anatidae by developing a more strategic water plan for the MLYRF.

Supplementary Materials

The following are available online at https://www.mdpi.com/2071-1050/11/23/6814/s1.

Author Contributions

Data curation, Q.J.; Formal analysis, Q.J.; Funding acquisition, L.C., Y.Z.; Investigation, Q.J., Y.Z. and L.C.; Methodology, Q.J. and L.C.; Project administration, L.C.; Resources, L.C.; Software, Q.J.; Supervision, L.C.; Validation, Y.Z.; Visualization, Q.J.; Writing—original draft, Q.J.; Writing—review and editing, Y.Z. and L.C.

Funding

This study was supported by the Natural Science Foundation of Jiangsu Province (Grant No. BK20170922), the National Natural Science Foundation of China (Grant No. 31661143027, 31670424 and 31870369), the Key Strategic Program of the Chinese Academy of Sciences, Water Ecological Security Assessment and Great Strategy Research of Middle and Lower Yangtze River (Grant No. ZDRW-ZS-2017-3) and China Biodiversity Observation Networks (Sino BON).

Acknowledgments

We thank the staff from Poyang Lake National Nature Reserve, East Dongting Lake National Nature Reserve, Shengjin Lake National Nature Reserve and Anqing Yangtze Riverine Provincial Nature Reserve for their support with census data.

Conflicts of Interest

We declare no conflict of interest.

References

  1. De Boer, W.F.; van Langevelde, F.; Prins, H.H.; de Ruiter, P.C.; Blanc, J.; Vis, M.J.; Gaston, K.J.; Hamilton, I.D. Understanding spatial differences in African elephant densities and occurrence, a continent-wide analysis. Biol. Conserv. 2013, 159, 468–476. [Google Scholar] [CrossRef]
  2. Wen, L.; Rogers, K.; Saintilan, N.; Ling, J. The influences of climate and hydrology on population dynamics of waterbirds in the lower Murrumbidgee River floodplains in Southeast Australia: Implications for environmental water management. Ecol. Model. 2011, 222, 154–163. [Google Scholar] [CrossRef]
  3. Pavón-Jordán, D.; Fox, A.D.; Clausen, P.; Dagys, M.; Deceuninck, B.; Devos, K.; Hearn, R.D.; Holt, C.A.; Hornman, M.; Keller, V.; et al. Climate-driven changes in winter abundance of a migratory waterbird in relation to EU protected areas. Divers. Distrib. 2015, 21, 571–582. [Google Scholar] [CrossRef]
  4. Cao, L.; Fox, A.D. Birds and people both depend on China’s wetlands. Nature 2009, 460, 173. [Google Scholar] [CrossRef]
  5. Cao, L.; Zhang, Y.; Barter, M.; Lei, G. Anatidae in eastern China during the non-breeding season: Geographical distributions and protection status. Biol. Conserv. 2010, 143, 650–659. [Google Scholar] [CrossRef]
  6. Jia, Q.; Koyama, K.; Choi, C.Y.; Kim, H.J.; Cao, L.; Gao, D.; Liu, G.; Fox, A.D. Population estimates and geographical distributions of swans and geese in East Asia based on counts during the non-breeding season. Bird Conserv. Int. 2016, 26, 397–417. [Google Scholar] [CrossRef]
  7. De Boer, W.F.; Cao, L.; Barter, M.; Wang, X.; Sun, M.; Van Oeveren, H.; De Leeuw, J.; Barzen, J.; Prins, H.H.T. Comparing the community composition of European and Eastern Chinese waterbirds and the influence of human factors on the China waterbird community. Ambio 2011, 40, 68–77. [Google Scholar] [CrossRef]
  8. Zhang, Y.; Jia, Q.; Prins, H.H.T.; Cao, L.; De Boer, W.F. Individual-area relationship best explains goose species density in wetlands. PLoS ONE 2015, 10, e0124972. [Google Scholar] [CrossRef]
  9. Guan, L.; Lei, J.; Zuo, A.; Zhang, H.; Lei, G.; Wen, L. Optimizing the timing of water level recession for conservation of wintering geese in Dongting Lake, China. Ecol. Eng. 2016, 88, 90–98. [Google Scholar] [CrossRef]
  10. Zhang, Y.; Jia, Q.; Prins, H.; Cao, L.; de Boer, W. Effect of conservation efforts and ecological variables on waterbird population sizes in wetlands of the Yangtze River. Sci. Rep. 2015, 5, 17136. [Google Scholar] [CrossRef]
  11. Zhang, Y.; Cao, L.; Barter, M.; Fox, A.D.; Zhao, M.; Meng, F.; Shi, H.; Jiang, Y.; Zhu, W. Changing distribution and abundance of Swan Goose Anser cygnoides in the Yangtze River floodplain: The likely loss of a very important wintering site. Bird Conserv. Int. 2011, 21, 36–48. [Google Scholar] [CrossRef]
  12. Fox, A.D.; Cao, L.; Zhang, Y.; Barter, M.; Zhao, M.J.; Meng, F.J.; Wang, S.L. Declines in the tuber-feeding waterbird guild at Shengjin Lake National Nature Reserve, China—A barometer of submerged macrophyte collapse. Aquat. Conserv. Mar. Freshw. Ecosyst. 2011, 21, 82–91. [Google Scholar] [CrossRef]
  13. Si, Y.; Skidmore, A.K.; Wang, T.; de Boer, W.F.; Toxopeus, A.G.; Schlerf, M.; Oudshoorn, M.; Zwerver, S.; Jeugd, H.V.D.; Exo, K.M.; et al. Distribution of barnacle geese Branta leucops is in relation to food resources, distance to roosts, and the location of refuges. Ardea 2011, 99, 217–226. [Google Scholar] [CrossRef]
  14. Koh, C.N.; Lee, P.F.; Lin, R.S. Bird species richness patterns of northern Taiwan: Primary productivity, human population density, and habitat heterogeneity. Divers. Distrib. 2006, 12, 546–554. [Google Scholar] [CrossRef]
  15. Heuermann, N.; van Langevelde, F.; van Wieren, S.E.; Prins, H.H. Increased searching and handling effort in tall swards lead to a Type IV functional response in small grazing herbivores. Oecologia 2011, 166, 659–669. [Google Scholar] [CrossRef] [PubMed]
  16. Bos, D.; Van De Koppel, J.; Weissing, F.J. Dark-bellied brent geese aggregate to cope with increased levels of primary production. Oikos 2004, 107, 485–496. [Google Scholar] [CrossRef]
  17. Searle, K.R.; Vandervelde, T.; Hobbs, N.T.; Shipley, L.A. Gain functions for large herbivores: Tests of alternative models. J. Anim. Ecol. 2005, 74, 181–189. [Google Scholar] [CrossRef]
  18. Shipley, L.A. The influence of bite size on foraging at larger spatial and temporal scales by mammalian herbivores. Oikos 2007, 116, 1964–1974. [Google Scholar] [CrossRef]
  19. Tews, J.; Brose, U.; Grimm, V.; Tielborger, K.; Wichmann, M.C.; Schwager, M.; Jeltsch, F. Animal species diversity driven by habitat heterogeneity/diversity: The importance of keystone structures. J. Biogeogr. 2004, 31, 79–92. [Google Scholar] [CrossRef]
  20. Meehan, T.D.; Jetz, W.; Brown, J.H. Energetic determinants of abundance in winter landbird communities. Ecol. Lett. 2004, 7, 532–537. [Google Scholar] [CrossRef]
  21. Root, T. Energy Constraints on Avian Distributions and Abundances. Ecology 1988, 69, 330–339. [Google Scholar] [CrossRef]
  22. Milchunas, D.G.; Lauenroth, W.K. Quantitative effects of grazing on vegetation and soils over a global range of environments. Ecol. Monogr. 1993, 63, 327–366. [Google Scholar] [CrossRef]
  23. Nolet, B.A.; Fuld, V.N.; van Rijswijk, M.E.C. Foraging costs and accessibility as determinants of giving-up densities in a swan-pondweed system. Oikos 2006, 112, 353–362. [Google Scholar] [CrossRef]
  24. Zenzal, T.J.; Contina, A.J.; Kelly, J.F.; Moore, F.R. Temporal migration patterns between natal locations of ruby-throated hummingbirds (Archilochus colubris) and their Gulf Coast stopover site. Mov. Ecol. 2018, 6, 2. [Google Scholar] [CrossRef] [PubMed]
  25. La Sorte, F.A.; Tingley, M.W.; Hurlbert, A.H. The role of urban and agricultural areas during avian migration: An assessment of within-year temporal turnover. Glob. Ecol. Biogeogr. 2014, 23, 1225–1234. [Google Scholar] [CrossRef]
  26. Qi, S.; Brown, D.G.; Tian, Q.; Jiang, L.; Zhao, T.; Bergen, K.M. Inundation Extent and Flood Frequency Mapping Using LANDSAT Imagery and Digital Elevation Models. GIsci. Remote Sens. 2009, 46, 101–127. [Google Scholar] [CrossRef]
  27. Huang, Q.; Sun, Z.; Opp, C.; Lotz, T.; Jiang, J.; Lai, X. Hydrological Drought at Dongting Lake: Its Detection, Characterization, and Challenges Associated With Three Gorges Dam in Central Yangtze, China. Water Resour. Manag. 2014, 28, 5377–5388. [Google Scholar] [CrossRef]
  28. Bibby, C.J. Bird Census Techniques; Elsevier: Amsterdam, The Netherlands, 2000; ISBN 0120958317. [Google Scholar]
  29. Wood, K.A.; Stillman, R.A.; Coombs, T.; Mcdonald, C.; Daunt, F.; O’Hare, M.T. The role of season and social grouping on habitat use by Mute Swans (Cygnus olor ) in a lowland river catchment. Bird Study 2013, 60, 229–237. [Google Scholar] [CrossRef]
  30. Barter, M.; Cao, L.; Chen, L.; Lei, G. Results of a survey for waterbirds in the lower Yangtze floodplain, China, in January-February 2004. Forktail 2005, 21, 1–7. [Google Scholar]
  31. Claverie, M.; Vermote, E.F.; Franch, B.; Masek, J.G. Evaluation of the Landsat-5 TM and Landsat-7 ETM+surface reflectance products. Remote Sens. Environ. 2015, 169, 390–403. [Google Scholar] [CrossRef]
  32. Scaramuzza, P.; Micijevic, E.; Chander, G. SLC Gap-Filled Products Phase one Methodology. 2004. Available online: https://landsat.usgs.gov/sites/default/files/documents/SLC_Gap_Fill_Methodology.pdf (accessed on 10 September 2014).
  33. Mantero, P.; Moser, G.; Serpico, S.B. Partially supervised classification of remote sensing images through SVM-based probability density estimation. IEEE Trans. Geosci. Remote Sens. 2005, 43, 559–570. [Google Scholar] [CrossRef]
  34. Joseph, L.N.; Elkin, C.; Martin, T.G.; Possingham, H.P. Modeling abundance using N-mixture models: The importance of considering ecological mechanisms. Ecol. Appl. 2009, 19, 631–642. [Google Scholar] [CrossRef] [PubMed] [Green Version]
  35. Whittingham, M.J.; Stephens, P.A.; Bradbury, R.B.; Freckleton, R.P. Why do we still use stepwise modelling in ecology and behaviour? J. Anim. Ecol. 2006, 75, 1182–1189. [Google Scholar] [CrossRef] [PubMed]
  36. R Core Team. R Foundation for Statistical Computing. 2016. Available online: https://www.R-project.org/ (accessed on 15 August 2016).
  37. Rigby, R.A.; Stasinopoulos, D.M.; Akantziliotou, C. A framework for modelling overdispersed count data, including the Poisson-shifted generalized inverse Gaussian distribution. Comput. Stat. Data Anal. 2008, 53, 381–393. [Google Scholar] [CrossRef]
  38. State Forestry Administration. Outcomes of the second national wetland resource survey. L. Green. 2014, 2, 6–7. [Google Scholar]
  39. Ministry of Ecology and Environmental of PRC List of Natural Reserves. Available online: http://www.mee.gov.cn/stbh/zrbhq/qgzrbhqml/201611/P020161125559865886359.pdf (accessed on 8 November 2016).
  40. Zhao, M.; Cong, P.; Barter, M.; Fox, A.D.; Cao, L. The changing abundance and distribution of Greater White-fronted Geese Anser albifrons in the Yangtze River floodplain: Impacts of recent hydrological changes. Bird Conserv. Int. 2012, 22, 135–143. [Google Scholar] [CrossRef] [Green Version]
  41. Wang, X.; Fox, A.D.; Cong, P.; Cao, L. Food constraints explain the restricted distribution of wintering Lesser White-fronted Geese Anser erythropus in China. IBIS 2013, 155, 576–592. [Google Scholar] [CrossRef]
  42. Zhao, M.; Cao, L.; Klaassen, M.; Zhang, Y.; Fox, A.D. Avoiding Competition? Site Use, Diet and Foraging Behaviours in Two Similarly Sized Geese Wintering in China. Ardea 2015, 103, 27–39. [Google Scholar] [CrossRef]
  43. Connor, E.F.; Courtney, A.C.; Yoder, J.M.; Mar, N.; Connor, E.; Yder, J.M. Individuals-Area Relationships: The Relationship between Animal Population Density and Area. Ecology 2007, 81, 734–748. [Google Scholar]
  44. Bell, R.H.V. The use of the herb layer by grazing ungulates in the Serengeti. In Animal Populations in Relation to Their Food Resources; Blackwell Scientific: Oxford, UK, 1970; Volume 10, pp. 111–124. [Google Scholar]
  45. Jarman, P. The social organisation of antelope in relation to their ecology. Behaviour 1974, 48, 215–267. [Google Scholar] [CrossRef] [Green Version]
  46. Fleishman, E.; Ray, C.; Sjögren-Gulve, P.; Boggs, C.L.; Murphy, D.D. Assessing the roles of patch quality, area, and isolation in predicting metapopulation dynamics. Conserv. Biol. 2002, 706–716. [Google Scholar] [CrossRef] [Green Version]
  47. Prugh, L.R.; Hodges, K.E.; Sinclair, A.R.E.; Brasharesa, J.S. Effect of habitat area and isolation on fragmented animal populations. Proc. Natl. Acad. Sci. USA 2008, 105, 20770–20775. [Google Scholar] [CrossRef] [PubMed] [Green Version]
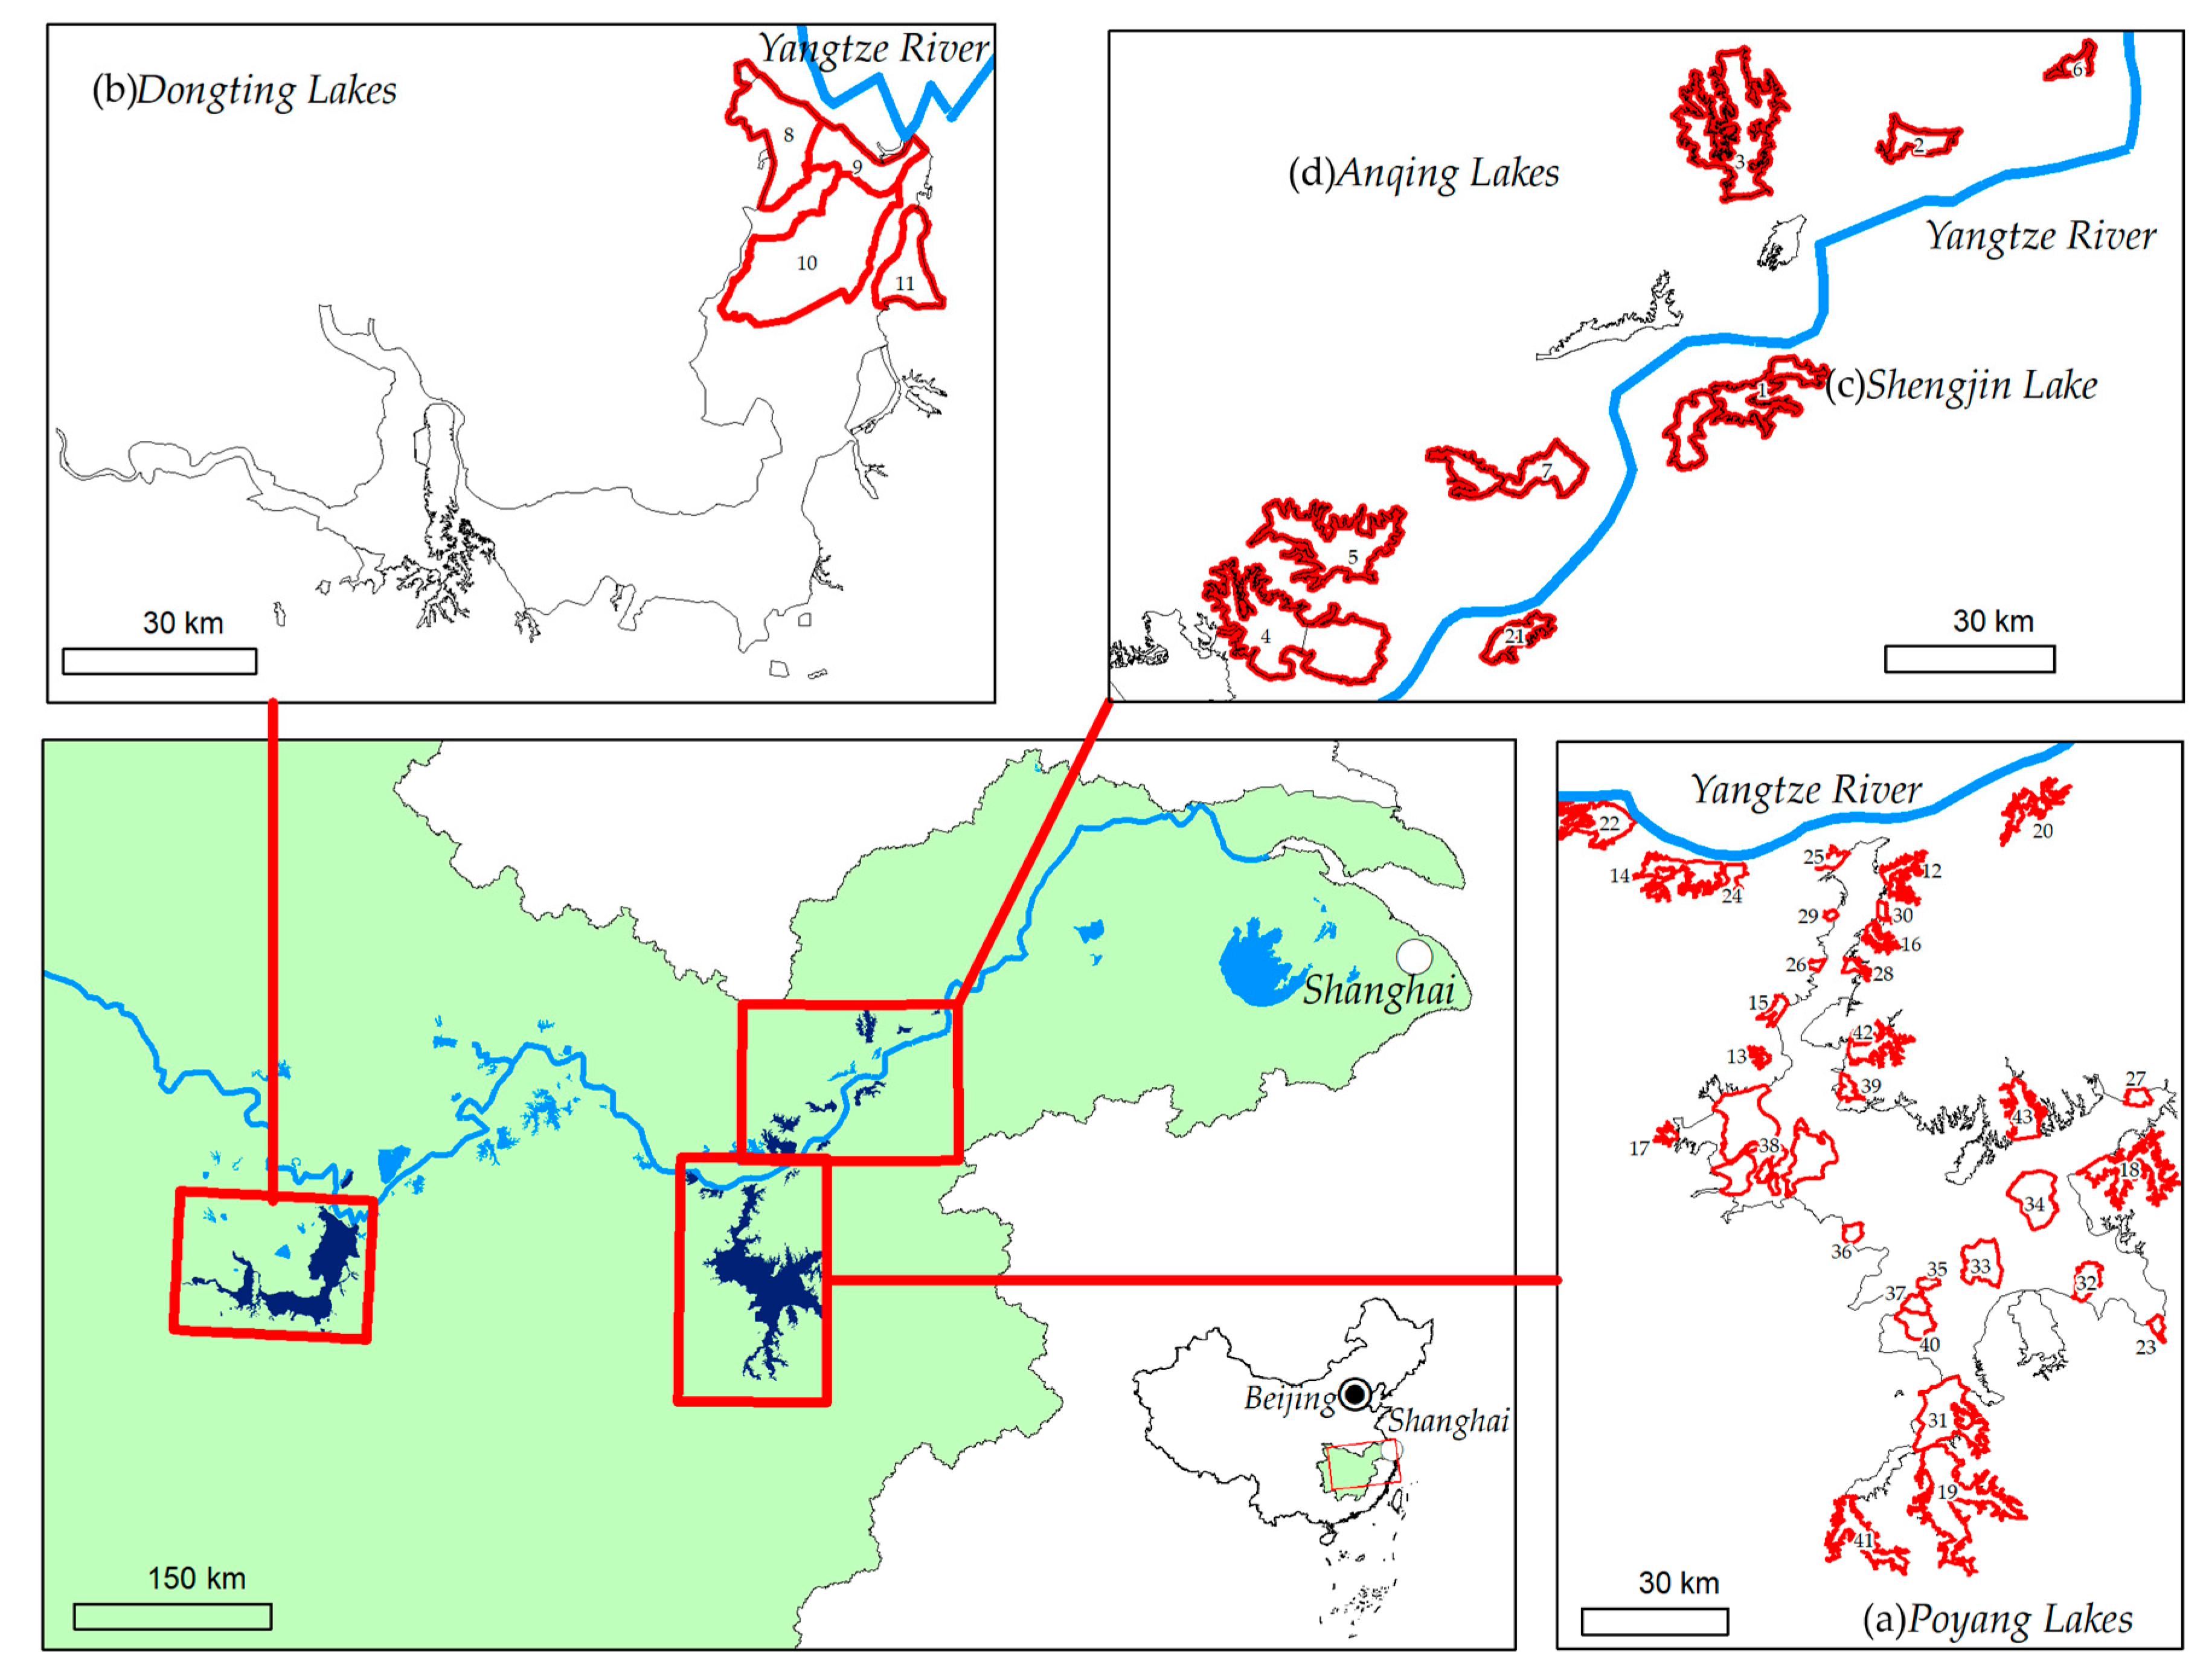
Figure 1. The location of (a) Poyang Lakes, (b) Dongting Lakes, (c) Shengjin Lake and (d) Anqing Lakes in the Middle and Lower Yangtze River floodplain (MLYRF). The red line shows the boundary of the 43 wetlands concerned in this study. See the name of each lake in supplementary materials Table S1 according to numbers.
Sustainability 11 06814 g001
Figure 2. Population abundance indices of (a) tundra swan, (b) swan goose, (c) greater, and (d) lesser white-fronted goose in 43 wetlands from 2001 to 2016 in the MLYRF using Generalized Additive Mixed Models (GAMMS). The solid line shows the abundance indices. The dotted lines show the 95% confidence intervals.
Sustainability 11 06814 g002
Figure 3. The response of the population abundance indices of (a) bean goose, (b) greater, and (c) lesser white-fronted goose to normalized difference vegetation index (NDVI) and of (d) greater and (e) lesser white-fronted goose to NDVI coefficient of variation (CV)) using GAMMs. The solid line shows the abundance indices. The dotted lines show the 95% confidence intervals.
Sustainability 11 06814 g003
Table 1. Summary statistics for the best fitted generalized additive mixed models (GAMMs) for the five Anatidae species counts in 43 wetlands for 2001–2016 in the Middle and Lower Yangtze River floodplain (MLYRF).
PredictorEstimateStandard Errort-ValuepModel Performance
Global DevianceGAICPseudo R2
Tundra Swan
(Intercept)60.6929.242.080.04 *
Year−0.030.01−1.850.07
Precipitation0.000.000.310.764492.744582.030.46
Swan goose
(Intercept)488.7361.197.990.00 **
Year−0.240.03−7.910.00 **
Temperature−0.050.07−0.670.514360.534462.050.38
Bean goose
(Intercept)6.490.2328.390.00 **
NDVI CV−0.050.06−0.760.45
NDVI2.120.643.310.00 **
Precipitation0.000.00−1.390.174688.964789.680.59
Greater white-fronted goose
(Intercept)91.4333.972.690.01 *
Year−0.040.02−2.500.01 *
NDVI1.640.762.140.03 *2859.722943.250.44
Lesser white-fronted goose
(Intercept)−313.56113.15−2.770.01 *
Year0.150.062.730.01 *
NDVI CV−0.660.32−2.090.04 *
NDVI19.862.687.420.00 **1271.611375.500.42
Note: p < 0.1, * p < 0.05, ** p < 0.01. GAIC, generalized Akaike information criterion.