Article

How Transportation Service Quality Drives Public Attitude and Image of a Sustainable City: Satisfaction as A Mediator and Involvement as A Moderator

1
Department of Transportation and Logistics Management, National Chiao Tung University, 4F, No. 118, Section 1, Chung Hsiao W. Road, Taipei 100, Taiwan
2
Department of International Business Administration, Chinese Culture University, 55, Hwa-Kang Road, Yang-Ming-Shan, Taipei 11114, Taiwan
*
Author to whom correspondence should be addressed.
Sustainability 2019, 11(23), 6813; https://doi.org/10.3390/su11236813
Submission received: 26 October 2019 / Revised: 26 November 2019 / Accepted: 27 November 2019 / Published: 1 December 2019

Abstract

:
This study highlights transportation service quality (including that of the core transportation service and the physical environment of transportation) and investigates its impact on satisfaction as well as attitude toward and image of a sustainable city. Additionally, this study also addresses the mediating role of satisfaction in the relationships between transportation service quality, and both attitude toward and image of a sustainable city, as well as the moderating role of involvement in the links between satisfaction and this attitude and between satisfaction and this image. The findings confirm that both core transportation service and the physical environment of transportation significantly and positively influence satisfaction and, in turn, significantly and positively influence attitude toward and image of a sustainable city. Satisfaction also plays a mediating role in the links between transportation service quality and this attitude and image. In addition, the effect of satisfaction on attitude toward and image of a sustainable city becomes greater as the level of involvement increases.

1. Introduction

So-called “mega events”, which are on a scale outstripping merely major ones, have received increasing attention in a burgeoning area of research in the tourism and events literature [1,2]. The former literature has pointed out that mega-events serve as magnets for tourism and bring in associated profits [3], as well as having the potential to alter the image of a tourist destination [4]. In the literature on sports, studies tend to examine both the economic benefits of gigantic sporting events [5], and the role of sports tourism in developing public policy [6]. Mega-events such as the Olympics are also an opportunity to renew or upgrade a host location’s infrastructure [7], and they can also encourage local pride [8], as well as a new spirit of cohesiveness and belonging [9]. Of course, mega-events are also in the international media spotlight, which can help reshape the global image of the host location [10,11].
Arnegger and Herz [12] have suggested that such mega-events have two potential effects: the first is to draw participants and audiences, increasing travel to the host destination during the event; the second is the creation of additional exposure via advertising and news coverage for the host destination as a result of the event. Mega-events have significant effects on the destination’s image (e.g., [11,12,13,14]) which contributes both to the successful development of the host city as an attractive destination for people to visit [15] and to sustainable development of the city [16]. In other words, mega-events contribute in significant ways to the public policy of locations seeking urban development, economic growth, and rebranding [17,18]. Mega-events create unique opportunities to for local governments to address extant problems, stimulate physical renewal and development, and boost community spirit and cohesion [18]. Thus, such outsized events can provide social, environmental and economic stimuli to improve local residents’ well-being, although the potential exists for negative outcomes as well [18].
After reviewing prior research on mega-events, this study finds that researchers have examined the ability of mega-event to improve inter-organizational relationships, tie strength [19], and the collaborative capacity of these organizations [19], the relationships among corruption, transparency, knowledge, and public trust [20], developing and validating a multidimensional quality scale for mega-events, the effects of destination image and satisfaction on behavioral intentions [21], as well as the impacts of cultural and sport mega-events on sustainable development of the city [16]. However, there is little empirical evidence for the effect of transportation service quality on satisfaction as well as attitude toward and image of a sustainable city.
Additionally, although past studies have been done on volunteering for mega-events (e.g., [22,23,24]), there is a paucity of discussion on volunteers’ perceptions of transportation service. Volunteers play a crucial role in hosting mega-events; they symbolize staff, visitors, and consumers [25]. Ralston, Lumsdon, and Downward [26] described volunteers as devotees of mega-events who help make the event successful. Identifying volunteers’ evaluation of the transportation service as they participate in and support mega-events is important, as they are also service providers and a main type of passengers at such events. Thus, it is very important to investigate volunteers’ evaluation of the transportation service at mega-events. Once volunteers perceive transportation service quality as excellent, their attitude toward and image of the city can be improved. Then, volunteers are more likely to become tourists in the host city. This also shows that the connection between transport and tourism markets is reciprocal in nature [27]. Specifically, transportation service in tourism is able to provide tourists the ability to reach destination and influences their impressions and preferences during their trip [28]. Thus, transportation service has been viewed as the determinant of the destinations’ overall attractiveness [29,30] and vice versa. Definitely, to increase the destinations’ overall attractiveness, the transportation infrastructure network and the connectivity between the network and tourist facilities need to be improved.
Measuring service quality requires an overall evaluation of all service characteristics [31]. The concept of quality is important to explore in marketing because it predicts satisfaction [32,33]. Lai and Chen [34] confirmed that transportation service quality significantly affects passenger satisfaction. Satisfaction is a critical component in tourism studies [21]. Satisfaction, in turn, is perceived as the main driver of both attitude [35,36,37] and host city’s (destination) image [12,38]. Furthermore, involvement is another concept in widespread use in both the marketing domain and behavioral research, and refers to strong attitudes able to explain and even to predict behavior [39]. It is defined as the extent to which a person has interest in or attaches importance to an object, or that object’s centrality to him or her, or its centrality to one’s ego structure [40]. One’s involvement level affects the importance of decisions when making purchases, including consumers’ emotional and cognitive responses [41], such that customers tend to show attitudinal loyalty when making high-involvement purchases. However, there has been little application of involvement in the transport service literature, in particular for mega-events.
To fill this gap, the present study develops a relationship model comprising the chief determinants of volunteers’ attitudes toward a sustainable city (hereafter, ‘city attitude’) and their image of the city (‘city image’), and investigates the effects of these determinants on city attitude and city image. Specifically, the service quality (including that of the core transportation service and physical environment of transportation), satisfaction, and involvement that are concerned in the creation of volunteers’ city attitude and city image in the transportation service context of a mega event (the Universiade) are addressed in this study.

2. Mega-Events

Getz [42] defined a special event as “a one-time or infrequently occurring event outside normal programs or activities of the sponsoring or organizing body”. Getz [43] also noted the various types of special (one-time or infrequent) events according to their purpose, program, and form; while some are public celebrations (e.g., community festivals), others are for entertainment, doing business, socializing competition (e.g., sports). Jago and Shaw [44] grouped special events by size and their effects on tourism (e.g., festivals, and mega-events). The largest type of event, known as a mega-event, is ‘a one-time major event that is generally of an international scale’ [44]. Roche [45] defined these as ‘large-scale cultural (including commercial and sporting) events which have a dramatic character, mass popular appeal and international significance’. He adds that ‘[t]hey are typically organized by variable combinations of national governmental and international non-governmental organizations’. Mega-events are by definition enormous events with repercussions for entire economies, ones which typically capture significant attention in the world’s media; clear examples include the Olympic Games and the largest of international exhibitions (such as world expos) [46]. Mega-events are known to boost tourism and generally have a salient role in destination marketing [47].
The Universiade, also called the World University Games or World Student Games, is an international multi-sport event for university-aged athletes (17 to 28 years old). The Universiade has been identified as a crucial global mega-event by the International University Sports Federation (FISU). It has both summer and winter versions; each has its own distinct sports and is hosted every two years in a different city for 12 days. This study explores volunteers’ evaluation of the transportation service in one Summer Universiade, in 2017.

Outline of Summer Universiade 2017 in Taipei, Taiwan

Taipei, Taiwan hosted the 29th Summer Universiade from 19–30 August 2017. Its slogan was ‘For You, For Youth’. Taipei city is the capital and a special municipality of Taiwan; it is the political, economic, educational, cultural and tourism center of Taiwan. The event attracted athletes from more than 100 participating countries who competed in 22 sports, including 14 compulsory, 7 optional and one demonstration sport [48]. More than 10,000 volunteers were recruited and trained to provide services to event participants [49]. Their primary responsibilities included providing general assistance and guidance to participants, interpretation, taking care of event facilities, maintaining order, and facilitating safe transportation. In other words, although the selected volunteers were not necessarily familiar with Taipei, they had enough ability to deliver trustworthy quality services to participants after training and actual rides, and after that they had the potential to become tourists in Taipei. Thus, it will be interesting and valuable to examine the influence of volunteers’ satisfaction on city attitudes and city image.

3. Theoretical Background and Hypothesis Development

The theoretical background and structure of the research can be separated into the following two sections. First, I review the marketing literature involved in service quality, satisfaction, city attitude, and city image relationships showing different viewpoints; and second, the moderating variable of involvement is discussed. In the following section, this study develops hypotheses for the relationships among service-quality perceptions, satisfaction, city attitude, and city image, as well as for the moderating role of involvement (see Figure 1 for the research model).

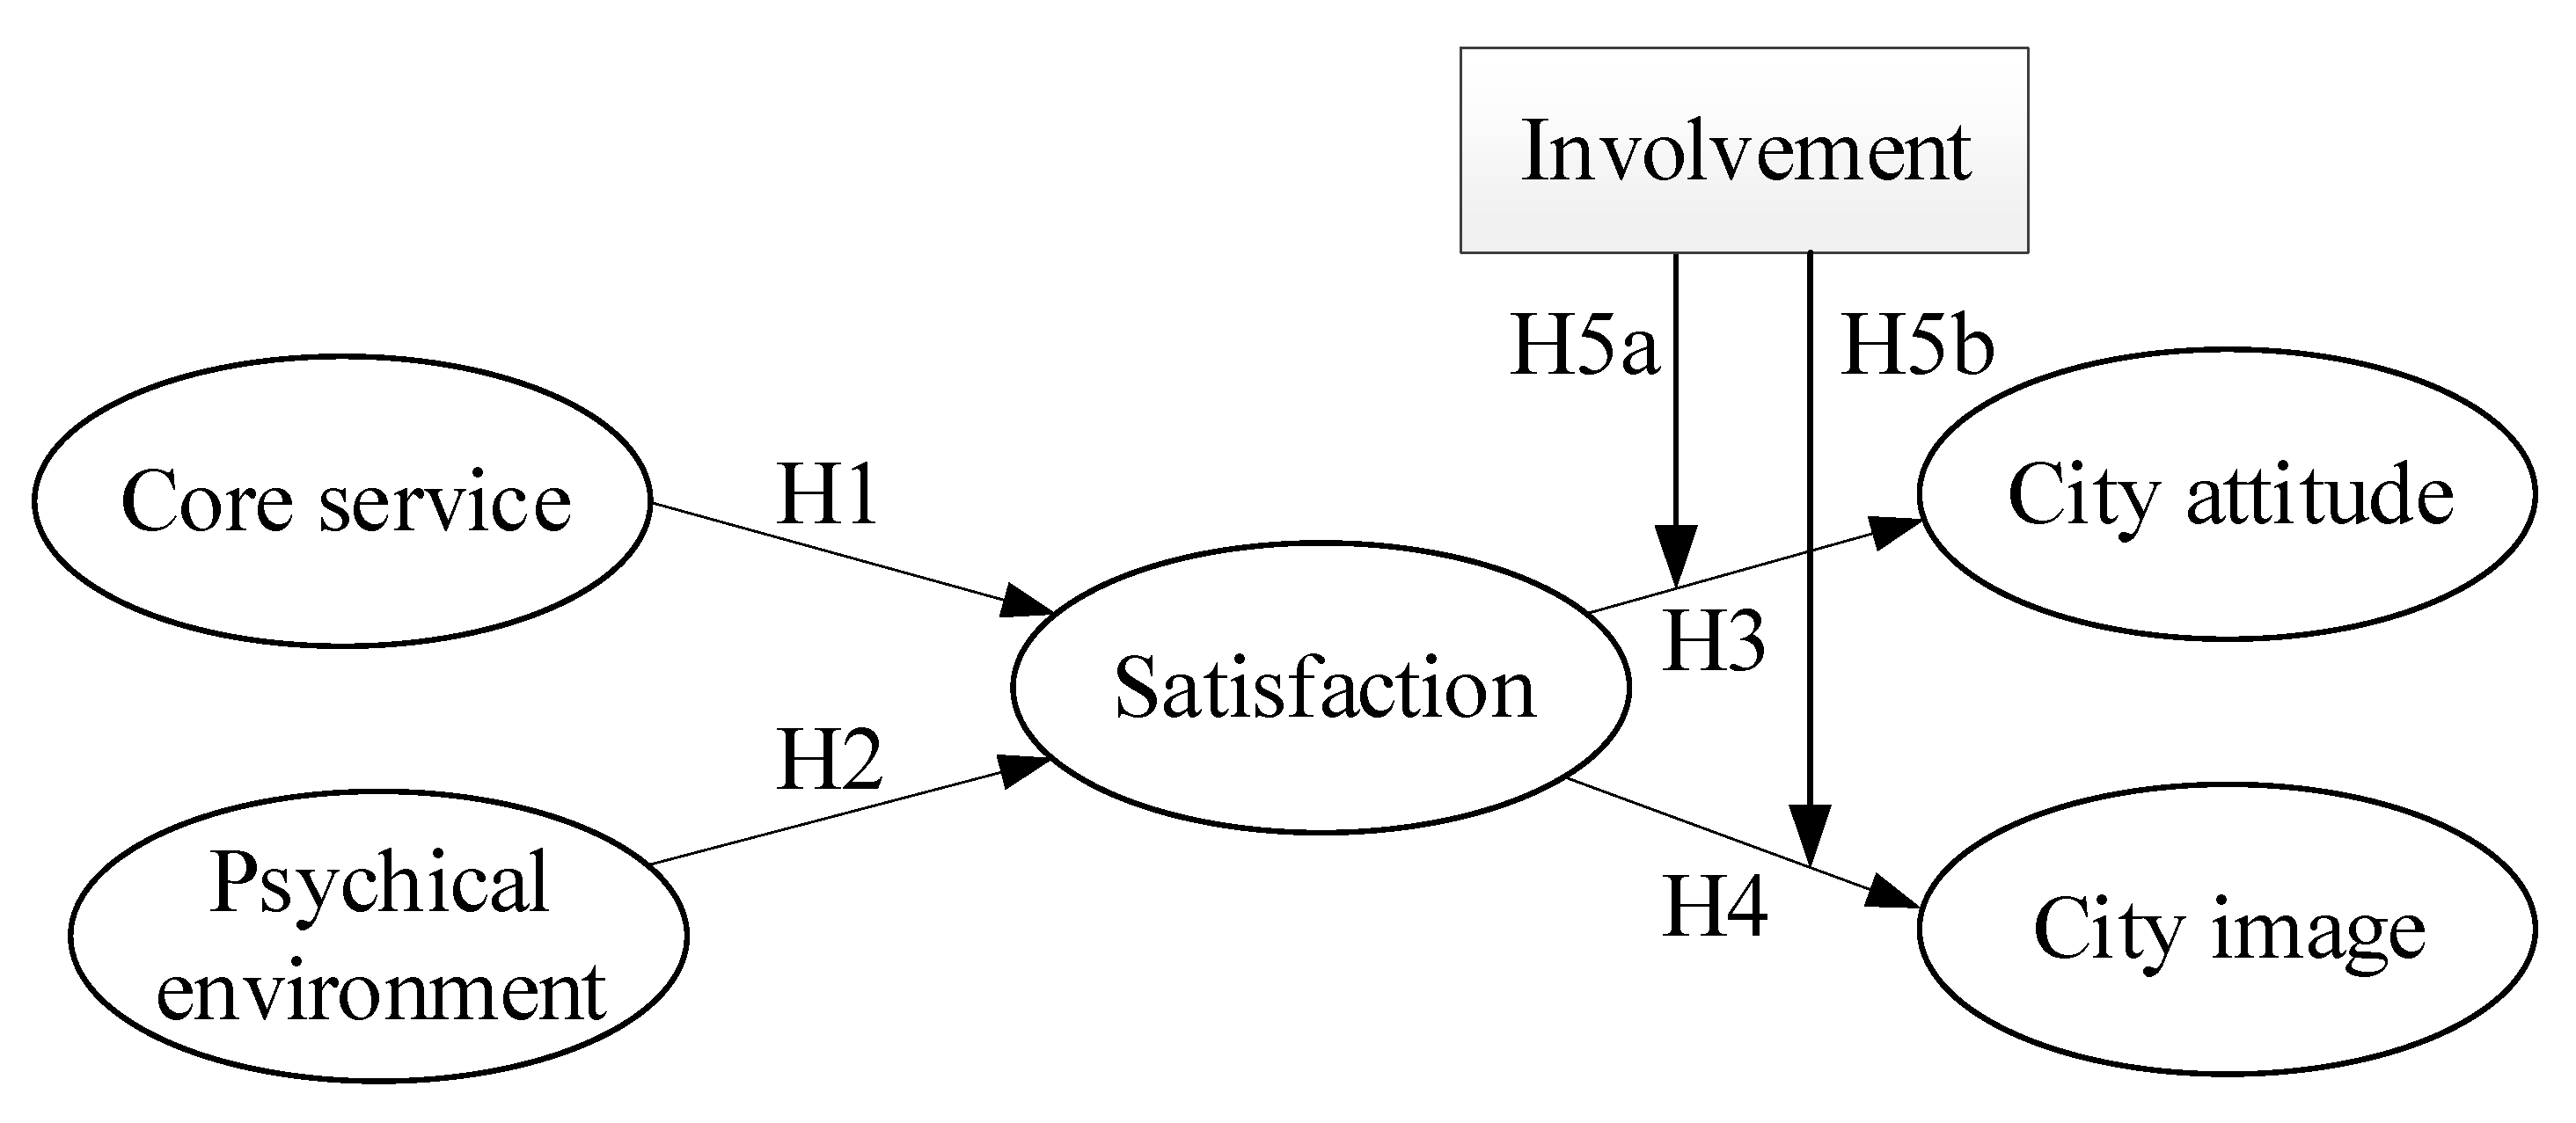
3.1. Hypotheses Regarding Service Quality

During the Summer Universiade, volunteers are major guidance resource for passengers bound for the event on the transportation service. Volunteers must be able to contact the transportation service as needed, and they also have to clearly understand the transportation service so as to deliver the best service quality to athletes, international technical officers, FISU family members, and so on. Although the SERVQUAL scale proposed by Parasuraman et al. [31] has been extensively applied to evaluate service quality, in practice, to measure public transportation service quality, Lai and Chen [34] indicated that fitting modifications are necessary to reveal the specific characteristics of the service context being explored. Tyrinopoulos and Antonious [50] used 23 criteria in four groups, which include general characteristics, vehicles, terminals and stops, and transport points, following the Handbook for Measuring Customer Satisfaction and Service Quality [51]. The service attributes in the present study follow Tyrinopoulos and Antonious [50] as well as Lai and Chen [34], with modification as needed for the Taipei transportation system’s specific service characteristics during the Summer Universiade. Specifically, in the existing study, transportation service quality is measured through the constructs of core transportation service and physical environment of transportation, as identified by Lai and Chen [34].
Service quality is defined as “the consumer’s subjective judgment about a product’s overall excellence or superiority” [52]. Subjective judgment signifies that the assessment of quality is affected by individual product experiences, distinctive needs, and consumption circumstances [25]. Thus, the attribute of perceived service quality is user-based [53], rather than manufacturing-based, and as a result, it lacks a predetermined standard. Instead, it is a function of the extent to which the level of service provided meets the expectations of customers [25], and over time, for a particular firm it indicates whether customer expectations of service quality are fulfilled consistently [54]. The match between actual service performance and expectations of course determines whether customers feel satisfied and to what degree. Previous studies (e.g., [25,34,54,55]) have confirmed that with regard to a place (location), service quality significantly and positively affects satisfaction, and in turn, leads to a better brand attitude toward a location and the positive word-of-mouth which it generates [37]. Kim et al. [21] also revealed that tourist satisfaction results from tangible services (e.g., visual features and accessibility) at a sporting event. Thus, delivering better service quality is considered as a critical anchor [56]. Based on the above discussion, the present research develops the following hypotheses:
Hypotheses H1.
Core transportation service has a significant and positive impact on satisfaction.
Hypotheses H2.
Physical environment of transportation has a significant and positive impact on satisfaction.

3.2. Hypotheses Regarding Satisfaction

Anderson et al. [57] suggested that satisfaction is the overall evaluation of purchased products or services based on earlier experiences. Consumers’ are considered satisfied if the total of their experiences meets or exceeds their expectations [35]. Generally, satisfaction is an evaluation of places or destinations based on what is expected [58]. Zenker and Rütter [37] showed that citizen satisfaction significantly influences the attitude towards a place. Achieving consumer satisfaction is a common goal of place marketing activities.
Lai and Chen [34] noted that while satisfaction with a service and its service have been used interchangeably in the literature, in fact, the differences between them have also been noted. Oliver [59] pointed out that service quality judgments are more specific in character, in contrast to the more holistic nature of satisfaction judgments. Another way to conceive of the distinction is that service quality is a matter of cognitive judgments, but satisfaction involves more affective judgments [34]. In the present study, satisfaction is operationalized as a holistic evaluation following the experience of service delivery [60]. Numerous studies have confirmed that satisfaction has a significant and positive impact on attitudes [25,35] and image [38,61] in various industries. Kim et al. [21] also found that tourist satisfaction significantly affects tourist attitude and destination image at an international sporting event. Accordingly, this study attempts to explore the influence of perceived transportation service quality on passenger satisfaction and, in turn, how it affects passengers’ attitudes toward and image of the host city. Based on the above discussion, the present research develops the following hypotheses:
Hypotheses H3.
Satisfaction has a significant and positive impact on attitude toward a sustainable city.
Hypotheses H4.
Satisfaction has a significant and positive impact on image of a sustainable city.

3.3. Hypotheses Regarding Involvement

Involvement influences individuals’ experiences and the service process [62]. It acts as the shared responsibility between the person and the service provider [63], and is defined as the “perceived relevance of the object based on inherent needs, values, and interests” [33]. Researchers have previously agreed that involvement is related to the significance of a specific product category for a customer or the degree of perceived personal relevance (e.g., [40]). Antil [64] noted that involvement is a reflection of the importance of or interest in a stimulus in a particular location or at a specific time. Laaksonen [65] viewed involvement as the amount or state of perceived importance, attachment, activation, and/or motivation. Richins and Bloch [66] pointed out that customer involvement in a product, if high, will spur significant interest in a product, and searching for information related to it. Thus, involved consumers are characterized by deeper message processing [67,68], being emotionally attached to a brand [69], greater elaboration [70], and more extensive product judgments [71]. As involvement increases, people will put in more cognitive effort and time in decision-making in order to reach a good decision [72]. In addition, Su, Nguyen-Phuoc, and Johnson [73] proposed that high involvement causes the development of stronger and more accessible attitudes toward an object. Frías, Rodríguez, and Castañeda [74] and McGehee, Yoon, and Cardenas [75] showed that involvement significantly influences image-formation about destinations. Moreover, Suh and Yi [76] showed that involvement enhances the effects of satisfaction on corporate image and attitudes. Based on the above discussion, the present research develops the following hypotheses:
Hypotheses H5a.
Involvement will moderate the impact of satisfaction on attitude toward a sustainable city.
Hypotheses H5b.
Involvement will moderate the impact of satisfaction on one’s image of a sustainable city.
Each of the model constructs is defined as follows:
Service quality: the volunteer’s evaluation of the delivered transportation service of the Summer Universiade [52].
Core services: the transportation service that is provided by the host city of the Summer Universiade [77].
Physical environment of transportation: the physical environment of transportation that is provided by the host city of the Summer Universiade [77].
Satisfaction: the degree of overall contentment or pleasure perceived by the Summer Universiade volunteer, as a result of fulfillment of the passenger’s desires, needs and expectation [34].
City attitude: the degree to which a volunteer views the host city of the Summer Universiade favorably or positively [78].
City image: the ideas, impressions and beliefs held by the volunteers vis-à-vis a sustainable city [79].
Involvement: the extent of a volunteer’s interest in transportation, or the importance of the transportation service to that volunteer [34].

4. Methodology

4.1. Measurement

This study used several items to measure each construct so as to overcome measurement errors related to single items [80]. As Appendix A shows, these items were created after a thorough review of the literature on transportation service (including the core transportation service and physical environment of transportation), satisfaction, involvement, city attitudes, and city image. Specifically, the core transportation service and physical environment of transportation were each measured with seven items adapted from studies by Lai and Chen [34]. Satisfaction was measured with four items adapted from studies by Su, Lin, and Chang [81]. Involvement was measured with five items adapted from Wang and Wu [82]. City attitudes were measured with five items adapted from Krystallis and Chrysochou [83]. City image was measured with 12 items adapted from Liu, Wong, Tseng, Chang, and Phau [84]. All items were measured on a 7-point Likert scale ranging from 1 = strongly disagree to 7 = strongly agree.
The wording of these pre-validated multiple-item scales was altered so as to be relevant to the Summer Universiade context. Two government officials with experience with mega-events as well as three academic experts in transportation service evaluated the measurement items for face validity. The items were pre-tested on 32 passengers at the Summer Universiade, after which ambiguities were resolved.

4.2. Data Collection

Convenience sampling was used by six interviewers to distribute a self-administered paper-and-pencil questionnaire to 600 potential respondents at their work and rest areas during the period of 14–28 August 2017. In all, 574 usable questionnaires were collected, for a 95.7% response rate. Using the same way of Hsu and Chen [85], we compare respondents from the two different response groups based on demographic variables and the constructs of interest using an independent sample t test in order to assess the overall homogeneity of the sample. The results display that there are no statistically significant differences between the two different response groups in terms of demographic variables, including gender (p = 0.41) or age (p = 0.39), or in the constructs of interest, including core transportation service (p = 0.52), physical environment of transportation (p = 0.33), satisfaction (p = 0. 26), involvement (p = 0.24), city attitude (p = 0.37), or city image (p = 0.46). These results show that the 574 valid survey responses can be used as a single sample in the following analysis.

5. Findings

5.1. Volunteer Respondents’ Profile

Female respondents (57.1%) outnumbered males (42.9%), as Table 1 indicates. Slightly over half of respondents (53.1%) were 21–30 years of age, with about one quarter (28.2%) under 20 years of age. The majority of respondents is young because participants of Summer Universiade are college students and are aged between 17 and 28, and young people are more fluent in a foreign language and join the volunteer team. Those who rode the bus were a sizable majority (78.2%) of the sample. Respondents who rode the scheduled bus were slightly under a third of the sample (30.5%), and others such as those riding the MRT (subway) accounted for 38.9%. More than half of the sample (52.4%) spent 15–30 min on their most recent ride. More than half of the sample (61.5%) used transportation service during the Summer Universiade less than 2 times, and 23.5% did so 3–4 times.

5.2. Measurement Model Analysis

Smart Partial Least Squares 3.0 (PLS) was applied for statistical analysis. Specifically, this study used PLS, a generally used structural equation modeling method, through SmartPLS [86] to evaluate the instrument validation and analyze the structural model. The PLS structure modeling test technique can handle a complex predictive model testing with no restriction of normal distribution [87]. Additionally, PLS enables the scholar to test the measurement model the and structural model simultaneously [88]. PLS is more appropriate for theory building and predictive applications [89]. Thus, this study follows the procedures to make sure the appropriate use of this technique [90].
As Fornell and Larcker [91] noted, satisfactory convergent validity requires constructs to have composite reliability (CR) of at least 0.70 and average variance extracted (AVE) exceeding 0.50, as well as item loadings above 0.50. The factor loadings, CR, and AVE of all constructs are in Table 2. All constructs in the research model met the recommendations, with CR values from 0.934 to 0.960 and AVE values between 0.567 and 0.856. Each item had a factor loading surpassing 0.60. Discriminant validity was assessed following Hair, Hult, Ringle, and Sarstedt [92], being confirmed by the square root of each construct’s average variance exceeding the correlations between that construct and all others. As Table 3 shows, the square root of the AVE of each construct is located on the diagonal of the table in bold. The empirical data here robustly demonstrate discriminant validity.
To check for potential common method bias, exploratory factor analysis was run on all of the measurement items, showing that the largest variance accounted for by a single factor was 31.65%. As Podsakoff and Organ [93] cautioned, when all variables load onto a single factor, or when most of the variance can be attributed to one factor, there may be common method variance.

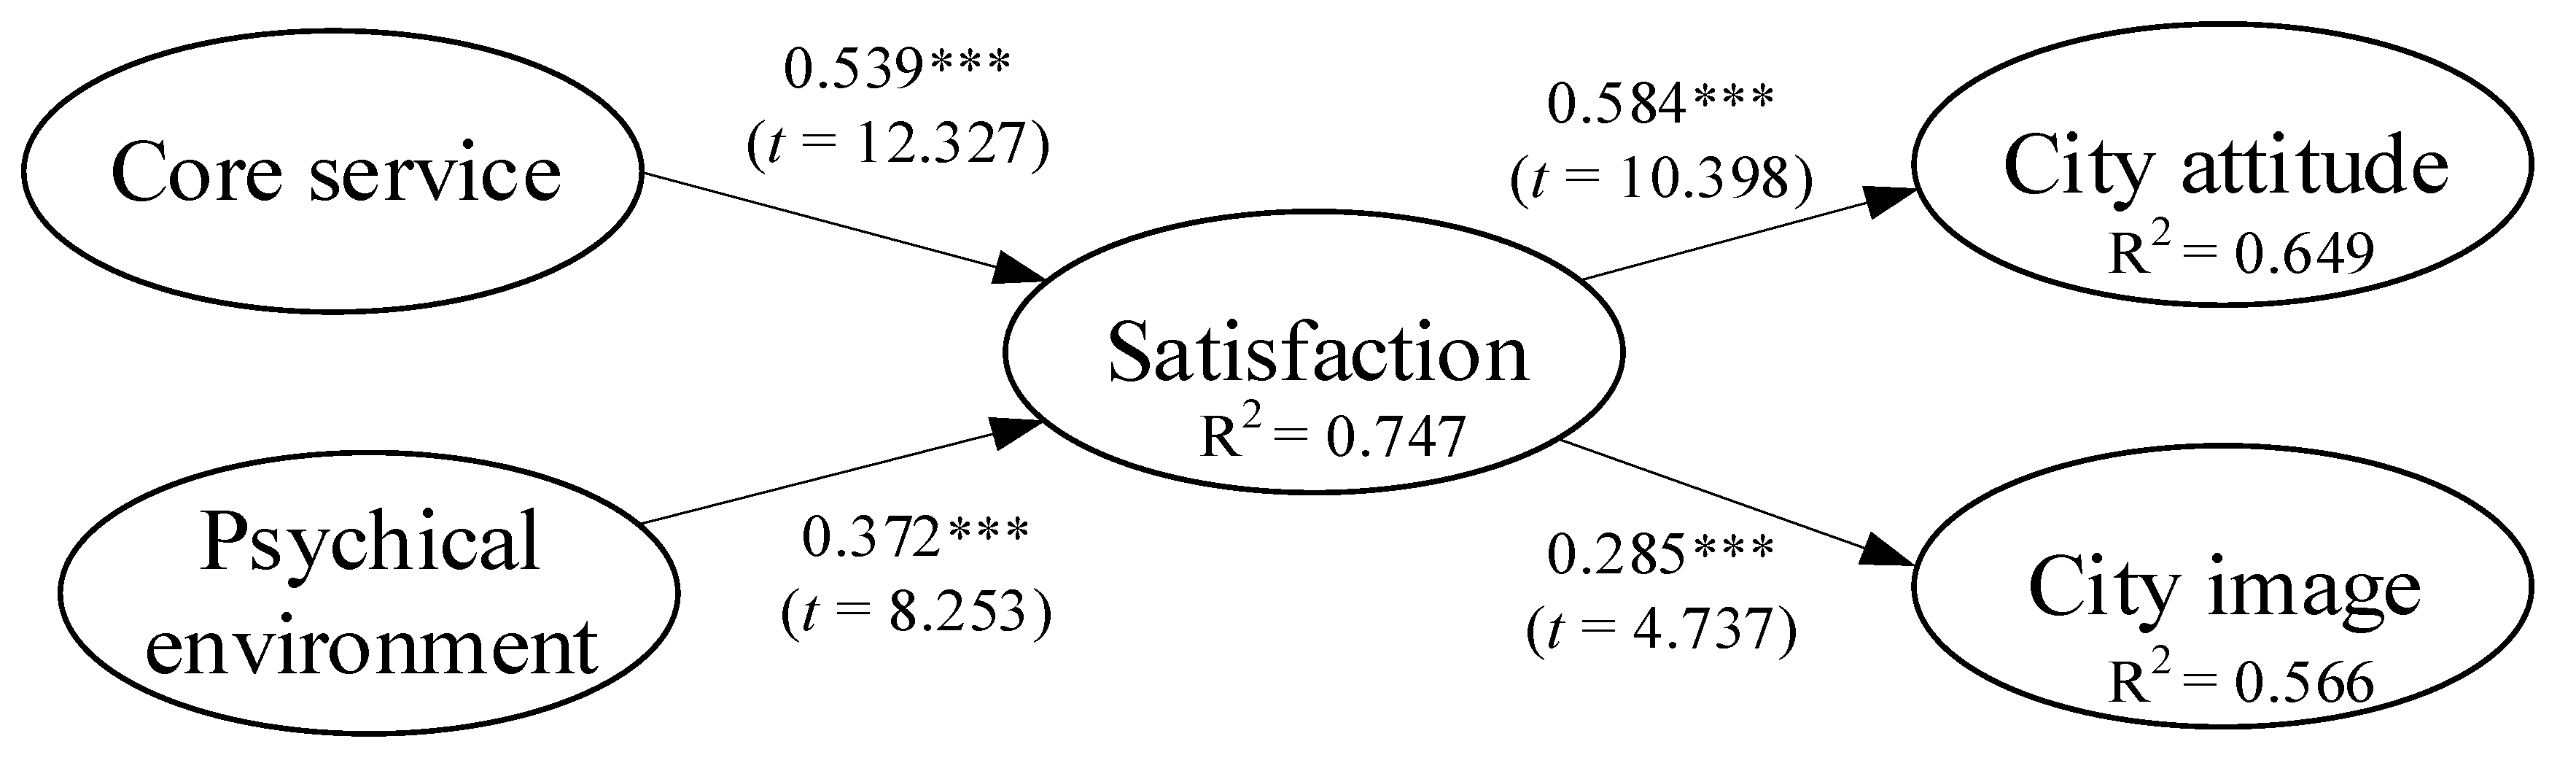
5.3. Structural Model Analysis

Structure equation modeling (SEM) with PLS and bootstrap resampling is used to evaluate the structural model; results are in Figure 2, showing explanatory powers (R2), estimated path coefficients (with significant paths shown by asterisks) and related t-values of each path.
Coefficients for all hypothesized paths were statistically significant. PLS analysis indicated that the exogenous variables explain 74.7% of the variance in volunteers’ satisfaction with the transportation service, 64.9% of that in their attitude toward the city, and 56.6% of variance in their image of the city. All antecedent variables of satisfaction were statistically significant. The core transportation service and its physical environment showed stronger impacts than other variables on satisfaction toward this service during the Summer Universiade, with path coefficients of 0.539 and 0.372, respectively. The path coefficients of two consequences, city attitude and city image, were statistically significant, at 0.584 and 0.285, respectively.
Like Koo and Lee [78], the present study used partial least squares-multi-group analysis (PLS-MGA) to test for the influence of involvement on the paths between satisfaction and city attitude and between satisfaction and city image. The difference between the paths from satisfaction to city attitude for high (n = 300) and low (n = 274) involvement was statistically significant (β = 0.584, p < 0.001), as was that between the paths from satisfaction to city image for high (n = 300) and low (n = 274) involvement (β = 0.285, p < 0.001). Involvement is thus shown to significantly moderate the effect of satisfaction on both city attitude and city image. H5a and H5b were supported.
The method suggested by Preacher and Hayes [94] in PLS-SEM was also employed, as it tends to have greater statistical power than the Sobel test [79], and also allows proper interpretation of the indirect effect; it is thus also more suitable than Baron and Kenny’s [95] method [83]. Significance of the direct path suffices to demonstrate the mediating effect of satisfaction on the link between core transportation service and physical environment of transportation on the one hand, and city attitude and city image on the other. This significance is tested by confidence intervals (CI) because the indirect effect of the two parameters is not normally distributed [96]. Using such an approach, Zhao et al. [96] suggested two dimensions—an indirect effect and direct effect—rather than Baron and Kenny’s [95] one-dimensional full-partial-no scale. There are significant indirect paths from the core transportation service itself (β = 0.195) as well as its physical environment (β = 0.134) to city attitude, and the 95% CI excludes zero (0.005 to 0.160). The indirect paths from core transportation service (β = 0.241) and its physical environment (β = 0.117) to city image are also significant, with a 95% CI excluding zero (0.068 to 0.220). This produces confirmation that the relationship between the service quality provided (i.e., core transportation service and its physical environment) and city attitude and city image are mediated by satisfaction.

6. Discussion

Mega-events generate substantial economic benefits [97], and thus most research focuses on a macro rather than a micro view [25]. As a result, little mega-event research has investigated perceptions of a transportation service. Service quality is important to the success of mega-events, and thus understanding perceptions of transportation service and its impacts on the host city is quite important. To contribute to this research domain, this study aims at investigating the constructed relationship model considering service quality (including the core transportation service and physical environment of transportation), satisfaction, involvement, city attitude, and city image. The relationship model was verified by applying data from a volunteer questionnaire survey at the Summer Universiade in Taiwan. The results of the relationship between core transportation service, physical environment of transportation, satisfaction, involvement, city attitude, and city image suggest critical implications for the host city of mega-events.

6.1. Theoretical Implications

In terms of theoretical implications, the results indicate that volunteers’ attitude toward and image of a sustainable city significantly depend on their satisfaction with the transportation service. To increase volunteer satisfaction, two antecedents, i.e., the core transportation service and the physical environment of transportation, must be highlighted. Core transportation service and its physical environment are measured by way of volunteer evaluations of the service attributes of transportation services. Identifying the attributes which passengers care about most and striving to offer excellent service quality are necessary to ensure satisfaction. Based on the results, it is concluded that core transportation service, including such elements as frequency, provision hours, destinations, information provision, reserving, drivers’ behavior, and complaint resolution, as well as the physical environment of transportation, such as platforms and transportation vehicles, all have significant influences on satisfaction. The results can provide valuable information for the host city of mega-events to ensure that service quality meets or exceeds passenger expectations. However, offering high-quality service could increase the budget and be costly for the host city of mega-events, and this might offset any benefit obtained such as improvement in satisfaction, city attitude and image, as found in this study.
Another theoretical contribution of this study is to investigate the moderating role of involvement in transportation service on the link between satisfaction and city attitude and between satisfaction and city image in a mega-event context. We identified empirically that the relationships between satisfaction and city attitude, as well as between satisfaction and city image, were moderated by involvement in the transportation service. The impact of satisfaction on city attitude and city image will be more critical to those who are greatly involved in the transportation service than for those with a low transportation service involvement level. Ko et al. [98] also proposed that involvement in a transportation service positively influences image, and the finding denotes that passengers who are highly involved in the event may concentrate more on the transportation service than less involved passengers. Besides, involvement may be related to volunteer expertise in transportation services. Volunteers highly involved in the transportation service might form city attitude and image similarly to the event participants (e.g., athletes, officials, staff and so on), whereas those who are less involved in the transportation service might form city attitude and image similarly to non-participants. Thus, in terms of mega-events, while offering quality transportation services is vital, in addition to improving passengers’ involvement with the usage of advertisements or informational brochures, the host city can draw upon the experience of high-involvement volunteers in order to improve service quality, so that the attitude toward and image of the host city or country will be improved.

6.2. Practical Implications

Although both attitude toward and image of a sustainable city are difficult for the host city organizers of mega-events to change or control, and tourists’ images of a host city can form easily before they travel according to information from media, advertisements, and word-of-mouth [99], the host city organizers still have opportunities to use the host city (destination) image to establish more practical and effective marketing strategies [21]. In this study, both core transportation service and physical environment of transportation significantly affect satisfaction, which in turn, affects attitude toward and image of a sustainable city. Thus, we suggest that the host city organizers of mega-events should endeavor to provide excellent transportation service quality and a physical environment of transportation to ensure that passengers perceive quality as a symbol of the city, thus maximizing satisfaction with transportation services associated with sporting events. Specifically, because this study has confirmed that core transportation service significantly affects satisfaction, the host city organizers of mega-events should provide the appropriate frequency and provision hours of the transportation service, immediate complaint resolution, sufficient destinations and information provision of the transportation service, as well as easy reservation of the transportation service. In particular, transportation service providers usually provide drivers with good training and management mechanisms to ensure excellent driving behavior.
Additionally, the host city organizers of mega-events must also focus on the physical environment of transportation (e.g., platform and transportation bus) for the sporting event, as this study finds that the physical environment of transportation is significantly related to satisfaction. Specifically, the host city organizers of mega-events should make sure the platforms are safe and the conditions at platforms are good. The host city organizers of mega-events also should keep the facilities at platforms clean and onboard information provided at platforms clear. As for the transportation service providers, they should keep transportation buses clean and safe, as well as guarantee the bus rides smoothly. In short, satisfaction with core transportation service and physical environment of transportation will be helpful to increase attitude toward and image of a sustainable city, and further facilitate revisiting intention and accomplishing a sustainable city.

6.3. Limitations and Directions for Further Study

The current study is not without limitations. First, the questionnaire was administered only to Taiwanese volunteers and the majority of them are mainly students and aged between 17 and 28, so the results may not be easily generalized. Also, this study was conducted at a single mega-event. Future research should study other mega-events and those in other countries for verification of the findings. Furthermore, even if convenience sampling was used to collect subjects due to their convenient accessibility and proximity to the researcher, it fails to be representative of the total population. Hence, future research should use a probability sampling method to obtain the respondents for attaining representativeness of the entire population. Additionally, this study mainly investigated the effects of core service and physical environment on satisfaction, which in turn, affected attitude toward and image of a sustainable city. However, the interaction effect of core service and physical environment on satisfaction may happen. Thus, consistent with Yuen and Thai [100] and Yuen, Thai, Wong, and Wang [101], this study suggests further analysis on the interaction effect of core service and physical environment on satisfaction. Conducting these potential studies will provide additional implications for the host city organizers of mega-events and transportation service providers. In addition, another limitation of this study is that it merely analyzes the moderating effect of involvement on the links between volunteer satisfaction and city attitude and between satisfaction and city image in a mega-event context. However, as proposed by Yuen, Thai, and Wong [102], future research can explore other moderators anchored on diverse theoretical lenses. A potential moderator can be the types of transport service user (i.e., tourist and citizen). Thus, future research should consider conducting the moderating role of the types of transport service user that enriches research in this area and offers explanations for the differences between tourists and citizens in transport service users’ satisfaction, attitude toward and image of a sustainable city and, subsequently, managerial implications for the host city organizers of mega-events and transportation service provider. Besides, in this study, the satisfaction with transportation service significantly influences one’s attitude toward and image of the host city. Future research should investigate other factors that influence city attitude and city image, such as perceived value. Volunteers experience the transportation services, and the perceived service quality significantly impacts their satisfaction. However, there may be other factors that influence satisfaction, such as volunteer motivations. Thus, future studies can investigate the relationships between volunteer motivations and satisfaction.

7. Conclusions

The theoretical contribution of this study lies in it is being almost the first study to recognize the mediating effect of satisfaction in the relationships between transportation service quality, and both attitude toward and image of a sustainable city, as well as the moderating effect of involvement in the links between satisfaction and attitude and between satisfaction and image at a mega-event, the Summer Universiade. Satisfaction with core transportation service and physical environment of transportation plays the role of significant mediator in the relationship between transportation service quality and attitude toward and image of a sustainable city. In other words, the results show that excellent perception with a core transportation service and the physical environment of transportation is more likely to influence satisfaction, which in turn, affects attitude toward and image of a sustainable city. Moreover, this study also confirms that involvement significantly moderates the impact of satisfaction on attitude toward and image of a sustainable city. The results mean that people heavily involved in the transportation service will lead to a higher effect of satisfaction on attitude toward and image of a sustainable city. Therefore, the host city organizers of mega-events should pay particular attention to transportation services such as the core transportation service and physical environment of transportation to maximize the positive impact of satisfaction on attitude toward and image of a sustainable city. The findings of this study will expand the growing literature on attitude toward and image of a sustainable city at mega-events and offer valuable facts for further research and practical marketing strategies.

Author Contributions

Conceptualization, M.-C.C., C.-L.H. and M.-M.C.; data curation, M.-C.C., C.-L.H.; formal analysis, M.-C.C., C.-L.H. and M.-M.C.; investigation, C.-L.H.; methodology, M.-C.C., C.-L.H. and M.-M.C.; project administration, M.-C.C.; supervision, M.-C.C.; validation, C.-L.H. and M.-M.C.; writing—original draft, C.-L.H. and M.-M.C.; writing—review & editing, M.-C.C.

Funding

This research received no external funding.

Conflicts of Interest

The authors declare no conflict of interest.

Appendix A. Scale Items

Table A1. Constructs and adapted items.
ConstructAdapted Item
Core transportation serviceCS1. I feel the frequency of the transportation service is appropriate.
CS2. I feel the provision hours of the transportation service are appropriate.
CS3. I feel the destinations of the transportation service are sufficient.
CS4. I feel the information provision of the transportation service is sufficient.
CS5. I feel reserving the transportation service is easy.
CS6. I feel the behavior of the transportation service drivers is good.
CS7. I feel the complaint resolution of the transportation service is good.
Physical environment of transportationPE1. I feel the conditions at platforms are good.
PE2. I feel the facilities at platforms are clean.
PE3. I feel the platforms are safe.
PE4. I feel onboard information provided at platforms is clear.
PE5. I feel the transportation bus is clean.
PE6. I feel the transportation bus is safe.
PE7. I feel the transportation bus rides smoothly.
SatisfactionSA1. The experience that I have had with the transportation service of the Summer Universiade has been satisfactory.
SA2. In general terms, I am satisfied with the way that the Summer Universiade has carried out transportation bus service.
SA3. In general, I am satisfied with the transportation service I have received from the Summer Universiade.
SA4. I am happy that I took the transportation bus service provided by the host city of the Summer Universiade.
InvolvementIN1. While participating in the Summer Universiade on this occasion, I have a high level of interest in the transportation service process of the Summer Universiade.
IN2. On this Summer Universiade occasion, I put a lot of effort into the transportation service of the Summer Universiade.
IN3. Because of my personality, I would rate the transportation service of the Summer Universiade as being of the highest importance to me personally.
IN4. I can make many connections or associations between important experiences in my life and the transportation service of the Summer Universiade.
IN5. In general, the transportation service of the Summer Universiade allows others to see me as I would ideally like them to see me.
City attitudeCA1. Overall I think the transportation service of the host city (Taipei) is very good.
CA2. Overall I think the host city (Taipei) has a nice transportation service.
CA3. Overall I think the transportation service of the host city (Taipei) is very attractive.
CA4. Overall I think the transportation service of the host city (Taipei) is desirable.
CA5. Overall I think the transportation service of the host city (Taipei) is extremely likeable.
City imageCI1. The host city (Taipei) is comfortable.
CI2. The host city (Taipei) offers a high level of service.
CI3. The host city (Taipei) is luxurious.
CI4. The host city (Taipei) is expensive.
CI5. The host city (Taipei) is a suitable place for high class.
CI6. I become special by visiting the host city (Taipei).
CI7. The staff are very kind.
CI8. The host city (Taipei) is big and spacious.
CI9. The host city (Taipei) is quiet and restful.
CI10. Service sometimes seems excessive to me.
CI11. The host city (Taipei) has a long history.
CI12. The host city (Taipei) has a differentiated image from other cities.

References

  1. Kim, N.S.; Chalip, L. Why travel to the FIFA World Cup? Effects of motives, background, interest, and constraints. Tour. Manag. 2004, 25, 695–707. [Google Scholar] [CrossRef]
  2. Lee, C.K.; Taylor, T. Critical reflections on the economic impact assessment of a mega-event: The case of 2002 FIFA World Cup. Tour. Manag. 2005, 26, 595–603. [Google Scholar] [CrossRef]
  3. Gelan, A. Local economic impacts: The British Open. Ann. Tour. Res. 2003, 30, 406–425. [Google Scholar] [CrossRef]
  4. Kim, S.S.; Morrison, A.M. Change of images of South Korea among foreign tourists after the 2002 FIFA World. Tour. Manag. 2005, 26, 233–247. [Google Scholar] [CrossRef]
  5. Gratton, C.; Dobson, N.; Shibli, S. The economic importance of major sports events: A case-study of six events. Manag. Leis. 2000, 5, 17–28. [Google Scholar] [CrossRef]
  6. Weed, M. Towards a model of cross-sectoral policy development in leisure: The case of sport and tourism. Leis. Stud. 2001, 20, 125–142. [Google Scholar] [CrossRef]
  7. Kim, S.S.; Petrick, J.F. Residents’ perceptions on impacts of the FIFA 2002 World Cup: The case of Seoul as a host city. Tour. Manag. 2005, 26, 25–38. [Google Scholar] [CrossRef]
  8. Ritchie, J.R.B. Assessing the impact of hallmark events: Conceptual and research issues. J. Travel Res. 1984, 23, 2–11. [Google Scholar] [CrossRef]
  9. Green, B.C.; Chalip, L. Sport tourism as the celebration of subculture. Ann. Tour. Res. 1998, 25, 275–291. [Google Scholar] [CrossRef]
  10. Kim, J.; Kang, J.H.; Kim, Y.K. Impact of mega sport events on destination image and country image. Sport Mark. Q. 2014, 23, 161–175. [Google Scholar]
  11. Lee, C.K.; Taylor, T.; Lee, Y.K.; Lee, B. The impact of a sport mega-event on destination image: The case of the 2002 FIFA World Cup Korea/Japan. Int. J. Hosp. Tour. Adm. 2005, 6, 27–45. [Google Scholar] [CrossRef]
  12. Arnegger, J.; Herz, M. Economic and destination image impacts of mega-events in emerging tourist destinations. J. Destin. Mark. Manag. 2016, 5, 76–85. [Google Scholar] [CrossRef]
  13. Castro, S.B.E.D.; Starepravo, F.A.; Coakley, J.; Souza, D.L.D. Mega sporting events and public funding of sport in Brazil (2004–2011). Leis. Stud. 2016, 35, 369–386. [Google Scholar] [CrossRef]
  14. Deng, Q.; Li, M. A model of event-destination image transfer. J. Travel Res. 2014, 53, 69–82. [Google Scholar] [CrossRef]
  15. Stepchenkova, S.; Mills, J.E. Destination Image: A meta-analysis of 2000–2007 research. J. Hosp. Mark. Manag. 2010, 19, 575–609. [Google Scholar] [CrossRef]
  16. Absalyamov, T. The influence of cultural and sport mega-events on sustainable development of the city. Procedia Soc. Behav. Sci. 2015, 188, 197–201. [Google Scholar] [CrossRef]
  17. Müller, M. What makes an event a mega-event? Definitions and sizes. Leis. Stud. 2015, 34, 627–642. [Google Scholar] [CrossRef]
  18. Wang, M.; Bao, H.X. Mega-event effects on the housing market: Evidence from the Beijing 2008 Olympic Games. Cities 2018, 72, 207–216. [Google Scholar] [CrossRef]
  19. Werner, K.; Dickson, G.; Hyde, K.F. Mega-events and increased collaborative capacity of tourism destinations: The case of the 2011 Rugby World Cup. J. Destin. Mark. Manag. 2016, 5, 227–238. [Google Scholar] [CrossRef]
  20. Nunkoo, R.; Ribeiro, M.A.; Sunnassee, V.; Gursoy, D. Public trust in mega event planning institutions: The role of knowledge, transparency and corruption. Tour. Manag. 2018, 66, 155–166. [Google Scholar] [CrossRef]
  21. Kim, S.K.; Park, J.A.; Kim, W. The mediating effect of destination image on the relationship between spectator satisfaction and behavioral intentions at an international sporting event. Asia Pac. J. Tour. Res. 2016, 21, 273–292. [Google Scholar] [CrossRef]
  22. Dickson, T.J.; Benson, A.M.; Terwiel, F.A. Mega-event volunteers, similar or different? Vancouver 2010 vs. London 2012. Int. J. Event Festiv. Manag. 2014, 5, 164–179. [Google Scholar] [CrossRef]
  23. Downward, P.M.; Ralston, R. The sports development potential of sports event volunteering: Insights from the XVII Manchester Commonwealth Games. Eur. Sport Manag. Q. 2006, 6, 333–351. [Google Scholar] [CrossRef]
  24. Qi, H.; Smith, K.A.; Yeoman, I. What motivates volunteers to help at business events? Reciprocal altruism and reflexivity. Asia Pac. J. Tour. Res. 2018, 23, 989–999. [Google Scholar] [CrossRef]
  25. Lee, C.K.; Reisinger, Y.; Kim, M.J.; Yoon, S.M. The influence of volunteer motivation on satisfaction, attitudes, and support for a mega-event. Int. J. Hosp. Manag. 2014, 40, 37–48. [Google Scholar] [CrossRef]
  26. Ralston, R.; Lumsdon, L.; Downward, P. The third force in events tourism: Volunteers at the XVII Commonwealth Games. J. Sustain. Tour. 2005, 13, 504–519. [Google Scholar] [CrossRef]
  27. Currie, C.; Falconer, P. Maintaining sustainable island destinations in Scotland: The role of the transport–tourism relationship. J. Destin. Mark. Manag. 2014, 3, 162–172. [Google Scholar] [CrossRef]
  28. Van Truong, N.; Shimizu, T. The effect of transportation on tourism promotion: Literature review on application of the Computable General Equilibrium (CGE) Model. Transp. Res. Procedia 2017, 25, 3096–3115. [Google Scholar] [CrossRef]
  29. Le-Klaehn, D.T.; Hall, C.M. Tourist use of public transport at destinations—A review. Curr. Issues Tour. 2015, 18, 785–803. [Google Scholar] [CrossRef]
  30. Naudé, W.A.; Saayman, A. Determinants of tourist arrivals in Africa: A panel data regression analysis. Tour. Econ. 2005, 11, 365–391. [Google Scholar] [CrossRef]
  31. Berry, L.B.; Zeithaml, V.A.; Parasuraman, A. A multiple-item scale for measuring consumer perceptions of service quality. J. Retail. 1988, 64, 12–40. [Google Scholar]
  32. Pai, F.Y.; Yeh, T.M.; Tang, C.Y. Classifying restaurant service quality attributes by using Kano model and IPA approach. Total Qual. Manag. Bus. Excell. 2018, 29, 301–328. [Google Scholar] [CrossRef]
  33. Parasuraman, A.; Zeithaml, V.A.; Berry, L.L. Reassessment of expectations as a comparison standard in measuring service quality: Implications for further research. J. Mark. 1994, 58, 111–124. [Google Scholar] [CrossRef]
  34. Lai, W.T.; Chen, C.F. Behavioral intentions of public transit passengers-The roles of service quality, perceived value, satisfaction and involvement. Transp. Policy 2011, 18, 318–325. [Google Scholar] [CrossRef]
  35. Choi, Y.H.; Choo, H.J. Effects of Chinese consumers’ relationship benefits and satisfaction on attitudes toward foreign fashion brands: The moderating role of country of salesperson. J. Retail. Consum. Serv. 2016, 28, 99–106. [Google Scholar] [CrossRef]
  36. Lee, J.S.; Lee, C.K.; Park, C.K. Developing and validating a multidimensional quality scale for mega-events. Int. J. Hosp. Manag. 2014, 43, 121–131. [Google Scholar] [CrossRef]
  37. Zenker, S.; Rütter, N. Is satisfaction the key? The role of citizen satisfaction, place attachment and place brand attitude on positive citizenship behavior. Cities 2014, 38, 11–17. [Google Scholar] [CrossRef]
  38. Jani, D.; Han, H. Personality, satisfaction, image, ambience, and loyalty: Testing their relationships in the hotel industry. Int. J. Hosp. Manag. 2014, 37, 11–20. [Google Scholar] [CrossRef]
  39. Olsen, S.O. Repurchase loyalty: The role of involvement and satisfaction. Psychol. Mark. 2007, 24, 315–341. [Google Scholar] [CrossRef]
  40. Zaichkowsky, J.L. The personal involvement inventory: Reduction, revision, and application to advertising. J. Advert. 1994, 23, 59–70. [Google Scholar] [CrossRef]
  41. Hsu, C.L.; Chen, Y.C.; Yang, T.N.; Lin, W.K.; Liu, Y.H. Does product design matter? Exploring its influences in consumers’ psychological responses and brand loyalty. Inf. Technol. People 2018, 31, 886–907. [Google Scholar] [CrossRef]
  42. Getz, D. Event Management and Event Tourism; Cognizant Communication Corporation: New York, NY, USA, 1997. [Google Scholar]
  43. Getz, D. Event Management and Event Tourism, 2nd ed.; Cognizant: New York, NY, USA, 2005. [Google Scholar]
  44. Jago, L.; Shaw, R. Special events: A conceptual and definitional framework. Festiv. Manag. Event Tour. 1998, 5, 21–32. [Google Scholar] [CrossRef]
  45. Roche, M. Mega-Events and Modernity: Olympics and Expos in the Growth of Global Culture; Routledge: London, UK, 2000. [Google Scholar]
  46. Lim, S.T.; Lee, J.S. Host population perceptions of the impact of mega-events. Asia Pac. J. Tour. Res. 2006, 11, 407–421. [Google Scholar]
  47. Getz, D. Event tourism: Definition, evolution, and research. Tour. Manag. 2008, 29, 403–428. [Google Scholar] [CrossRef]
  48. Taipei City Government. City News. 2017. Available online: https://www.gov.taipei/News_Content.aspx?n=F0DDAF49B89E9413&sms=72544237BBE4C5F6&s=9E2F19C77D5BBF27 (accessed on 2 October 2019).
  49. Taipei City Government. City News. 2017. Available online: http://tcgwww.taipei.gov.tw/ct.asp?xItem=362035961&ctNode=82924&mp=108051M (accessed on 2 October).
  50. Tyrinopoulos, Y.; Antoniou, C. Public transit user satisfaction: Variability and policy implications. Transp. Policy 2008, 15, 260–272. [Google Scholar] [CrossRef]
  51. Transportation Research Board. Transit Capacity and Quality of Service Manual, 2nd ed.; TRCP Report 100; Transportation Research Board: Washington, DC, USA, 2003. [Google Scholar]
  52. Zeithaml, V.A. Consumer perceptions of price quality, and value: A means-end model and synthesis of evidence. J. Mark. 1988, 52, 2–22. [Google Scholar] [CrossRef]
  53. Garvin, D.A. Quality on the line. Harv. Bus. Rev. 1983, 61, 65–73. [Google Scholar]
  54. Joewono, T.B.; Kubota, H. User satisfaction with paratransit in competition with motorization in Indonesia: Anticipation of future implications. Transportation 2007, 34, 337–354. [Google Scholar] [CrossRef]
  55. Grujičić, D.; Ivanović, I.; Jović, J.; Đorić, V. Customer perception of service quality in public transport. Transport 2014, 29, 285–295. [Google Scholar] [CrossRef] [Green Version]
  56. Anderson, C.R.; Zeithaml, C.P. Stage of the product life cycle, business strategy, and business performance. Acad. Manag. J. 1984, 27, 5–24. [Google Scholar]
  57. Anderson, E.W.; Fornell, C.; Lehmann, D.R. Customer satisfaction, market share, and profitability: Findings from Sweden. J. Mark. 1994, 58, 53–66. [Google Scholar] [CrossRef]
  58. Guntoro, B.; Hui, T.K. Travel satisfaction and revisit intention of Chinese visitors: The case of Singapore. Adv. Hosp. Leis. 2013, 9, 29–47. [Google Scholar]
  59. Oliver, R. Satisfaction: A Behavioural Perspective on the Consumer; McGraw-Hill: New York, NY, USA, 1997. [Google Scholar]
  60. Chen, C.F. Investigating structural relationships between service quality, perceived value, satisfaction, and behavioral intentions for air passengers: Evidence from Taiwan. Transp. Res. Part A Policy Pract. 2008, 42, 709–717. [Google Scholar] [CrossRef]
  61. Hu, H.H.; Kandampully, J.; Juwaheer, T.D. Relationships and impacts of service quality, perceived value, customer satisfaction, and image: An empirical study. Serv. Ind. J. 2009, 29, 111–125. [Google Scholar] [CrossRef]
  62. Lundkvist, A.; Yakhlef, A. Customer involvement in new service development: A conversational approach. Manag. Serv. Qual. Int. J. 2004, 14, 249–257. [Google Scholar] [CrossRef] [Green Version]
  63. Sierra, J.J.; McQuitty, S. Service providers and customers: Social exchange theory and service loyalty. J. Serv. Mark. 2005, 19, 392–400. [Google Scholar] [CrossRef]
  64. Antil, J.H. Conceptualization and operationalization of involvement. In Advances in Consumer Research; Kinnear, T.C., Ed.; Association for Consumer Research: Provo, UT, USA, 1984; Volume 11, pp. 203–209. [Google Scholar]
  65. Laaksonen, P. Consumer Involvement: Concepts and Research; Routledge: London, UK, 1994. [Google Scholar]
  66. Richins, M.L.; Bloch, P.H. After the new wears off: The temporal context of product involvement. J. Consum. Res. 1986, 13, 280–285. [Google Scholar] [CrossRef]
  67. Burnkrant, R.; Sawyer, A. Effects of involvement and message content on information-processing intensity. Inf. Process. Res. Advert. 1983, 12, 46–64. [Google Scholar]
  68. Andrews, J.C.; Durvasula, S.; Akhter, S.H. A framework for conceptualizing and measuring the involvement construct in advertising research. J. Advert. 1990, 19, 27–40. [Google Scholar] [CrossRef]
  69. Zheng, X.; Cheung, C.M.; Lee, M.K.; Liang, L. Building brand loyalty through user engagement in online brand communities in social networking sites. Inf. Technol. People 2015, 28, 90–106. [Google Scholar] [CrossRef]
  70. Petty, R.E.; Cacioppo, J.T. The Elaboration Likelihood Model of Persuasion; Springer: New York, NY, USA, 1986; pp. 1–24. [Google Scholar]
  71. Robertson, T. Low commitment consumer behavior. J. Advert. Res. 1976, 16, 19–24. [Google Scholar]
  72. Punj, G.; Moore, R. Information search and consideration set formation in a web-based store environment. J. Bus. Res. 2009, 62, 644–650. [Google Scholar] [CrossRef]
  73. Su, D.N.; Nguyen-Phuoc, D.Q.; Johnson, L.W. Effects of perceived safety, involvement and perceived service quality on loyalty intention among ride-sourcing passengers. Transportation 2019. [Google Scholar] [CrossRef]
  74. Frías, D.M.; Rodríguez, M.A.; Castañeda, J.A. Internet vs. travel agencies on pre-visit destination image-formation: An information processing view. Tour. Manag. 2008, 29, 163–179. [Google Scholar]
  75. McGehee, N.G.; Yoon, Y.; Cardenas, D. Involvement and travel for recreational runners in North Carolina. J. Sport Manag. 2003, 17, 305–324. [Google Scholar] [CrossRef]
  76. Suh, J.C.; Yi, Y. When brand attitudes affect the customer satisfaction-loyalty relation: The moderating role of product involvement. J. Consum. Psychol. 2006, 16, 145–155. [Google Scholar] [CrossRef]
  77. Lovelock, C.H.; Wirtz, J. Services Marketing: People, Technology, Strategy, 7th ed.; Prentice Hall: Upper Saddle River, NJ, USA, 2010. [Google Scholar]
  78. Koo, J.; Lee, Y. Sponsor-event congruence effects: The moderating role of sport involvement and mediating role of sponsor attitudes. Sport Manag. Rev. 2019, 22, 222–234. [Google Scholar] [CrossRef]
  79. Kotler, P. A Framework for Marketing Management; Prentice Hall: Upper Saddle River, NJ, USA, 2001. [Google Scholar]
  80. Churchill, G.A. A paradigm for developing better measures of marketing constructs. J. Mark. Res. 1979, 16, 64–73. [Google Scholar] [CrossRef]
  81. Su, Y.L.; Lin, T.M.; Chang, S.T. Exploring the impact factor of positive word-of-mouth influences satisfied customers. Total Qual. Manag. Bus. Excell. 2015, 26, 430–444. [Google Scholar] [CrossRef]
  82. Wang, C.; Wu, L.W. Reference effects on revisit intention: Involvement as a moderator. J. Travel Tour. Mark. 2011, 28, 817–827. [Google Scholar] [CrossRef]
  83. Krystallis, A.; Chrysochou, P. The effects of service brand dimensions on brand loyalty. J. Retail. Consum. Serv. 2014, 21, 139–147. [Google Scholar] [CrossRef]
  84. Liu, M.T.; Wong, I.A.; Tseng, T.H.; Chang, A.W.Y.; Phau, I. Applying consumer-based brand equity in luxury hotel branding. J. Bus. Res. 2017, 81, 192–202. [Google Scholar] [CrossRef]
  85. Hsu, C.L.; Chen, M.C. How gamification marketing activities motivate desirable consumer behaviors: Focusing on the role of brand love. Comput. Hum. Behav. 2018, 88, 121–133. [Google Scholar] [CrossRef]
  86. Ringle, C.M.; Wende, S.; Will, A. SmartPLS 2.0 M3. 2005. Available online: http://www.smartpls.de/ (accessed on 20 November 2019).
  87. Chin, W.W. The Partial Least Squares Approach to Structural Equation Modeling Modern Methods for Business Research; Lawrence Erlbaum Associates: Mahwah, NJ, USA, 1998. [Google Scholar]
  88. Lohmoller, J.B. Latent variable path modeling with partial least squares. Cogn. Sci. 1989, 4, 333–369. [Google Scholar]
  89. Chin, W.W. Overview of the PLS Method. 1997. Available online: http://disc-nt.cba.uh.edu/chin/PLSINTRO.HTM (accessed on 20 November 2019).
  90. Chin, W.W. Commentary: Issues and opinions on structural equation modeling. MIS Q. 1998, 22, 7. [Google Scholar]
  91. Fornell, C.R.; Larcker, F.F. Structural equation models with unobservable variables and measurement error. J. Mark. Res. 1981, 18, 39–50. [Google Scholar] [CrossRef]
  92. Hair, J.F.; Hult, G.T.M.; Ringle, C.M.; Sarstedt, M. A Primer on Partial Least Squares Structural Equation Modeling (PLS-SEM), 2nd ed.; Sage: Thousand Oaks, CA, USA, 2016. [Google Scholar]
  93. Podsakoff, P.M.; Organ, D.W. Self-reports in organizational research: Problems and prospects. J. Manag. 1986, 12, 531–544. [Google Scholar] [CrossRef]
  94. Preacher, K.J.; Hayes, A.F. Asymptotic and resampling strategies for assessing and comparing indirect effects in multiple mediator models. Behav. Res. Methods 2008, 40, 879–891. [Google Scholar] [CrossRef]
  95. Baron, R.M.; Kenny, D.A. The moderator-mediator variable distinction in social psychological research: Conceptual, strategic, and statistical considerations. J. Personal. Soc. Psychol. 1986, 51, 1173–1182. [Google Scholar] [CrossRef]
  96. Zhao, X.; Lynch, J.G.; Chen, Q. Reconsidering Baron and Kenny: Myths and truths about mediation analysis. J. Consum. Res. 2010, 37, 197–206. [Google Scholar] [CrossRef]
  97. Choe, Y.; Park, H.Y.; Kim, D.K. Holding or not holding a mega-event: Case of the F1 Korea Grand Prix. Asia Pac. J. Tour. Res. 2017, 22, 88–98. [Google Scholar] [CrossRef]
  98. Ko, Y.J.; Kim, K.; Claussen, C.L.; Kim, T.H. The effects of sport involvement: Sponsor awareness and corporate image on intention to purchase sponsors’ products. Int. J. Sports Mark. Spons. 2008, 9, 79–94. [Google Scholar] [CrossRef]
  99. Mercille, J. Media effects on image: The case of Tibet. Ann. Tour. Res. 2005, 32, 1039–1055. [Google Scholar] [CrossRef]
  100. Yuen, K.F.; Thai, V.V. Service quality appraisal: A study of interactions. Total Qual. Manag. Bus. Excell. 2017, 28, 730–745. [Google Scholar] [CrossRef]
  101. Yuen, K.F.; Thai, V.V.; Wong, Y.D. An investigation of shippers’ satisfaction and behaviour towards corporate social responsibility in maritime transport. Transp. Res. Part A Policy Pract. 2018, 116, 275–289. [Google Scholar] [CrossRef]
  102. Yuen, K.F.; Thai, V.V.; Wong, Y.D.; Wang, X. Interaction impacts of corporate social responsibility and service quality on shipping firms’ performance. Transp. Res. Part A Policy Pract. 2018, 113, 397–409. [Google Scholar] [CrossRef]
Figure 1. The research model.
Sustainability 11 06813 g001
Figure 2. Partial least squares (PLS) results of research model (*** p < 0.001).
Sustainability 11 06813 g002
Table 1. The profile of respondents (sample size: 574).
CharacteristicsFrequency (%)
Gender
Male246 (42.9)
Female328 (57.1)
Age
Under 20162 (28.2)
21–30305 (53.1)
31–4070 (12.2)
41–5017 (3.0)
Over 5120 (3.5)
What kind of vehicle was your last ride
Taxi (Car)44 (7.7)
Van13 (2.3)
Bus449 (78.2)
Other (e.g., MRT)68 (11.8)
What kind of transportation service was your last ride?
Scheduled bus175 (30.5)
Reserved vehicle80 (13.9)
Airport shuttle96 (16.7)
Other (e.g., MRT subway)223 (38.9)
How long was your last ride?
Less than 15 min42 (7.3)
15–30 min301 (52.4)
31–45 min157 (27.4)
46–60 min45 (7.8)
Over 60 min29 (5.1)
How many times have you used transportation service during the Summer Universiade?
Under 2 times353 (61.5)
3–4 times135 (23.5)
Above 5 times86 (15.0)
Table 2. Reliability and convergent analysis.
ConstructFactor LoadingsAverage Variance ExtractedComposite ReliabilityCronbach’s α
Core service (CS) 0.6690.9340.917
CS10.819
CS20.829
CS30.82
CS40.836
CS50.839
CS60.776
CS70.803
Physical environment (PE) 0.7370.9510.937
PE1
PE20.821
PE30.88
PE40.881
PE50.767
PE60.883
PE70.889
0.883
Satisfaction (SA) 0.8560.960.944
SA10.921
SA20.944
SA30.945
SA40.89
Involvement (IN) 0.7440.9360.705
IN10.858
IN20.862
IN30.873
IN40.875
IN50.847
City attitude (CA) 0.7660.9420.923
CA10.905
CA20.912
CA30.84
CA40.858
CA50.858
City image (CI) 0.5670.940.884
CI10.806
CI20.816
CI30.802
CI40.603
CI50.804
CI60.804
CI70.673
CI80.793
CI90.768
CI100.657
CI110.727
CI120.747
Table 3. Discriminant validity analysis.
CSPESAINCACI
CS0.818
PE0.6280.859
SA0.6950.6380.925
IN0.5340.4810.5820.875
CA0.3990.3470.3480.4580.753
CI0.3420.3060.3060.4060.5120.863
Notes: All correlations are significant at the 0.05 level. The diagonal elements are square roots of AVE.

