Assessment of Atmospheric Deposition and Vitality Indicators in Mediterranean Forest Ecosystems

 , , ,
, , ,  , and
, and 
Abstract
1. Introduction
- (1)
- To estimate the atmospheric inputs and identify differences in N deposition between the plots;
- (2)
- To estimate actual N deposition loads and compare them to critical loads; and
- (3)
- To identify the status of nutrients in foliage to evaluate tree growth and defoliation.
2. Materials and Methods
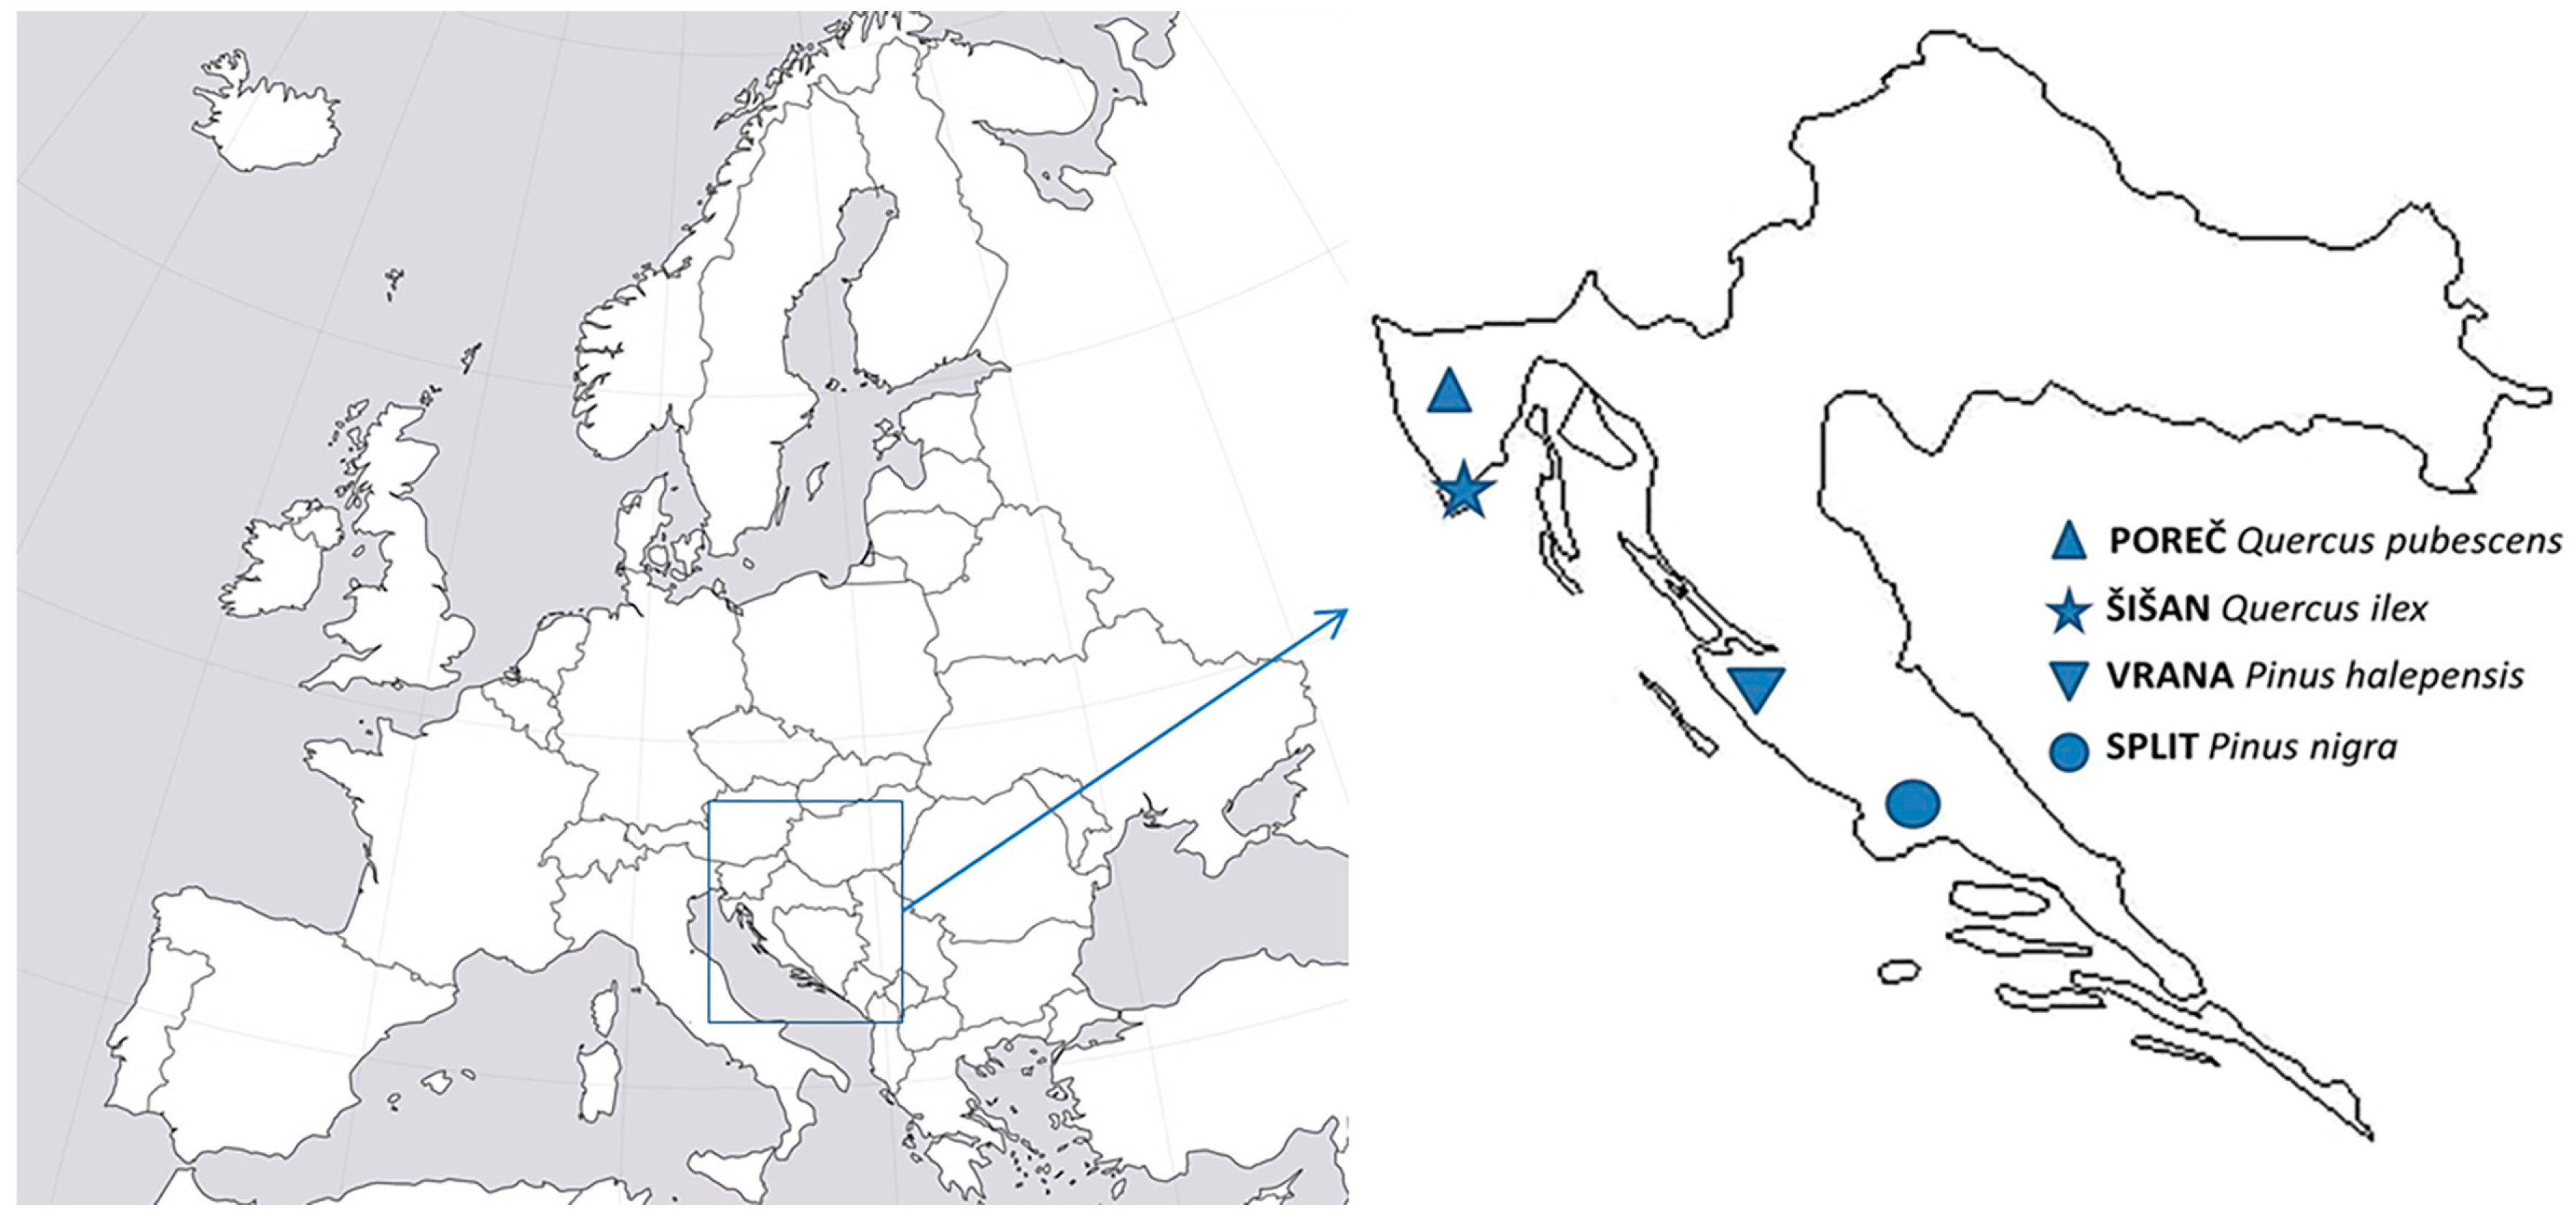
2.1. Locations and Experimental Site
2.2. Sampling and Analysis
2.3. Statistical Analysis
3. Results
3.1. Deposition
3.2. Foliar Nutrition
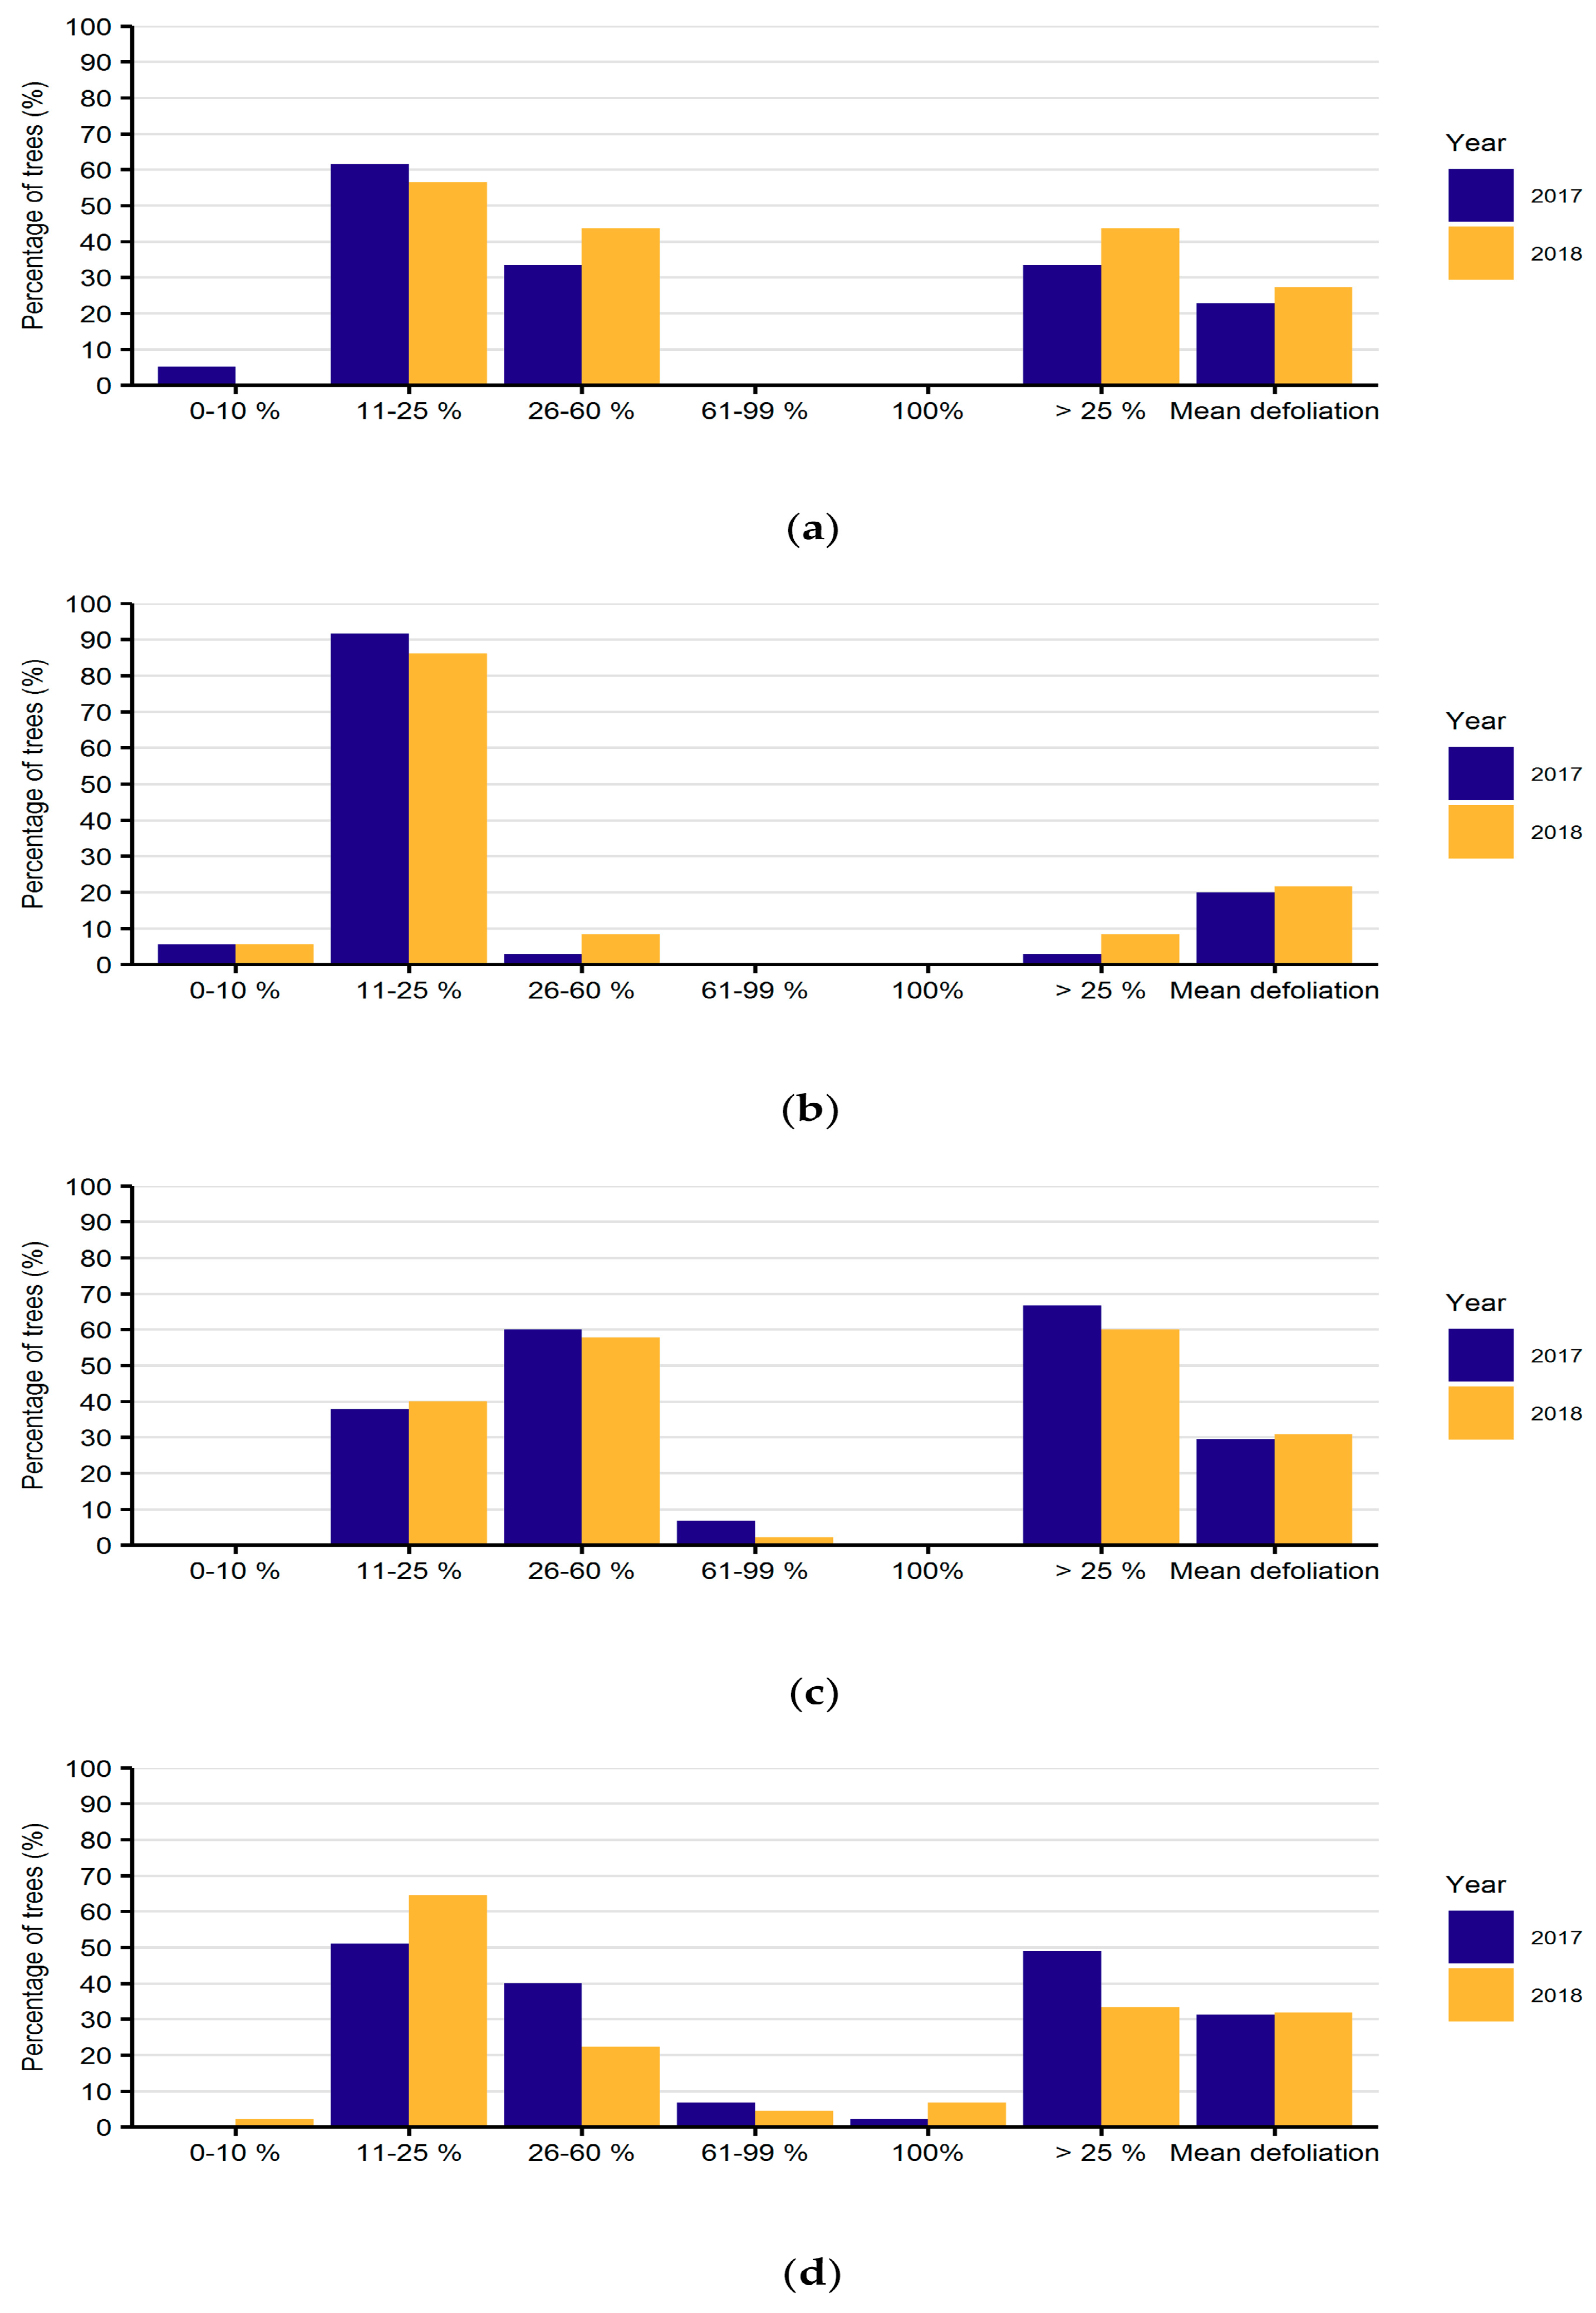
3.3. Defoliation
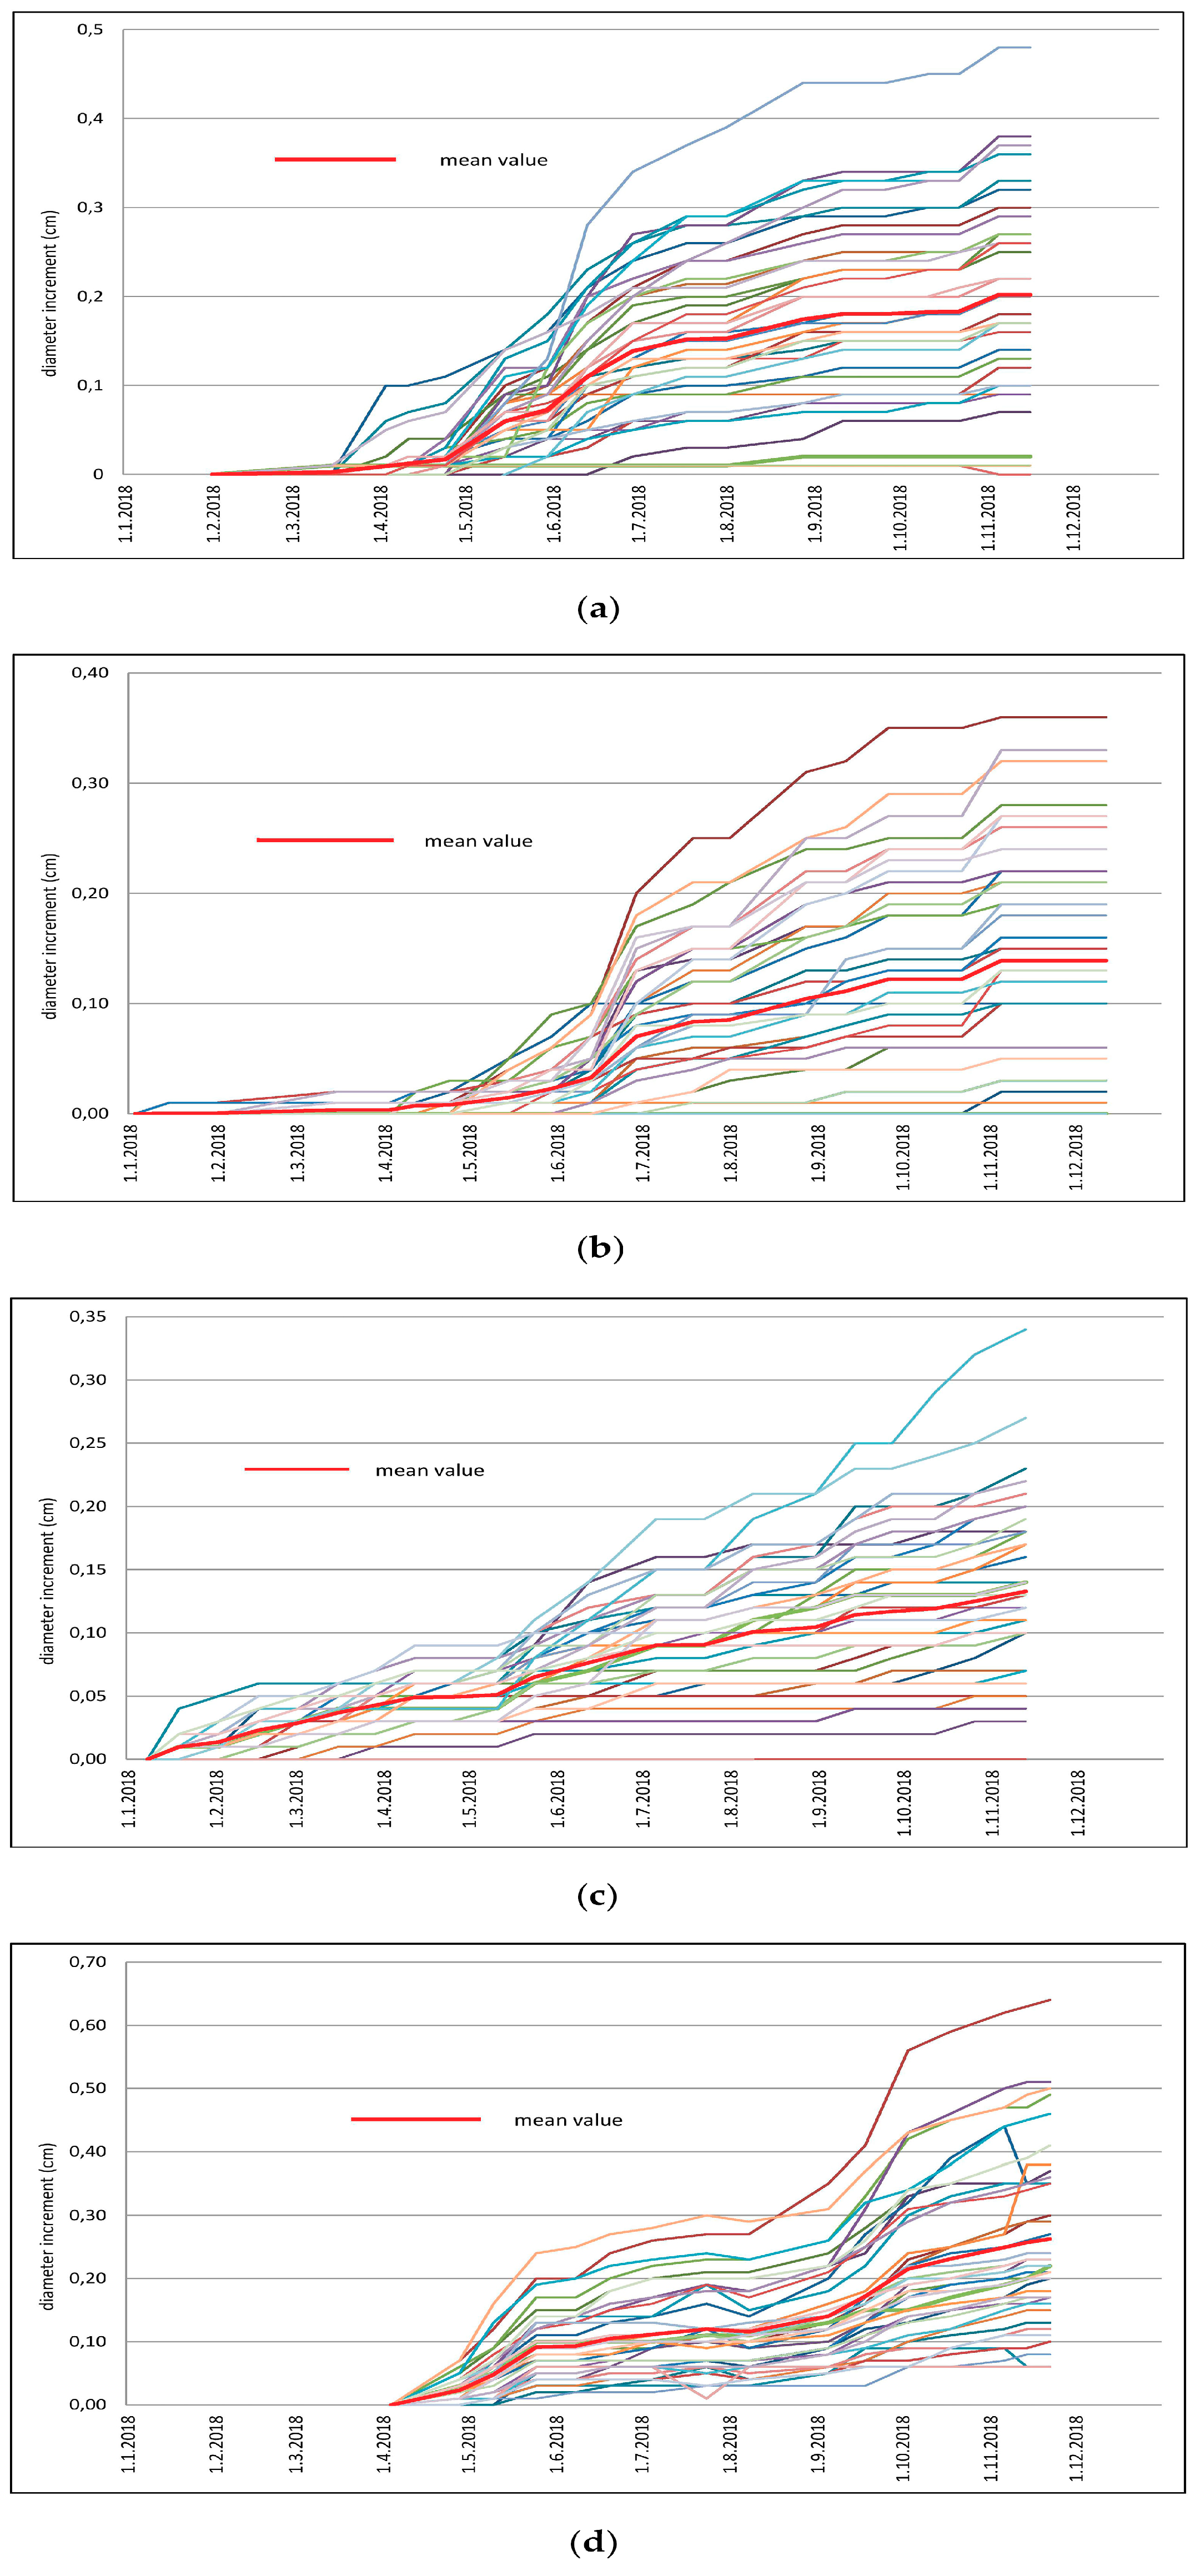
3.4. Growth
4. Discussion
4.1. Estimation of Atmospheric Inputs and Identification of Differences in N Deposition
4.2. Actual N Deposition Loads in Mediterranean Forests Compared to Critical Loads
4.3. The Status of Nutrients in Foliage
4.4. Evaluation of Tree Growth and Defoliation
5. Conclusions
Author Contributions
Funding
Acknowledgments
Conflicts of Interest
References
- Sicard, P.; De Marco, A.; Troussier, F.; Renou, C.; Vas, N.; Paoletti, E. Decrease in Surface Ozone Concentrations at Mediterranean Remote Sites and Increase in the Cities. Atmos. Environ. 2013, 79, 705–715. [Google Scholar] [CrossRef]
- EEA (2019) NEC Directive Reporting Status 2018. Available online: https://www.eea.europa.eu/themes/air/national-emission-ceilings/nec-directive-reporting-status-2018 (accessed on 18 August 2019).
- Myers, N.; Mittermeier, R.A.; Mittermeier, C.G.; da Fonseca, G.A.B.; Kent, J. Biodiversity Hotspots for Conservation Priorities. Nature 2000, 403, 853–858. [Google Scholar] [CrossRef] [PubMed]
- Balestrini, R.; Arisci, S.; Brizzio, M.C.; Mosello, R.; Rogora, M.; Tagliaferri, A. Dry Deposition of Particles and Canopy Exchange: Comparison of Wet, Bulk and Throughfall Deposition at Five Forest Sites in Italy. Atmos. Environ. 2007, 41, 745–756. [Google Scholar] [CrossRef]
- Bobbink, R.; Hicks, K.; Galloway, J.; Spranger, T.; Alkemade, R.; Ashmore, M.; Bustamante, M.; Cinderby, S.; Davidson, E.; Dentener, F.; et al. Global Assessment of Nitrogen Deposition Effects on Terrestrial Plant Diversity: A Synthesis. Ecol. Appl. 2010, 20, 30–59. [Google Scholar] [CrossRef]
- Ferretti, M.; Marchetto, A.; Arisci, S.; Bussotti, F.; Calderisi, M.; Carnicelli, S.; Cecchini, G.; Fabbio, G.; Bertini, G.; Matteucci, G.; et al. On the Tracks of Nitrogen Deposition Effects on Temperate Forests at Their Southern European Range—An Observational Study from Italy. Glob. Chang. Biol. 2014, 20, 3423–3438. [Google Scholar] [CrossRef] [PubMed]
- Aguillaume, L.; Izquieta-Rojano, S.; García-Gómez, H.; Elustondo, D.; Santamaría, J.M. Dry deposition and canopy uptake in Mediterranean holm-oak forests estimated with a canopy budget model: A focus on N estimations. Atmos. Environ. 2017, 152, 191–200. [Google Scholar] [CrossRef]
- García-Gómez, H.; Izquieta-Rojano, S.; Aguillaume, L.; González-Fernández, I.; Valiño, F.; Elustondo, D.; Santamaría, J.M.; Àvila, A.; Bytnerowicz, A.; Bermejo, V.; et al. Joining Empirical and Modelling Approaches to Estimate Dry Deposition of Nitrogen in Mediterranean Forests. Environ. Pollut. 2018, 243, 427–436. [Google Scholar] [CrossRef] [PubMed]
- Ochoa-Hueso, R.; Allen, E.B.; Branquinho, C.; Cruz, C.; Dias, T.; Fenn, M.E.; Manrique, E.; Pérez-Corona, M.E.; Sheppard, L.J.; Stock, W.D. Nitrogen Deposition Effects on Mediterranean-Type Ecosystems: An Ecological Assessment. Environ. Pollut. 2011, 159, 2265–2279. [Google Scholar] [CrossRef]
- Food and Agriculture Organization of the United Nations. State of Mediterranean Forests 2018. Available online: http://www.fao.org/3/CA2081EN/ca2081en.PDF (accessed on 15 September 2019).
- Matić, S. Proslov. In Šume Hrvatskog Sredozemlja; Matić, S., Prpić, B., Jakovac, H., Vukelić, J., Anić, I., Delač, D., Eds.; Akademija Šumarskih Znanosti: Zagreb, Croatia, 2011; pp. 5–7. ISBN 978-953-985715-6. [Google Scholar]
- Škevin-Sović, J.; Djuričić, V.; Kosanović, C. Major ions wet deposition and trends during the last decade on the eastern Adriatic coast. In Air Pollution XX, Proceedings of the 20th International Conference on the Modelling, Monitoring and Management of Air Pollution, Coruña, Spain, 16–18 May 2012; Longhurst, J.W.S., Brebbia, C.A., Eds.; WIT Press: Southampton, UK, 2012; Volume 157, pp. 339–359. [Google Scholar] [CrossRef]
- Clark, C.M.; Cleland, E.E.; Collins, S.L.; Fargione, J.E.; Gough, L.; Gross, K.L.; Pennings, S.C.; Suding, K.N.; Grace, J.B. Environmental and Plant Community Determinants of Species Loss Following Nitrogen Enrichment. Ecol. Lett. 2007, 10, 596–607. [Google Scholar] [CrossRef]
- de Vries, W.; Dobbertin, M.H.; Solberg, S.; van Dobben, H.F.; Schaub, M. Impacts of Acid Deposition, Ozone Exposure and Weather Conditions on Forest Ecosystems in Europe: An Overview. Plant Soil 2014, 380, 1–45. [Google Scholar] [CrossRef]
- Lu, X.; Mo, J.; Dong, S. Effects of Nitrogen Deposition on Forest Biodiversity. Acta Ecol. Sin. 2008, 28, 5532–5548. [Google Scholar] [CrossRef]
- Potočić, N.; Seletković, I. Defoliation of forest trees in Croatia in the period 2006–2009. Šumarski List 2011, 135, 149–158. [Google Scholar]
- Dobbertin, M. Tree growth as indicator of tree vitality and of tree reaction to environmental stress: A review. Eur. J. For. Res. 2006, 125, 89. [Google Scholar] [CrossRef]
- EC. Communication from the Commission to the Council and the European Parliament on an EU Forest Action Plan; European Commision: Bruxelles, Belgium, 2006; p. 13. Available online: https://ec.europa.eu/agriculture/sites/agriculture/files/fore/action_plan/com_en.pdf (accessed on 18 September 2019).
- Larrubia, C.J.; Kane, K.R.; Wolfslehner, B.; Guldin, R.; Rametsteiner, E. Using Criteria and Indicators for Sustainable Forest Management. A Way to Strengthen Results-Based Management of National Forest Programmes; Forestry Policy and Institutions Working Paper; Food and Agriculture Organization of the United Nations FAO: Rome, Italy, 2017; p. 85. Available online: http://www.fao.org/3/a-i6883e.pdf (accessed on 15 September 2019).
- Pernar, N.; Vrbek, B.; Bakšić, D. Soil. In Šume hrvatskog Sredozemlja/Forests of the Croatian Mediterranean; Matić, S., Prpić, B., Jakovac, H., Vukelić, J., Anić, I., Delač, D., Eds.; Akademija šumarskih znanosti: Zagreb, Croatia, 2011; pp. 130–141. ISBN 978-953-985715-6. [Google Scholar]
- Köpen, W.; Volken, E.; Brönnimann, S. The thermal zones of the earth according to the duration of hot, moderate and cold periods and to the impact of heat on the organic world. Meteorol. Z. 2003, 20, 351–360. [Google Scholar] [CrossRef] [PubMed]
- Zaninović, K.; Gajić-Čapka, M.; Perčec Tadić, M.; Vučetić, M.; Milković, J.; Bajić, A.; Cindrić, K.; Cvitan, L.; Katušin, Z.; Kaučić, D.; et al. Klimatski atlas Hrvatske/Climate atlas of Croatia 1961–1990.: 1971–2000; Državni Hidrometeorološki Zavod: Zagreb, Croatia, 2000; p. 200. ISBN 978-953-7526-01-6. [Google Scholar]
- Clarke, N.; Zlindra, D.; Ulrich, E.; Mosello, R.; Derome, J.; Derome, K.; König, N.; Lövblad, G.; Draaijers, G.P.J.; Hansen, K.; et al. Part XIV: Sampling and Analysis of Deposition. In Manual on Methods and Criteria for Harmonized Sampling, Assessment, Monitoring and Analysis of the Effects of Air Pollution on Forests; UNECE ICP Forests Programme Coordinating Centre, Ed.; Thünen Institute of Forest Ecosystems: Eberswalde, Germany, 2016; p. 66. ISBN 978-3-86576-162-0. [Google Scholar]
- König, N.; Kowalska, A.; Brunialti, G.; Ferretti, M.; Clarke, N.; Cools, N.; Derome, J.; Derome, K.; de Vos, B.; Fuerst, A.; et al. Part XVI: Quality Assurance and Control in Laboratories. In Manual on Methods and Criteria for Harmonized Sampling, Assessment, Monitoring and Analysis of the Effects of Air Pollution on Forests; UNECE ICP Forests Programme Co-ordinating Centre, Ed.; Thünen Institute of Forest Ecosystems: Eberswalde, Germany, 2016; p. 46. ISBN 978-3-86576-162-0. [Google Scholar]
- Jakovljević, T.; Marchetto, A.; Berković, K.; Rosa, J.; Potočki, A. Atmospheric deposition measurement in the lowland forest ecosystem of Pokupsko basin in Croatia. Period. Biol. 2013, 115, 363–370. [Google Scholar]
- Rautio, P.; Fürst, A.; Stefan, K.; Raitio, H.; Bartels, U. Part XII: Sampling and Analysis of Needles and Leaves. In Manual on Methods and Criteria for Harmonized Sampling, Assessment, Monitoring and Analysis of the Effects of Air Pollution on Forests; UNECE ICP Forests Programme Co-ordinating Centre, Ed.; Thünen Institute of Forest Ecosystems: Eberswalde, Germany, 2016; p. 19. ISBN 978-3-86576-162-0. [Google Scholar]
- Leco Corporation. Carbon, Nitrogen, and Sulphur in Plant Tissue. Organic Application Note, 203-821-172. Available online: https://uk.leco-europe.com/wp-content/uploads/leco_docs/product-files/TRUMAC_CNS_PLANT_TISSUE_203-821-539.pdf (accessed on 9 September 2017).
- Dobbertin, M.; Neumann, M. Part V: Tree Growth. In Manual on Methods and Criteria for Harmonized Sampling, Assessment, Monitoring and Analysis of the Effects of Air Pollution on Forests; UNECE ICP Forests Programme Coordinating Centre, Ed.; Thünen Institute of Forest Ecosystems: Eberswalde, Germany, 2016; p. 17. ISBN 978-3-86576-162-0. [Google Scholar]
- Eichhorn, J.; Roskams, P.; Potočić, N.; Timmermann, V.; Ferretti, M.; Mues, V.; Szepesi, A.; Durrant, D.; Seletković, I.; Schröck, H.W.; et al. Part IV: Visual Assessment of Crown Condition and Damaging Agents. In Manual on Methods and Criteria for Harmonized Sampling, Assessment, Monitoring and Analysis of the Effects of Air Pollution on Forests; UNECE ICP Forests Programme Coordinating Centre, Ed.; Thünen Institute of Forest Ecosystems: Eberswalde, Germany, 2016; p. 49. ISBN 978-3-86576-162-0. [Google Scholar]
- Mosello, R.; Brizzio, M.C.; Kotzias, D.; Marchetto, A.; Rembges, D.; Tartari, G. The Chemistry of Atmospheric Deposition in Italy in the Framework of the National Programme for Forest Ecosystems Control (CONECOFOR). J. Limnol. 2002, 61, 77–92. [Google Scholar] [CrossRef]
- Bobbink, R.; Braun, S.; Nordin, A.; Power, S.; Schütz, K.; Strengbom, J.; Weijters, M.; Tomassen, H. Effects of nitrogen deposition on woodland, forest and other wooded land (eunis class G). In Review and Revision of Empirical Critical Loads and Dose-Response Relationships, Proceedings of an Expert Workshop, Noordwijkerhout, The Netherlands, 23–25 June 2010; Bobbink, R., Hettelingh, J.P., Eds.; National Institute for Public Health and the Environment: Bilthoven, The Netherlands, 2011; pp. 135–160. [Google Scholar]
- R Core Team. A Language and Environment for Statistical Computing. In R Foundation for Statistical Computing; R Core Team: Vienna, Austria, 2016; Available online: https://www.R-project.org/ (accessed on 10 February 2019).
- Clarke, N.; Cools, N.; Derome, J.; Derome, K.; De Vos, B.; Fuerst, A.; Koenig, N.; Kowalska, A.; Mosello, R.; Tartari, G.A.; et al. Quality Assurance and Control in Laboratories. A Review of Possible Quality Checks and Other Forms of Assistance; ICP Forests Working Group on QA/QC in Laboratories, Ed.; Thünen Institute of Forest Ecosystems: Eberswalde, Germany, 2008; p. 56. [Google Scholar]
- Llorens, P.; Domingo, F. Rainfall Partitioning by Vegetation under Mediterranean Conditions. A Review of Studies in Europe. J. Hydrol. 2007, 335, 37–54. [Google Scholar] [CrossRef]
- Karavoltsos, S.; Fotiadis, F.; Michopoulos, P.; Sakellari, A.; Plavšić, M.; Bourletsikas, A.; Kaoukis, K.; Thomaidis, N.S.; Dassenakis, M.; Scoullos, M. Organic complexation of copper in throughfall and open field bulk deposition: Influence of the tree canopy of Mediterranean forest ecosystems. Chemosphere 2017, 167, 28–35. [Google Scholar] [CrossRef]
- Viana, M.; Kuhlbusch, T.A.J.; Querol, X.; Alastuey, A.; Harrison, R.M.; Hopke, P.K.; Winiwarter, W.; Vallius, M.; Szidat, S.; Prévôt, A.S.H.; et al. Source Apportionment of Particulate Matter in Europe: A Review of Methods and Results. J. Aerosol Sci. 2008, 39, 827–849. [Google Scholar] [CrossRef]
- Michel, A.; Seidling, W.; Prescher, A.K. Forest condition in Europe. In 2018 Technical Report of ICP Forests. Report under the UN-ECE Convention on Long-Range Transboundary Air Pollution (Air Convention), BFW, Dokumentation 25/2018; Michel, A., Seidling, W., Prescher, A.K., Eds.; BFW Austrian Research Center of Forest: Vienna, Austria, 2018; p. 92. ISBN 978-3-903258-08-2. [Google Scholar]
- Díaz-Hernández, J.L.; Párraga, J. The Nature and Tropospheric Formation of Iberulites: Pinkish Mineral Microspherulites. Geochimic. Cosmochim. Ac. 2008, 72, 3883–3906. [Google Scholar] [CrossRef]
- Burkhardt, J.; Kaiser, H.; Kappen, L.; Goldbach, H.E. The Possible Role of Aerosols on Stomatal Conductivity for Water Vapour. Basic Appl. Ecol. 2001, 2, 351–364. [Google Scholar] [CrossRef]
- Anatolaki, C.h.; Tsitouridou, R. Atmospheric Deposition of Nitrogen, Sulfur and Chloride in Thessaloniki, Greece. Atmos. Res. 2007, 85, 413–428. [Google Scholar] [CrossRef]
- Avila, A.; Molowny-Horas, R.; Gimeno, B.S.; Peñuelas, J. Analysis of decadal time series in wet N concentrations at five rural sites in NE Spain. Water Air Soil Pollut. 2010, 207, 123–138. [Google Scholar] [CrossRef]
- Jonard, M.; Fürst, A.; Verstraeten, A.; Thimonier, A.; Timmermann, V.; Potočić, N.; Waldner, P.; Benham, S.; Hansen, K.; Merilä, P.; et al. Tree Mineral Nutrition Is Deteriorating in Europe. Glob. Chang. Biol. 2015, 21, 418–430. [Google Scholar] [CrossRef]
- Körner, C. Plant CO2 Responses: An Issue of Definition, Time and Resource Supply. New Phytol. 2006, 172, 393–411. [Google Scholar] [CrossRef]
- de Vries, W.; Reinds, G.J.; van Keerkvoorde, M.S.; Hendriks, C.M.A.; Leeters, E.E.J.M.; Gross, C.P.; Voogd, J.C.H.; Vel, E.M. Intensive Monitoring of Forest Ecosystems in Europe Technical Report 2000; FIMCI, EC-UN/ECE: Brussels, Geneva, 2000; p. 191. [Google Scholar]
- Mengel, K.; Kirkby, E.A. Principles of Plant Nutrition, 5th ed.; Kluwer Academic Publishers: Dordrecht, The Netherlands, 2001; p. 849. ISBN 978-0-7923-7150-2. [Google Scholar]
- Bergmann, W. Buchbesprechungen. In Nutritional Disorders of Plants, 3rd ed.; Bergmann, W., Ed.; Gustav Fischer Verlag: Jena, Germany, 1992; pp. 377–379. ISBN 3334604225. [Google Scholar]
- Ferretti, M.; Calderisi, M.; Marchetto, A.; Waldner, P.; Thimonier, A.; Jonard, M.; Cools, N.; Rautio, P.; Clarke, N.; Hansen, K.; et al. Variables Related to Nitrogen Deposition Improve Defoliation Models for European Forests. Ann. For. Sci. 2015, 72, 897–906. [Google Scholar] [CrossRef]
- Lempereur, M.; Martin-St.Paul, N.K.; Damesin, C.; Joffre, R.; Ourcival, J.-M.; Rocheteau, A.; Rambal, S. Growth duration is a better predictor of stem increment than carbon supply in a Mediterranean oak forest: Implications for assessing forest productivity under climate change. New Phytol. 2015, 207, 579–590. [Google Scholar] [CrossRef]
- Campelo, F.; Gutierrez, E.; Ribas, M.; Nabais, C.; Freitas, H. Relationships between climate and double rings in Quercus ilex from northeast Spain. Can. J. For. Res. 2007, 37, 1915–1923. [Google Scholar] [CrossRef]
- Camarero, J.J.; Olano, J.M.; Parras, A. Plastic Bimodal Xylogenesis in Conifers from Continental Mediterranean Climates. New Phytol. 2010, 185, 471–480. [Google Scholar] [CrossRef]
- Martinez del Castillo, E.; Prislan, P.; Gričar, J.; Gryc, V.; Merela, M.; Giagli, K.; de Luis, M.; Vavrčík, H.; Čufar, K. Challenges for Growth of Beech and Co-Occurring Conifers in a Changing Climate Context. Dendrochronologia 2018, 52, 1–10. [Google Scholar] [CrossRef]
- Liphschitz, N.; Lev-Yaddun, S.; Rosen, E.; Waisel, Y. The annual rhythm of activity of the lateral meristems (cambium and phellogen) in Pinus halepensis Mill. and P. pinea L. IAWA J. 1984, 5, 263–274. [Google Scholar] [CrossRef]
- Prislan, P.; Gričar, J.; de Luis, M.; Novak, K.; Martinez del Castillo, E.; Schmitt, U.; Koch, G.; Štrus, J.; Mrak, P.; Žnidarič, M.T.; et al. Annual Cambial Rhythm in Pinus halepensis and Pinus sylvestris as Indicator for Climate Adaptation. Front. Plant Sci. 2016, 7, 1923. [Google Scholar] [CrossRef] [PubMed]
- Brang, P. Sanasilva-Bericht 1997. Zustand und Gefährdung des Schweizer Waldes—Eine Zwischenbilanz Nach 15 Jahren Waldschadenforschung; Ber. Eidgenöss. Forsch.anst; Wald Schnee Landsch: Birmensdorf, Schweiz, 1998; p. 345. ISBN 3-905620-67-7. [Google Scholar]
- Polak, T.; Rock, B.N.; Campbell, P.E.; Soukupova, J.; Solcova, B.; Zvara, K.; Albrechtova, J. Shoot Growth Processes, Assessed by Bud Development Types, Reflect Norway Spruce Vitality and Sink Prioritization. For. Ecol. Manag. 2006, 225, 337–348. [Google Scholar] [CrossRef]
- Carnicer, J.; Coll, M.; Ninyerola, M.; Pons, X.; Sánchez, G.; Peñuelas, J.; Mooney, H.A. Widespread Crown Condition Decline, Food Web Disruption, and Amplified Tree Mortality with Increased Climate Change-Type Drought. Proc. Natl. Acad. Sci. USA 2011, 108, 1474–1478. [Google Scholar] [CrossRef] [PubMed]
- Vitale, M.; Proietti, C.; Cionni, I.; Fischer, R.; De Marco, A. Random forests analysis: A useful tool for defining the relative importance of environmental conditions on crown defoliation. Water Air Soil Pollut. 2014, 225, 1992. [Google Scholar] [CrossRef]
- de Marco, A.; Proietti, C.; Cionni, I.; Fischer, R.; Screpanti, A.; Vitale, M. Future Impacts of Nitrogen Deposition and Climate Change Scenarios on Forest Crown Defoliation. Environ. Pollut. 2014, 194, 171–180. [Google Scholar] [CrossRef]
- Strelec Mahović, N. Meteorološki i Hidrološki Bilten 07/2017; Državni Hidrometeorološki Zavod: Zagreb, Croatia, 2017; p. 51. ISSN 1334-3017. [Google Scholar]
- Graf Pannatier, E.; Dobbertin, M.; Schmitt, M.; Thimonier, A.; Waldner, P. Effects of the drought 2003 on forests in Swiss Level II plots. In Schriften aus der Forstlichen Fakultät der Universität Göttingen und der Nordwestdeutschen Forstlichen Versuchsanstalt, Proceedings of the Forests in a Changing Environment—Results of 20 Years ICP Forests Monitoring, Göttingen, Germany, 25–28 October 2006; Eichhorn, J., Ed.; Sauerländer: Frankfurt am Main, Germany, 2007; Volume 142, pp. 128–135. ISBN 9783793951421. [Google Scholar]
- McMahon, S.M.; Parker, G.G. A general model of intra-annual tree growth using dendrometer bands. Ecol. Evol. 2015, 5, 243–254. [Google Scholar] [CrossRef]
- Barford, C.C.; Wofsy, S.C.; Goulden, M.L.; Munger, J.W.; Pyle, E.H.; Urbanski, S.P.; Hutyra, L.; Saleska, S.R.; Fitzjarrald, D.; Moore, K. Factors Controlling Long- and Short-Term Sequestration of Atmospheric CO2 in a Mid-Latitude. Science 2001, 294, 1688–1691. [Google Scholar] [CrossRef]
- Spiecker, H.; Mielikäinen, R.; Köhl, M.; Skorgsgaard, J.P. Growth Trends and site productivity. Has site productivity changed? In Growth Trends in European Forests, 1st ed.; Spiecker, H., Mielikäinen, R., Köhl, M., Skorgsgaard, J.P., Eds.; Springer: Berlin/Heidelberg, Germany, 1996; p. 372, ISBN 13: 978-3-642-64734-5. [Google Scholar]
- Laubhann, D.; Sterba, H.; Reinds, G.J. The Impact of Atmospheric Deposition and Climate on Forest Growth in European Monitoring Plots: An Individual Tree Growth Model. For. Ecol. Manag. 2009, 258, 1751–1761. [Google Scholar] [CrossRef]


| Forest Type | V | pH | Cond. | Ca2+ | Mg2+ | Na+ | K+ | N-NH4+ | S-SO42− | N-NO3− | Cl− | Total Alkalinity | |
|---|---|---|---|---|---|---|---|---|---|---|---|---|---|
| mm | µScm−1 | µeq m−2 | µeq L−1 | ||||||||||
| Black pine | BOF | 1417 | 5.78 ± 0.58 | 13.40 ± 5.27 | 16,446.32 ± 10,416.89 | 2449.04 ± 1618.25 | 1534.73 ± 1751.95 | 1222.05 ± 1406.84 | 6515.08 ± 9274.82 | 4769.93 ± 3310.24 | 1732.60 ± 2428.61 | 3881.62 ± 4757.61 | 0.03 ± 0.02 |
| THR | 1222 | 5.83 ± 0.33 | 26.19 ± 18.31 | 18,163.97 ± 11,608.10 | 2735.88 ± 2186.17 | 2229.31 ± 2510.78 | 1983.38 ± 1849.48 | 2415.61 ± 5428.74 | 5185.37 ± 4294.81 | 1596.40 ± 2973.45 | 2259.73 ± 2111.27 | 0.05 ± 0.04 | |
| Aleppo pine | BOF | 900 | 6.01 ± 0.47 | 15.31 ± 7.81 | 1519.24 ± 7308.08 | 2769.67 ± 1356.26 | 5291.51 ± 11107.20 | 2046.88 ± 1323.77 | 5355.71 ± 1246.29 | 5383.76 ± 5173.81 | 1710.65 ± 2218.92 | 8793.18 ± 1761.47 | 0.02 ± 0.01 |
| THR | 749 | 5.86 ± 0.37 | 48.30 ± 29.07 | 11,887.30 ± 8025.95 | 3030.25 ± 1976.73 | 3837.16 ± 3484.15 | 2280.89 ± 1582.49 | 3199.788 ± 5550.11 | 5223.28 ± 3830.76 | 1392.11 ± 1029.45 | 5294.39 ± 4978.78 | 0.03 ± 0.01 | |
| Pubescent oak | BOF | 1068 | 5.84 ± 0.53 | 21.90 ± 17.99 | 12,925.22 ± 25,598.87 | 2376.20 ± 4629.77 | 2669.42 ± 5252.71 | 2613.54 ± 5036.87 | 1666.15 ± 3239.78 | 4634.22 ± 9132.84 | 1178.68 ± 2344.53 | 3092.10 ± 6078.87 | 0.03 ± 0.06 |
| THR | 999 | 6.00 ± 0.29 | 36.99 ± 22.28 | 11,674.10 ± 7812.99 | 2200.24 ± 1808.33 | 2888.62 ± 2670.54 | 2766.59 ± 2752.75 | 2014.23 ± 2793.92 | 4376.92 ± 3613.12 | 1439.99 ± 1098. 86 | 3266.12 ± 3401.15 | 0.05 ± 0.03 | |
| Holm oak | BOF | 1073 | 5.92 ± 0.49 | 42.07 ± 23.45 | 10,864.84 ± 7084.86 | 6172.85 ± 5831.87 | 16,170.32 ± 22,222.82 | 2458.92 ± 21,112.703 | 10,117.74 ± 29,134.63 | 8093.55 ± 6199.94 | 1156.96 ± 1040.91 | 27,412.98 ± 32,260.71 | 0.03 ± 0.02 |
| THR | 968 | 5.94 ± 0.29 | 62.18 ± 33.75 | 12,332.84 ± 7011.47 | 7659.34 ± 6101.29 | 19,545.58 ± 21,461.21 | 5046.59 ± 4749.18 | 12,332.84 ± 7011.47 | 11,316.76 ± 8769.40 | 1553.41 ± 1213.60 | 34,156.20 ± 38,285.65 | 0.06 ± 0.05 | |
| Forest Type | Ca2+ | Mg2+ | Na+ | K+ | N-NH4+ | S-SO42− | N-NO3− | Cl− | Total Alkalinity |
|---|---|---|---|---|---|---|---|---|---|
| Black pine | 0.423 | 0.407 | 0.037 | 0.039 | <0.001 | 0.086 | 0.253 | 0.333 | 0.006 |
| Aleppo pine | 0.272 | 0.683 | 0.729 | 0.594 | 0.470 | 0.826 | 0.778 | 0.875 | 0.115 |
| Pubescent oak | 0.300 | 0.759 | 0.911 | 0.509 | 0.011 | 0.427 | 0.191 | 0.840 | 0.016 |
| Holm oak | 0.405 | 0.238 | 0.294 | 0.023 | 0.308 | 0.106 | 0.208 | 0.289 | <0.001 |
| Forest Type | Ca2+ | Mg2+ | Na+ | K+ | N-NH4+ | S-SO42− | N-NO3− | Cl− |
|---|---|---|---|---|---|---|---|---|
| Black pine | 0.497 | 0.429 | 0.474 | 0.316 | 0.236 | 0.609 | 0.865 | 0.164 |
| Aleppo pine | −0.174 | −0.155 | 0.127 | 0.094 | 0.258 | −0.093 | 0.075 | 0.139 |
| Pubescent oak | 0.276 | 0.459 | 0.291 | 0.541 | 0.639 | 0.685 | 0.227 | 0.361 |
| Holm oak | −0.170 | −0.136 | −0.116 | −0.123 | 0.217 | −0.125 | −0.104 | 0.117 |
| Forest Type | DEP_N | DEP_N Critical |
|---|---|---|
| kg ha−1 y−1 | ||
| Black pine | 8.19 | 15 |
| Aleppo pine | 3.41 | 5–15 |
| Pubescent oak | 17.64 | 10–20 |
| Holm oak | 19.7 | 10–20 |
| Forest Type | Tree Density | 2017 | 2018 | ||||
|---|---|---|---|---|---|---|---|
| BAI | BAI % | Mean Defoliation | BAI | BAI % | Mean Defoliation | ||
| n/plot | mm2 y−1 | % | % | mm2 y−1 | % | % | |
| Black pine | 86 | 820 | 0.671 | 22.78 | 861 | 0.731 | 27.17 |
| Aleppo pine | 169 | 867 | 2.582 | 29.52 | 897 | 2.544 | 30.78 |
| Pubescent oak | 365 | 523 | 2.173 | 31.27 | 607 | 2.420 | 31.78 |
| Holm oak | 354 | 247 | 0.621 | 20.00 | 562 | 1.589 | 21.60 |
© 2019 by the authors. Licensee MDPI, Basel, Switzerland. This article is an open access article distributed under the terms and conditions of the Creative Commons Attribution (CC BY) license (http://creativecommons.org/licenses/by/4.0/).
Share and Cite
Jakovljević, T.; Marchetto, A.; Lovreškov, L.; Potočić, N.; Seletković, I.; Indir, K.; Jelić, G.; Butorac, L.; Zgrablić, Ž.; De Marco, A.; et al. Assessment of Atmospheric Deposition and Vitality Indicators in Mediterranean Forest Ecosystems. Sustainability 2019, 11, 6805. https://doi.org/10.3390/su11236805
Jakovljević T, Marchetto A, Lovreškov L, Potočić N, Seletković I, Indir K, Jelić G, Butorac L, Zgrablić Ž, De Marco A, et al. Assessment of Atmospheric Deposition and Vitality Indicators in Mediterranean Forest Ecosystems. Sustainability. 2019; 11(23):6805. https://doi.org/10.3390/su11236805
Chicago/Turabian StyleJakovljević, Tamara, Aldo Marchetto, Lucija Lovreškov, Nenad Potočić, Ivan Seletković, Krunoslav Indir, Goran Jelić, Lukrecija Butorac, Željko Zgrablić, Alessandra De Marco, and et al. 2019. "Assessment of Atmospheric Deposition and Vitality Indicators in Mediterranean Forest Ecosystems" Sustainability 11, no. 23: 6805. https://doi.org/10.3390/su11236805
APA StyleJakovljević, T., Marchetto, A., Lovreškov, L., Potočić, N., Seletković, I., Indir, K., Jelić, G., Butorac, L., Zgrablić, Ž., De Marco, A., Simioni, G., Ognjenović, M., & Jurinjak Tušek, A. (2019). Assessment of Atmospheric Deposition and Vitality Indicators in Mediterranean Forest Ecosystems. Sustainability, 11(23), 6805. https://doi.org/10.3390/su11236805