1. Introduction
The twin challenge of pursuing socioeconomic development while reducing greenhouse gas (GHG) emissions to the levels needed to meet the Paris Agreement’s [
1] temperature goals in developing countries is often recognized. However, much of the literature focuses on mitigation policies that are estimated to lead to net economic losses. For example, the IPCC AR5 [
2] reports that reaching to levels of atmospheric GHG concentrations that are consistent with warming below 2 °C relative to pre-industrial levels, results in net macroeconomic losses that range between 2% and 15% of global GDP in relation to a baseline without mitigation (the IPCC SR1.5 [
3] did not assess macroeconomic costs of reducing global GHG emissions to the level required to achieve 1.5 °C and 2 °C pathways). These existing estimates of net macroeconomic costs of mitigation can lead to the misleading perception that economies perform better when no explicit action to reduce GHG emissions is taken and that mitigation policies are necessarily costly in macroeconomic terms. This body of literature has been recently criticized for underestimating both the costs of unmanaged climate change (e.g., catastrophic changes) and the benefits of the global low carbon transition (such as the spillover effects of green innovation and economies of scale; [
4,
5,
6,
7,
8]).
We aim to identify policies to spur mitigation that can not only reduce GHG emissions but also deliver socioeconomic gains by using the example of the Brazilian manufacturing sectors. Brazil represents a typical case of an emerging economy that has achieved significant economic and social progress at the cost of increasing fossil fuel burning. In less than 10 years, Brazil has more than doubled its share of the global GDP, from 1.4% in 2003 to 3.3% in 2012 [
9]. In the same period, Brazil’s CO
2 emissions from fossil fuel burning have grown at a rate of 3.7% per year on average, above the world average of 3.4% [
9]. Recently, Brazil’s economic performance declined severely. In 2015 Brazil’s real GDP fell by 3.8% [
10], and over 2.5 million jobs were lost [
9], and the exact reasons for that decline are still debated but are most likely due to fears of economic instability (see [
11] for a review). Since then, Brazil’s economy has plateaued with, in 2018, real GDP growth rate at 1.12% and unemployment rate at 11.6% [
10]. Along with other developing economies, Brazil faces the challenge of recovering economic growth to address its sizeable socioeconomic issues in the current global context where reducing GHG emissions is critical to the achieve climate mitigation goals of the Paris Agreement [
1].
Brazil voluntarily pledged to reduce its economy-wide GHG emissions by 37% by 2025 and, indicatively, 43% by 2030 in relation to 2005 [
12]. Compared to other major developing countries, Brazil was the only emerging economy to commit to an absolute target compared to a baseline year [
13]. However, most (41%) of the emissions cuts in Brazil already occurred between 2005 and 2012, owing to reduced deforestation (ibid.). Recent research [
14] shows that it is feasible for Brazil to continue reducing deforestation without compromising agricultural output because the country has enough cleared areas to meet the increase in future demand for agricultural products while sparing land for conservation. Meanwhile, manufacturing sectors share in Brazil’s net CO
2 emissions escalated from 5.9% in 2005 to 20.2% in 2010 [
15]. The uptake of low carbon technologies in these sectors is pivotal to avoid increasing the country’s GHG emissions in the future. Manufacturing sectors are the focus of this study also because of their potential to address environmental issues (e.g., producing capital goods that use less energy) and their general applicability (i.e., technologies can be used by other sectors, such as solar panels that can be used in agriculture).
In Brazil, the economic literature on climate change has also estimated net economic losses. In 2010, a report [
16] projected that a carbon tax at USD 30/tCO
2e and USD 50/tCO
2e would reduce the country’s GHG emissions by 1.16% and 1.87%, respectively. Despite revenues being recycled back to the economy via a subsidy to reduce prices, a negative impact on GDP ranging between 0.13% and 0.08% was found. Recently, another report [
17] projected that the introduction of a carbon tax (where revenues were used to reduce labor taxes) at USD 20/tCO
2e and USD 100/tCO
2e would reduce Brazil’s GDP by 0.17% and 1.48% and GHG emissions by 21.4% and 38.1%, respectively, by 2030.
Studies that explicitly model and quantify the potential for low carbon investments to become a driver of economic development in developing countries are sparse, and no such studies were identified for Brazil. There are studies, for example, that estimated the impacts of investments in key areas for the green economy on GDP, employment, GHG emissions, etc., for South Africa [
18], Kenya [
19], China [
20], Uruguay [
21], and Mozambique [
22]. Notwithstanding, in all these simulations, green investments are direct and exogenous and do not occur in response to any explicit public policies and measures aimed at inducing low carbon investments.
In this paper, an assessment is made of the impacts of introducing a portfolio of green fiscal policies to foster low carbon investments in Brazil, which include fiscal incentives (tax deductions and concessional finance) for investments in modern low carbon technologies by manufacturing sectors and in planted forests (such that all manufacturing sector’s demand for forest products is sustainable) and an economy-wide carbon tax. The methods employed are presented in
Section 2. The results are discussed and analyzed in
Section 3. Conclusions are presented in
Section 4.
2. Materials and Methods
This paper presents a quantitative assessment of the macroeconomic and environmental impacts of a green shift in Brazil driven by a portfolio of fiscal policies to induce low carbon investments by manufacturing industries. Green fiscal policies are effective instruments to induce the uptake of green technologies in Brazil [
23], and they can help overcome economic barriers for adopting cleaner production technologies [
24]. These policies also have the potential to deliver multiple socioeconomic dividends when properly designed, such as reduced tax distortions, increased demand and investment levels, and sound fiscal policy [
25,
26,
27,
28,
29,
30,
31].
Scenarios are built with the aim of assessing whether the introduction of a portfolio of fiscal policies that induce uptake of low carbon technologies by manufacturing sectors would be consistent with a more virtuous economic development cycle in Brazil, in addition to a business as usual (BAU) reference scenario that represents the counterpoint to an alternative, greener development path. It is assumed that green fiscal reforms (GFRs) are implemented to trigger, shape, and catalyze a greener development path in Brazil.
In the BAU scenario, Brazil follows a typical fossil fuel-intensive development path. The BAU policy assumptions are based on the IEA World Energy Outlook 2014 Current Policies Scenario [
32], which includes public policies and measures that had been formally adopted as of mid-2014. We built eleven policy scenarios that implement various GFRs and combinations of these to capture the impacts of Brazil actively pursuing an alternative development path that aims to reconcile economic growth and climate change mitigation. The main difference in relation to the BAU scenario is that Brazil introduces tax exemptions and concessional finance for low carbon investments to induce the uptake of modern low carbon technologies by manufacturing industries, and an economy-wide carbon tax. The GFR starts in the year 2018 and runs up to 2030, which is consistent with the timeframe of Brazil’s NDC.
GFR is defined to be the reduction of distorting taxes on investments and the provision of concessional financing for investments in low carbon technologies by manufacturing industries. The tax exemption is assumed to be the reduction of distorting taxes on green investments that increase their costs. Brazil has a high tax burden on investments in comparison to both developed and developing countries [
33]. This type of fiscal incentive can help unlock private climate finance because the bulk of the additional green investment prompted by the fiscal incentive is paid for by the private sector (although the public sector sponsors the cost reduction, i.e., the foregone revenues from tax exemptions). This kind of fiscal incentive, by helping to bring private finance in, can be a cost-efficient way to induce decarbonization in a context of constrained fiscal space, as Brazil’s public spending has been frozen for the next 20 years (Emenda Constitucional 95/2016, known as “expenditure ceiling” (
Teto dos Gastos)). In the Brazilian manufacturing sector, total tax costs amount to nearly one quarter (i.e., 24.3%) of investments [
34]. In the GFR scenarios, it is assumed that tax amendments are introduced that reduce the distorting tax burden on green investments by up to 11.3 percentage points (i.e., from 24.3% to 13%; ibid.). The 11.3 percentage points parameter represents a feasible and realistic level of tax reduction on investments made by manufacturing sectors in Brazil, following a study [
34] that quantified the amount of tax burden on investments that can be reduced in these sectors in the country (see
Supplementary Methods for detailed discussion of tax amendments corresponding to this level of tax relief). Tax reliefs are applied to green investments only, a measure which is aimed at creating an incentive for investment in green technologies over polluting technologies. Brown (i.e., non-green) investments are taxed as per standard tax rates (i.e., there are no tax exemptions for these).
Investments, particularly in manufacturing sectors, are key for long-term economic growth as they allow for demand to expand without inflation pressures (i.e., by expanding capacity), modernize the productive structure, foster innovation (e.g., through cumulated learning), and improve productivity [
35,
36,
37]. Fiscal stimulus boosts investments, which in turn, as an important component of demand, can increase output and employment both in the short- and in the long-term [
38]. Taxing investments thus creates distortions that hamper long-term economic growth. Taxation of green investments, in addition to these distortions, also hinders the uptake of low carbon technologies that deliver environmental benefits.
In addition to reducing distortive taxes on green investments, the GFR also comprehends the provision of concessional finance for investments in green technologies to further support the uptake of low carbon technologies. It is assumed that public funding is provided in the form of grants (i.e., non-reimbursable finance) for businesses to adopt low carbon technologies. Whereas tax exemptions reduce the cost of investments in green technologies, the provision of public funding reduces both costs and risks associated with these technologies [
39,
40]. Providing public funding helps the business sector engage in innovation and investment projects in which they would otherwise not take part because of their relatively high risks. These are risks involved in the transitional phase, in which industries are learning how to use the new technology, such as financial risks of high upfront capital costs (of solar panels, for instance, which may take years before pay-back is reached) and risks related to technological learning, for example, production disruptions, adapting to new inputs, and issues (such as a lack of skilled workers) involved in deploying green technologies on a large-scale [
39,
41]. Concessional finance is provided early in the investment cycle to support industries to unlock the necessary investments to kick-start the transition by reducing upfront capital costs and mitigate risks associated with technological learning. In addition, by overcoming inertia and carbon lock-in, it helps catalyze further private investment [
42]. Brown investments must be financed by funding regularly provided by financial markets in the economy (i.e., there is no additional public funding for these).
It is further assumed that the additional government spending—due to foregone tax revenues owing to tax exemptions and increased expenditure on funding of green investments—is financed by introducing an economy-wide carbon tax. The carbon tax rate is established at a level that at least compensates for the negative impact on the government budget balance at any point in time. The carbon tax rate is fixed and does not vary over time, which helps create a stable and credible environment for investments in low carbon technologies [
42,
43,
44,
45]. Furthermore, the government would be adopting a precautionary policy by seeking to protect its finances against unexpected shocks in the economy. All fossil fuels are taxed to raise revenues but also to incentivize low carbon investments in the entire economy. All users of fossil fuels in the economy are taxed except households, to avoid placing a direct burden on families that could create regressivity that would widen social inequality in Brazil, following Dercon (2012) [
46]. Because energy is an essential good, low-income households are likely to spend a larger proportion of their income on it in relation to high-income households [
47]. Therefore, a regressive impact of taxing fossil fuels could be obtained if household consumption was included in the carbon tax. Another way by which equity concerns are addressed in the GFR is by recycling the carbon tax revenues back into the economy by introducing incentives for green investments, which should increase wages by diffusing modern low carbon technologies that increase productivity.
In summary, these GFRs shift the tax burden to carbon intensive technologies, owing to the carbon tax on fossil fuels, and reduce the cost of low carbon technologies in manufacturing sectors due to fiscal incentives for green investments, thereby driving technology to the right direction [
29]. The implementation of multiple climate-aligned fiscal instruments (carbon tax, tax reliefs, and concessional financing) contribute to build an institutional environment that reduces uncertainty and fosters credibility for low carbon investments, because they make expectations robust to a change in any one of the individual policies, help signal the market, and build societal trust towards the low-carbon transition [
29,
42,
48].
The investments that are eligible for tax exemptions and public financing consist of investments in modern low carbon technologies (
Table 1) that deliver the maximum mitigation potential (World Bank, 2010) by Brazilian manufacturing sectors, namely: energy efficiency (EE); materials saving and recycling (MR); switching from more carbon-intensive fossil fuels to natural gas (NG); renewables—biomass and solar (RN); shifting from non-renewable to sustainable biomass (SB); and cogeneration (CO). These technologies present a sufficient degree of technological maturity (i.e., technologies available at the commercial stage) and availability for large-scale implementation by 2030 (ibid.).
GFR scenarios are built to target investments in each type of technology, both separately and jointly (
Table 2). The scenarios energy efficiency (EE), materials saving and recycling (MR), natural gas (NG), renewables (biomass and solar) (RN), sustainable biomass (SB), and cogeneration (CO), are each separately built to simulate the introduction of “mini” GFRs targeted at specific green investments. These scenarios aim at testing the impact of “mini” fiscal reforms targeted at each type of green investment separately. Scenarios are incrementally built such that each of them progressively induces the uptake of one more type of technology, such that their joint implementation is also considered. In each scenario, the portfolio of tax exemptions, concessional finance, and carbon tax is designed to address the specificities of the mitigation technology in question in terms of investment costs and cycle and technological penetration potential for each economic sector (see
Table 2 and
Supplementary Methods for details). For example, in the EE scenario, the amount of tax that is exempted from payment and the volume of concessional funding provided are specifically designed to induce investments in energy efficiency in each sector. Based on clearly defined rules, the GFRs are both transparent and flexible by considering various sector specificities and distributional effects between economic sectors, which are key features of a credible policy to foster low carbon investments [
43].
Regarding the rest of the world, it is assumed that no additional action to address climate change is taken in other countries, similar to the reference scenario, based on the IEA World Energy Outlook 2014 Current Policies Scenario [
32] that assumes that the current climate policies in place will continue. These scenarios explore GFR as a national development strategy that is not conditional on countries taking further actions to mitigate climate change.
Scenarios SB, EE+MR+NG+RN+SB, and EE+MR+NG+RN+SB+CO include investments in sustainable biomass (SB). For this technology, which concerns substituting unsustainable biomass from deforestation of native areas by SB from planted forests, it was assumed that investments are fully induced by the provision of grants, which are, exceptionally, compensated by financial support from the international community (and not from a carbon tax). In these scenarios, developed countries reward Brazil for reducing emissions from deforestation, which is similar to the UNFCCC REDD+ mechanism [
50]. This assumption is based on Brazil’s NDC, which reports that the implementation of REDD+ activities in Brazil is dependent upon international support [
12]. It is also based on evidence that REDD+ can be an instrument not only to help avoid deforestation but also to produce positive developmental impacts [
51,
52].
The scenarios are modeled in E3ME, which stands for Energy-Environment-Economy (E3) Macro-Econometric model. E3ME is a macro econometric simulation model of the global (E3) systems and includes Brazil explicitly as one of its 53 regions in version 6.0 that is used in the present study [
53]. The theoretical foundation of E3ME is based on an approach explicitly focused on institutional behavior, expectations, and uncertainty [
30,
53,
54,
55,
56]. In E3ME, the economy is demand-driven so that supply is adjusted (subject to some constraints) to meet demand levels, but not necessarily at maximum capacity levels. Supply constraints in E3ME include the availability of labor, an implicit measure of capacity (i.e., an estimate of normal output) such that any increase in demand beyond capacity increases prices and import substitution thereby forcing economic activity down and econometric parameters derived from historical data that incorporate constraints, such as past regulations that limit debt and finance available to expand investment. In E3ME, the levels of demand determine output, which determine employment levels allowing for varying returns to scale across sectors and over time. The energy module in E3ME is eminently top-down with a bottom-up sub-model of the electricity supply sector. Feedbacks from the energy module to the economy are made via input-output industry interactions, household energy balances, and prices. The environment module in E3ME is represented by air pollution generated from the end-use of different fuels and from the primary use of fuels in the energy industries themselves. Interactions between the three modules are solved by using the IDIOM software, which provides forecasts by solving a system of stochastic equations (estimated by employing co-integration and error correction model) and accounting identities.
Compared to standard equilibrium models, E3ME differs mainly with regard to the academic tradition and modeling approach. Standard equilibrium models are grounded on Neoclassical Economics (NCE), which present a supply-led approach to the economy via the interaction of consumers and firms in the market. Under standard NCE assumptions, such as perfect competition, constant returns to scale, rational behavior, and perfect foresight, an optimal economic equilibrium is reached, in which demand equals supply for every commodity (markets clear) and all resources (including labor) are fully employed in the long-term [
30,
56,
57]. The implication is that, if an optimal equilibrium is obtained in the baseline scenario, a shock (including the introduction of climate policies) will lead to a sub-optimal equilibrium in which economic levels are worse off. In the latest IPCC Assessment Report, thirty out of the thirty-one models employed in the report are equilibrium models, and all mitigation costs reported are positive and increase with the stringency of the mitigation target [
2].
The treatment of money and the financial sector is also an aspect whereby E3ME differs from standard equilibrium models owing to different theoretical foundations. Although there is an explicit treatment for nominal variables (wages, costs, and prices) and for carbon pricing in E3ME, the core of the model is built on real economy dynamics. The money supply is implicitly made endogenous in the model since financial institutions (e.g., banks) can create money through new loans (up to the levels allowed by past regulations that are embodied in the model’s econometric parameters) to address new investments [
58]. As a result, there is no full crowding out of investments in E3ME, which is consistent with its theoretical foundation. In standard equilibrium models, in contrast, the money supply is exogenous, and there is full crowding out of investments because new investments must be financed either by increased savings that reduce consumption or by reducing investment elsewhere. Notwithstanding, the different ways through which green investments can be financed in E3 models are insufficiently explored, and so far, there are scarce models that present explicit treatment of money and the financial sector [
58,
59,
60,
61].
The data sources, methodology, and modeling techniques employed were carefully selected to make the analysis as robust as possible. Notwithstanding, as with any quantitative assessments that involve human and physical systems and their interactions, there are limitations. First, the results obtained rely on the availability and quality of the data. The use of multiple databases in E3ME, as in any large-scale model, may contain imprecisions despite extensive data processing to ensure these are consistent with each other, economic theory, and econometric practice. Second, any study that involves making projections of the future involves uncertainties. Owing to its intrinsically unpredictable nature, it is not possible to perfectly represent uncertainties in modeling. Uncertainties regarding key linkages from climate change damage and ecological limits to the economy also prevented accounting for these in the modeling exercise. Third, the treatment of elasticities in the model is based on adaptive expectations, i.e., based on learning and information about the past. Although elasticities may change in the future, this approach is reasonable in the presence of uncertainties, which are virtually always present in the analysis of long timeframes [
62]. Finally, the analysis of possible labor frictions, due to reskilling or upskilling needs to operate low carbon technologies, is prevented due to data availability, even though historical frictions are captured in the estimated coefficients for the labor market in the model.
3. Results
In the absence of mitigation measures and policies, Brazil’s future is characterized by a carbon intensive development path, led by increased fossil fuel consumption mainly driven by manufacturing sectors. A similar finding was obtained by other studies [
17,
63] for Brazil. Despite relevant socioeconomic improvements, such as a 40.2% increase in real GDP per capita in 2030 relative to 2018, the baseline scenario shows that Brazil reproduces the typical structural features of developing economies that aggravate external constraints to long-term economic growth. In the BAU scenario, Brazil scarcely diversifies its exports, which maintain their primary and natural-resource-intensive character, and critically relies on external markets to obtain high-technology goods and to sustain its increased dependence on fossil fuels.
External constraints to long-term economic growth are related to insufficient productive modernization, such that exports specialize in low added-value products (i.e., primary goods and natural resources intensive manufactures), and more technologically elaborated goods and services, which are necessary for industrial development, must be obtained from the external market via imports [
64,
65,
66]. External specialization in the early stages of development (i.e., exports almost solely concentrated in primary goods and almost complete absence of industrial goods) implied that industrialization, on the one hand, started in technologically less elaborated sectors and, on the other hand, advanced very slowly in consumer and intermediary goods that required higher technological and organizational complexity [
67]. This pattern of economic development, which is typical of developing countries, necessarily proceeded from simple to complex sectors and technologies, such that the productive structure reached repeatedly incipient degrees of intersectoral complementarity and vertical integration in relation to modern economies [
67]. In the long-term, exports tend to increase less than imports, because of the latter’s relatively higher income-elasticity, thereby creating external constraints that force demand levels down. Put differently, the growth prospects of developing countries are externally limited compared to modern economies, whose technology-intensive products tend to grow faster in trade owing to higher income elasticity and potential to create new demand and to replace faster old products [
66]. As a result, supply often operates under-full capacity, investments are discouraged, and innovation efforts are decelerated. These structural characteristics tend to reproduce themselves, as the specialization of exports on relatively simpler products (e.g., commodities) present limited learning potential, fewer spillover effects in the economic chain, and vulnerability to easy entry by low wage competitors (ibid.). Such development pattern hinders diversification and technological improvement (i.e., competitiveness) of exports, which tend to maintain their primary character, and sustains dependency on external markets to obtain high technology goods and services (i.e., high-income elasticity of demand for imports).
The analytical framework of external constraints to economic growth is supported by empirical evidence from both developed countries [
68,
69] and developing countries [
70,
71]. Brazil has also been studied as an example of these constraints. By presenting insufficient productive modernization (marked by historically low levels of investment and Research and Development (R&D) expenditure), external constraints in the absolute form (declining or lack of available foreign currency for imports) and in the relative form (imports capacity growing slower than output) have repeatedly been an obstacle to the country’s economic development [
70,
72,
73]. Although the Brazilian economy has changed significantly in recent decades, it has been reproducing the structural characteristics that aggravate external restriction to long-term economic growth, such as an increased reliance on natural resource intensive exports and on imports of technologically intensive goods [
72,
74].
The BAU scenario results indicate that Brazil tends to follow a development path that is unsustainable economically because it reproduces structural characteristics that externally constrain long term economic growth. This path is also environmentally unsustainable as CO
2 emissions increase along with fossil fuel dependence, following a trend that is incompatible with global efforts to limit warming to well below 2 °C, as established in the Paris Agreement [
1]. Changes in oil prices can impact the results, which can be assessed by future studies (see
Supplementary Materials for fossil fuel price assumptions).
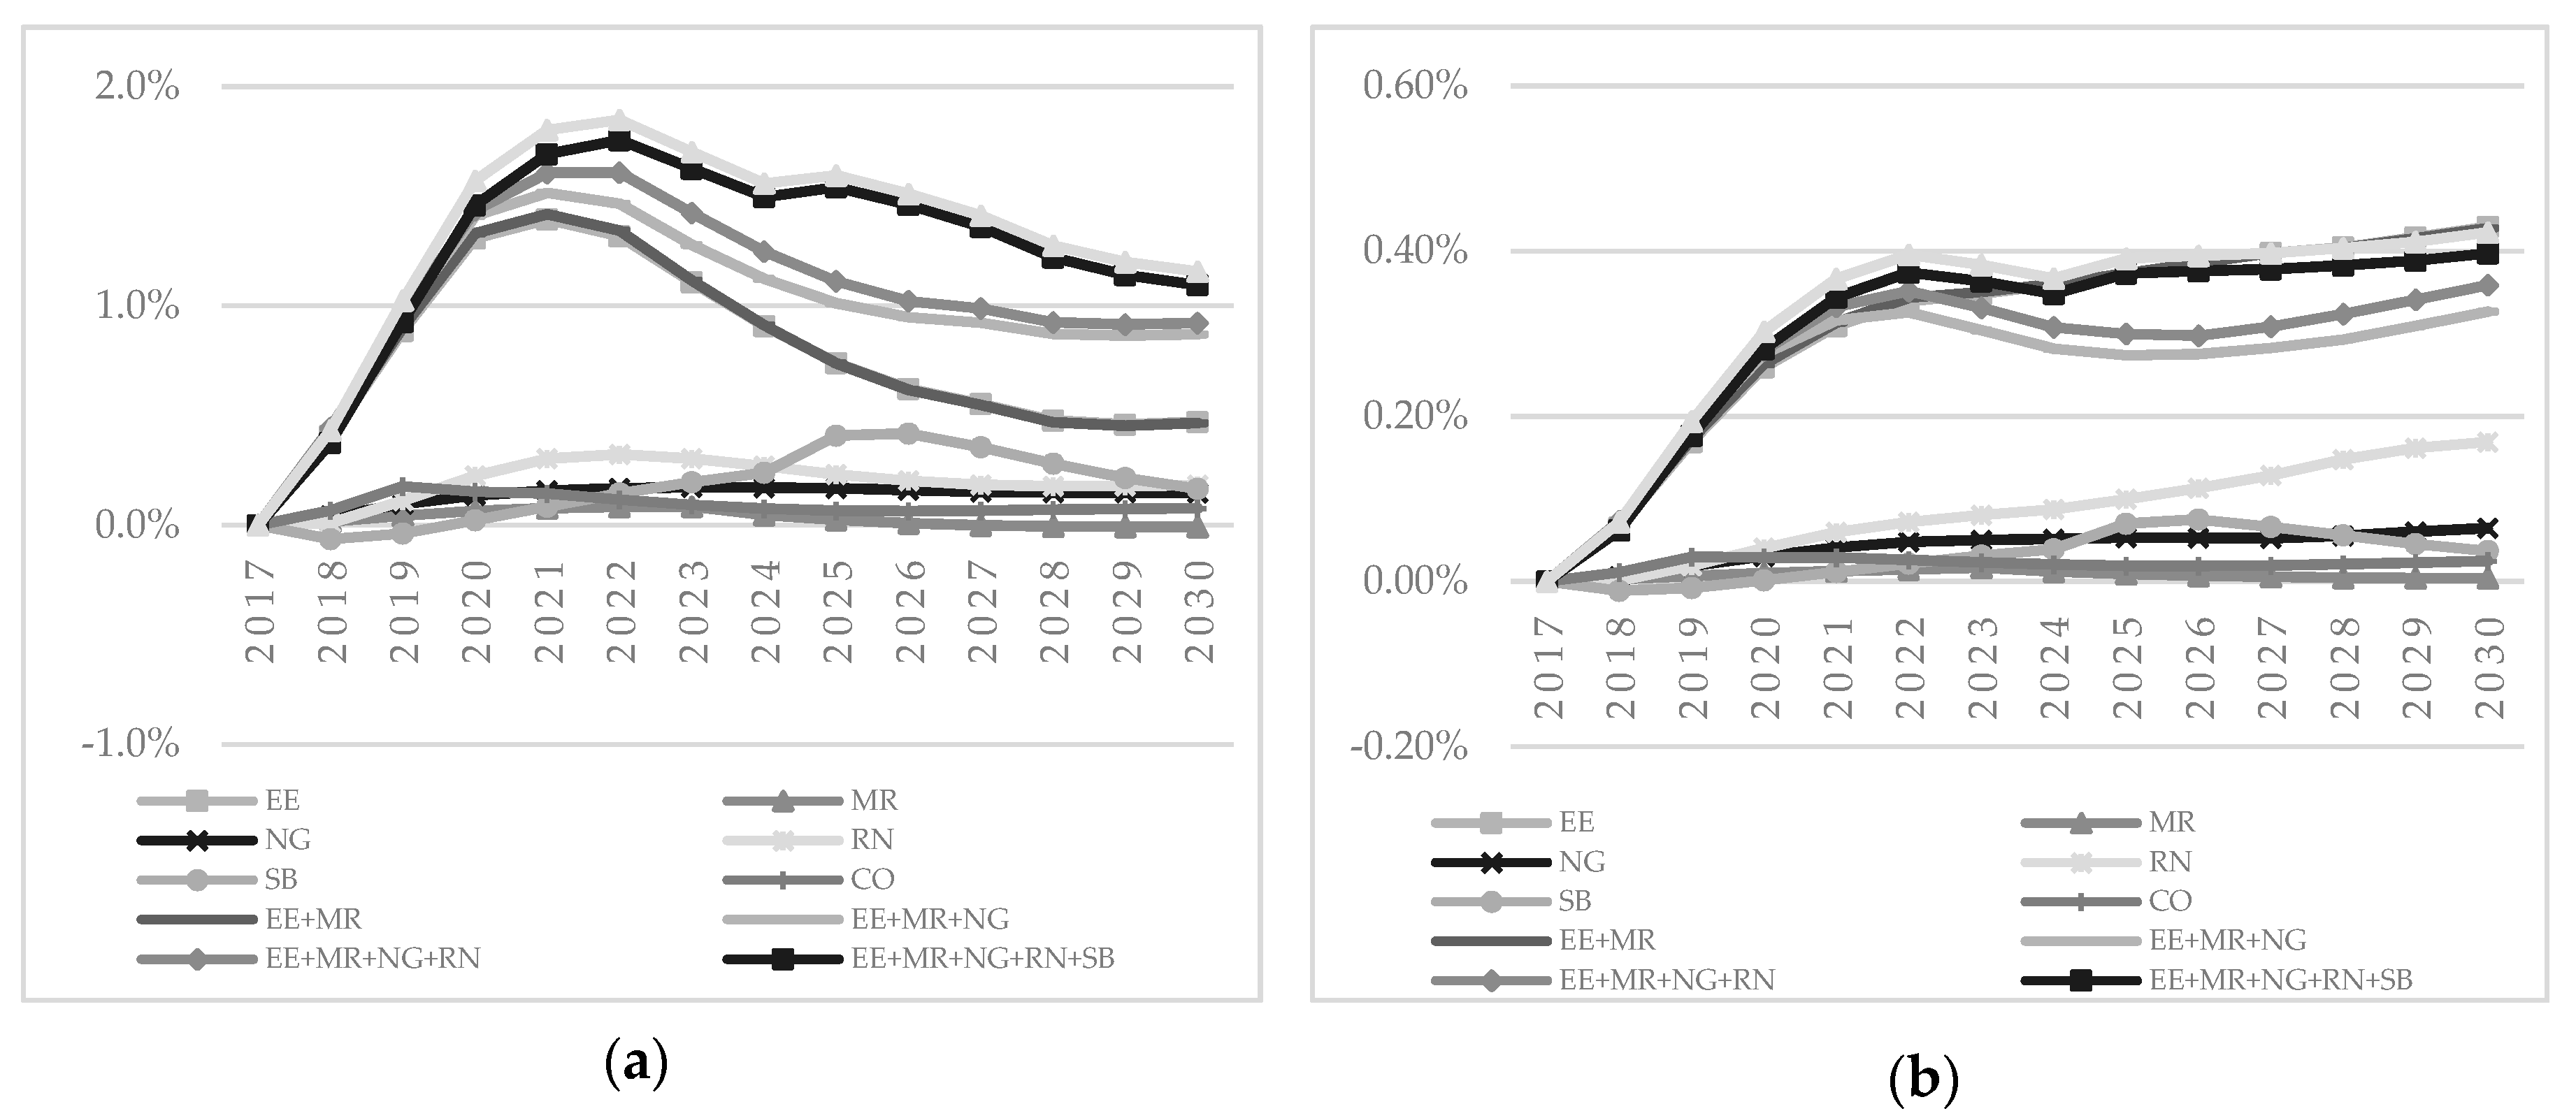
Results show that GFRs bring substantial socioeconomic and environmental gains to Brazil compared to BAU (
Figure 1). Different GFRs produce different socioeconomic and environmental impacts, which are attributable to various combinations of tax exemptions, concessional finance, and carbon taxation and to the technological changes produced by green investments. As GFRs are designed to increase investment levels, while steering the new investment cycle toward low carbon technologies, investments grow faster in response to green fiscal incentives.
Most of the increase in investment levels is concentrated in the early years of GFRs, following the provision of concessional finance in those years to help industries overcome inertia and kick-start the technological transition (
Figure 1). The trade balance is improved in most GFR scenarios, led by reduced dependence of fossil fuel imports and increased competitiveness of exports. Reducing imports of fossil fuels that can be highly price-volatile and subject to supply disruptions [
75] helps Brazil mitigate its external vulnerability. Moreover, GFRs enhance Brazilian exports of medium and high-technology manufacture because the economy becomes more capital-intensive, thereby accumulating productive and technological competencies that increase the competitiveness of more technologically complex products. As a result, the country’s exports become less concentrated on primary products and natural-resource-intensive manufactures, which further contributes to reducing external constraints to long term economic growth. Later in time, as investments accelerate less, the continuous improvement of the trade balance (
Figure 1) in most GFR scenarios contributes to sustaining higher economic activity compared to BAU by 2030.
Led by increased investments and an improved trade balance, Brazil’s economy follows a new cycle of GDP growth (
Figure 1). Direct, indirect, and induced macroeconomic interactions and feedbacks further accelerate GDP growth (up to 0.42%), boost investments (up to 1.16%), and improve the trade balance (up to 2.5%) by 2030. Briefly, when industries invest or export more, the output is directly increased via an expansion of demand from relevant sectors (e.g., machinery and equipment sectors). By increasing their output, these sectors demand additional inputs from their suppliers, which in turn purchase more inputs from their suppliers and so on. In addition to these direct and indirect impacts throughout the economic chain, as industries expand their output and expect higher demand levels in the future, they invest in additional production capacity, which creates further demand for capital goods. Higher income levels in the economy are reflected in additional spending, which also causes the economy to expand. Lastly, increased domestic demand may be met by growing imports of some products. As demand levels abroad grow, other countries may increase their imports from Brazil, which can boost economic activity further.
The impact of GFR scenarios on employment is positive in the first instance but becomes negative later on (
Figure 1). As investments expand, they drive the expansion of economic activities, which leads to net job creation relative to the baseline owing to macroeconomic interactions and feedbacks. However, as investments continue to expand, ever increasing capital stocks start substituting for labor. It is underlined that the magnitude of the impact is small, i.e., it represents up to 0.1% of employment levels in the reference scenario. Notwithstanding, the substitution of labor by capital could be avoided. Positive economic prospects provide the conditions for additional productive inclusion or social compensation policies. GFRs were designed to reduce the cost of capital, but they could also include fiscal incentives that reduce labor costs. GFRs present a positive fiscal impact on the government’s budget over most of the period of analysis (
Table 3). These outstanding resources could be used to reduce tax costs on labor, such as social security contributions, instead of reducing the budget deficit. Studies show that countries that recycle carbon tax revenues back to the economy by reducing distorting labor taxes have achieved net job creation [
76]. This possibility can be explored by future studies in the context of Brazil.
GFRs result in a positive impact on wages (
Figure 1). The magnitude of the impact is larger in scenarios that simulate more fiscal incentives for green investments, especially scenarios in which joint implementation of mitigation technologies is being targeted. Wages increase by up to 0.5% (in scenario EE+MR+NG+RN+SB+CO) in 2030 relative to the baseline. The increase in this variable is engendered by growing labor productivity. As the Brazilian economy becomes more capital-intensive, labor productivity expands as more output can be obtained by each worker. Increased productivity leads to increased revenues per worker, which pushes wages and personal disposable income up (see
Supplementary Discussions and Figures for details). These variables show relevant socioeconomic gains of GFRs, concerning an increased amount of money available for households to spend and save after income taxes have been accounted for.
In addition, CO
2 emissions are significantly reduced by the introduction of GFRs (by up to 14.5%;
Figure 1), compared to BAU, led by manufacturing sectors and, to a lesser extent, by other sectors, which shows that GFRs can induce emissions mitigation throughout the economy (see
Supplementary Discussions and Tables for details). These results substantiate that GFRs can contribute to reducing Brazil’s external constraints to long-term economic growth while reducing CO
2 emissions relative to BAU.
4. Discussion
Scenarios that require a larger volume of low carbon investments are granted more green stimulus to induce these, which in turn, also require a larger carbon tax to prevent a negative fiscal impact on the government’s budget (
Table 3). This is illustrated by scenarios that simulate joint implementation of mitigation technologies. As more technologies are induced, more investments are required. For example, the GFR simulated in scenario EE+MR+NG+RN includes 2.2% more grants in comparison to scenario EE+MR+NG. As more fiscal incentives are granted, in scenario EE+MR+NG+RN, a higher carbon tax (at EUR 7.2/tCO
2) is required to avoid a negative fiscal impact on the government’s budget in comparison to scenario EE+MR+NG (in which the carbon tax is EUR 6.8/tCO
2).
The projected net impact of GFRs over 2018 to 2030 is a reduction in the government’s primary deficit for most scenarios in relation to the baseline (
Table 3), which account for the impact of reduced tax revenues from reduced use of fossil fuels. In most scenarios, more fiscal incentives are granted in 2018, such that the net fiscal impact in that year is negligible (i.e., it is less than 0.01% of GDP). In 2018 carbon tax revenues are spent virtually entirely on green fiscal incentives. As public spending progressively reduces from 2019 (owing to decreasing tax exemptions and grants), the positive net fiscal result allows the government to reduce its primary budget. As the carbon tax is fixed, GFRs more than offset the fiscal impact of green incentives and reduce the government’s primary deficit.
Considering implemented mitigation technologies separately, energy efficiency technologies present most gains in terms of GDP growth, trade balance improvement, and CO2 emissions abatement. However, impacts are most prominent in scenarios that simulate joint implementation of mitigation technologies and, therefore, create synergies. Most gains occur in the scenario that concerns the most comprehensive GFR, EE+MR+NG+RN+SB+CO. In this scenario, the GFR can add the equivalent of Malta’s or Macedonia’s GDP in 2018 to Brazil’s economy in 2030, compared to BAU. Over 2018 to 2030, Brazil could avoid emitting in this scenario the entire volume of CO2 that the country would emit in 2030 in the absence of reforms.
In contrast, scenario SB does not deliver results as economically impactful as other scenarios. This scenario focuses on investments in planted forests, which, being part of the primary sector, present limited backward and forward linkages, spillover, and learning effects in the economic chain [
64]. These investments lead to increased exports from the forestry sector, as they help forestry industries become more competitive. However, as exports of medium and high-technology goods do not increase, the net impact of these economic effects is an augmented dependence on primary exports, which aggravates external restriction to long-term economic growth [
65,
66]. Although substantial CO
2 emissions reductions can be obtained from this technology, SB does not help Brazil avoid carbon lock-in, as fossil fuel consumption continues to increase over time. SB plays an important role in reducing CO
2 emissions, but in order to produce similar socioeconomic and environmental gains as other scenarios, SB should ideally be implemented jointly with other mitigation technologies.
In the context of Brazil’s NDC (i.e., to reduce GHG emissions by 37% by 2025 and 43% by 2030 relative to 2005) [
12], we underline that Brazil is on track to meet the bulk of its NDC target by reducing deforestation and despite growing burning of fossil fuels [
15]. However, as scenario SB projections indicate, reducing deforestation alone may not bring important long-term benefits, such as avoiding carbon lock-in and reducing external economic vulnerabilities. On the other hand, results show that GFRs can contribute to meeting the target to different extents. Scenarios EE+MR+NG+RN, EE+MR+NG+RN+SB, and EE+MR+NG+RN+SB+CO can contribute the most, as these exhibit absolute net reductions in CO
2 emissions by manufacturing sectors in 2030 relative to BAU emissions in 2018. Net economy-wide absolute reductions in emissions, however, would require additional mitigation measures and policies targeted at other sectors, particularly the transport sector, to effectively lead Brazil on to a low carbon development path compatible with the limits of the 2 °C [
77] and 1.5 °C [
3] warming set in the Paris Agreement [
1].
Finally, it is underlined that GFRs can be achieved at considerably low carbon tax rates (see
Table 3). A carbon tax rate of up to 7.4 EUR/tCO
2 (less than 10 USD/tCO
2) would be sufficient to finance fiscal stimulus (tax exemptions and concessional finance) for all mitigation technologies (scenario EE+MR+NG+RN+SB+CO). At this rate, the government would be able to support manufacturing sectors with concessional grants worth EUR
2005 24,076 million in total over 2018 to 2030 and tax exemptions (up to 11.3 percentage points) to invest in low carbon technologies that achieve maximum mitigation potential.


