The Push-Over Test and Numerical Analysis Study on the Mechanical Behavior of the GFRP Frame for Sustainable Prefabricated Houses


Abstract
1. Introduction
2. GFRP Frame and Experimental Setup
2.1. GFRP Frame
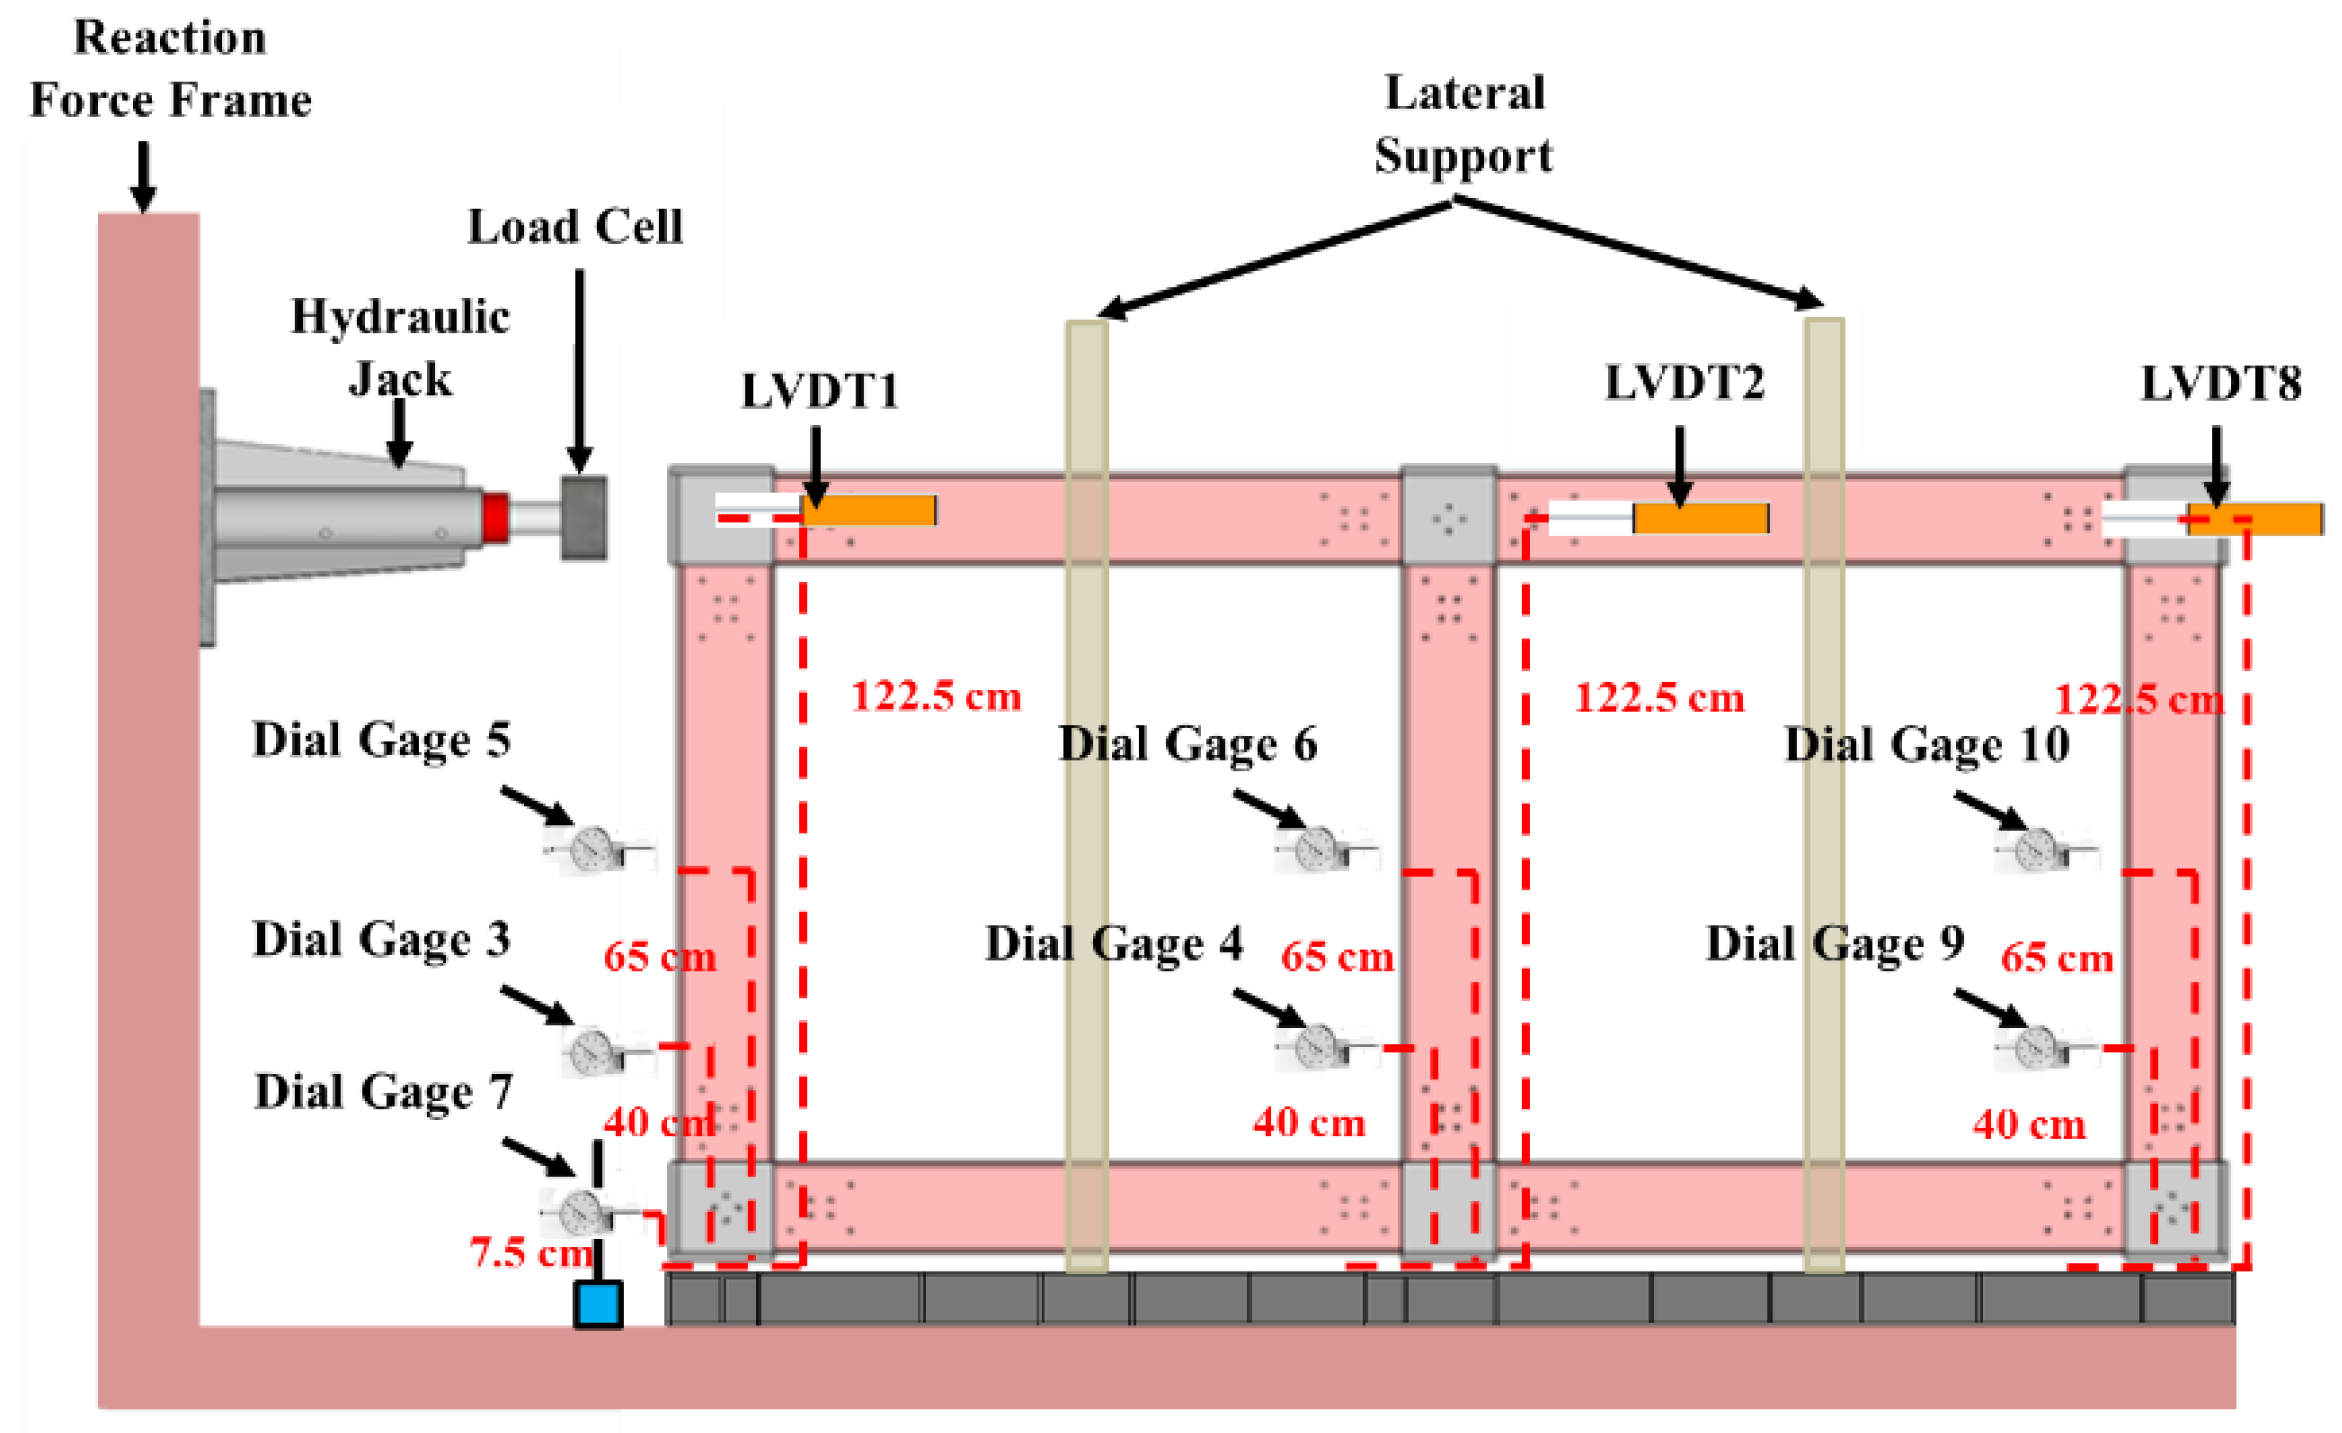
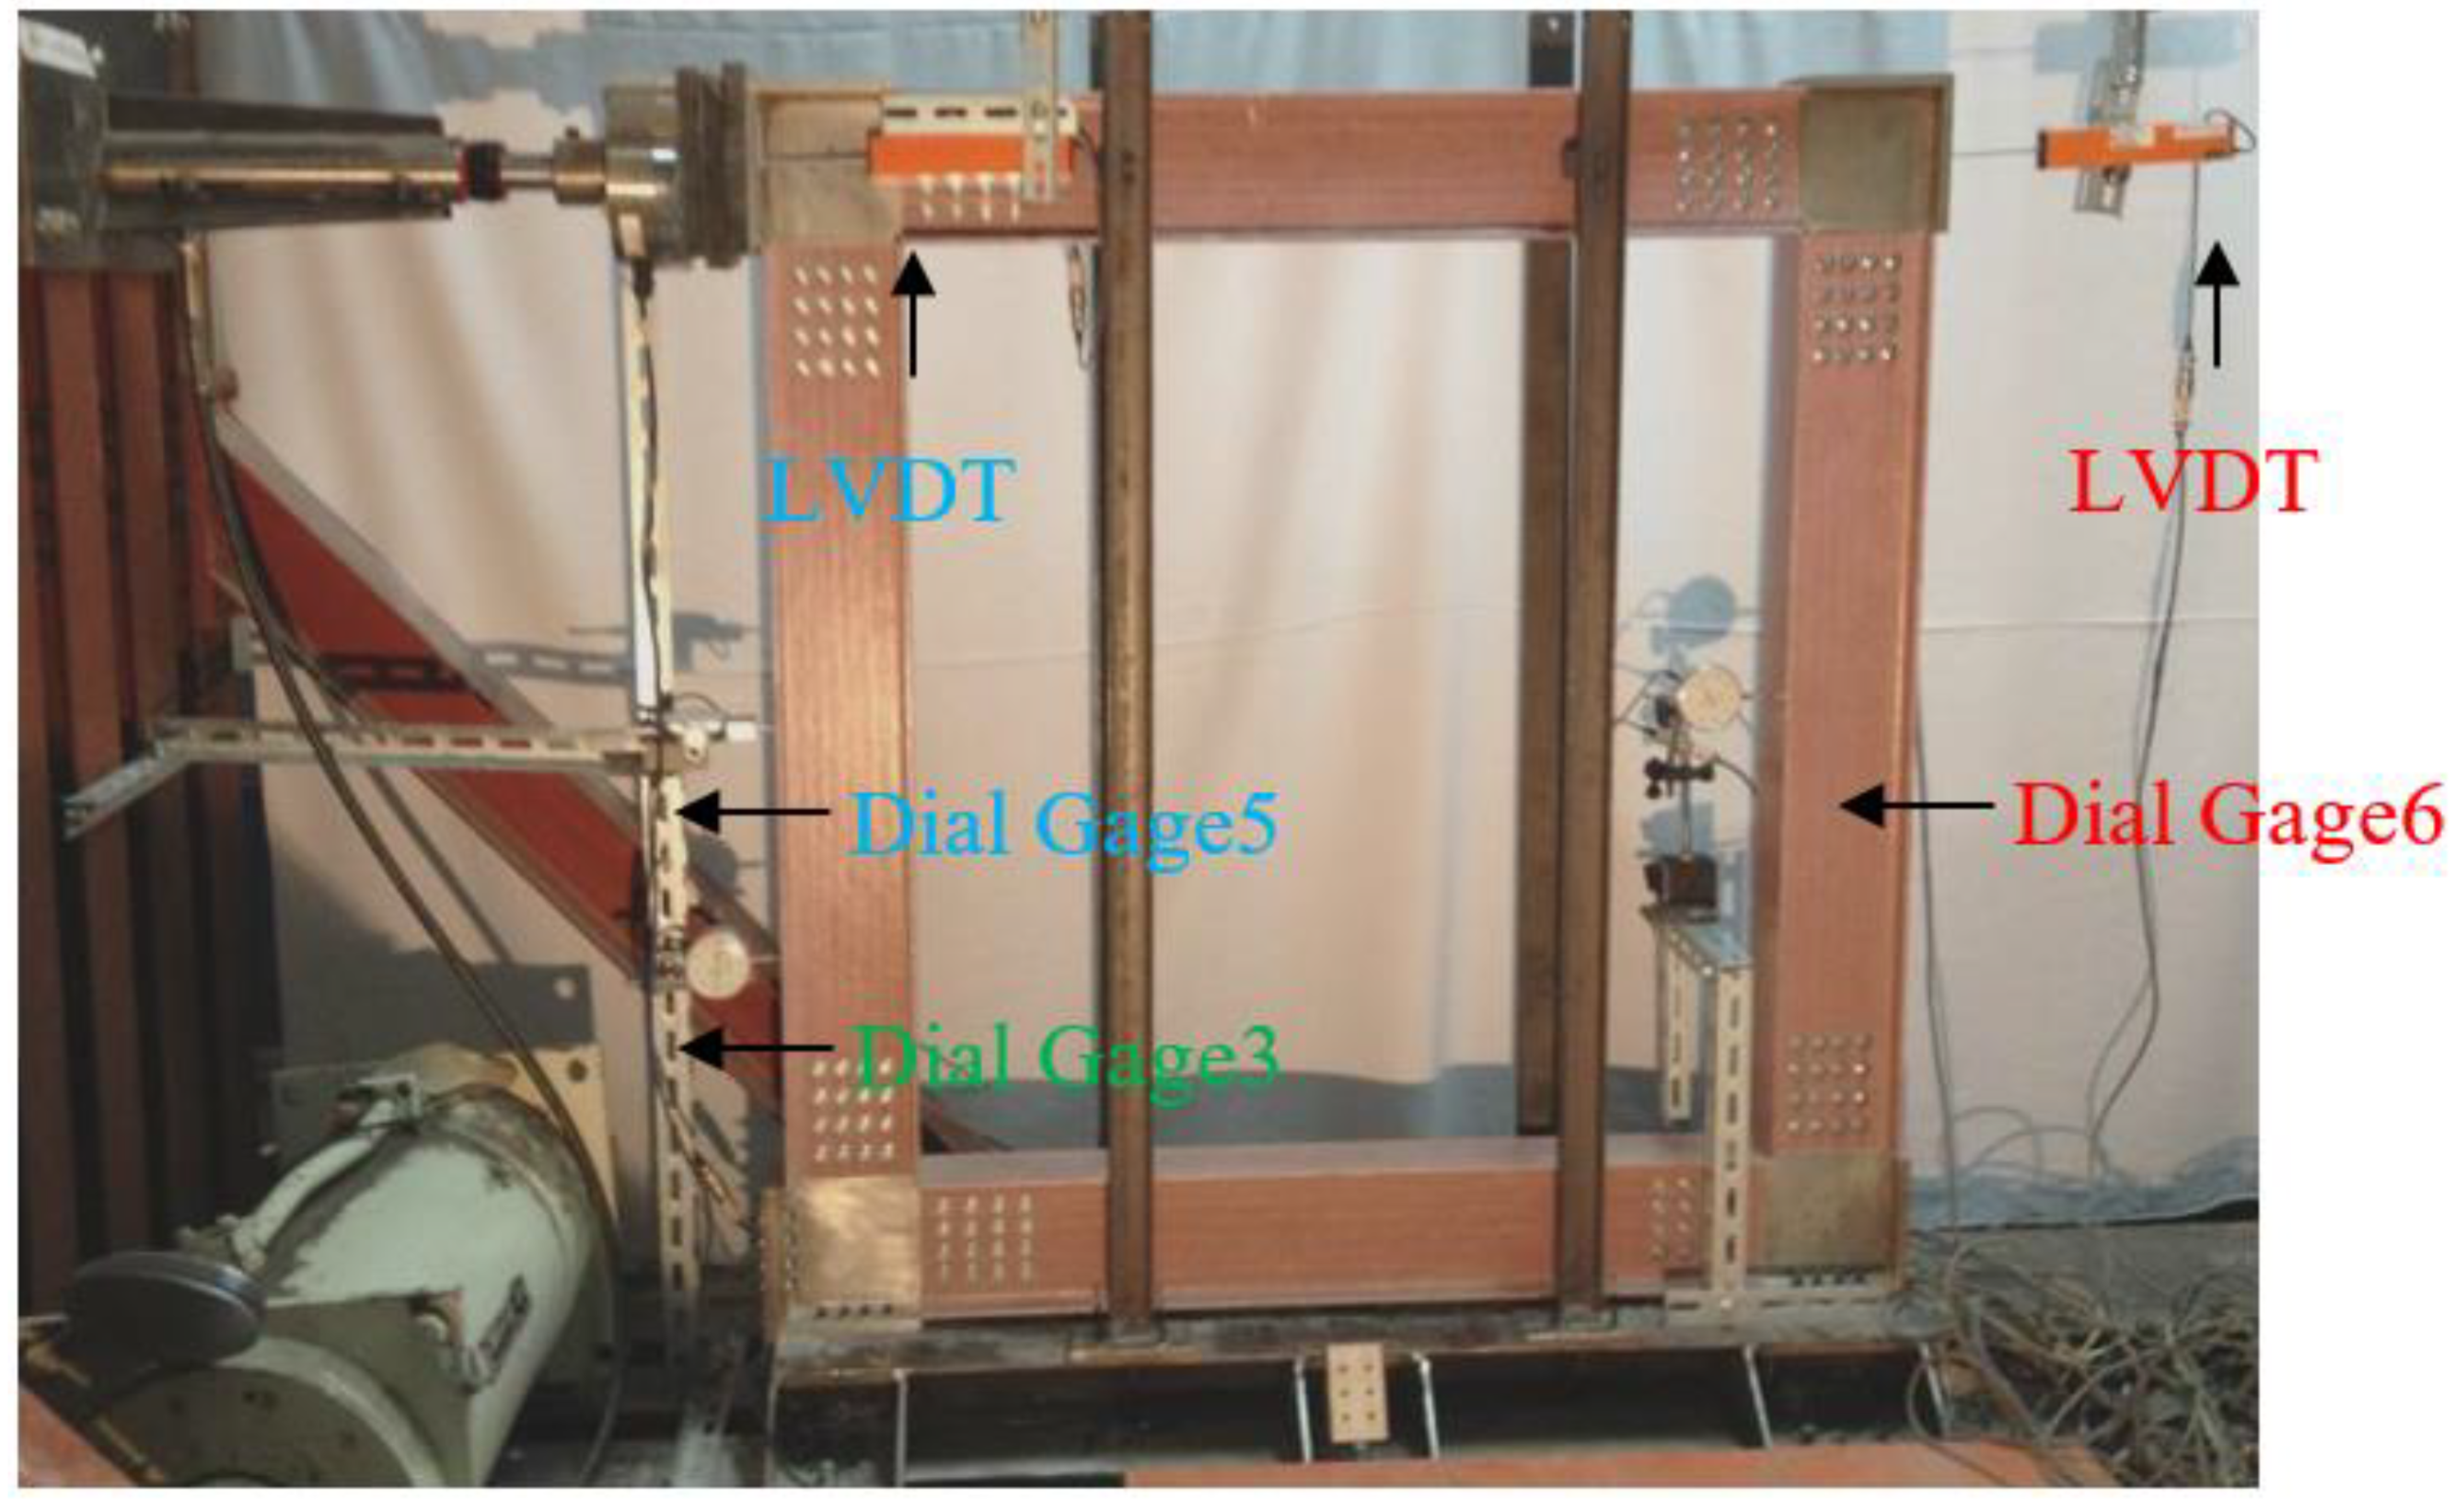
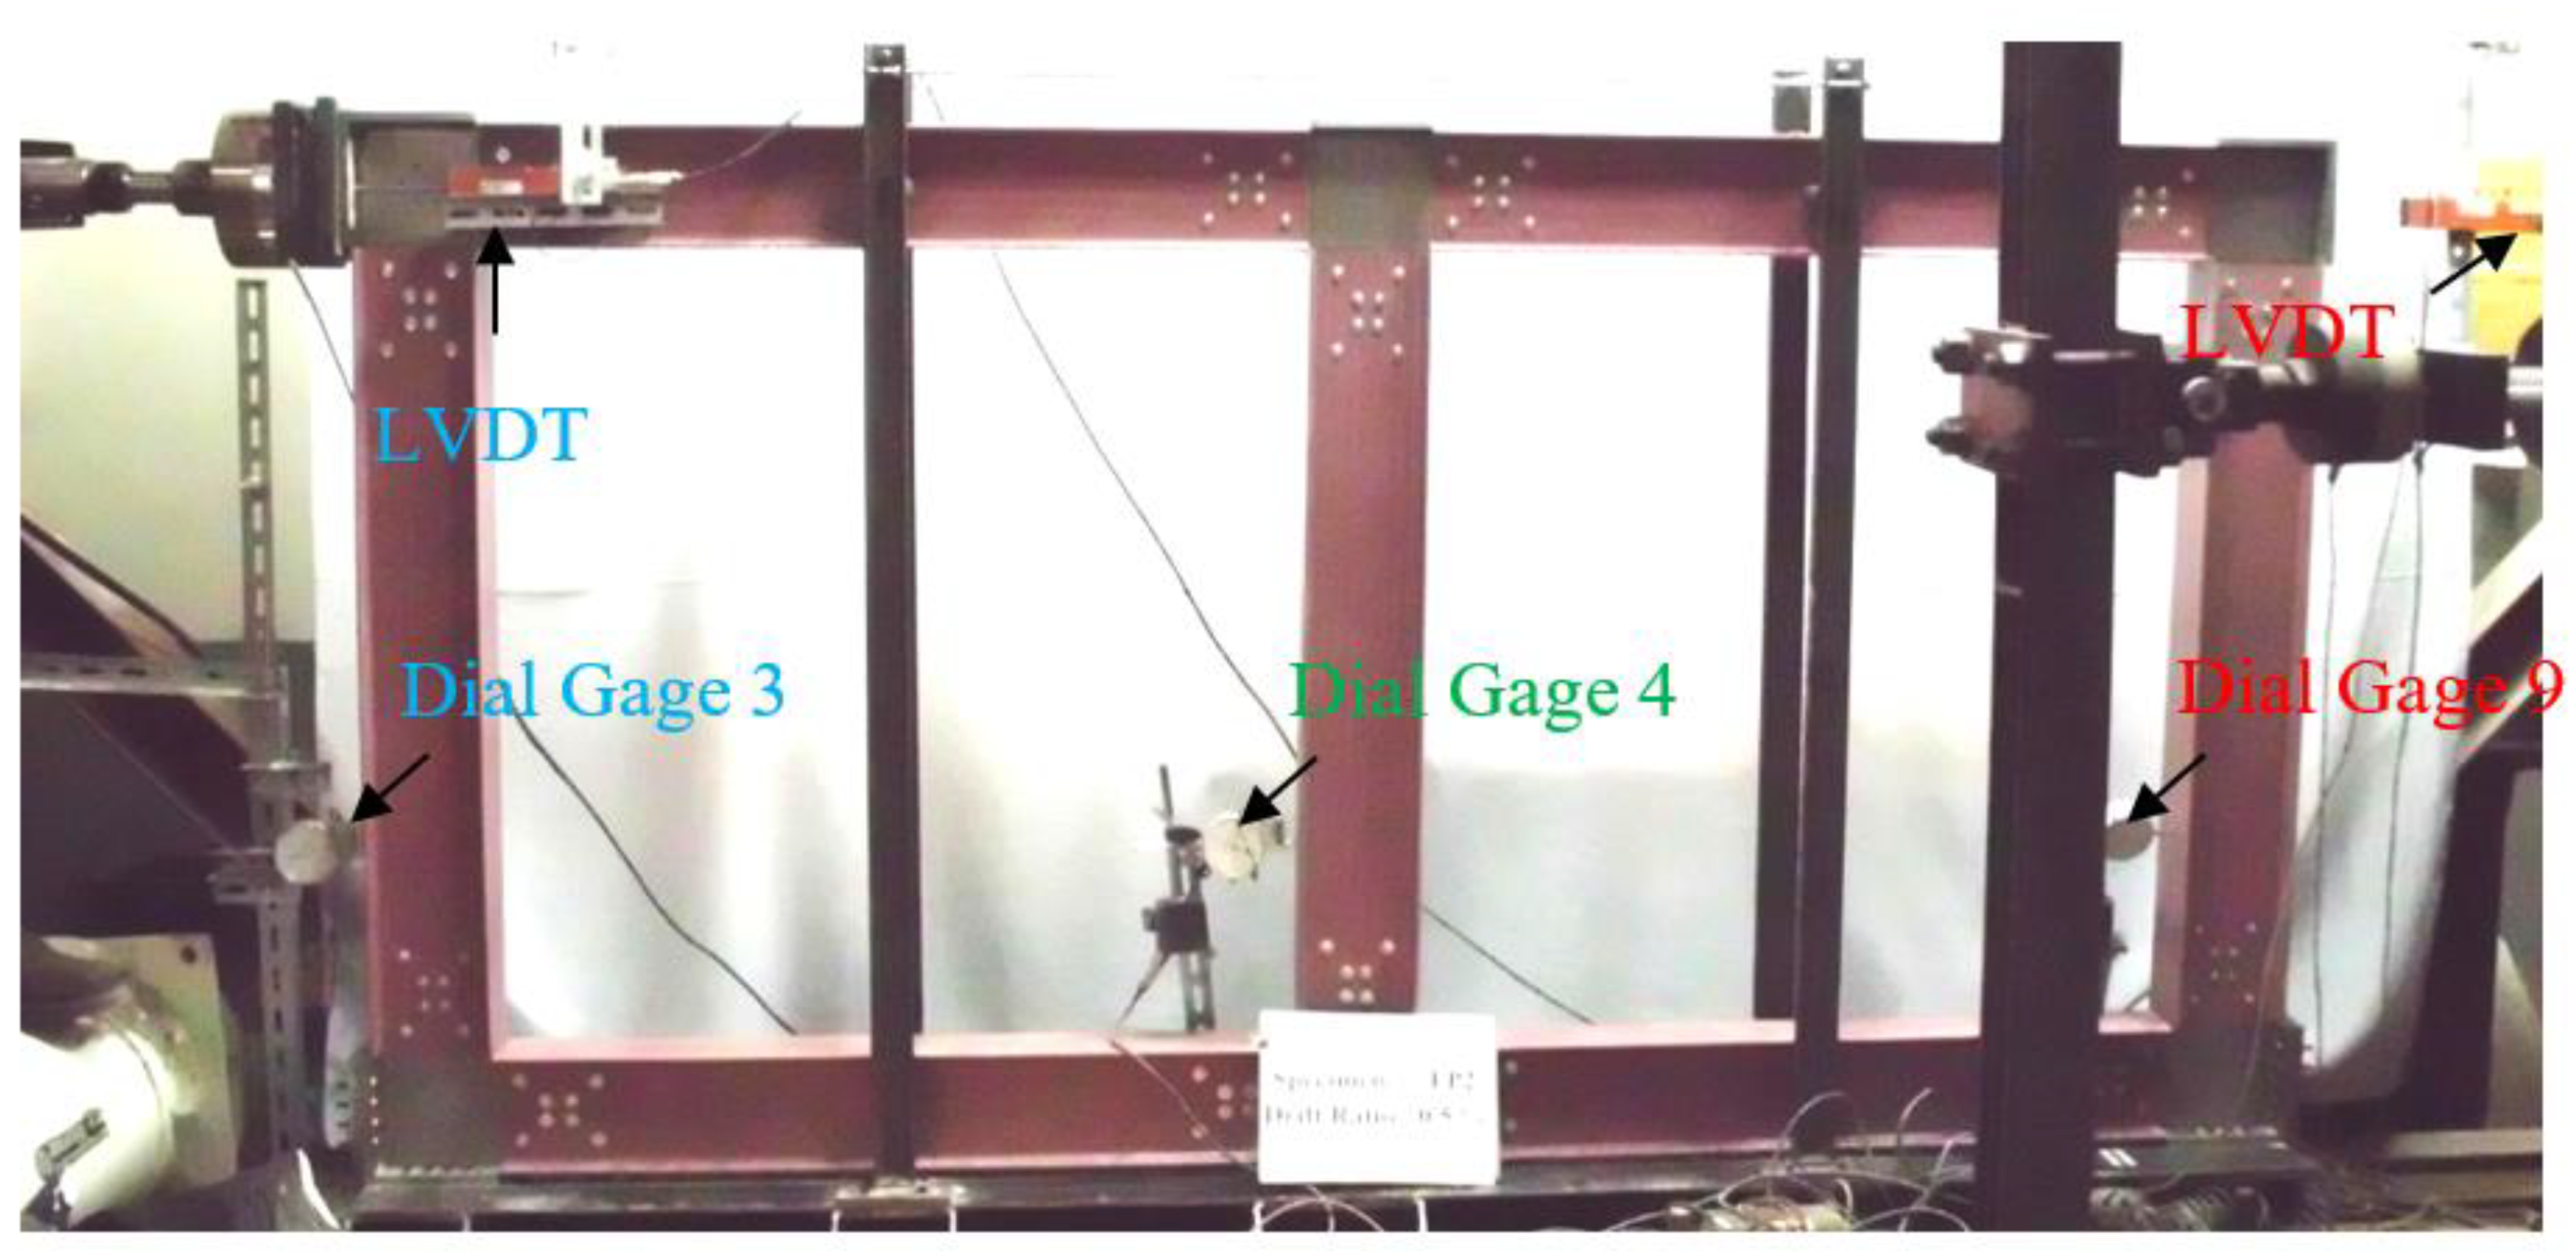
2.2. Experimental Setup
3. Experimental Observations and Discussions of the Pushover Test
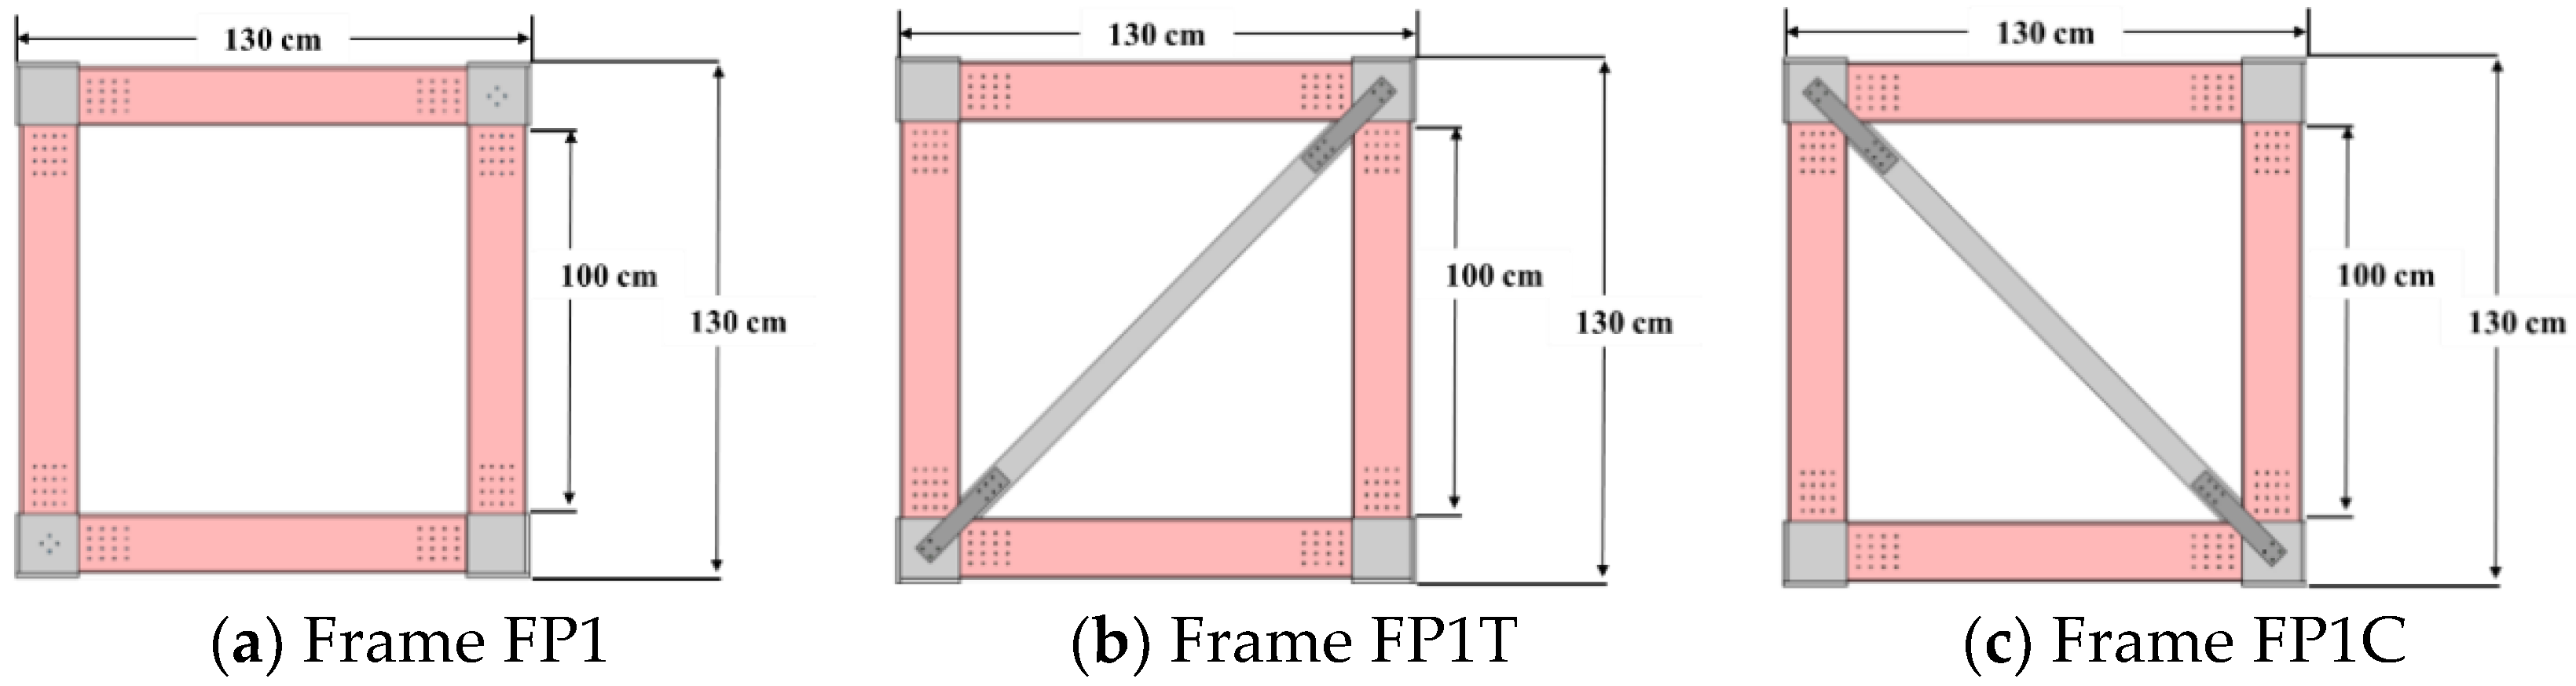
3.1. Single-Span Frames
3.1.1. Frame FP1
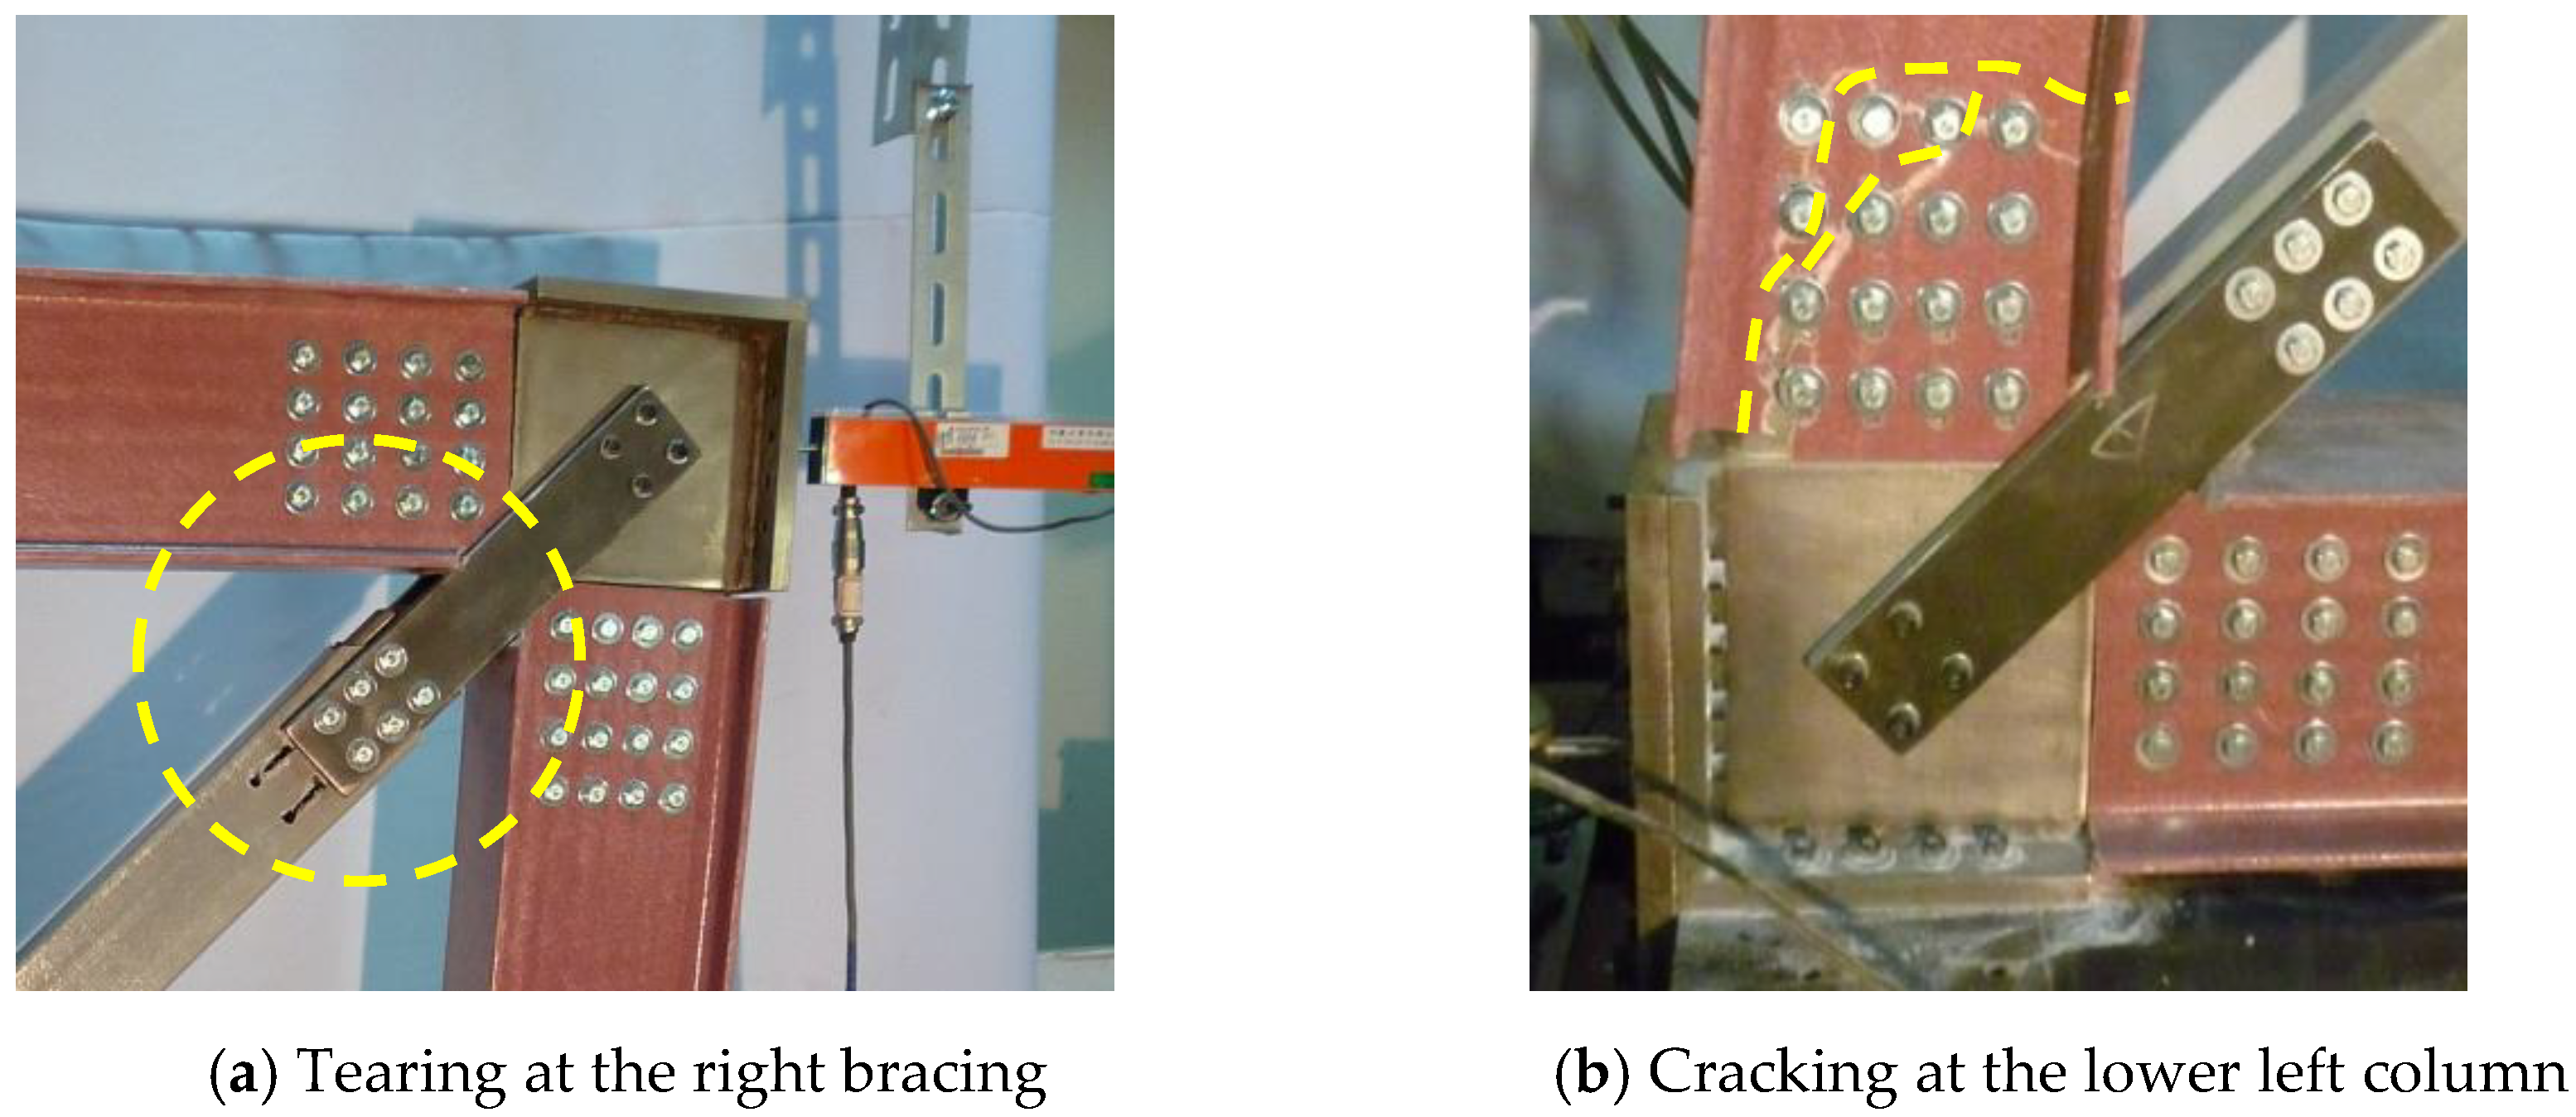
3.1.2. Frame FP1T
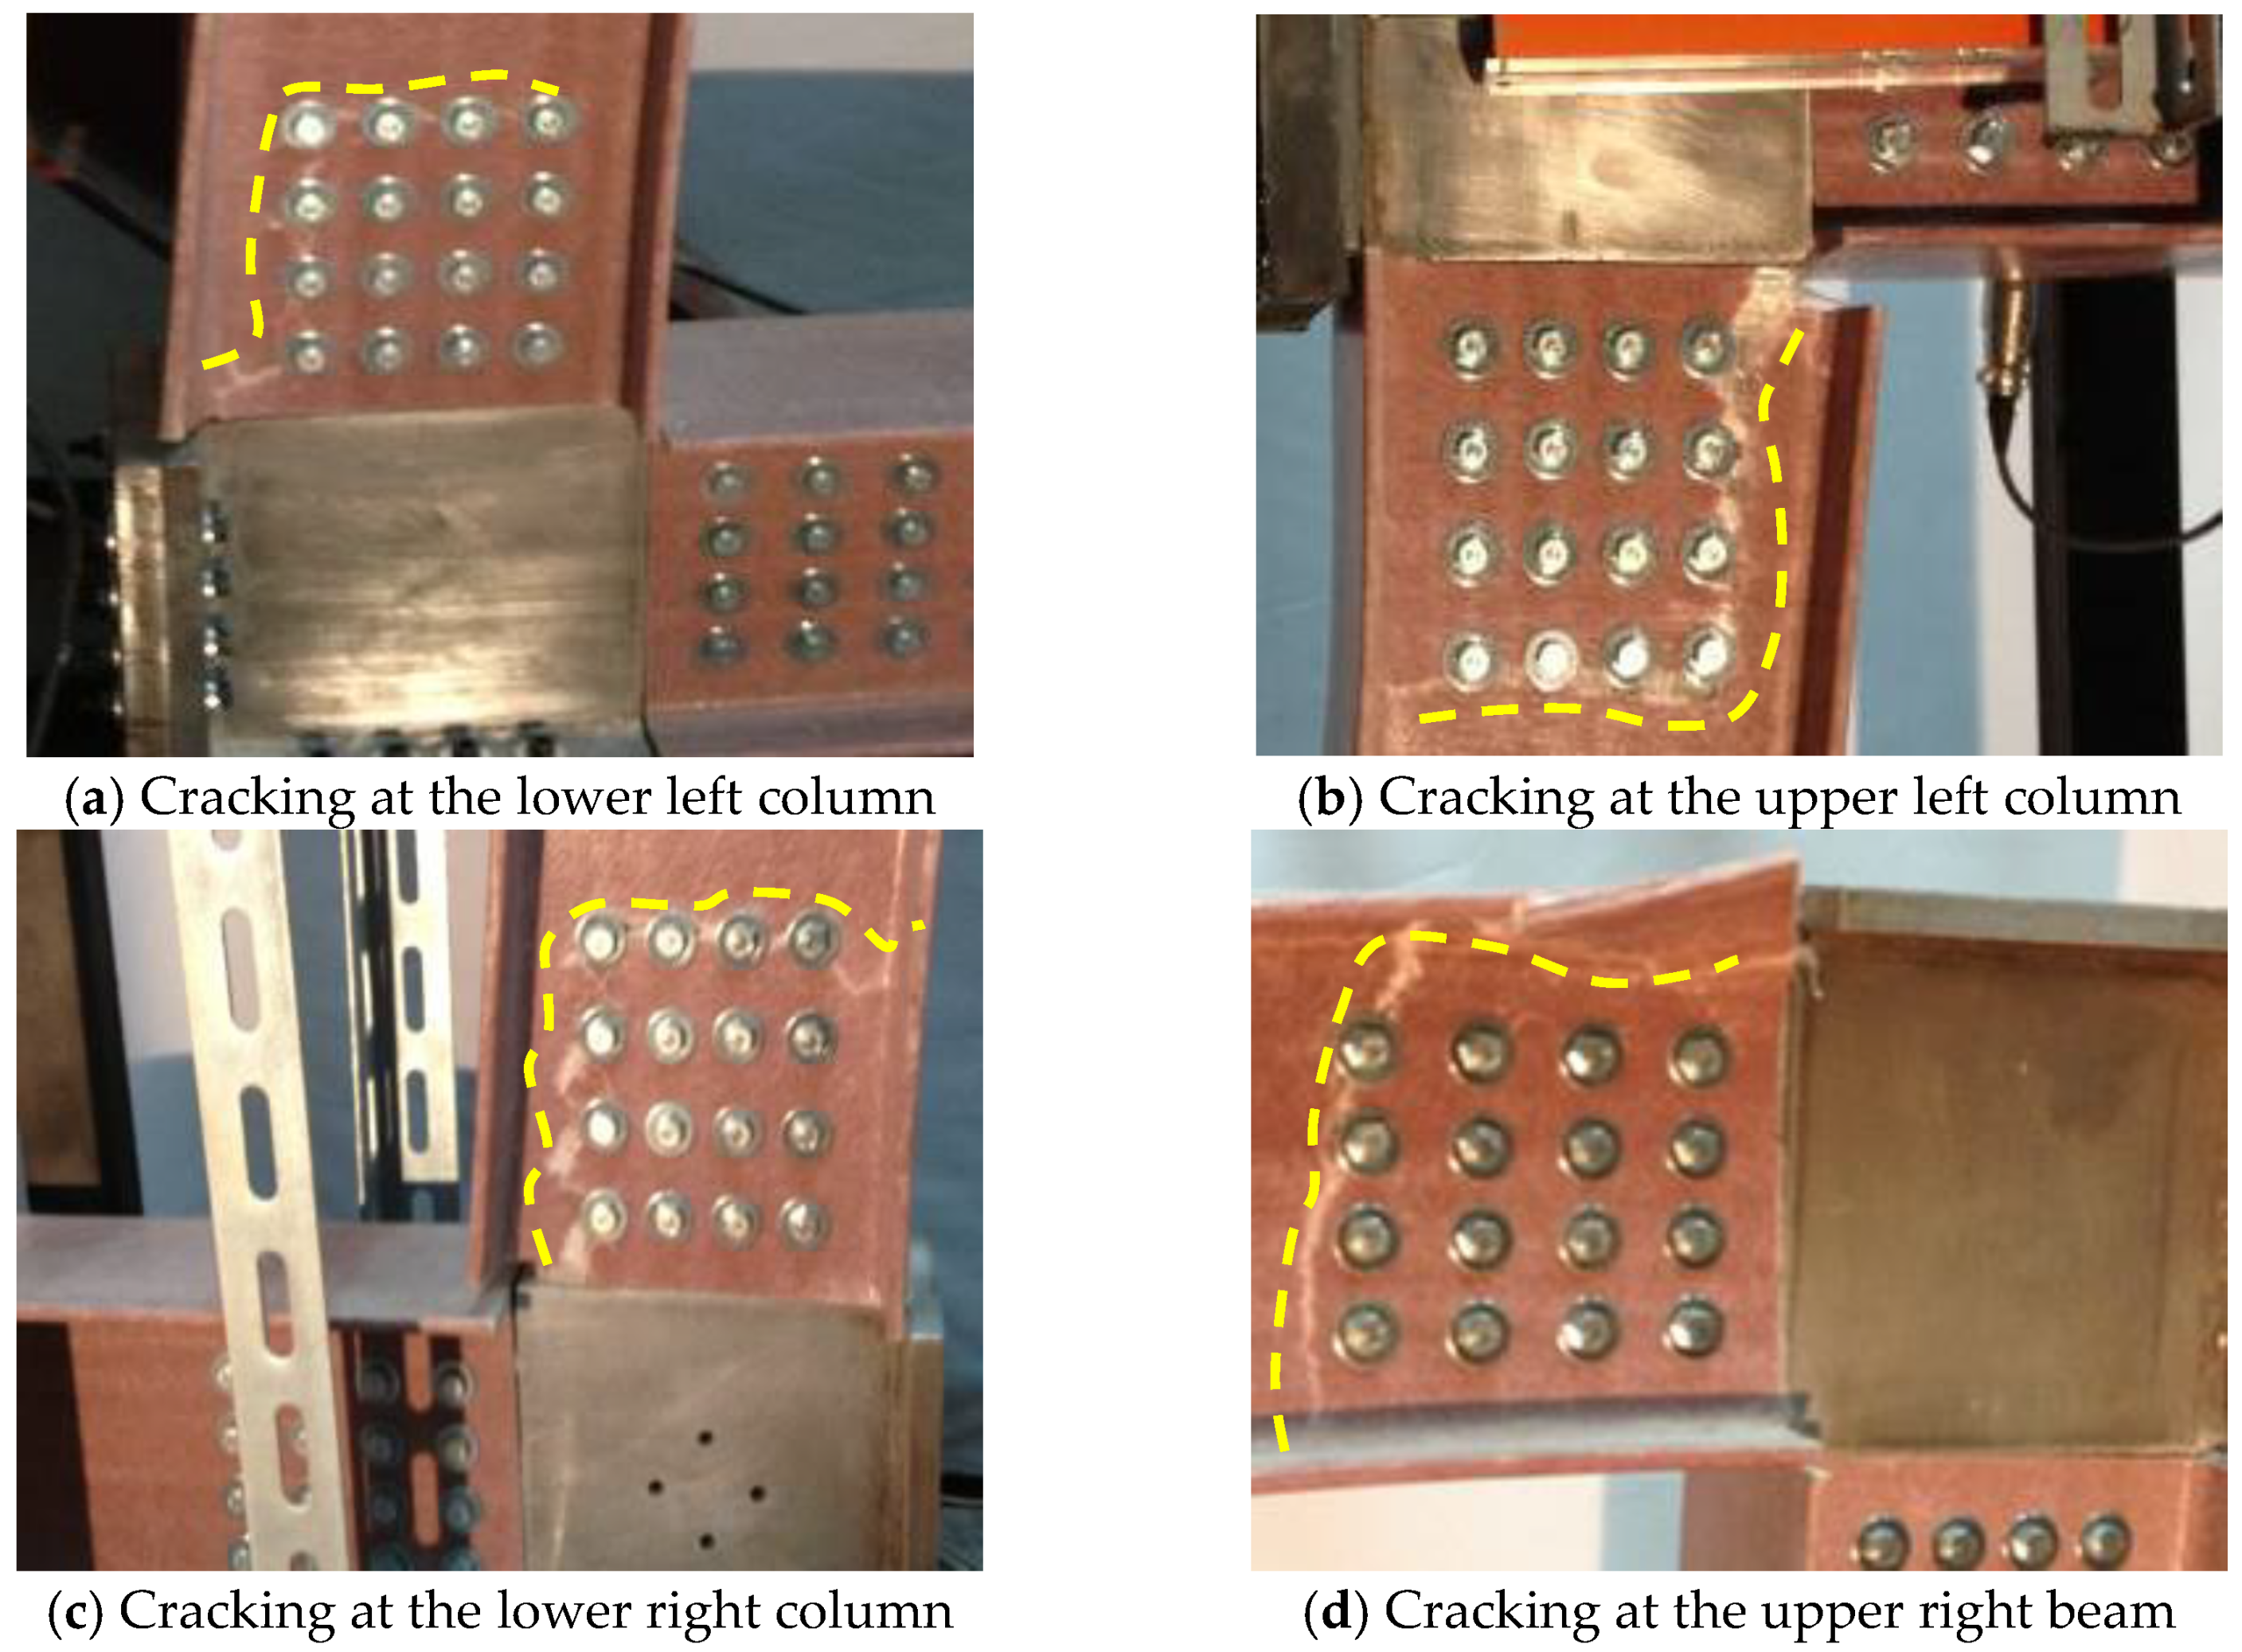
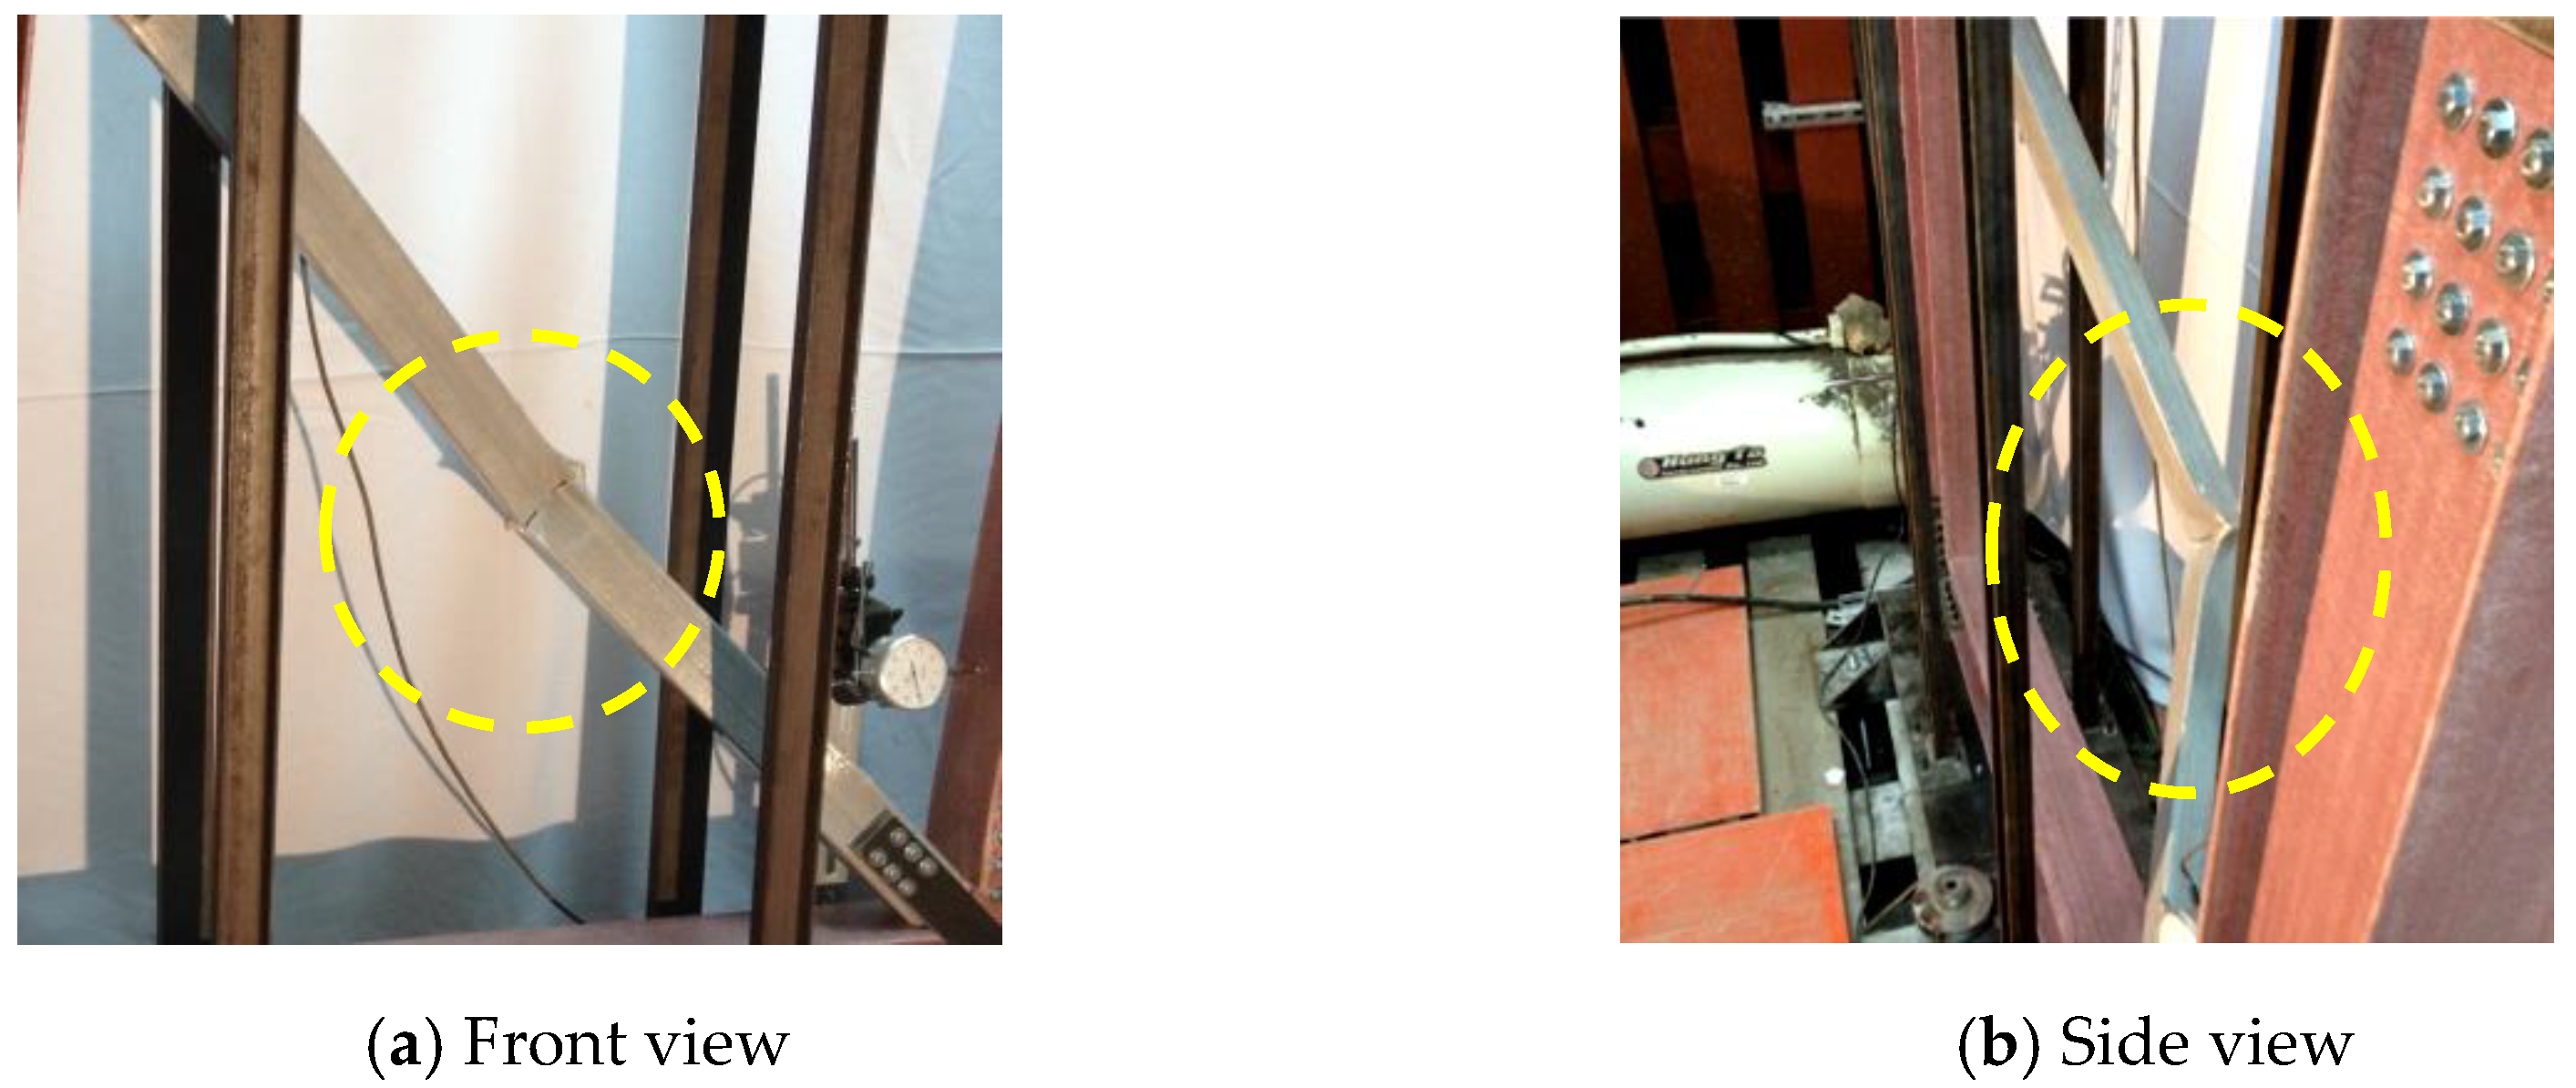
3.1.3. Frame FP1C
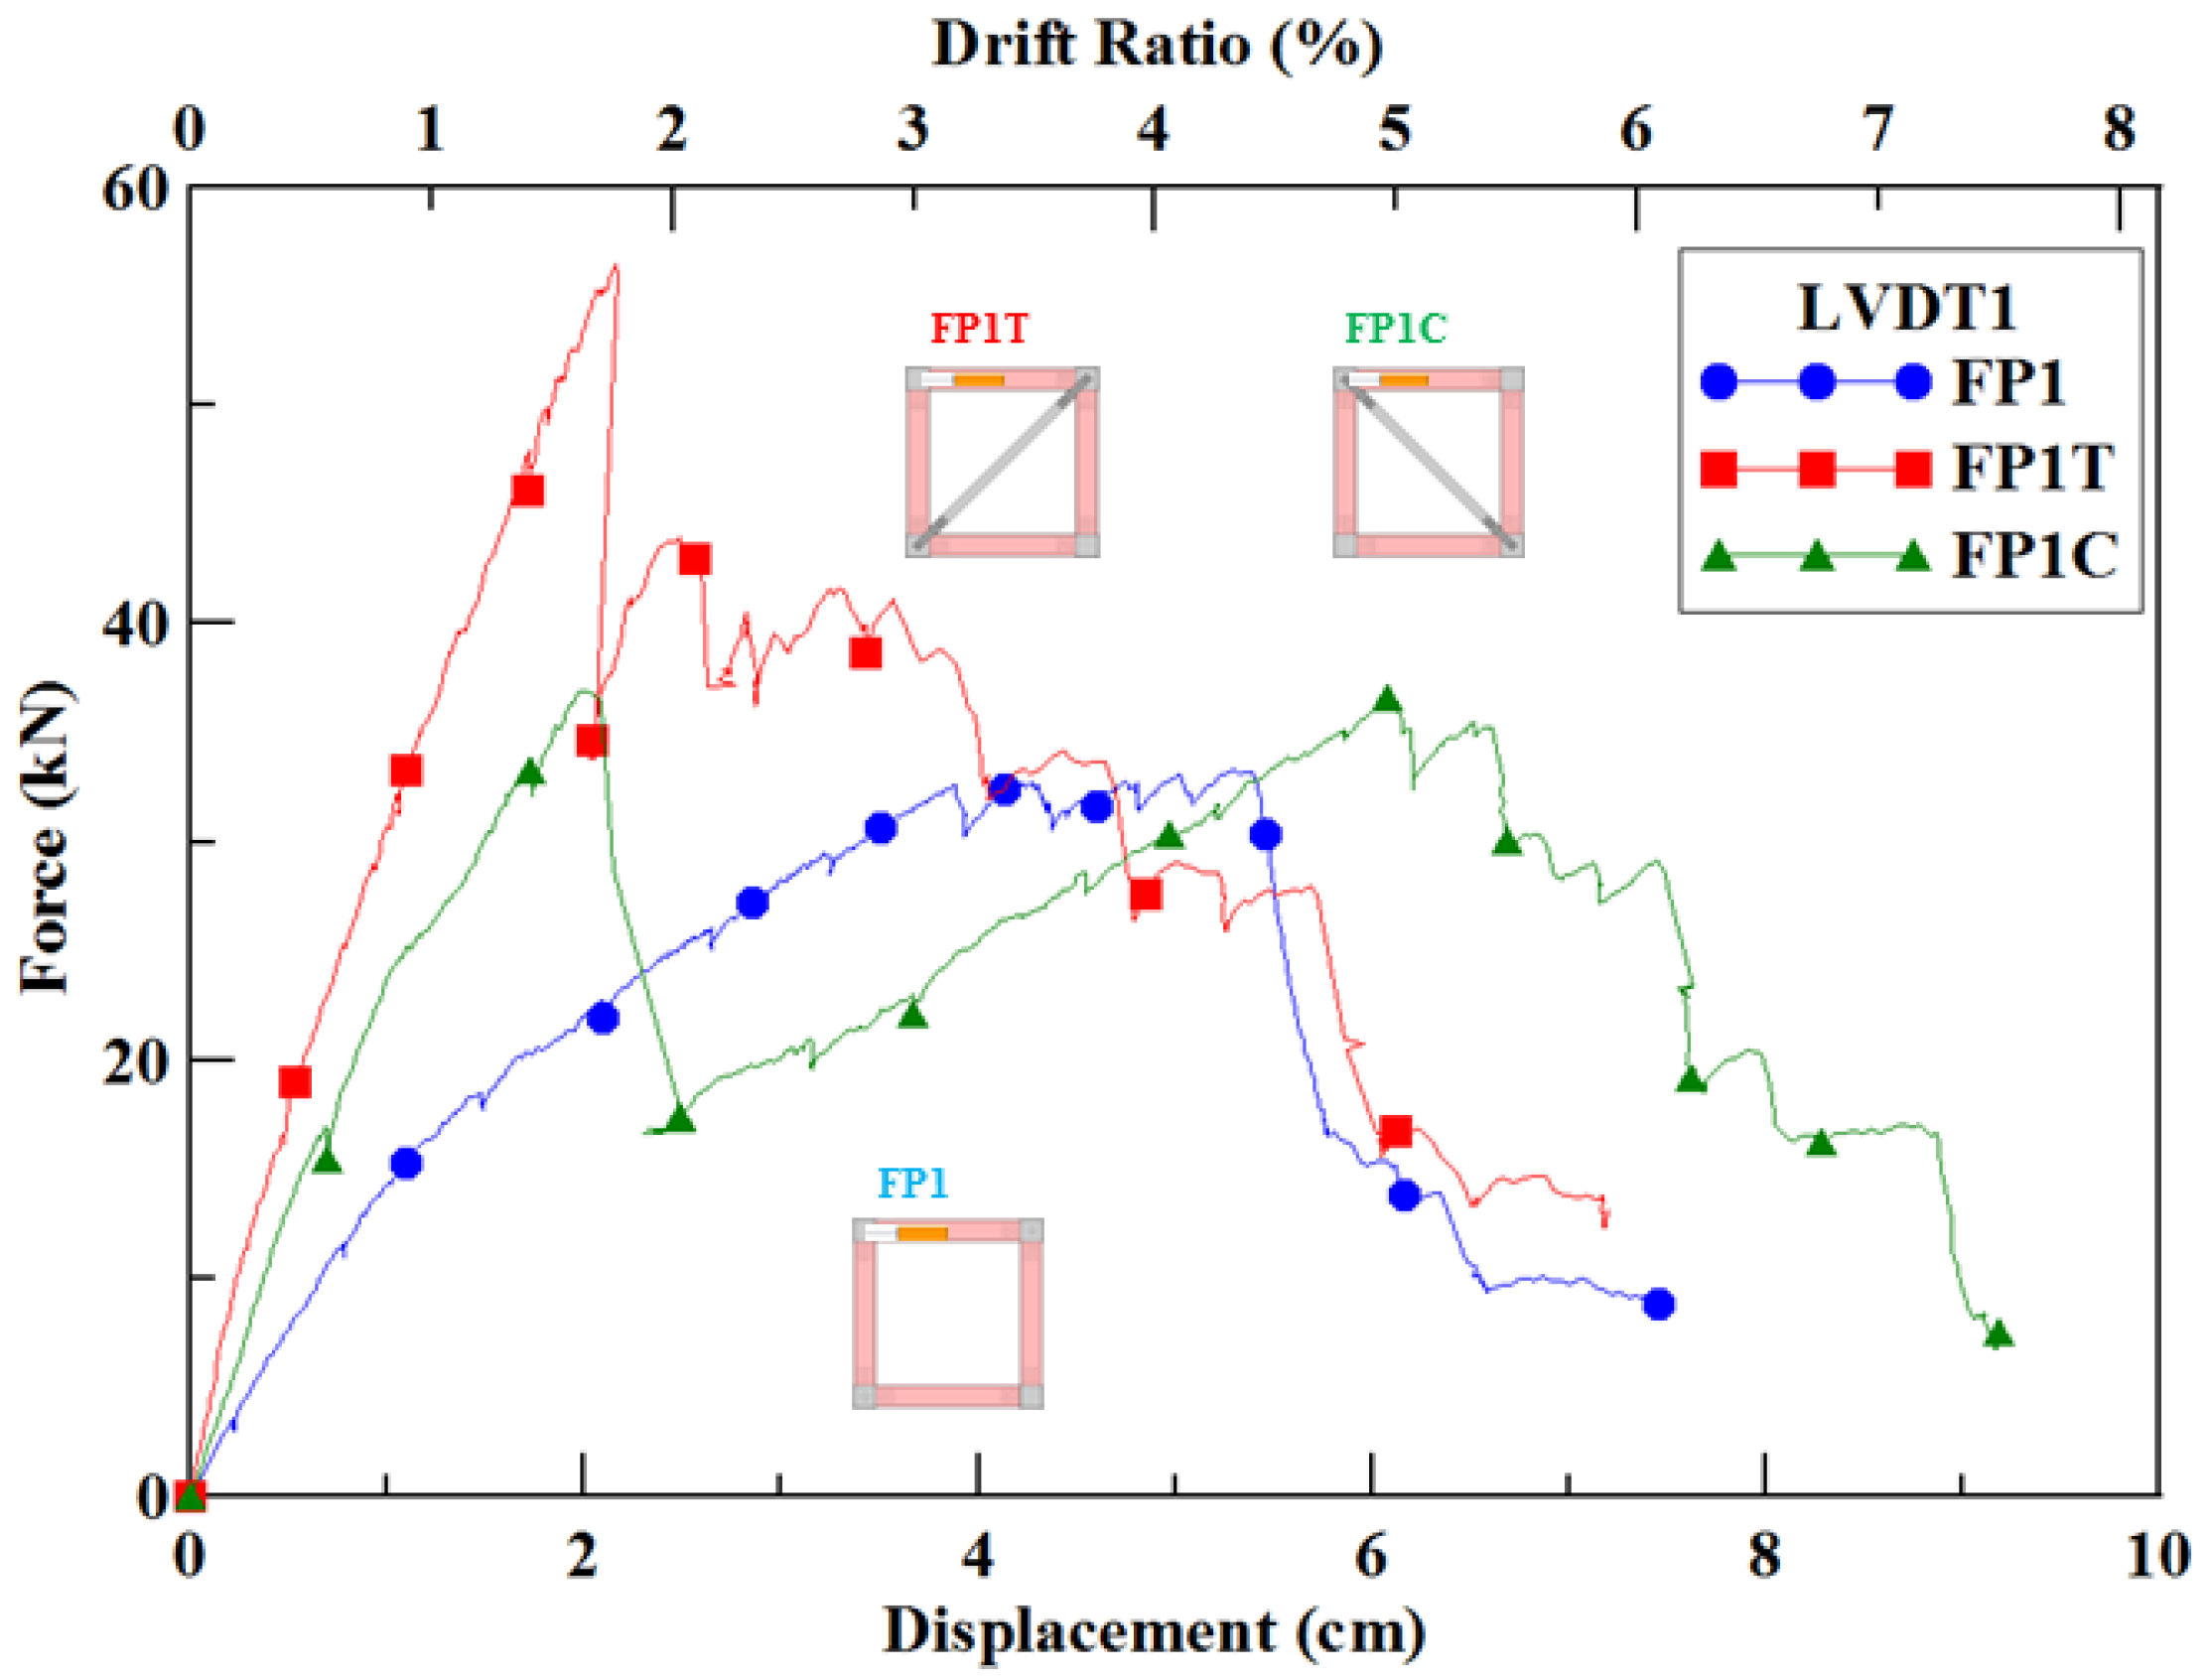
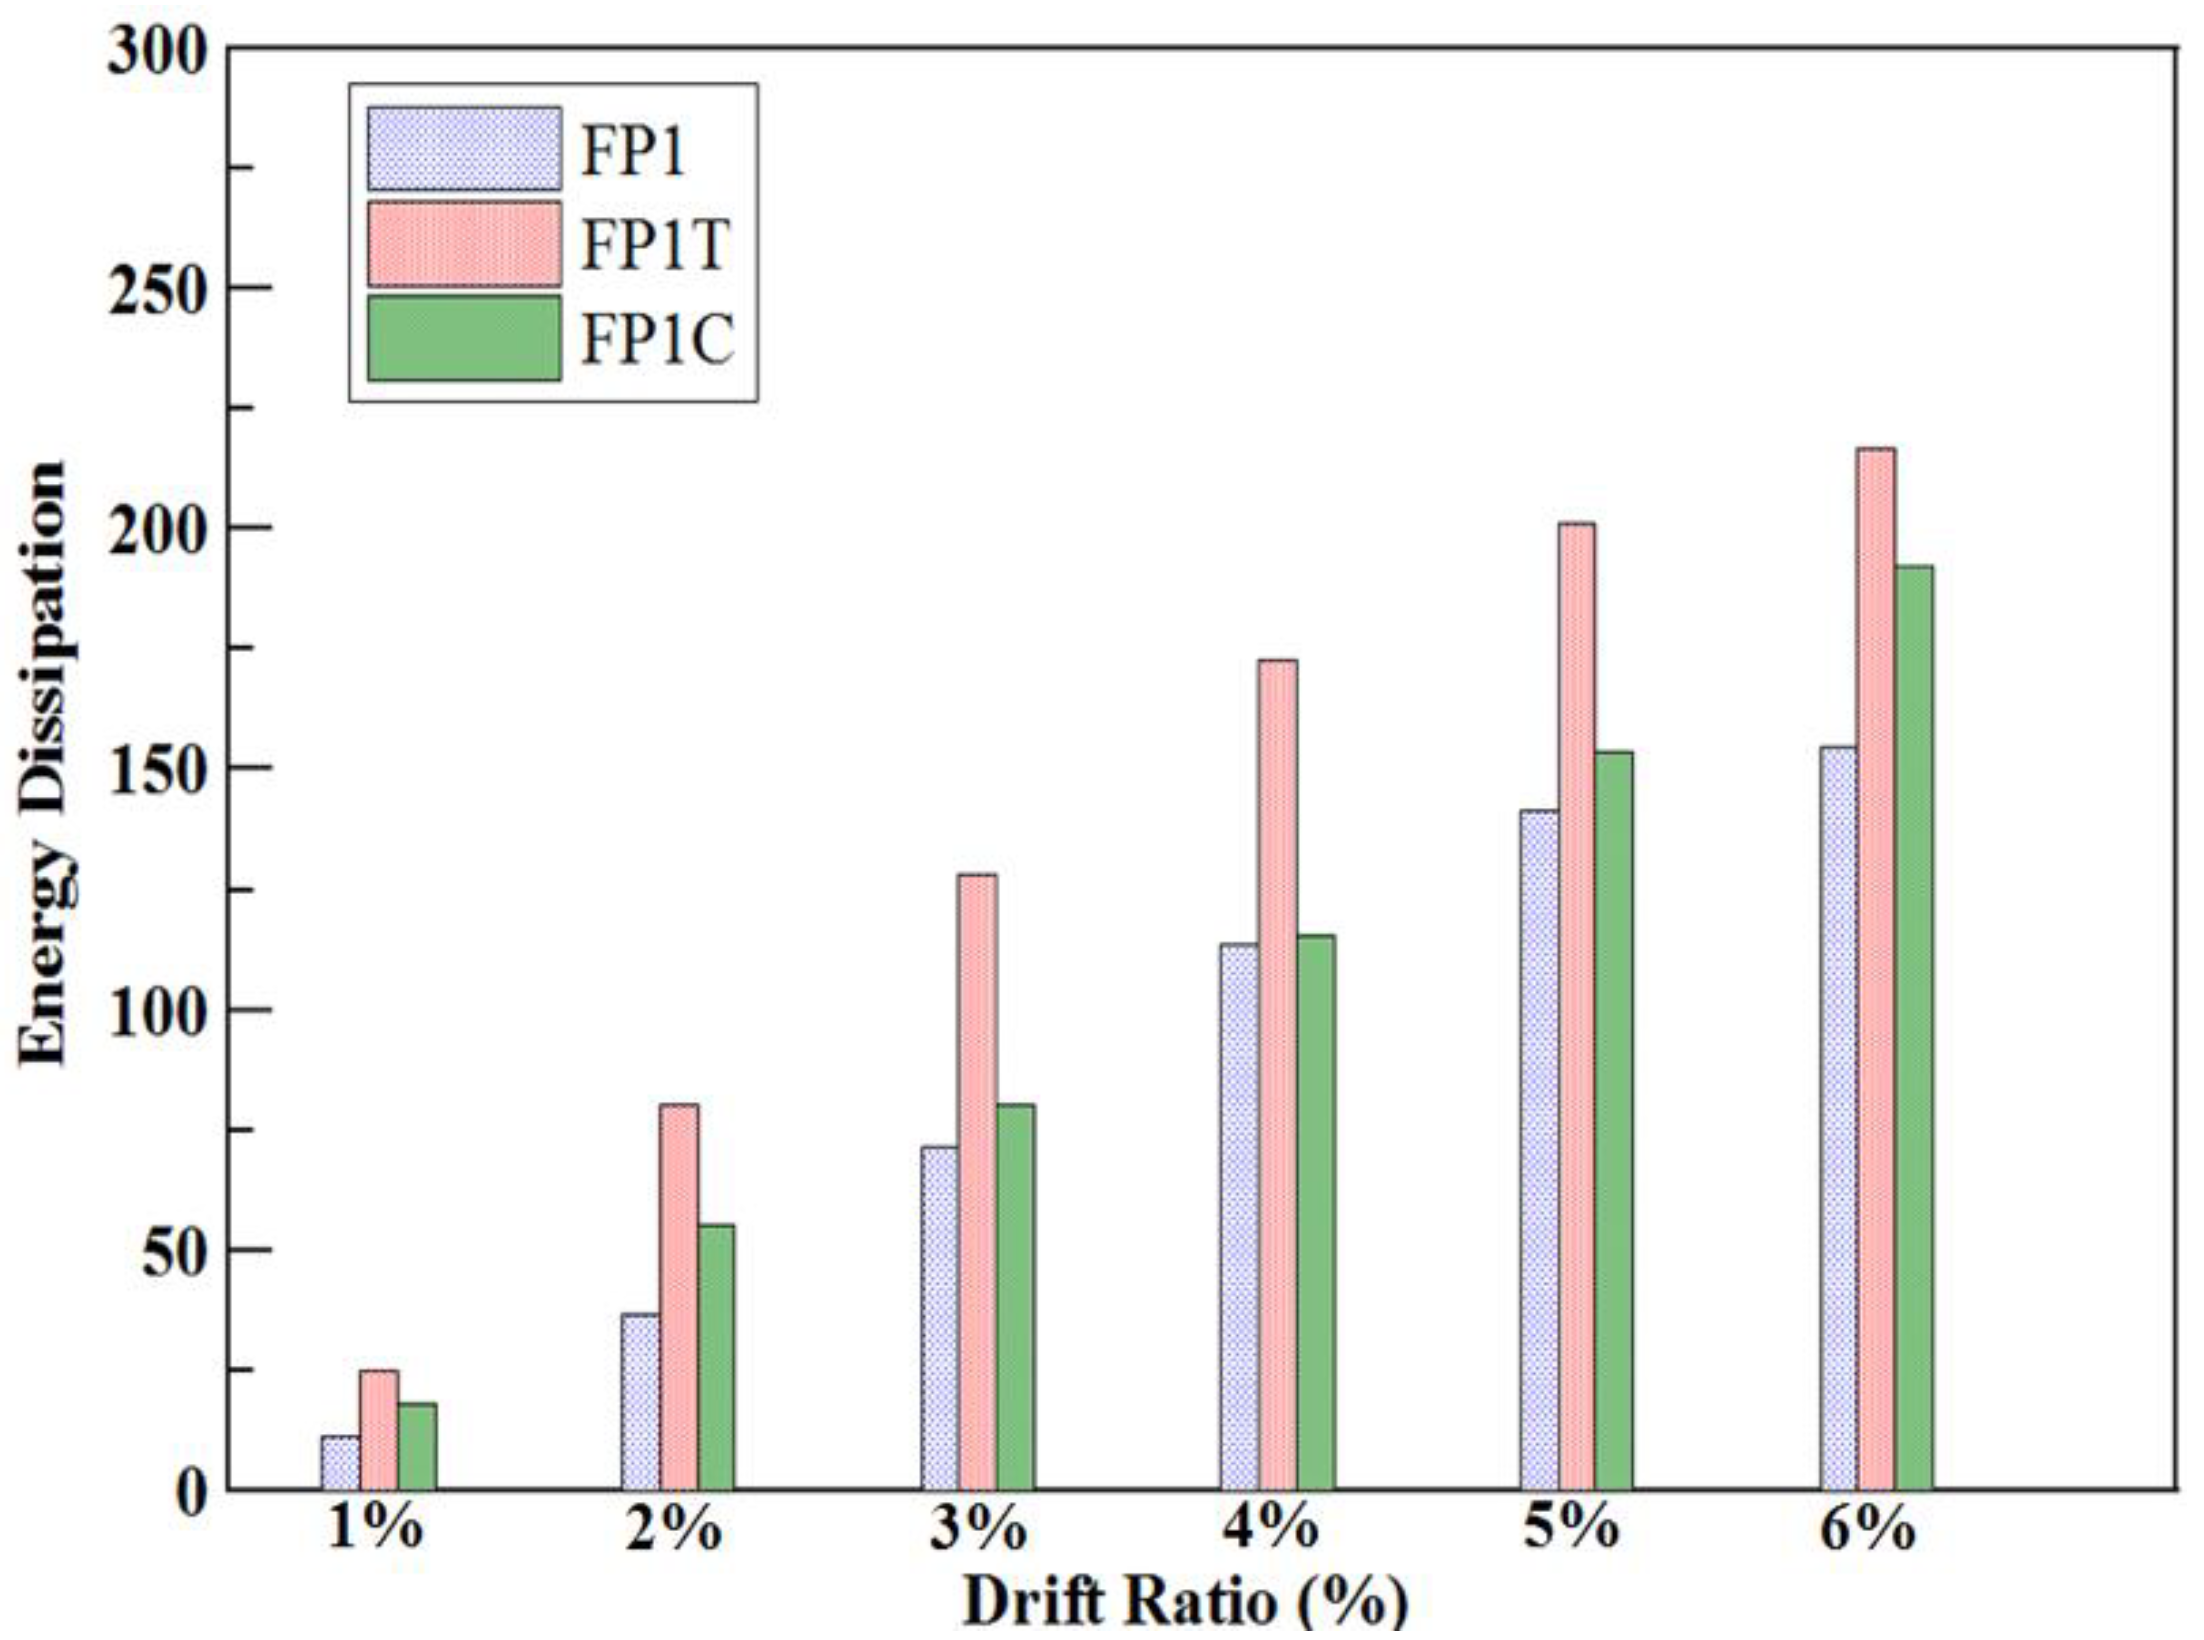
3.1.4. Comparison of the Three Single-Span Frames
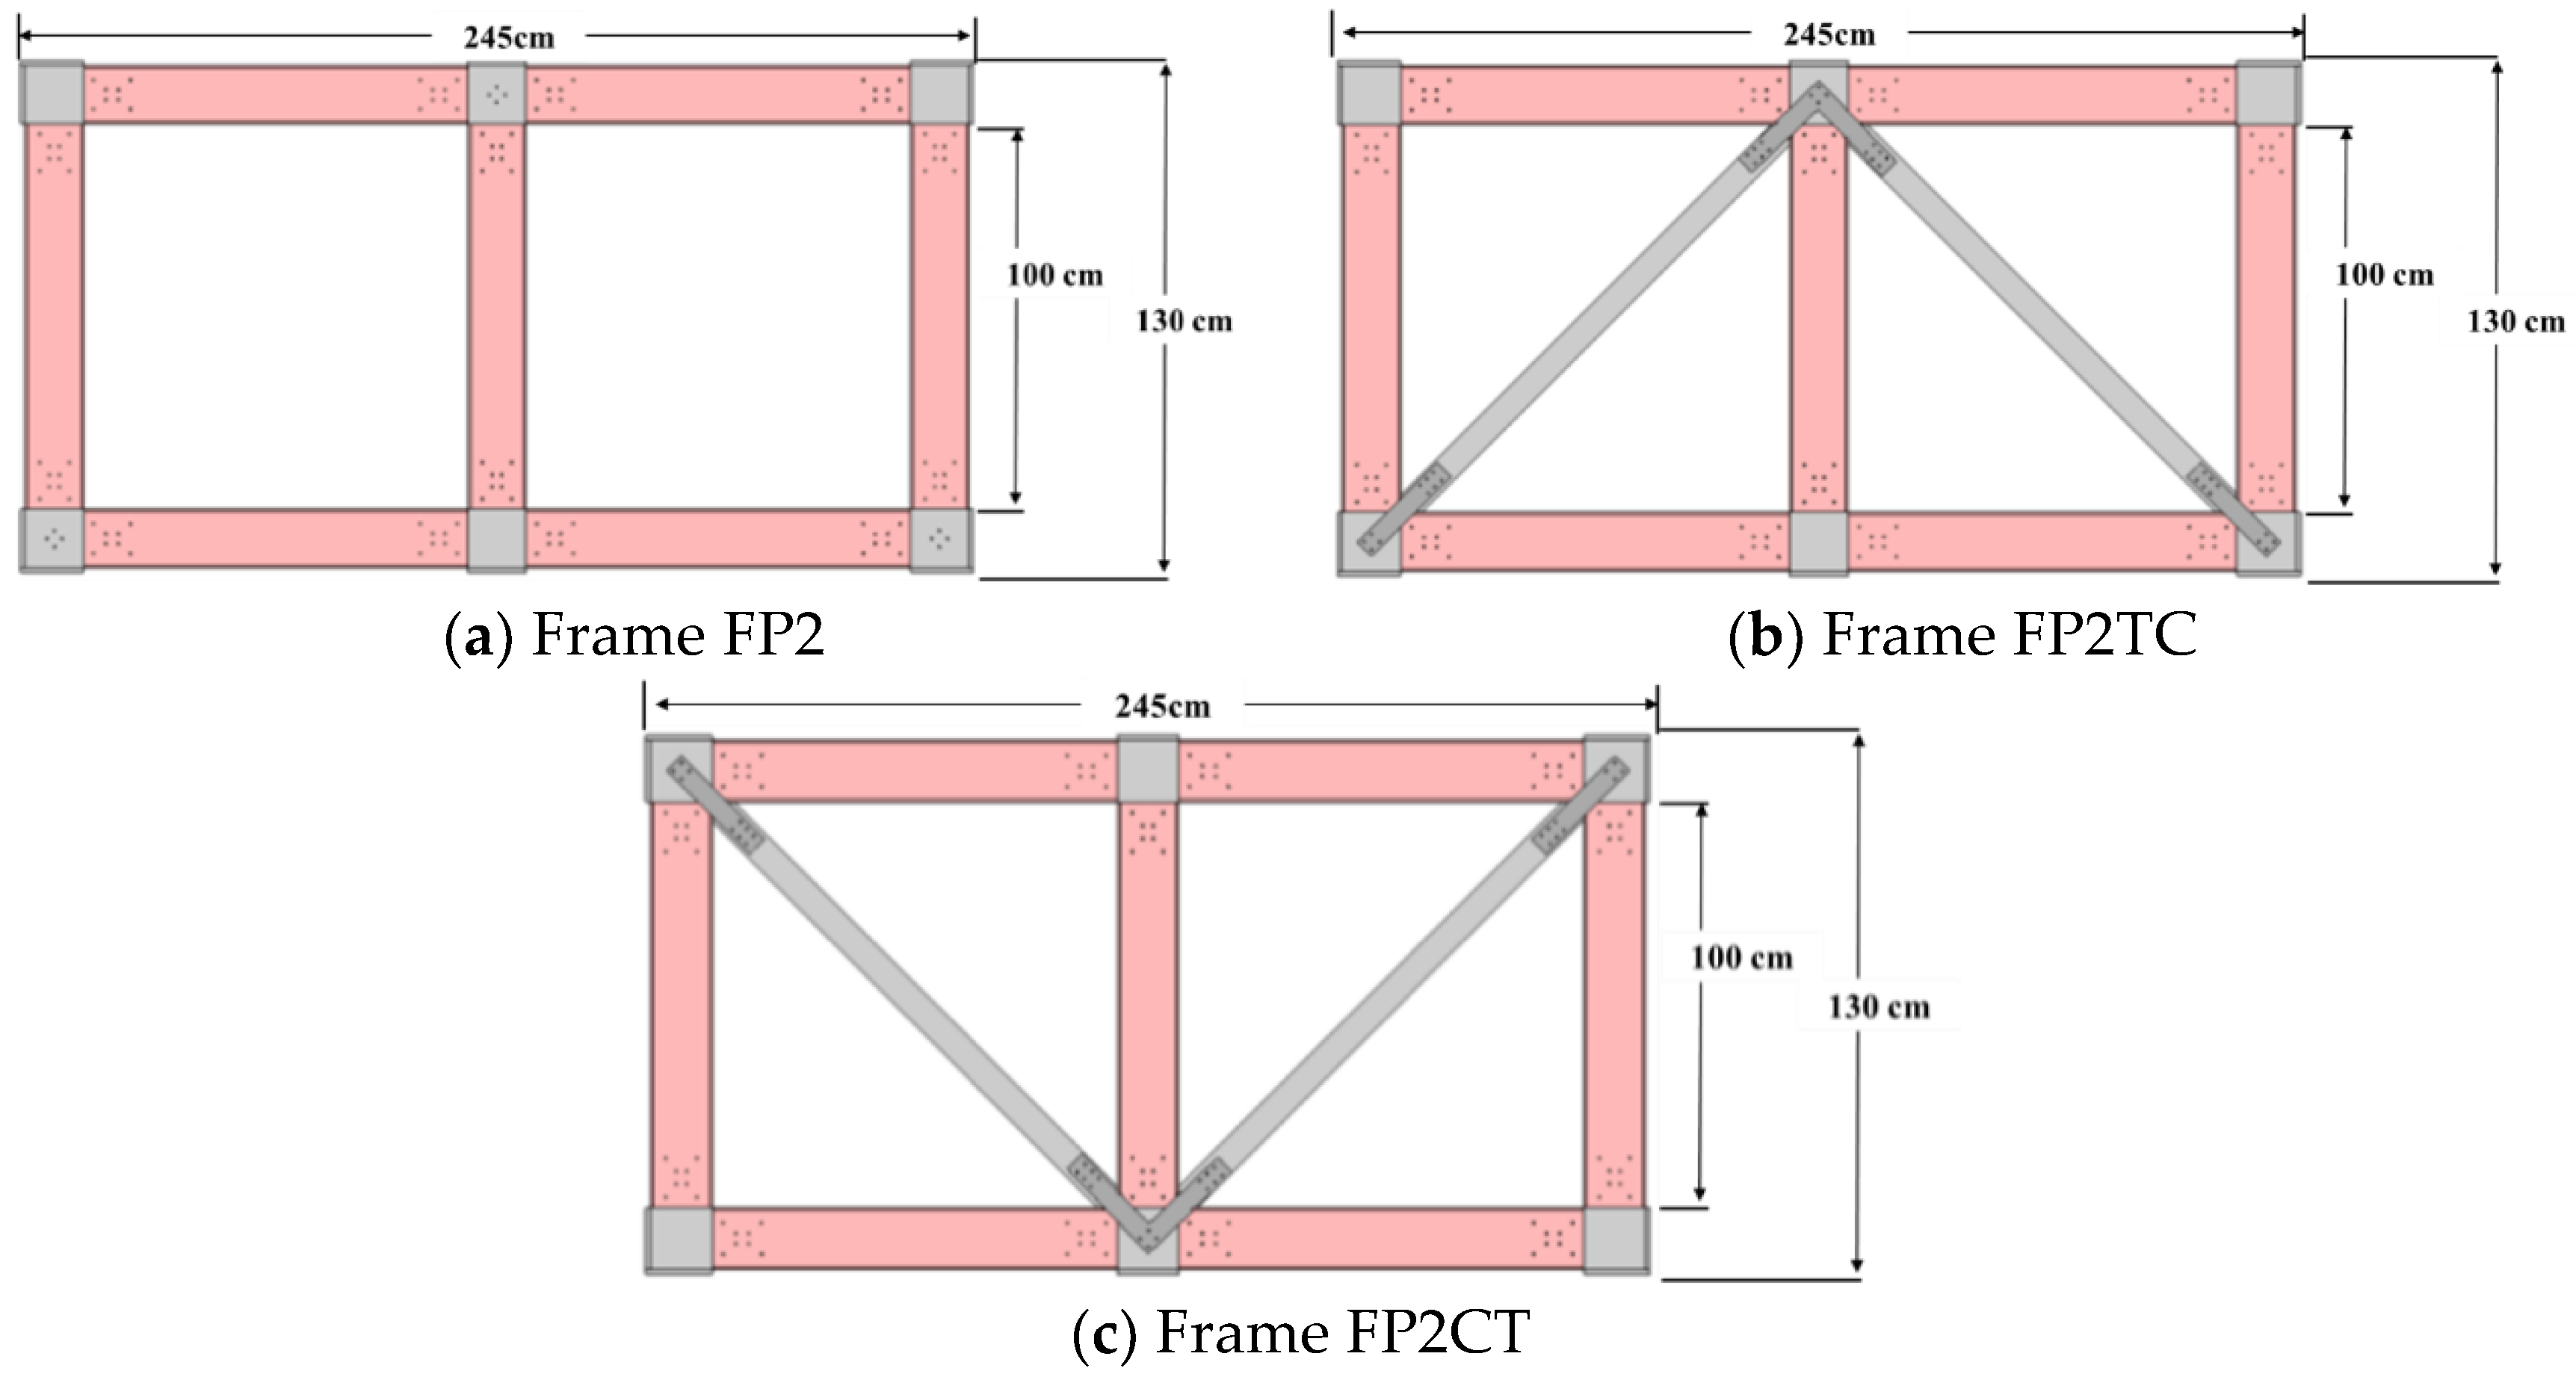
3.2. Double-Span Frames
3.2.1. Frame FP2
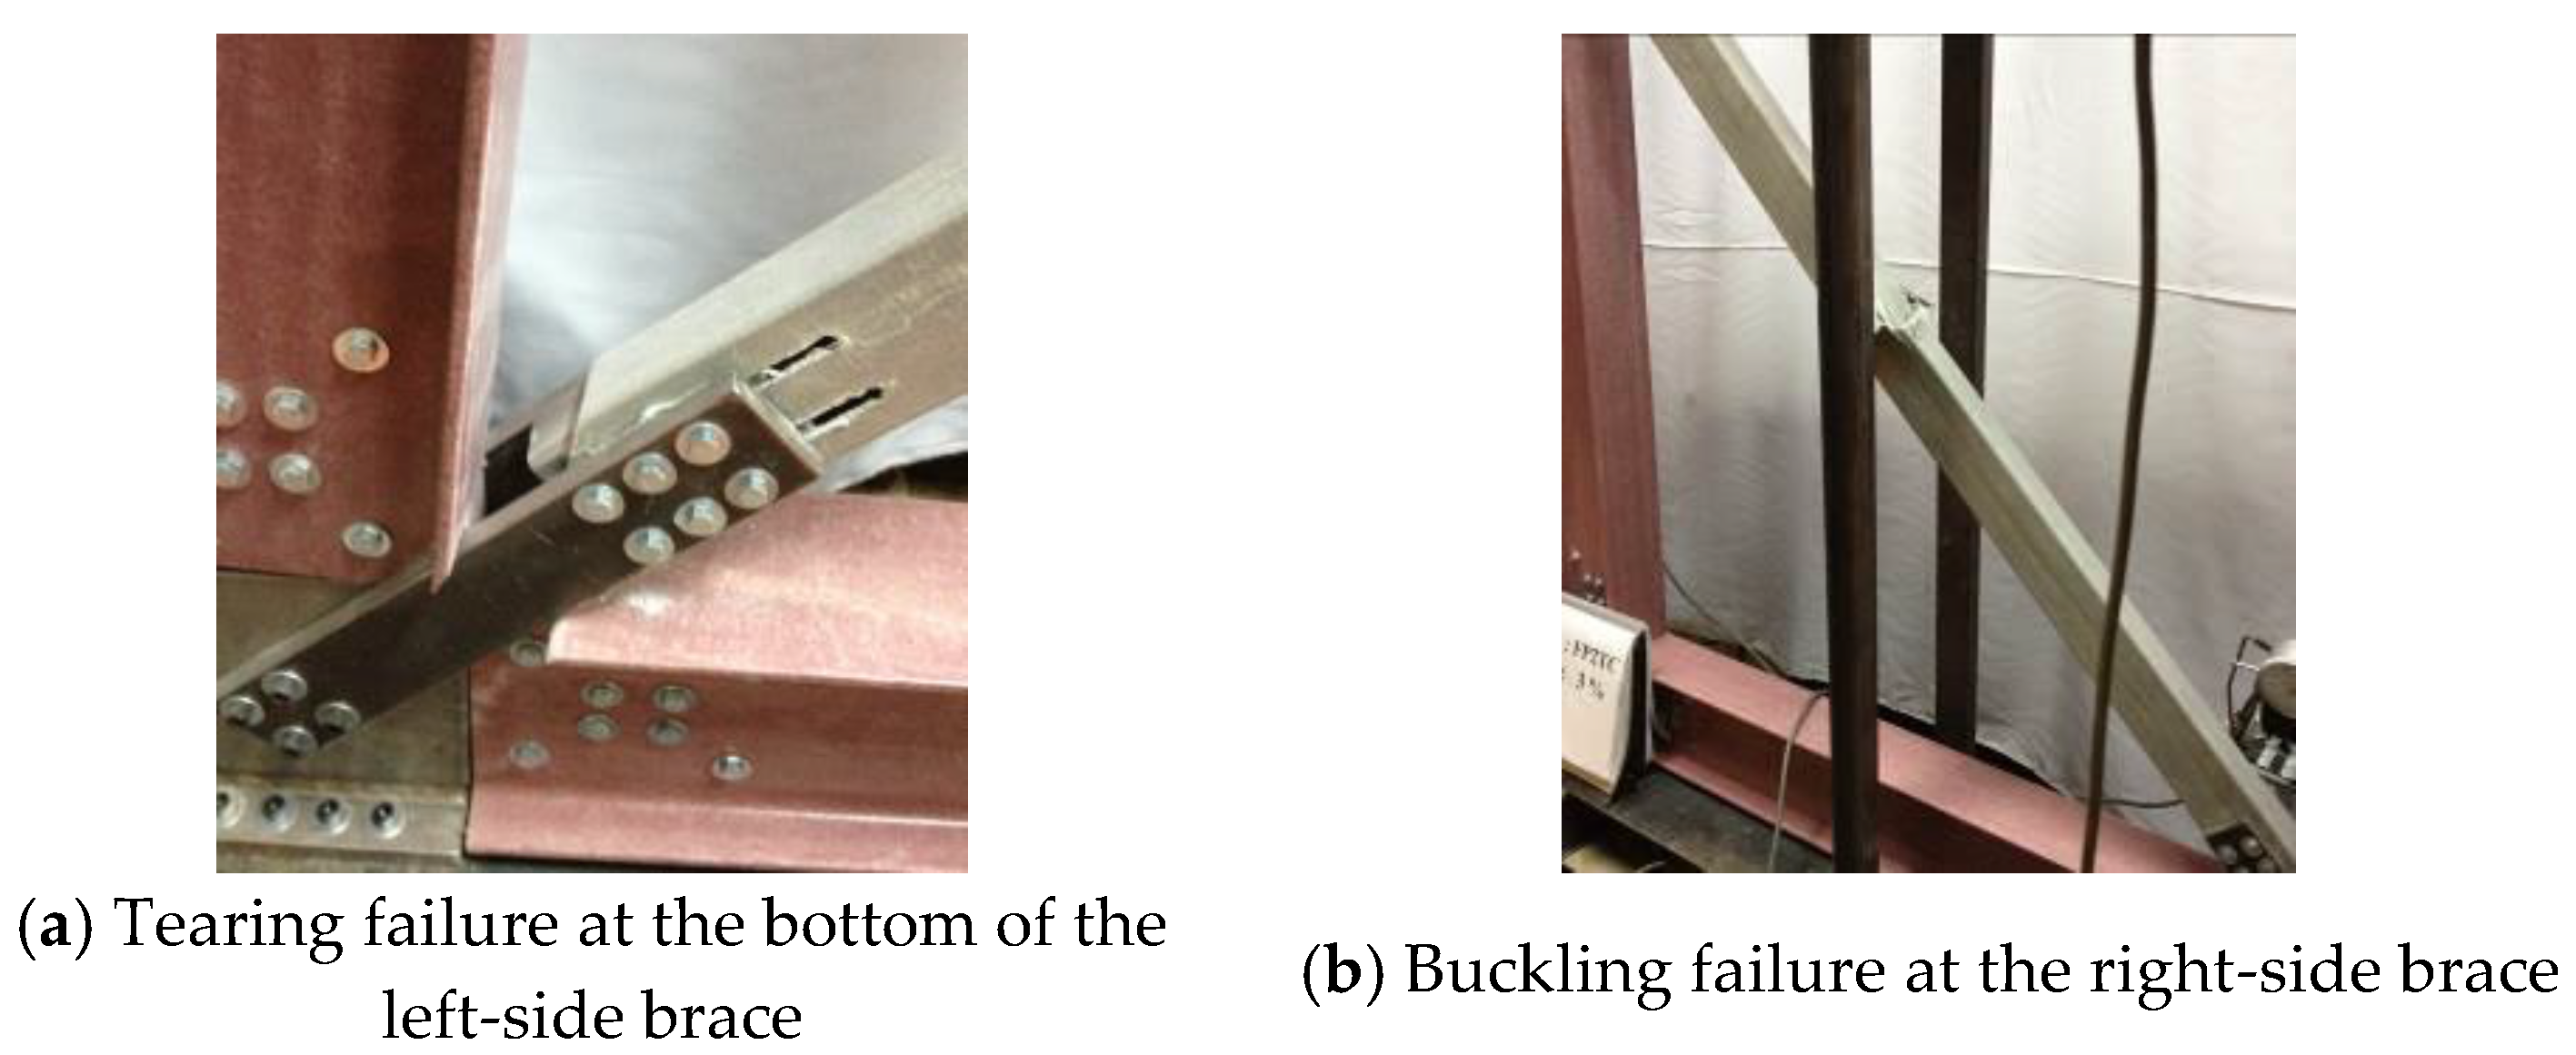
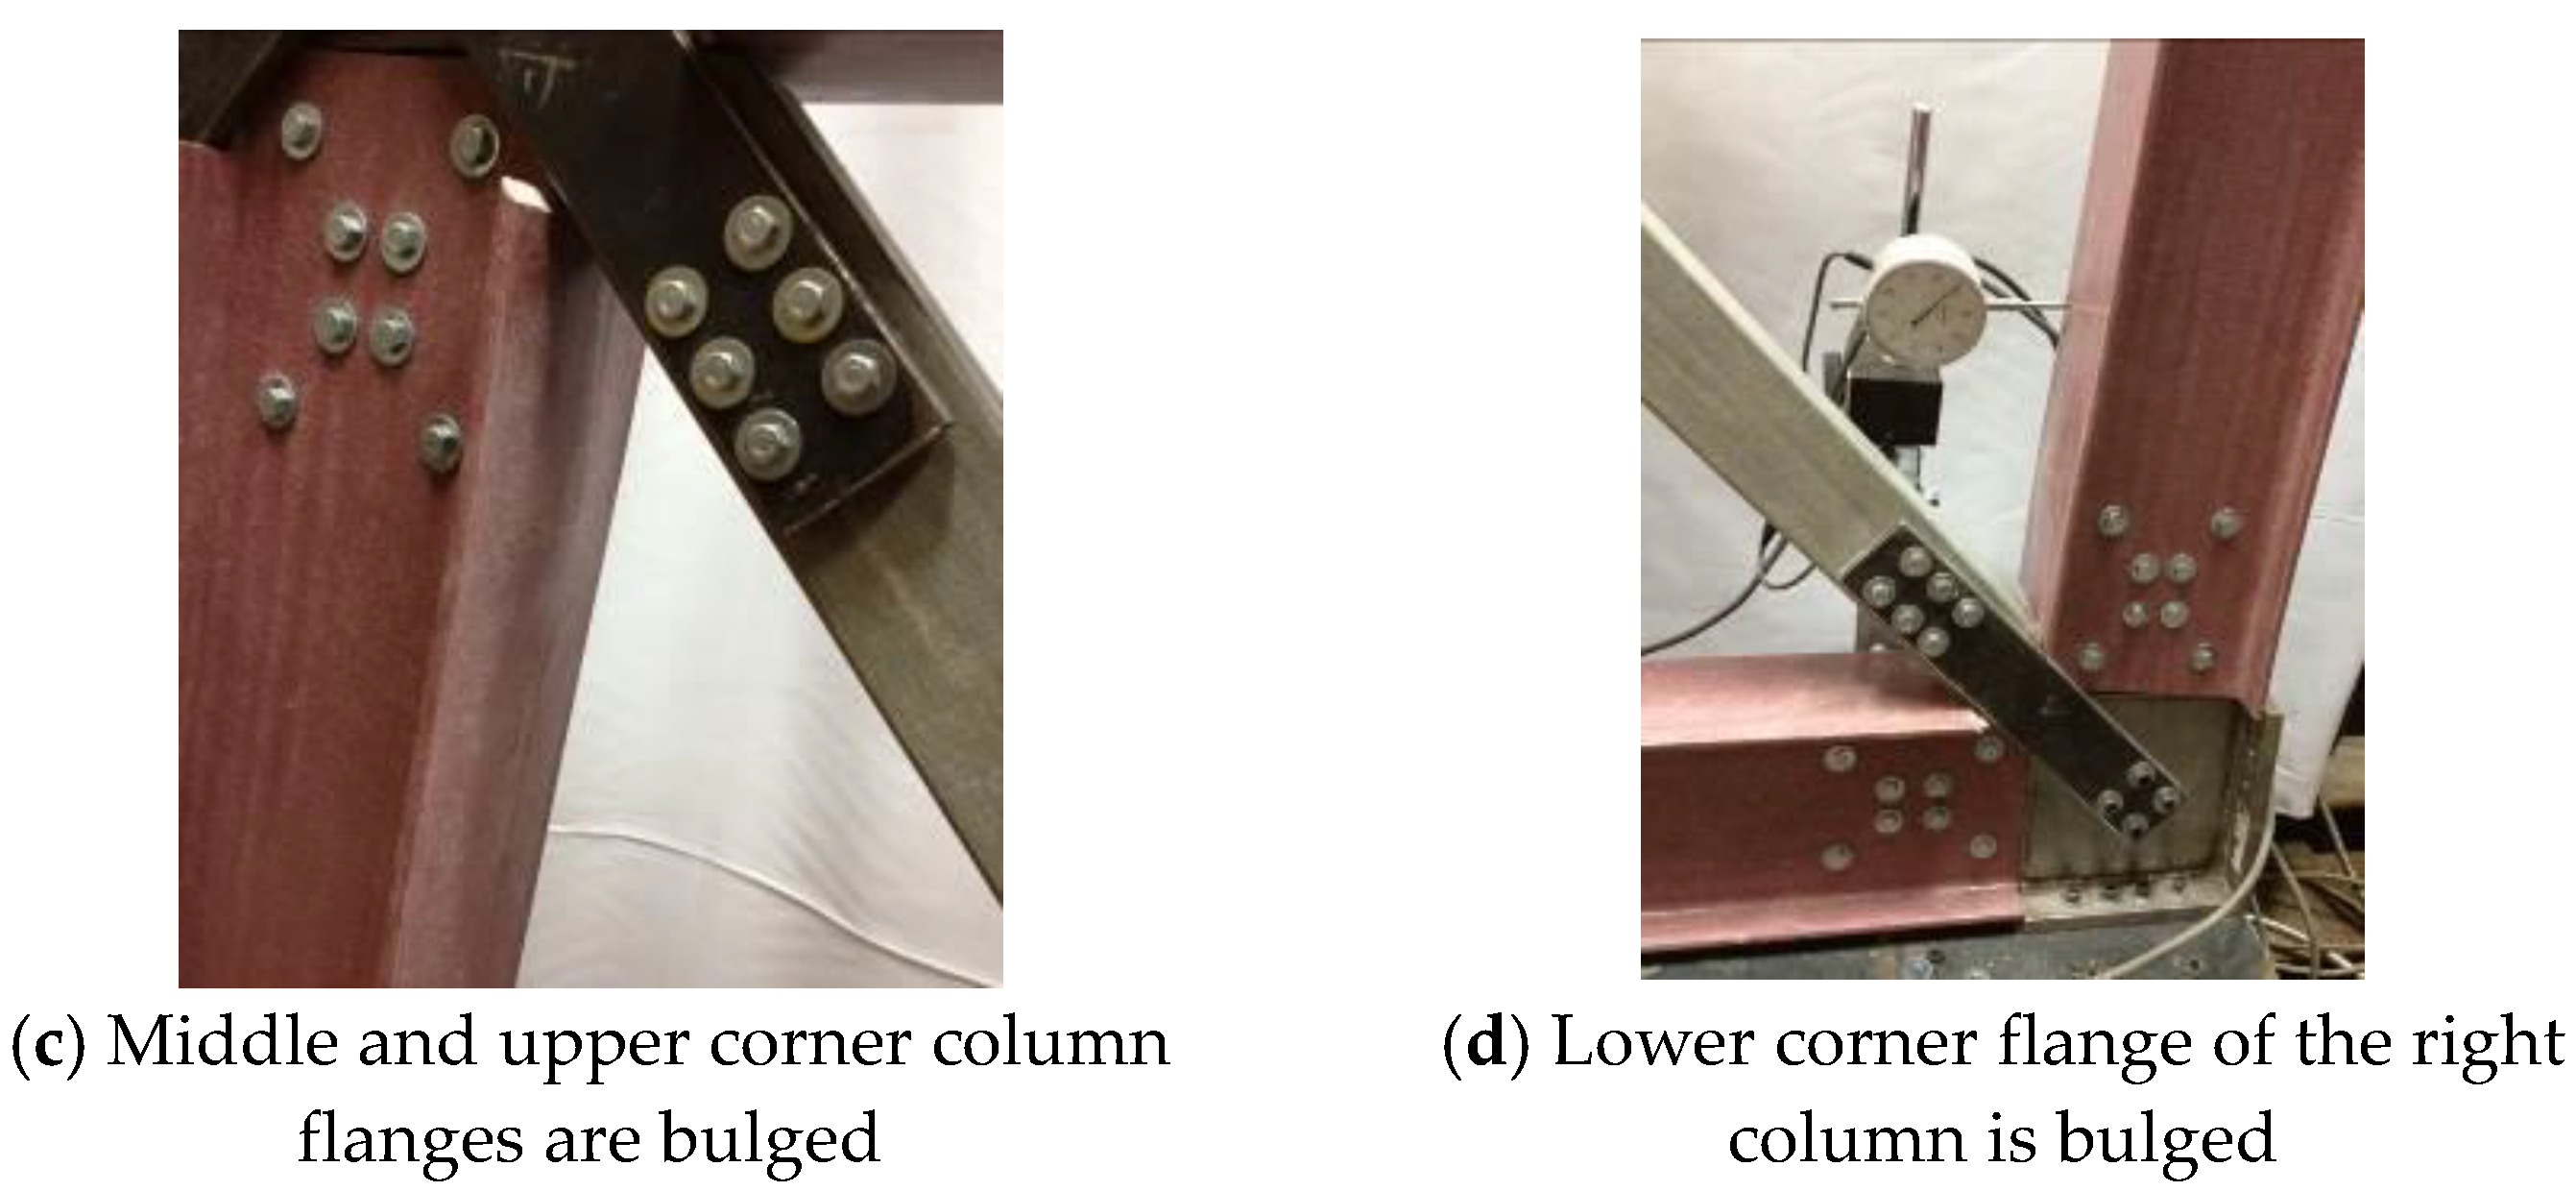
3.2.2. Frame FP2TC
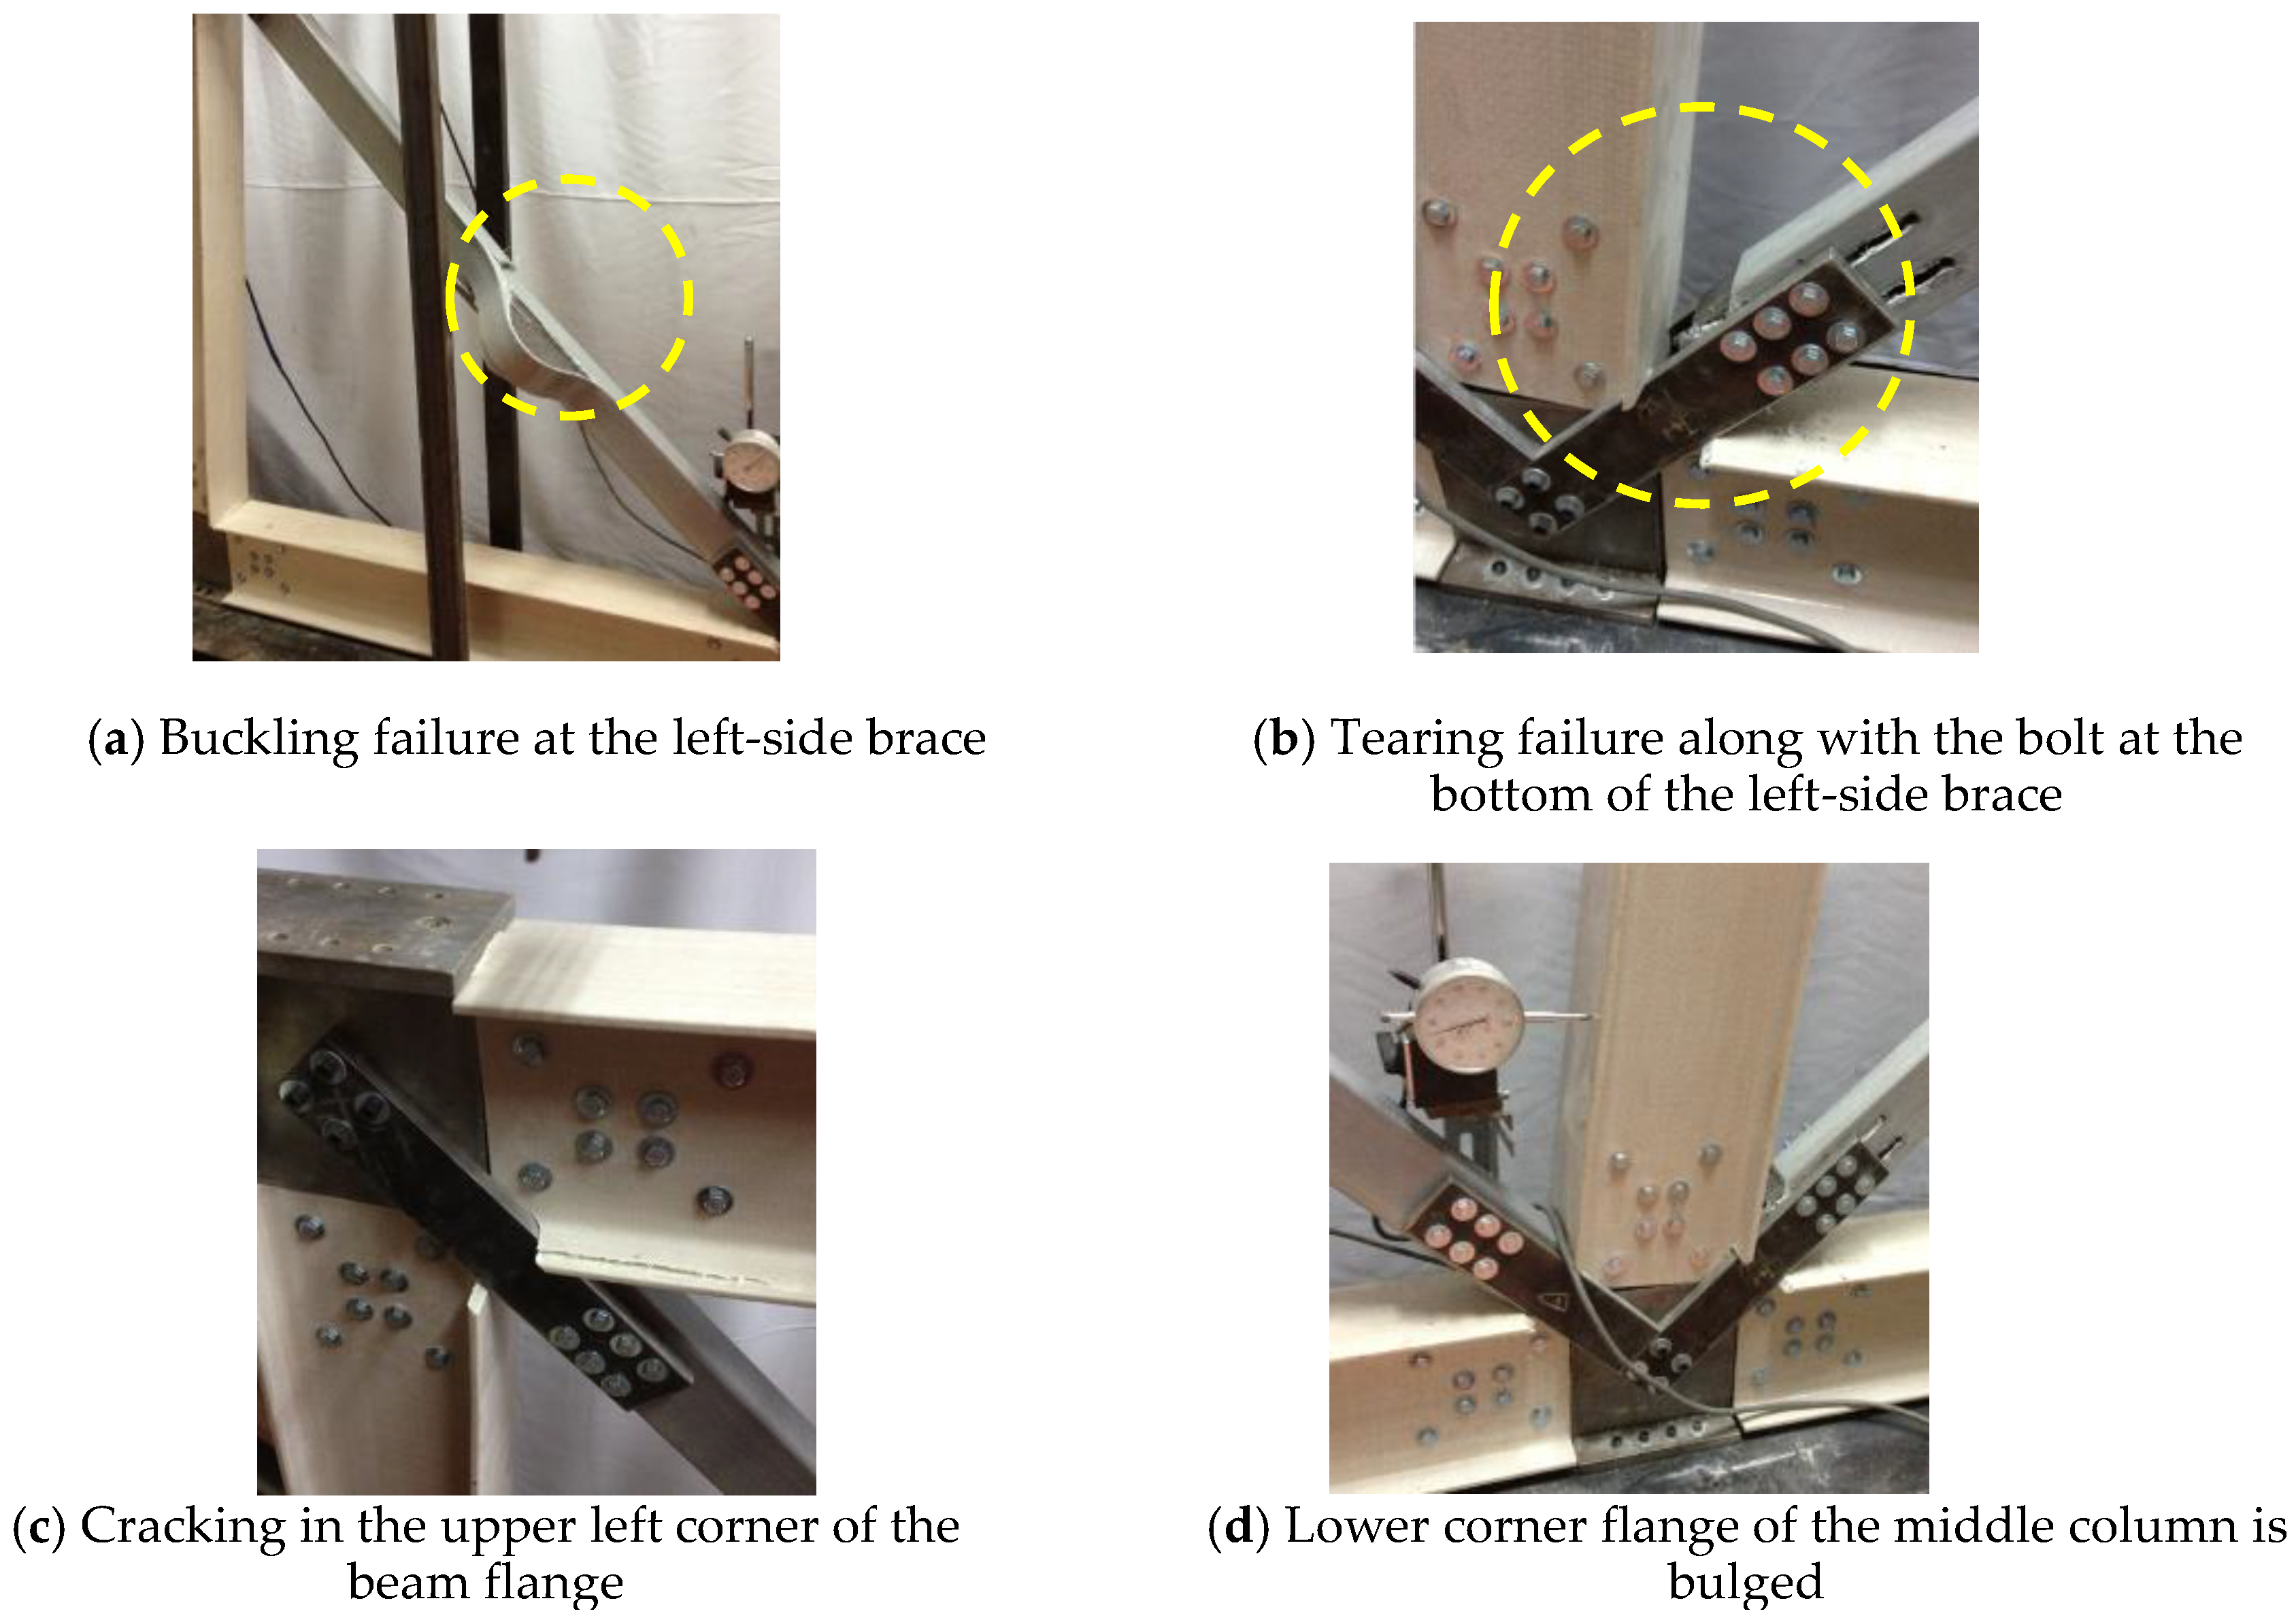
3.2.3. Frame FP2CT
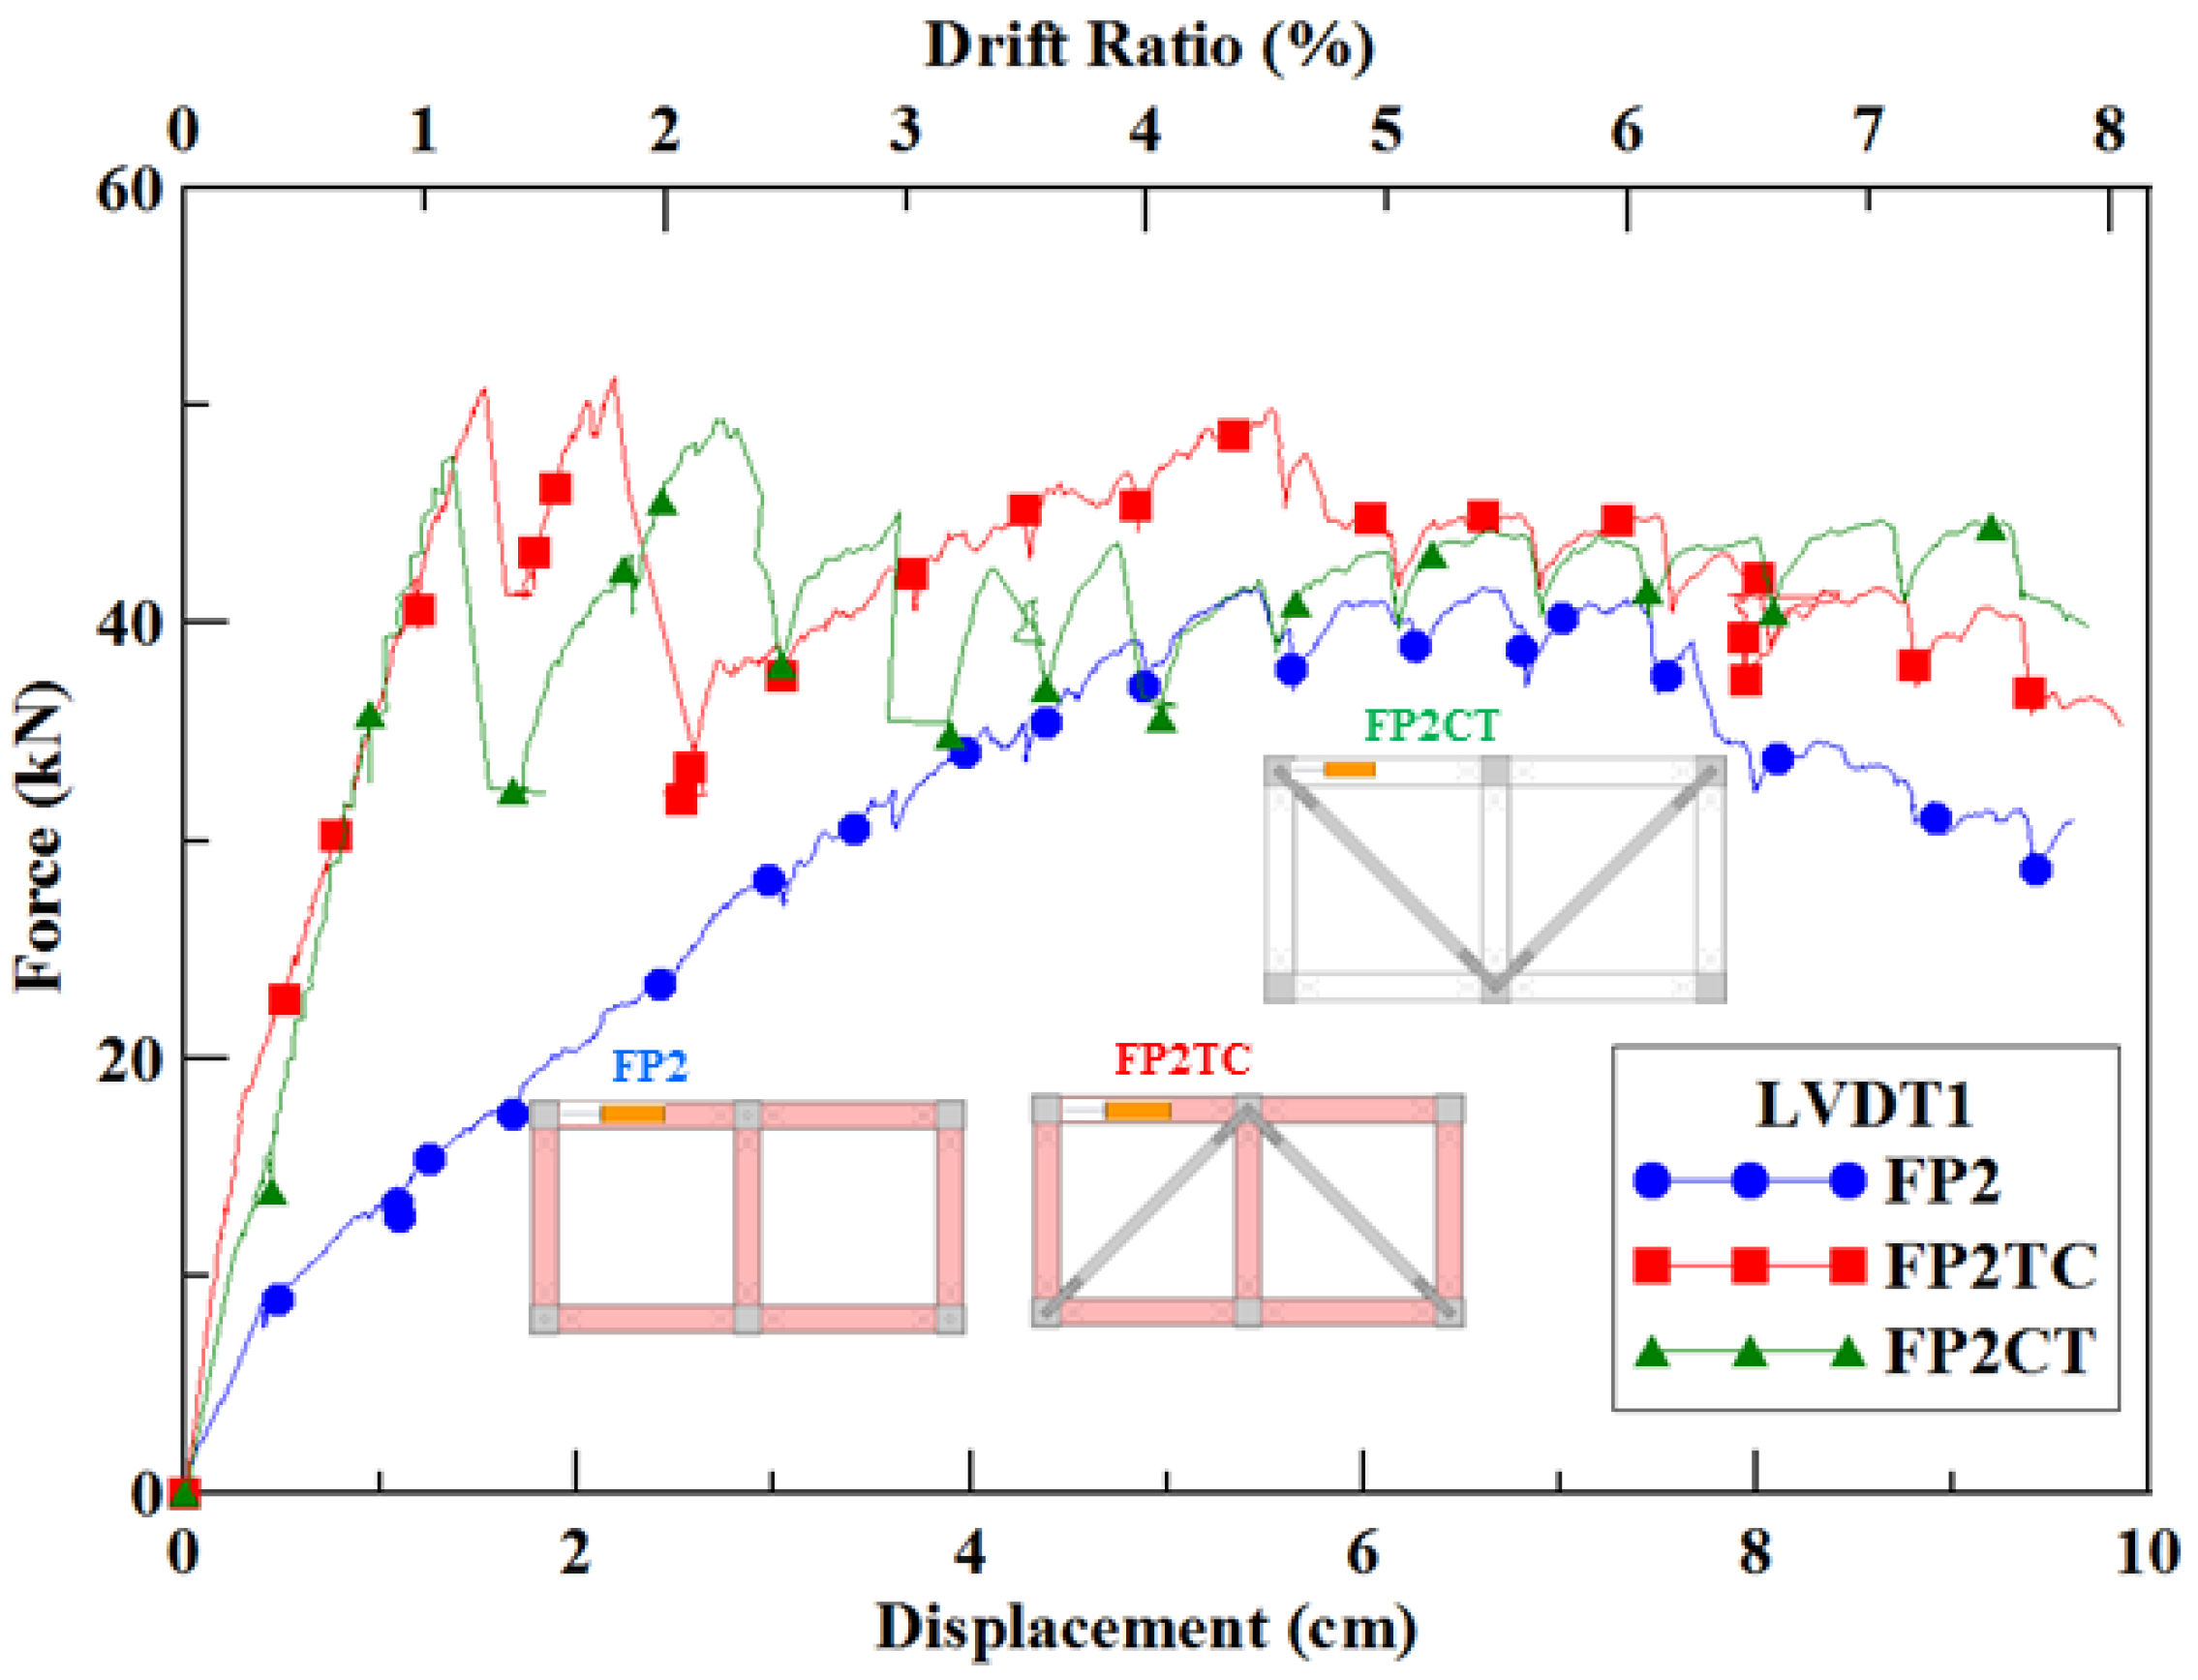
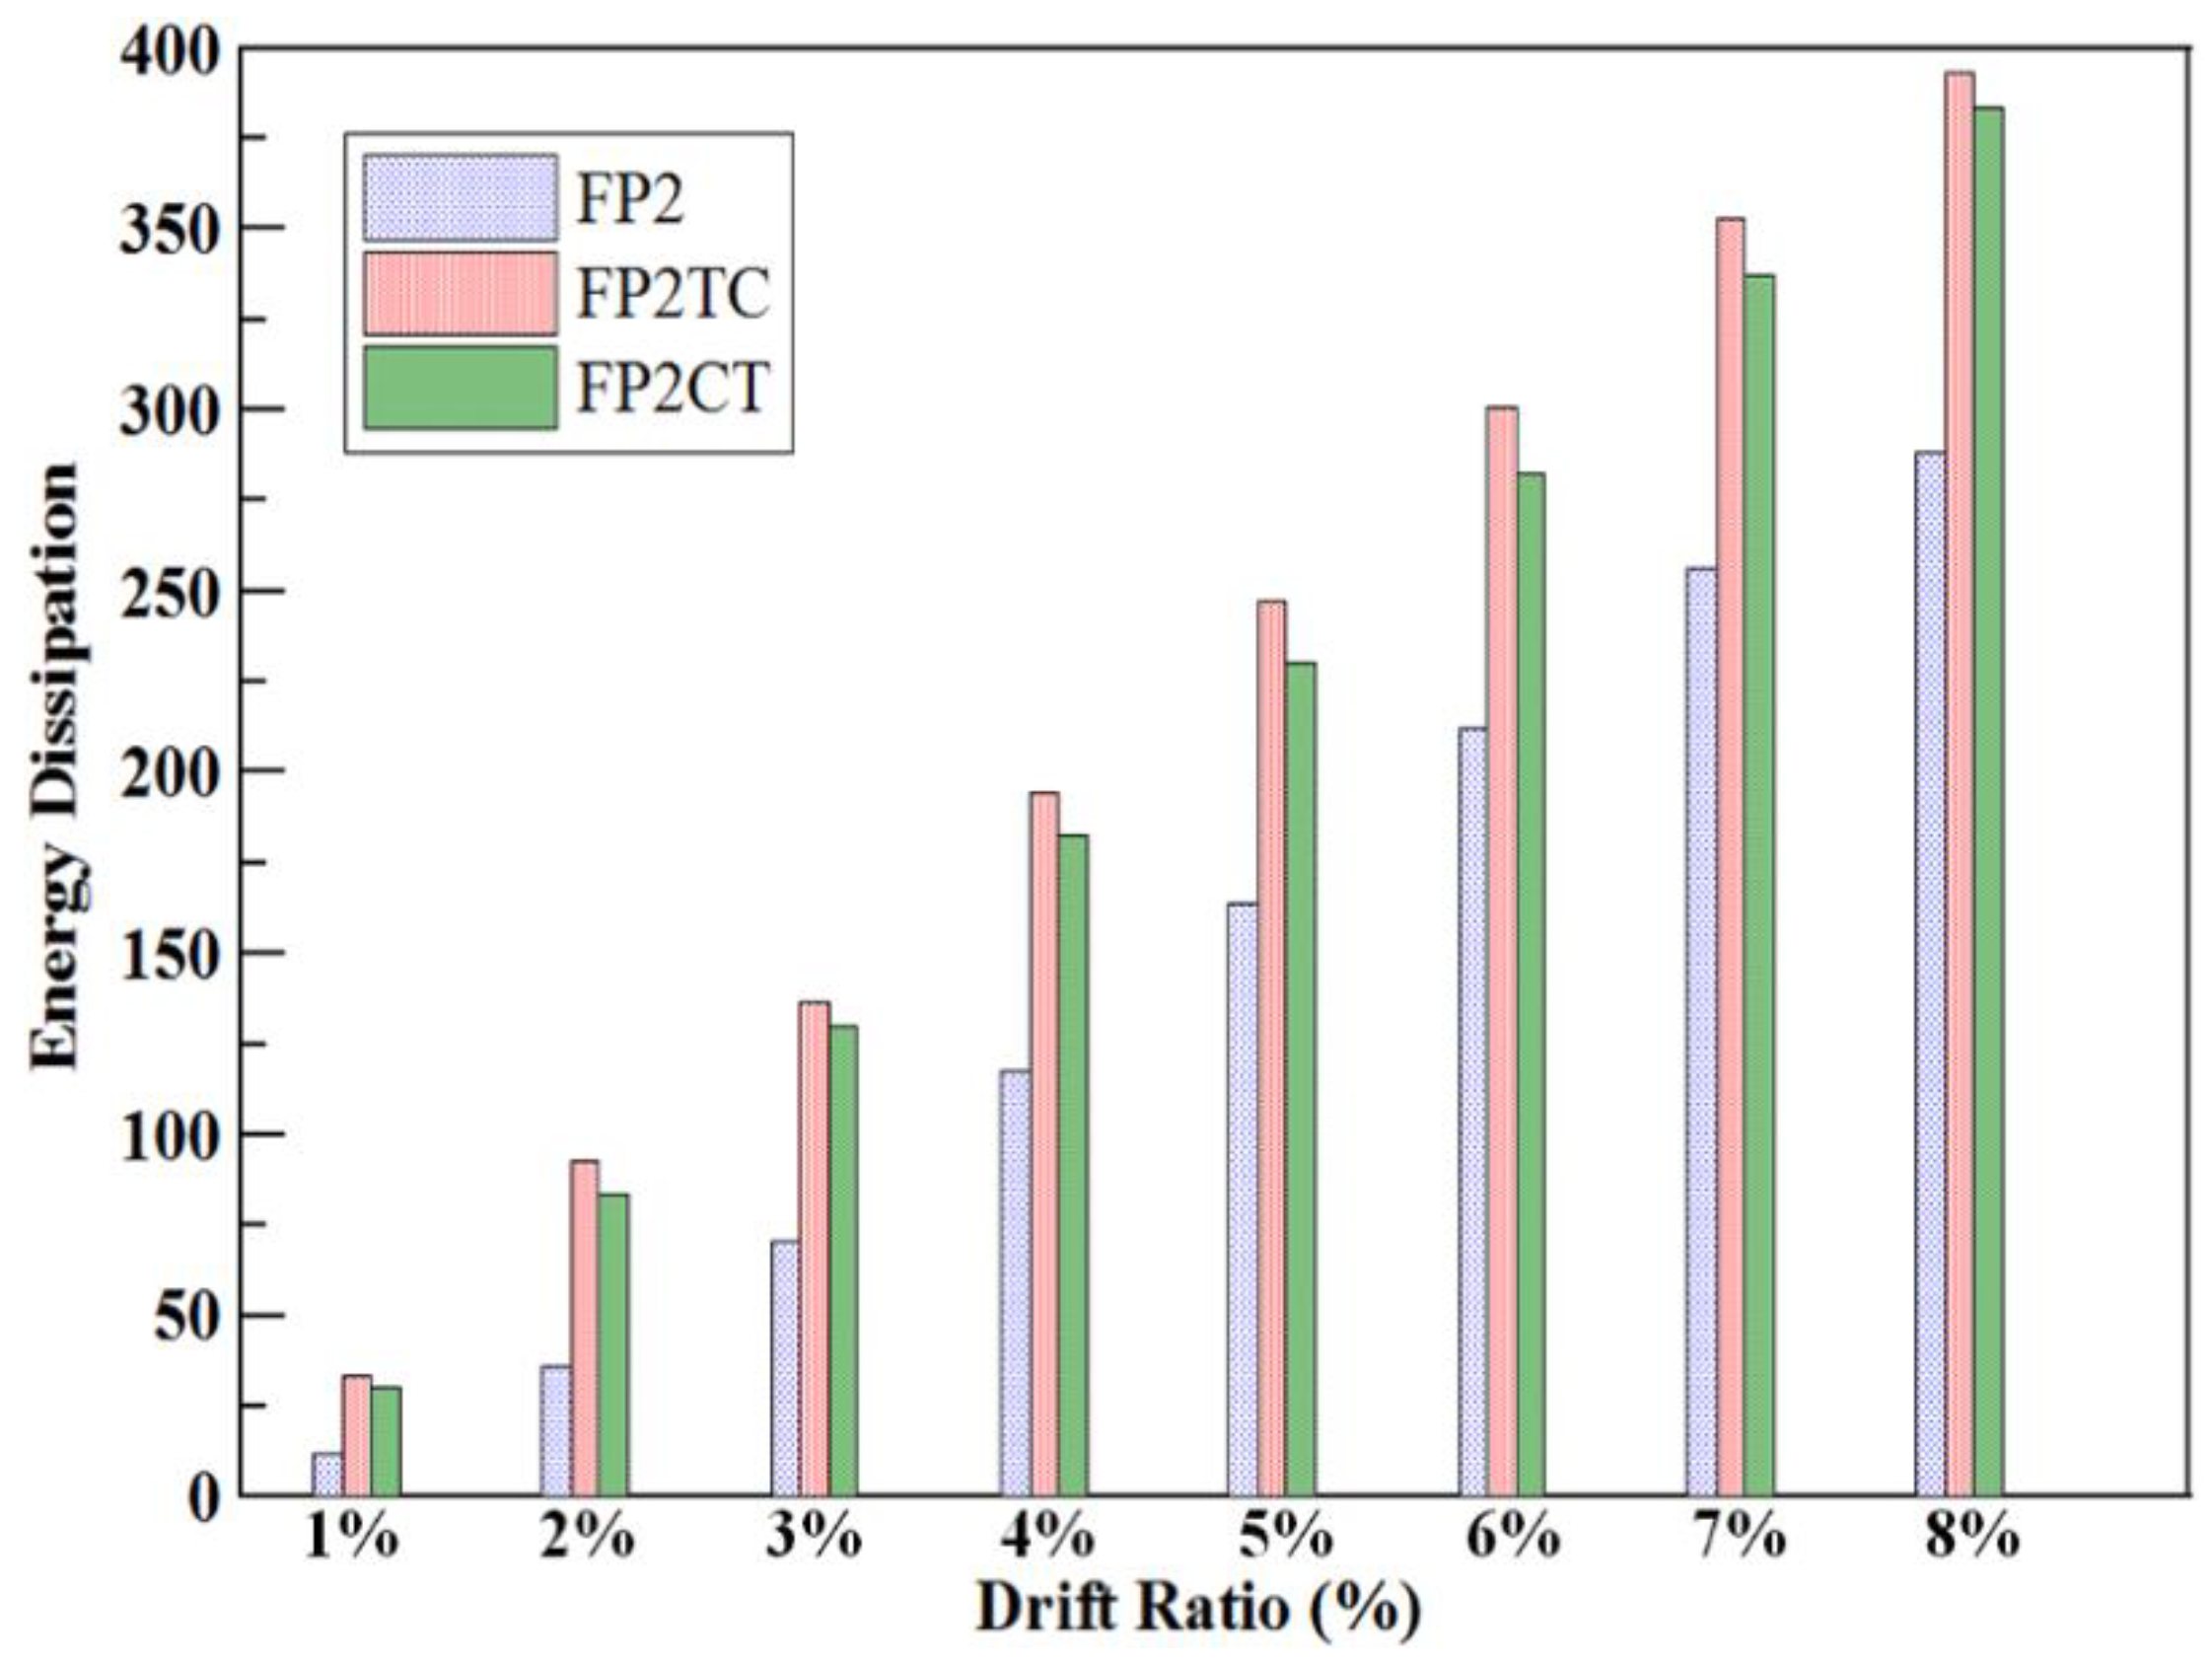
3.2.4. Comparison of the Three Double-Span Frames
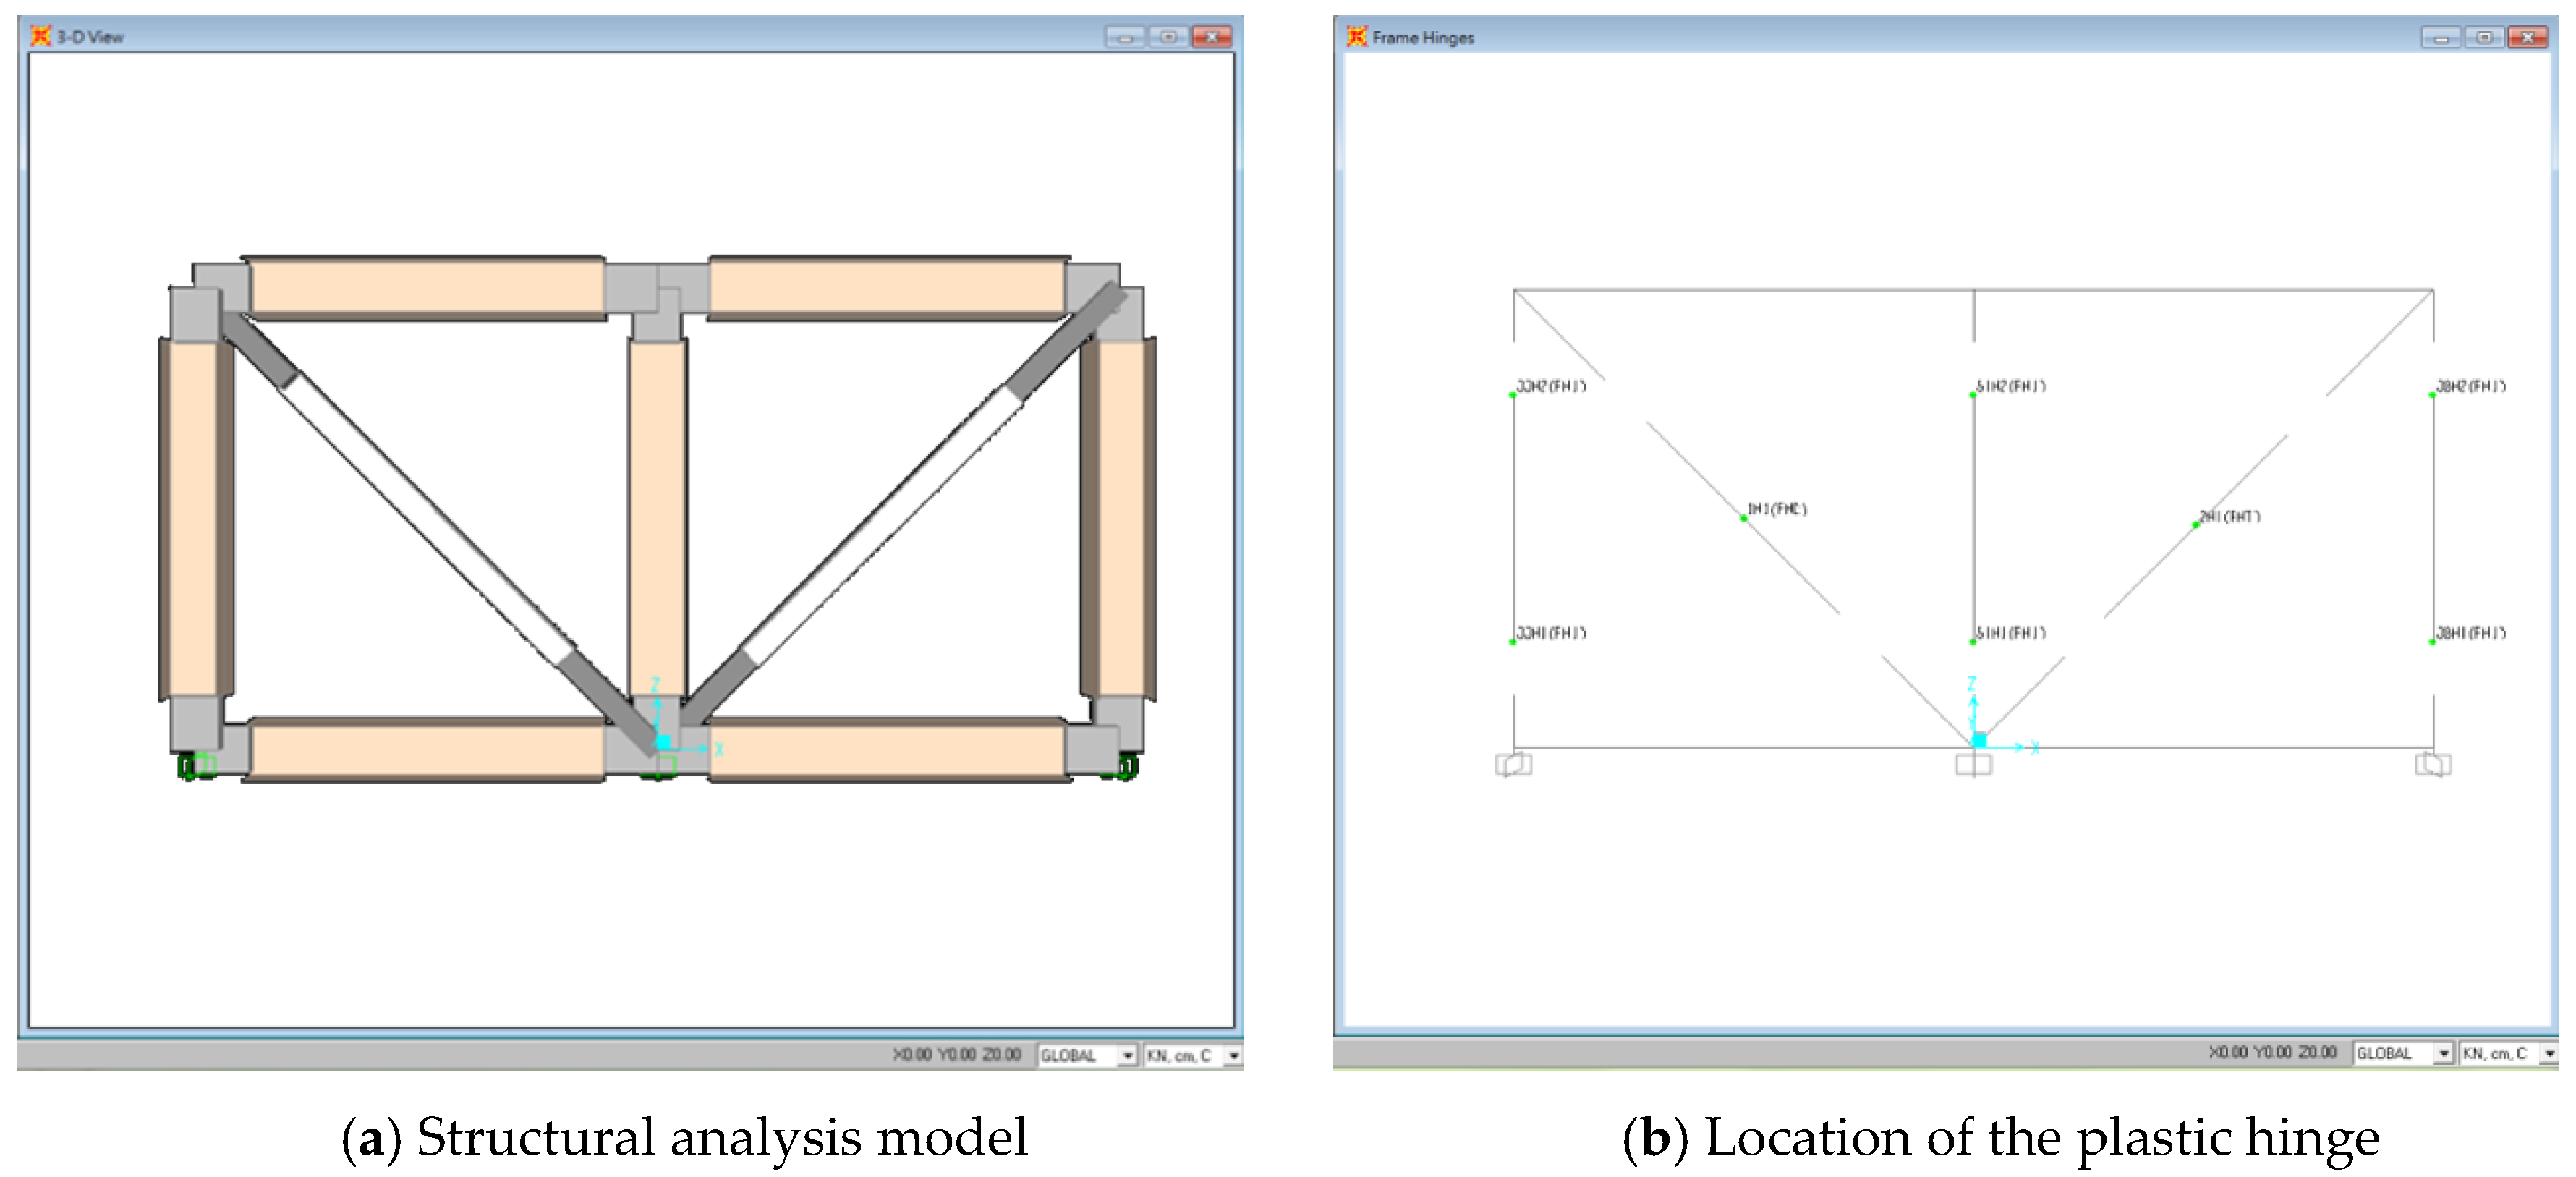
4. Nonlinear Pushover Numerical Analysis
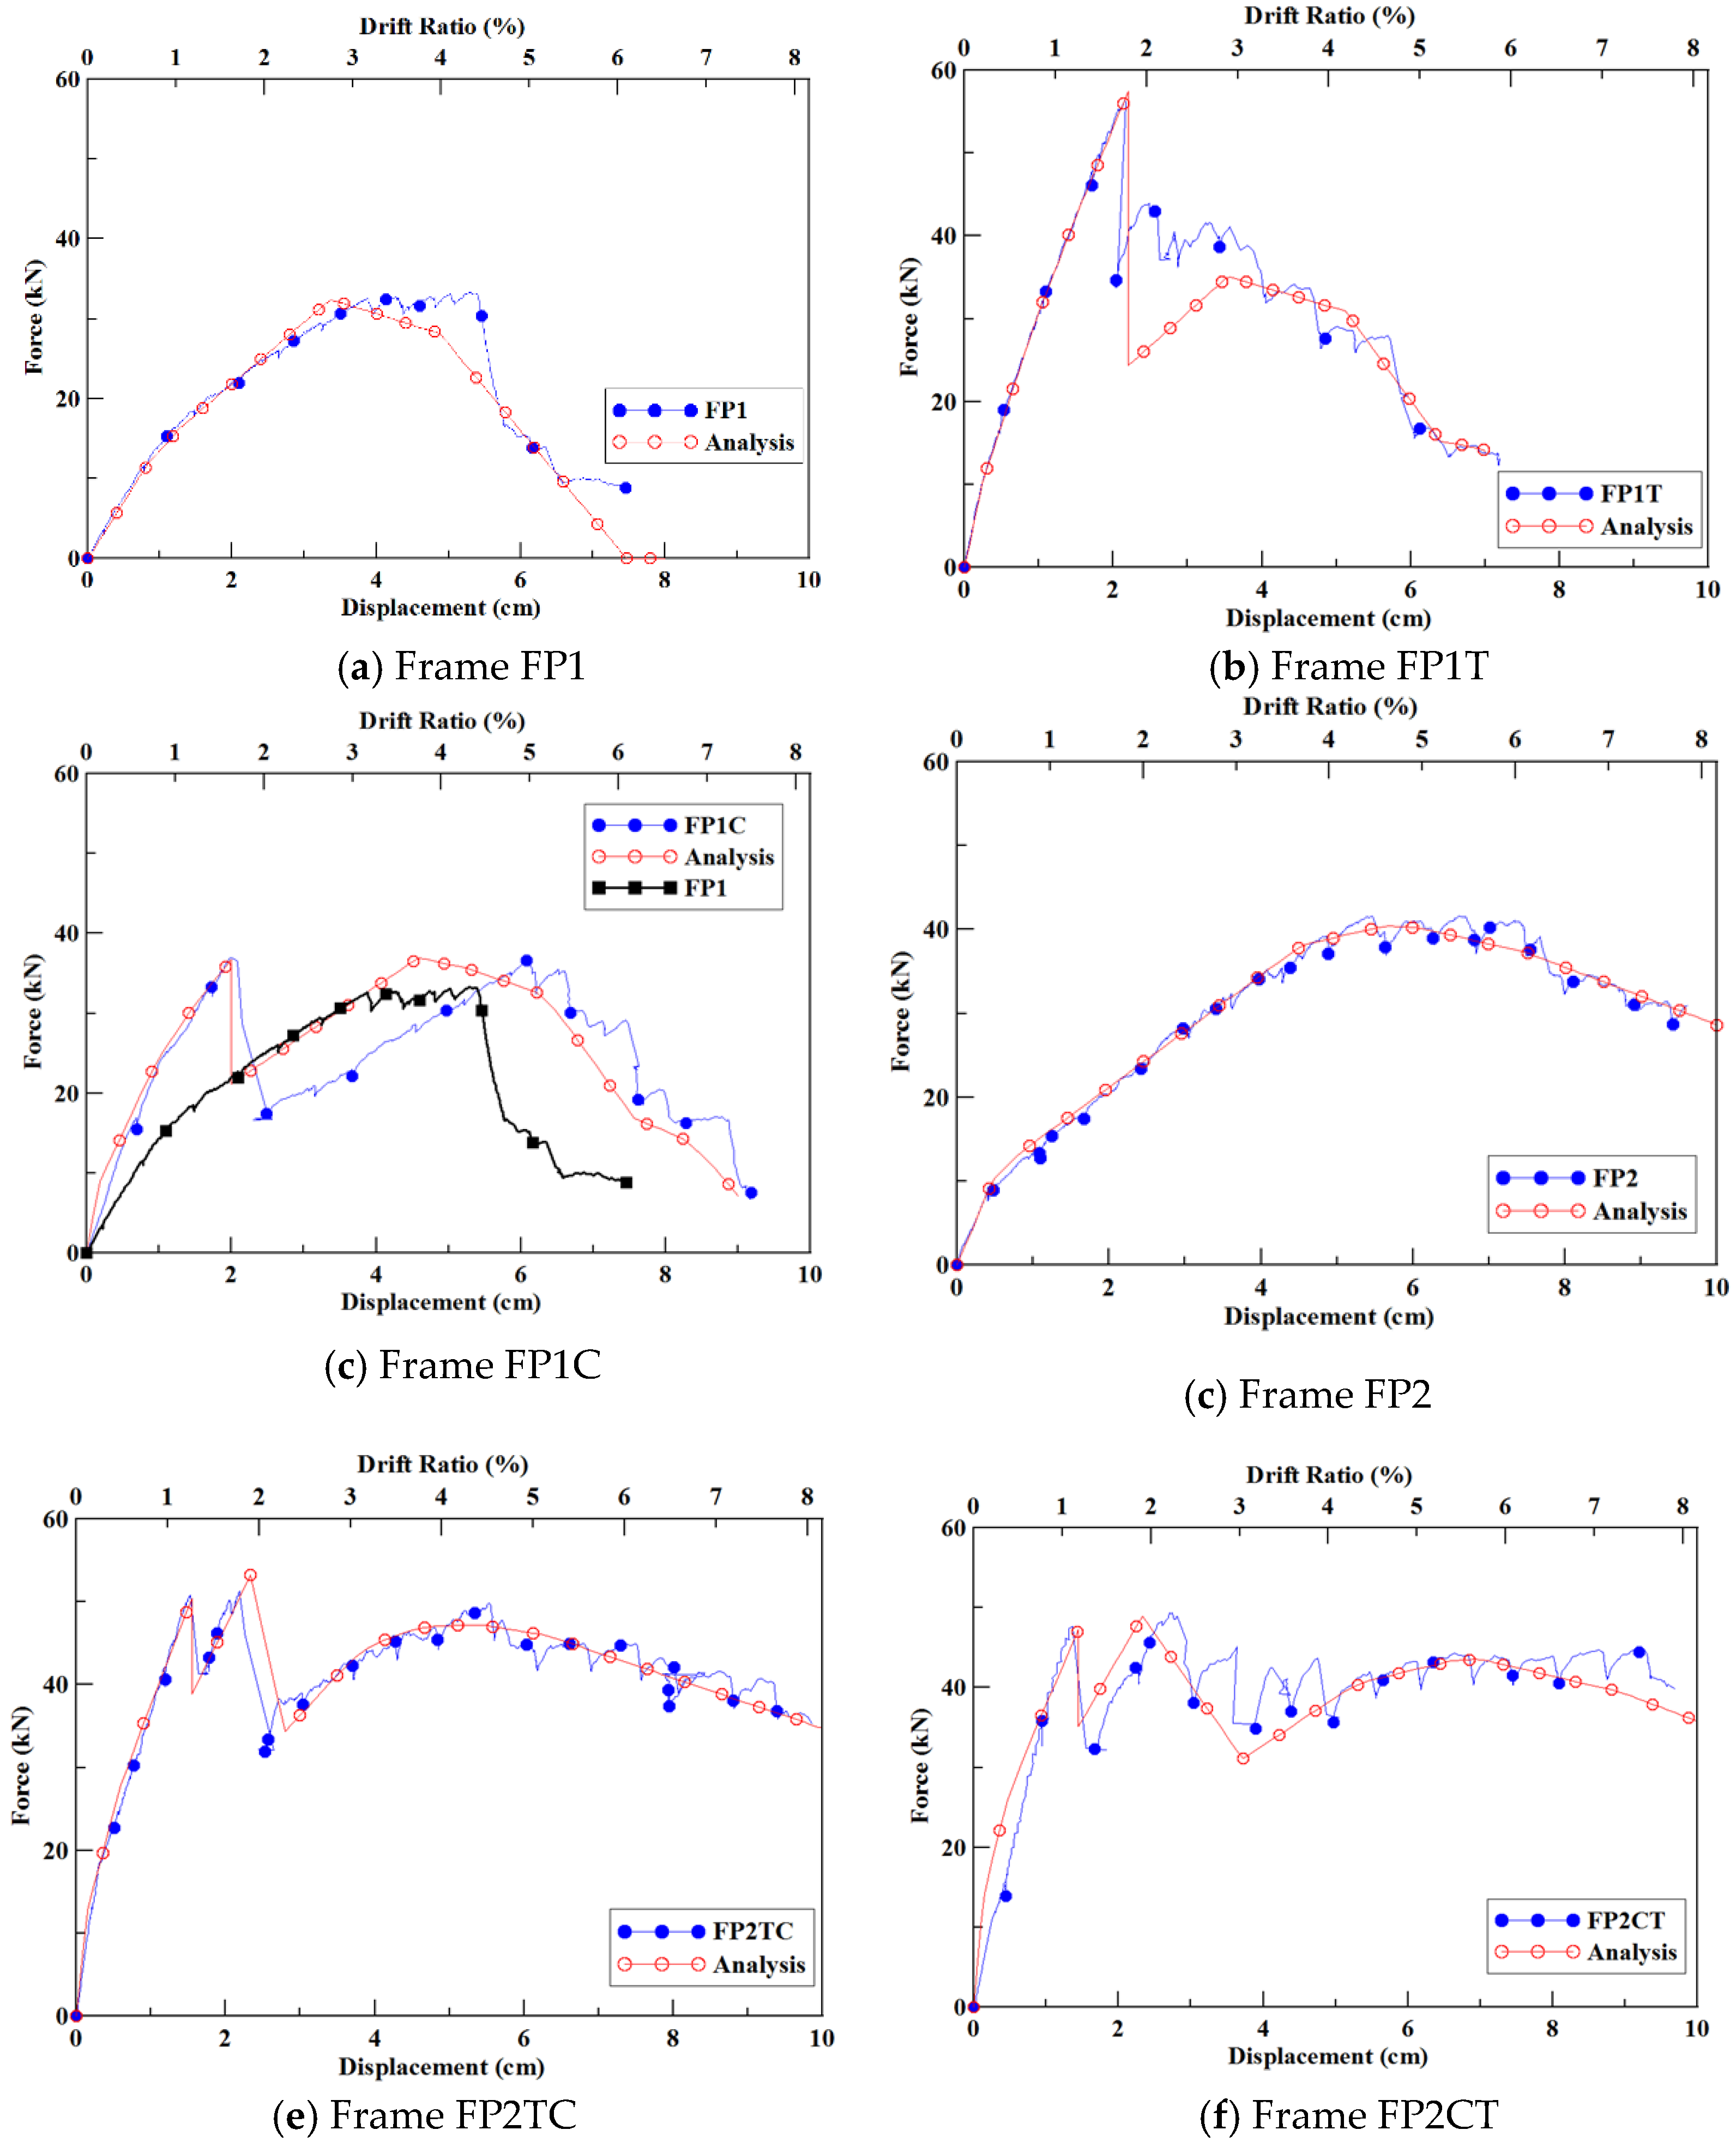
5. The Comparison of the Experimental and Numerical Analysis Results
6. Conclusions
- Single-span Frame FP1T with tension bracing had a 165% increase in initial stiffness and 69% increase in ultimate strength, and Frame FP1C with compression braced had a 65% increase in initial stiffness and 11% increase in maximum load.
- Double-span Frame FP2TC had a 23% increase in initial stiffness and a 189% increase in ultimate strength, and Frame FP2CT had a 19% increase in initial stiffness and a 111% increase in ultimate strength. The failure mode of GFRP frames begins from the buckling of the compression brace. At this stage, there is no damage to the overall beams and columns, which means that the second component can be replaced as there is an early warning of failure.
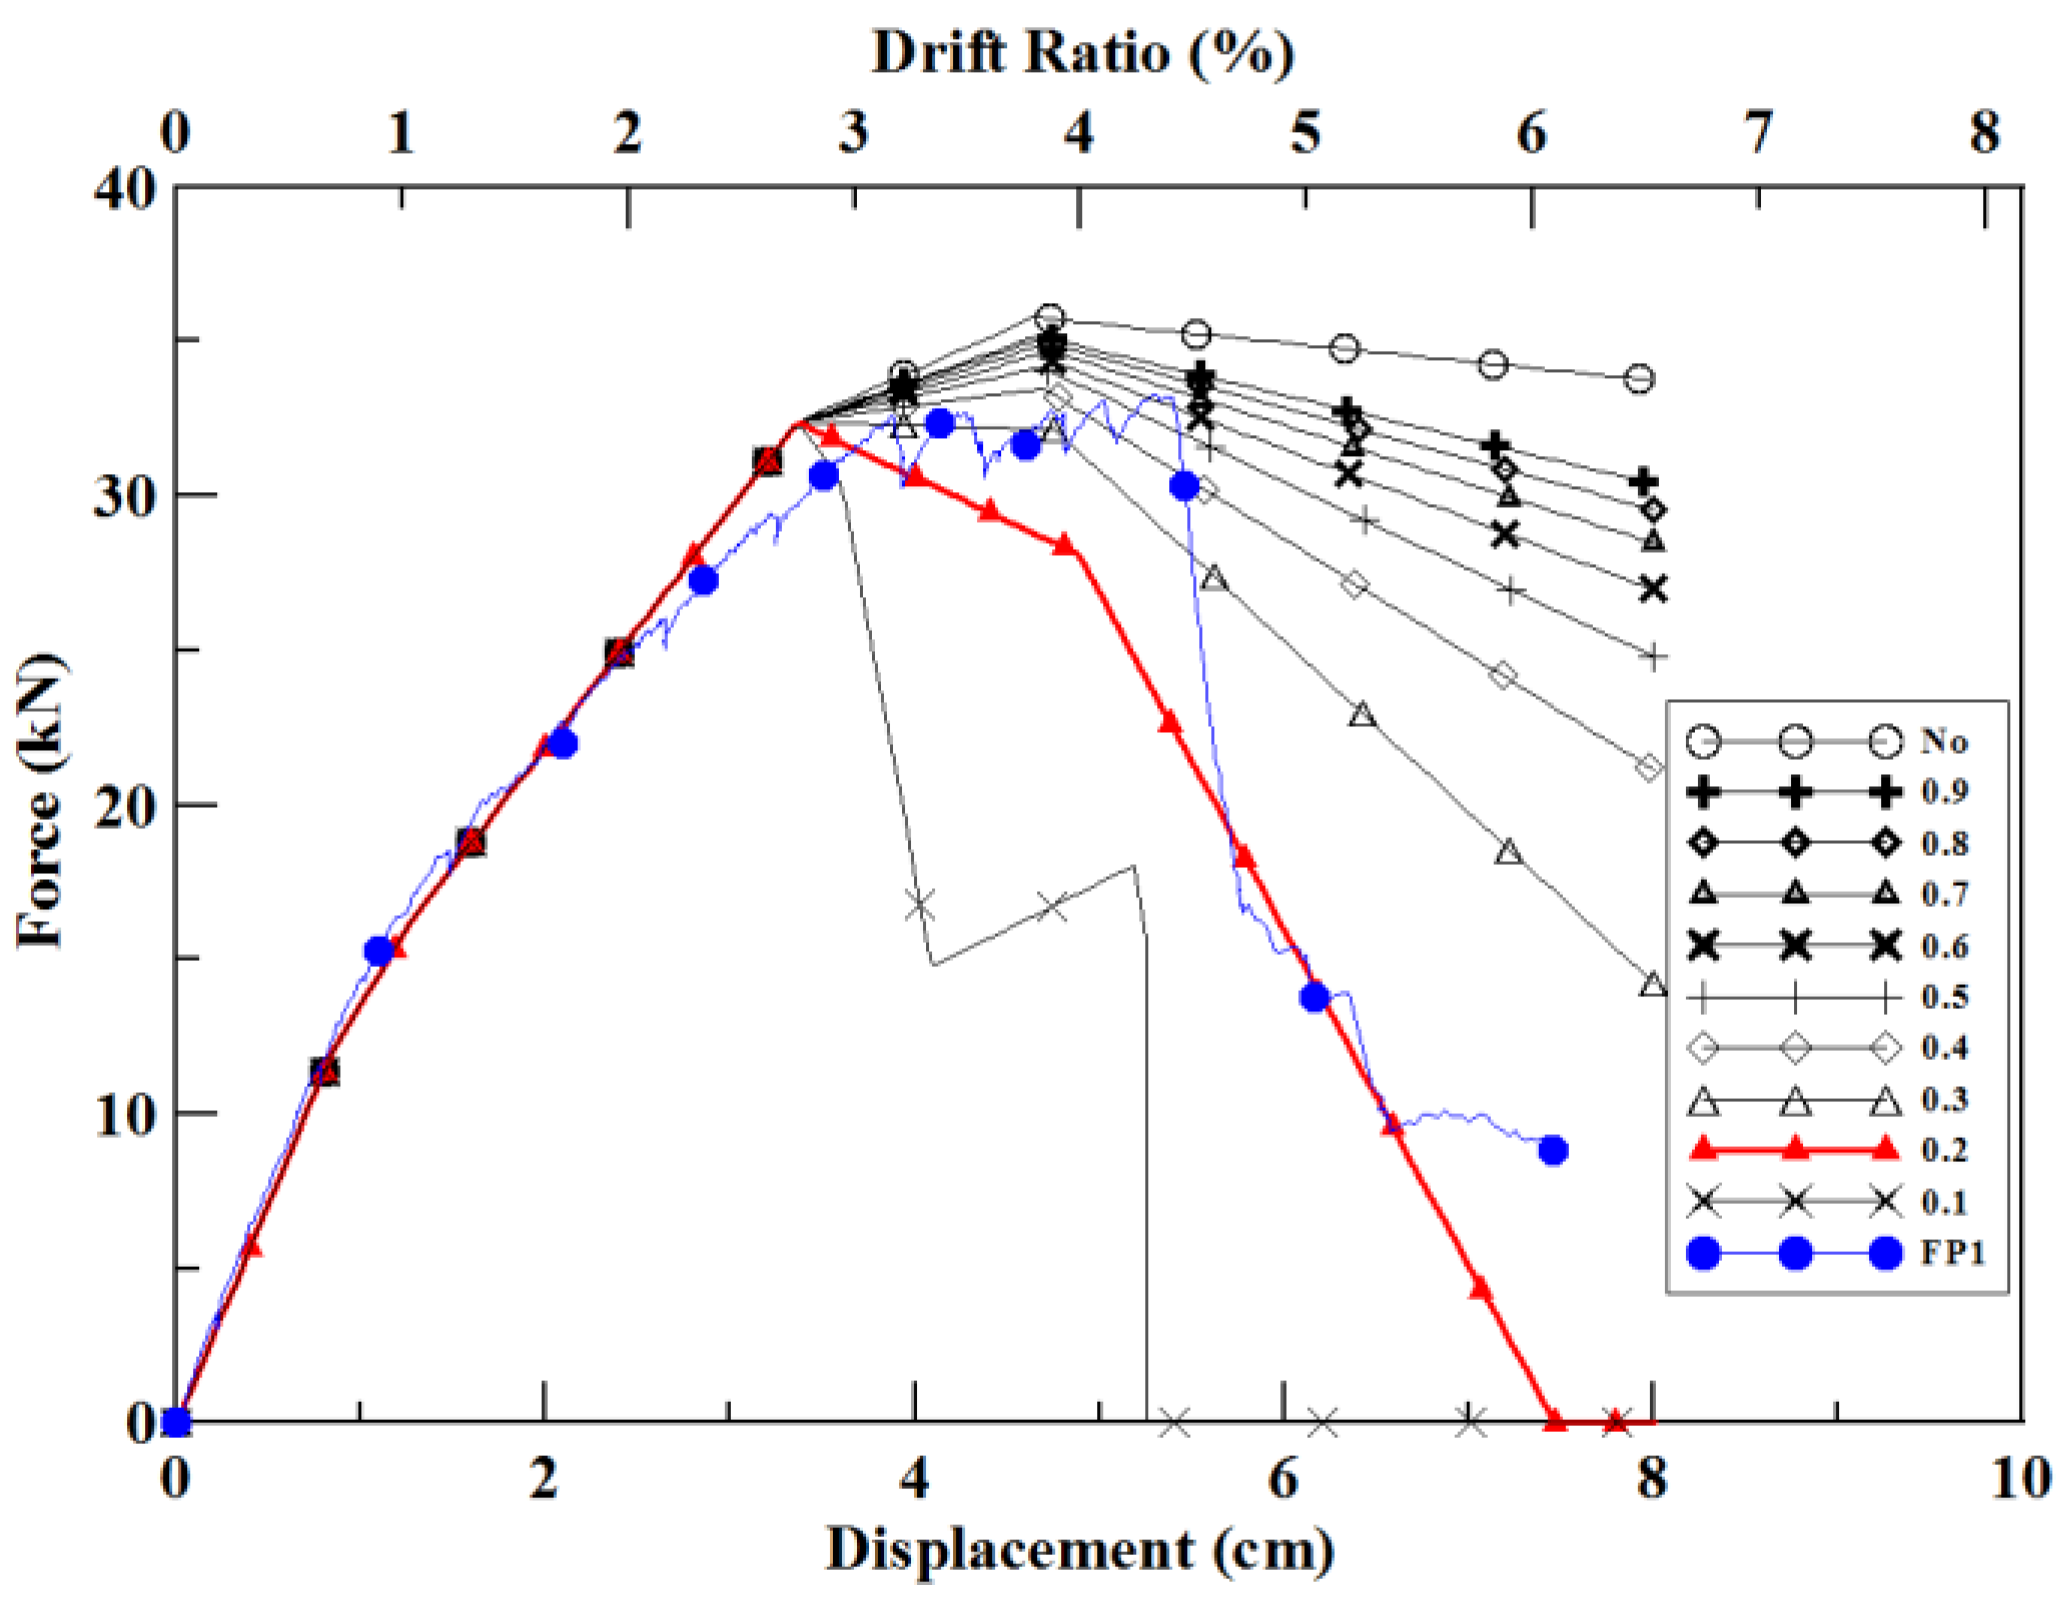
- Since the FRP composite material structural member is brittle, so the SAP2000 analysis was set up to analyze brittle material failure by using the hinge-overwrite command to simulate the GFRP frame’s reaction to the pushover force.
- The numerical structural results have an absolute error rate of less than 4% when they are compared with the experimental results. This proves the use of SAP2000 has an acceptable accuracy while saving time and cost in engineering practice.
- The numerical structural analysis of the GFRP frame depends on the data of the moment versus rotation relationship derived from the experiment and the hinge-overwrite coefficients. The performed structural analysis in this manuscript may not be feasible for different GFRP structural members and systems.
Author Contributions
Funding
Acknowledgments
Conflicts of Interest
References
- Li, Y.F.; Yu, C.C.; Chen, S.Y.; Badjie, S. The carbon footprint calculation of the GFRP pedestrian bridge at Tai-Jiang National Park. Intern. Rev. Spat. Plan. Sustain. Dev. 2013, 1, 13–28. [Google Scholar] [CrossRef]
- Tang, Y.; Sun, Z.; Wu, G. Compressive Behavior of Sustainable Steel-FRP Composite Bars with Different Slenderness Ratios. Sustainability 2019, 11, 1118. [Google Scholar] [CrossRef]
- Karayannis, C.G.; Kosmidou, P.M.K.; Chalioris, C.E. Reinforced Concrete Beams with Carbon-Fiber-Reinforced Polymer Bars-Experimental Study. Fibers 2018, 6, 99. [Google Scholar] [CrossRef]
- Cevallos, O.A.; Olivito, R.; Codispoti, R. Experimental Analysis of Repaired Masonry Elements with Flax-FRCM and PBO-FRCM Composites Subjected to Axial Bending Loads. Fibers 2015, 3, 491–503. [Google Scholar] [CrossRef]
- Yazdanbakhsh, A.; Bank, L.C. A critical review of research on reuse of mechanically recycled FRP production and end-of-life waste for construction. Polymers 2014, 6, 1810–1826. [Google Scholar] [CrossRef]
- Correia, J.R.; Almeida, N.M.; Figueira, J.R. Recycling of FRP composites: Reusing fine GFRP waste in concrete mixtures. J. Clean. Prod. 2011, 19, 1745–1753. [Google Scholar] [CrossRef]
- Bakis, C.E.; Bank, L.C.; Brown, V.L.; Cosenza, E.; Davalos, J.F.; Lesko, J.J.; Machida, A.; Rizkalla, S.H.; Triantafillou, T.C. Fiber-reinforced polymer composites for construction—State-of-the-art review. J. Compos. Constr. 2002, 6, 73–87. [Google Scholar] [CrossRef]
- Kumar, P.; Chandrashekhara, K.; Nanni, A. Structural performance of a FRP bridge deck. Constr. Build. Mater. 2004, 18, 35–47. [Google Scholar] [CrossRef]
- Moon, D.Y.; Zi, G.; Lee, D.H.; Kim, B.M.; Hwang, Y.K. Fatigue behavior of the foam-filled GFRP bridge deck. Compos. Part B 2009, 40, 141–148. [Google Scholar] [CrossRef]
- Wu, Z.; Mirmiran, A.; Zhu, Z.; Swanson, J. Flexural behavior of prestressed FRP tubular bridge deck. Compos. Part B 2009, 40, 125–133. [Google Scholar] [CrossRef]
- Gautam, B.P.; Matsumoto, T. Shear deformation and interface behavior of concrete-filled CFRP box beams. Compos. Struct. 2009, 89, 20–27. [Google Scholar] [CrossRef]
- Kim, H.Y.; Park, K.T.; Jeong, J.; Lee, Y.H.; Hwang, Y.K.; Kim, D. A pultruded GFRP deck panel for temporary structures. Compos. Struct. 2009, 91, 20–30. [Google Scholar] [CrossRef]
- Chen, A.; Davalos, J.F. Strength evaluations of sinusoidal core for FRP sandwich bridge deck panels. Compos. Struct. 2010, 92, 1561–1573. [Google Scholar] [CrossRef]
- Li, Y.F.; Meda, H.A.; Chen, W. The Design and Analysis of Internally Stiffened GFRP Tubular Decks—A Sustainable Solution. Sustainability 2018, 10, 4538. [Google Scholar] [CrossRef]
- Hai, N.D.; Mutsuyoshi, H.; Asamoto, S.; Matsui, T. Structural behavior of hybrid FRP composite I-beam. Constr. Build. Mater. 2010, 24, 956–969. [Google Scholar] [CrossRef]
- Fam, A.; Honickman, H. Built-up hybrid composite box girders fabricated and tested in flexure. Eng. Struct. 2010, 32, 1028–1037. [Google Scholar] [CrossRef]
- Li, Y.F.; Hsu, T.H.; Hsieh, F.C. A Study on Improving the Mechanical Behaviors of the Pultruded GFRP Composite Material Members. Sustainability 2019, 11, 577. [Google Scholar] [CrossRef]
- Al-Kharat, M.; Rogers, C.A. Inelastic performance of cold-formed steel strap braced walls. J. Constr. Steel Res. 2007, 63, 60–474. [Google Scholar] [CrossRef]
- Ascione, F.; Feo, L.; Maceri, F. On the pin-bearing failure load of GFRP bolted laminates: An experimental analysis on the influence of bolt diameter. Compos. Part B Eng. 2010, 41, 482–490. [Google Scholar] [CrossRef]
- Karakuzu, R.; Demirgoren, O.; Icten, B.M.; Deniz, M.E. Failure behavior of quasi-isotropic laminates with three-pin loaded holes. Mater. Des. 2010, 31, 3029–3032. [Google Scholar] [CrossRef]
- Jam, J.E.; Ghaziani, N.O. Numerical and experimental investigation of bolted joints. Int. J. Eng. Sci. Technol. 2011, 3, 285–296. [Google Scholar] [CrossRef]
- Feo, L.; Mara, G.; Mosallam, A.S. Stress analysis of multi-bolted joints for FRP pultruded composite structures. Compos. Struct. 2012, 94, 3769–3780. [Google Scholar] [CrossRef]
- Li, Y.F.; Jobe, O.; Yu, C.C.; Chiu, Y.T. Experiment and Analysis of Bolted GFRP Beam-Beam Connections. Compos. Struct. 2015, 127, 480–493. [Google Scholar] [CrossRef]
- Olmedo, A.; Santiuste, C. On the prediction of bolted single-lap composite joints. Compos. Struct. 2012, 94, 2110–2117. [Google Scholar] [CrossRef]
- Subramanian, C.; Senthilvelan, S. Effect of reinforced fiber length on the joint performance of thermoplastic leaf spring. Mater. Des. 2010, 31, 3733–3741. [Google Scholar] [CrossRef]
- Smith, S.J.; Parsons, I.D.; Hjelmstad, K.D. Experimental comparisons of connections for GFRP pultruded frames. J. Compos. Constr. 1999, 3, 20–26. [Google Scholar] [CrossRef]
- Lehman, D.; Roeder, C.; Herman, D.; Johnson, S.; Kotulka, B. Improved seismic performance of gusset plate connections. J. Struct. Eng. 2008, 134, 890–901. [Google Scholar] [CrossRef]
- Kapti, S.; Sayman, O.; Ozen, M.; Benli, S. Experimental and numerical failure analysis of carbon/epoxy laminated composite joints under different conditions. Mater. Des. 2010, 31, 4933–4942. [Google Scholar] [CrossRef]
- Davalos, J.F.; Salim, H.A.; Qiao, P.; Lopez-Anido, R. Analysis and design of pultruded FRP shapes under bending. Compos. Part B Eng. 1996, 27, 295–305. [Google Scholar] [CrossRef]
- Masarira, A. The Effect of joints on the stability behaviour of steel frame beams. J. Constr. Steel Res. 2002, 58, 1375–1390. [Google Scholar] [CrossRef]
- Hejll, A.; Taljsten, B.; Motavalli, M. Large scale hybrid FRP composite girders for use in bridge structures-theory, test and field application. Compos. Part B Eng. 2005, 36, 573–585. [Google Scholar] [CrossRef]
- Li, Y.F.; Lin, Y.J.; Chen, C.W.; Lin, C.T. Theoretical and experimental studies on the as-built and repaired rehabilitated RC frames. Can. J. Civ. Eng. 2007, 34, 923–933. [Google Scholar] [CrossRef]
- Gray, P.J.; McCarthy, C.T. A global bolted joint model for finite element analysis of load distributions in multi-bolt composite joints. Compos. Part B Eng. 2010, 41, 317–325. [Google Scholar] [CrossRef]
- Balc, R.; Chira, A.; Chira, N. Finite element analysis of beam to column end plate bolted connection. Civ. Eng. Arch. 2012, 55, 24–29. [Google Scholar]
- Computers and Structures Inc. CSI Analysis Reference Manual for SAP2000. 2013 ETABS, SAFE and CSiBridge; Computers and Structures Inc.: Berkeley, CA, USA, 2000. [Google Scholar]


| Member | Section | Specification |
|---|---|---|
| GFRP double web I type component |  | As beams and columns of the GFRP frame |
| GFRP rectangular tube type component |  | As bracings of the GFRP frame |
| Metal joint |  | As the beam-column joint |
| Bracing joint |  | For locking the bracings to the frame joint |
| Filling steel block |  | Inserted inside the GFRP bracing to avoid damage of the bracing from shearing due to bolt pressure |
| Section |  |  | |
|---|---|---|---|
| Material Property | |||
| Area (cm2) | 23.47 | 5.23 | |
| Moment of inertia (cm4) | 848.56 | 35 | |
| Elastic modulus (kN/cm2) | Ex = 1722 | Ex = 1722 | |
| Ey = 551 | Ey = 551 | ||
| Ez = 551 | Ez = 551 | ||
| Frame | FP1 | FP1T | FP1C |
|---|---|---|---|
| Linear Stiffness (kN/cm) | 15.9 | 42.2 | 26.2 |
| Ultimate Strength (kN) | 33.3 | 56.4 | 36.9 |
| Relative Displacement at Ultimate Strength (cm) | 4.8 | 2.0 | 1.4 |
| Drift Ratio (%) | 3.9% | 1.6 | 1.1 |
| Dissipated Energy * (kN-m) | 154.5 | 216.9 | 192.3 |
| Failure Locations |  |  |  |
| Frame | FP2 | FP2TC | FP2CT |
|---|---|---|---|
| Linear stiffness (kN/cm) | 20.8 | 60.1 | 43.8 |
| Maximum load (kN) | 41.6 | 51.3 | 49.4 |
| Relative displacement at maximum load (cm) | 5.4 | 2.2 | 2.7 |
| Drift ratio (%) | 4.5 | 1.8 | 2.2 |
| Dissipated energy * (kN-m) | 212.4 | 300.9 | 282.6 |
| Failure locations |  |  |  |
| Frame | Column | Tension Bracing | Compression Bracing |
|---|---|---|---|
| FP1 | 0.2 | - | - |
| FP1T | 0.2 | 0.09 | - |
| FP1C | 0.2 | - | 0.09 |
| FP2 | 0.6 | - | - |
| FP2TC | 0.6 | 0.2 | 0.1 |
| FP2CT | 0.6 | 0.4 | 0.1 |
| Frame | Ultimate Strength (kN) | ||
|---|---|---|---|
| Experiment | Numerical Analysis | Absolute Error (%) | |
| FP1 | 33.3 | 32.3 | 3 |
| FP1T | 56.4 | 57.4 | 1.8 |
| FP1C | 36.9 | 36.4 | 1.4 |
| FP2 | 41.6 | 40.4 | 2.9 |
| FP2TC | 51.3 | 53.2 | 3.7 |
| FP2CT | 49.4 | 48.9 | 1 |
© 2019 by the authors. Licensee MDPI, Basel, Switzerland. This article is an open access article distributed under the terms and conditions of the Creative Commons Attribution (CC BY) license (http://creativecommons.org/licenses/by/4.0/).
Share and Cite
Li, Y.-F.; Lai, J.-Y.; Yu, C.-C. The Push-Over Test and Numerical Analysis Study on the Mechanical Behavior of the GFRP Frame for Sustainable Prefabricated Houses. Sustainability 2019, 11, 6753. https://doi.org/10.3390/su11236753
Li Y-F, Lai J-Y, Yu C-C. The Push-Over Test and Numerical Analysis Study on the Mechanical Behavior of the GFRP Frame for Sustainable Prefabricated Houses. Sustainability. 2019; 11(23):6753. https://doi.org/10.3390/su11236753
Chicago/Turabian StyleLi, Yeou-Fong, Jian-Yu Lai, and Chung-Cheng Yu. 2019. "The Push-Over Test and Numerical Analysis Study on the Mechanical Behavior of the GFRP Frame for Sustainable Prefabricated Houses" Sustainability 11, no. 23: 6753. https://doi.org/10.3390/su11236753
APA StyleLi, Y.-F., Lai, J.-Y., & Yu, C.-C. (2019). The Push-Over Test and Numerical Analysis Study on the Mechanical Behavior of the GFRP Frame for Sustainable Prefabricated Houses. Sustainability, 11(23), 6753. https://doi.org/10.3390/su11236753