Article

Validation of Dynamic Risk Analysis Supporting Integrated Operations Across Systems

1
Department of Mechanical and Industrial Engineering, Norwegian University of Science and Technology NTNU, S.P. Andersens veg 3, 7031 Trondheim, Norway
2
Department of Civil and Industrial Engineering, University of Pisa, Largo Lucio Lazzarino 2, 56126 Pisa, Italy
3
Faculty of Applied Economics, University of Antwerp Operations Research Group ANT/OR, 2000 Antwerp, Belgium
4
Center for Corporate Sustainability (CEDON), HUB, KULeuven, 1000 Brussels, Belgium
5
Safety Science Group, TU Delft, 2628 BX Delft, The Netherlands
*
Author to whom correspondence should be addressed.
Sustainability 2019, 11(23), 6745; https://doi.org/10.3390/su11236745
Submission received: 25 October 2019 / Revised: 18 November 2019 / Accepted: 21 November 2019 / Published: 28 November 2019
(This article belongs to the Special Issue Safety and Security Issues in Industrial Parks)

Abstract

:
Dynamic risk analysis (DRA) is a novel industrial approach that aims to capture changes in operational conditions over time and quantify their effect on risk. This aspect may be advantageous for providing insight into the causal factors that have substantial risk contributions and supporting decisions related to risk control. Some DRA methods were developed by the oil and gas industry to support the integration of work processes and the cooperation across virtual clusters, e.g., between offshore and onshore systems and/or oil company and supplier. However, DRA has not been extensively adopted and limited attention is given to its validity in practical applications. The objective of this article is to illustrate how this validity can be established based on common validation approaches for risk analysis. The case study focuses on a DRA method named risk barometer that was developed to support integrated operations across the oil and gas industrial systems. The outcome of this study may serve as a basis for the validation of other DRA methods, the use of DRA in practical cases, and ultimately the achievement of integrated operations (IO) capabilities.

1. Introduction

Quantitative risk assessment (QRA) has been extensively employed in the design phase of hazardous process facilities to ensure compliance with safety requirements. These requirements may be defined as acceptance criteria that express a tolerable risk level. Conventional QRA studies provide risk estimates and support decisions that are related to the design of an industrial installation [1,2,3]. The risk models applied to the design phase QRAs are suitable for reflecting the technical design of an installation. These models, however, have a limited focus on changes in the operating and environmental conditions and their potential impact on risk. As a result, new methods and models have been developed for the quantitative analysis of changes in risk levels, which is referred to as dynamic risk analysis (DRA) in the process industry. DRAs are performed in the operational phase to update the risk level over a certain interval based on operational experiences and field data or predict the risk level for the upcoming period based on precursor data [4]. However, appropriate validation for DRA is still an unexplored domain. For this reason, this study aims to suggest a set of relevant approaches.
Numerous representative DRA methods have been developed for safety-critical sectors, such as the oil and gas (O&G) sector: The organizational risk influence model (ORIM) [5], the barrier and operational risk analysis of hydrocarbon releases (BORA-release) [6,7], and the risk modeling through integration of organizational, human and technical factors (risk-OMT) [8]. These methods extend the existing QRA models by explicitly incorporating organizational and operational factors. They have proved useful in periodic updates of QRA results by reflecting changes in the parameters and assumptions of QRAs. Further developments of these methods employ machine learning techniques [9]. However, a specific challenge when using these methods is the ability to provide relevant input data [10,11], and therefore, the use of these models is difficult in practical cases. For this reason, a new DRA method named risk barometer (RB) was developed in the context of integrated operation (IO) concepts, also known by O&G companies as Field of the Future (BP), Smart Fields (Shell), eOperations and eField [12]. These concepts refer to the integration of people, work processes and information technology to make smarter decisions and achieve extended operational lifetime, reduced costs, and improved safety, production and recovery rates. It is enabled by global access to real-time information, collaborative technology, and integration of multiple expertise across disciplines, organizations, and geographical locations [12,13] representing virtual industrial clusters. IO concepts enable access to an increasing amount of real-time data related to safety barrier performance and operational conditions [14], which underlie the Risk Barometer (RB) method [15]. The RB method is mainly applied to O&G, but DRA is not limited to this domain [16]. Analogously, safety barriers are not only widespread within O&G, but they are also becoming a pivotal concept for other industries [17], as they are generically defined as physical or non-physical means that are planned to prevent, control, or mitigate undesired events or accidents [18].
The primary aim of the RB method is to use this dataset as a basis for continuously capturing the changes in operational conditions and dynamic aspects of risk in an improved way. In many cases, a lack of detailed knowledge about the relation between the actual risk level and the associated causal factors may exist. For this reason, the risk level is calculated by considering the contributions from the involved safety barriers. In this way, time for processing information and calculating the risk can be reduced, which may enable a more frequent update of the risk [15]. Note that the RB method emphasizes visualizing the results. Thus, the results are understood by the operational personnel [15]. Despite these practical benefits, the RB method may disregard certain contributors to risk or be based on unrealistic assumptions [19]. Therefore, investigating whether the RB method is suitable for quantitative analysis of risk in the relevant operational and decision context is essential.
This standpoint is particularly pertinent to the validity concept for risk analysis, which can be established based on an argument. It is referred to as cost-effective usefulness: Quantification of risk provides safety benefits compared with other methods that are based on qualitative approaches [20]. For example, the existing QRAs used in design can provide quantitative risk measures, which are used to prove compliance to regulations that concern the safe design in the long term [20,21,22]. New DRA methods, such as the RB method, can quantify the changes in the total risk level in a shorter time, which may not be obtained by traditional QRA. This finding provides decision support regarding barrier performances and safe operations [15,21]. If we consider also the IO context in which the RB has been developed, the main issues concerning its validity are detailed as follows:
-
Is the method capable of identifying major accident scenarios and the critical safety barrier?
-
Is the modeling approach suitable for capturing the changes in the operations and updating the risk level over time based on the collected data?
-
Are the results similar compared with other recognized DRA methods?
-
Are the outcomes sufficiently realistic to be applicable for industrial cases?
-
Is the method functional to the achievement of sustainable integrated operations across systems?
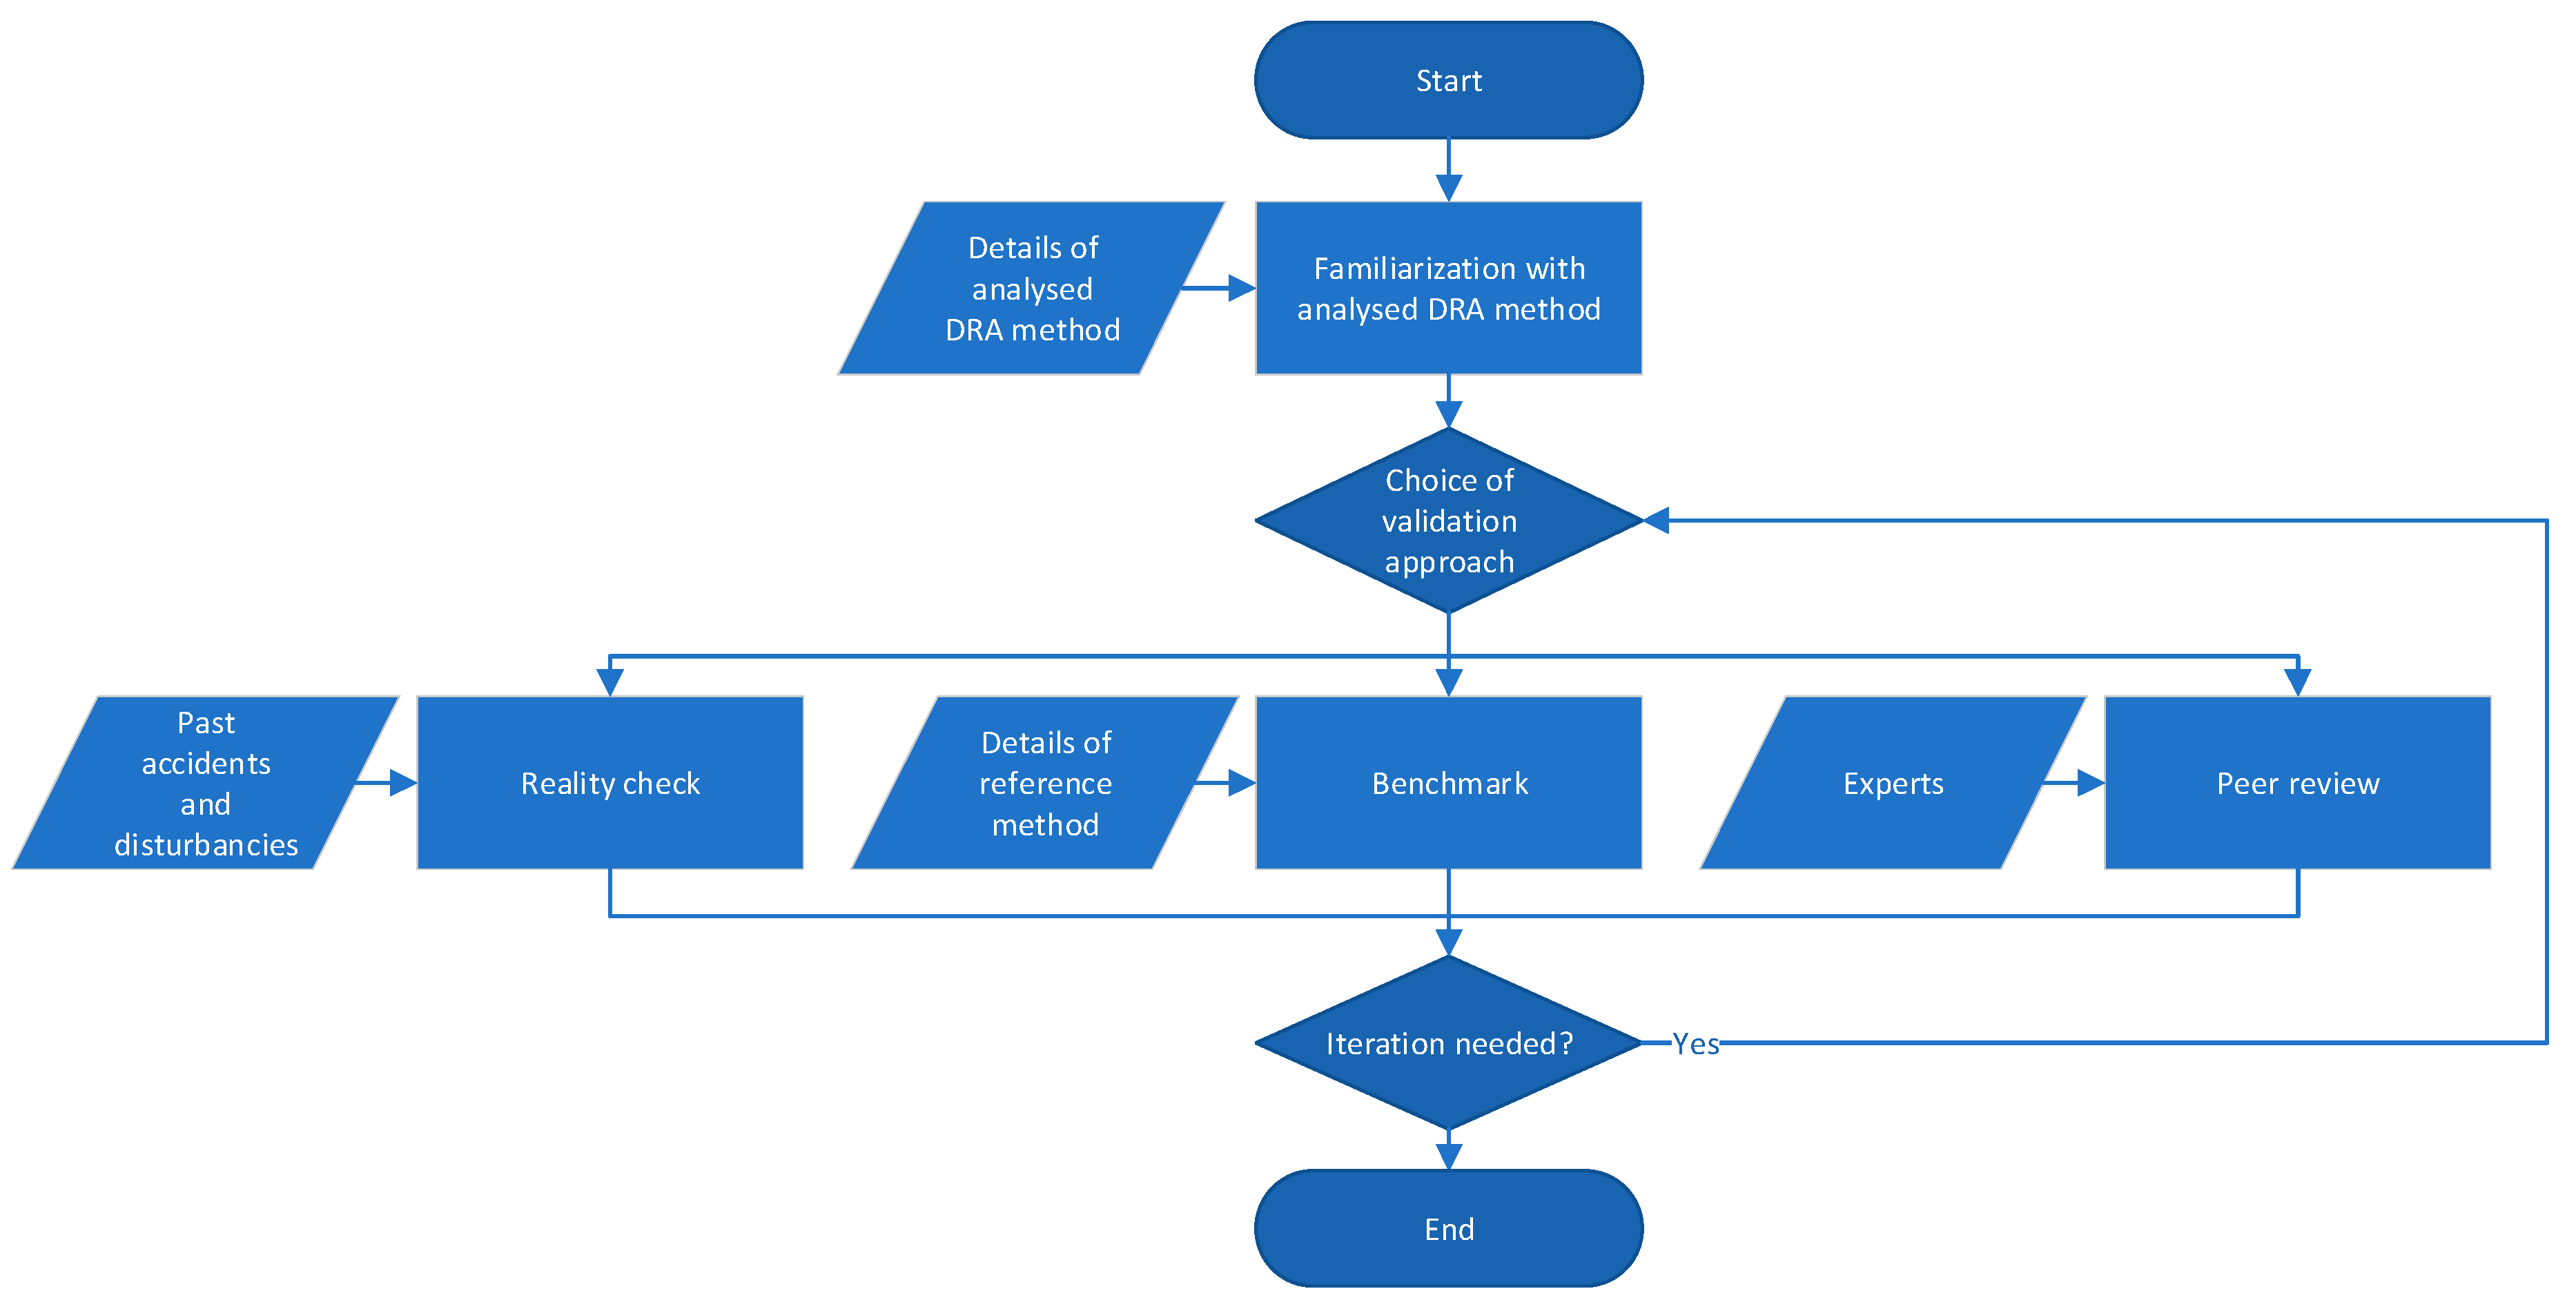
As Cumming [23] states, the validation procedures for risk analysis techniques are limited. For this reason, a set of fundamental validation approaches were selected from Suokas’ work [24] to address DRA issues: (i) Reality check (comparison with operating experience of corresponding installations), (ii) benchmark (comparison with a parallel analysis of the same installation or activity), and (iii) peer review (examination of the output of the risk analysis by technical experts).
Goerlandt et al. [21] present these approaches for establishing the pragmatic validity of risk analysis. The authors state that the first approach concerns the validity of a generic analysis method and can be applied to validate the results of a specific risk assessment. The second approach is primarily intended for evaluating the coverage of an analysis method and the reliability of the results in terms of analysis content and outcome [25]. The third approach can be applied to specific risk analysis and builds on the personal experience of individuals having technical expertise on the considered phenomena, practitioners, or risk analysis experts [21].
We illustrate how these approaches may be used to establish the validity of a DRA method when applied to a specific accident scenario. The RB method is considered for this purpose, but the approaches can be applied to any DRA technique.
After this introductive section, Section 2 describes the dynamic risk analysis method and the validation approaches. Section 3 illustrates the case-study used in this work. In Section 4, we report the results from the validation process of the considered dynamic risk analysis method. Section 5 and Section 6 present the discussion and concluding remarks.

2. Methods

Validity for risk analysis can have several meanings that are debatable. Therefore, a focus on certain aspects of validity, considering the objectives, expected results, and limitations of risk analysis methods, may be necessary [24]. As a result, familiarization with the dynamic risk analysis method is essential to select adequate approaches for validation, which can be considered a primary step in the process (Figure 1). Subsequently, one validation approach should be adopted. Further iterations to analyze the DRA method validity through parallel approaches are possible and suggested for comprehensive results (Figure 1).

2.1. Familiarization with the Risk Barometer Dynamic Risk Analysis Method

As previously mentioned, RB is a DRA method defined to enable IO concepts for risk assessment. Despite its practical benefits, the RB method may rely on incorrect assumptions and/or present limitations on the definition of contributors to risk. For these reasons, the validation of this method is investigated. This section introduces the main characteristics of the risk barometer method. The RB method is suitable for frequent updates of the risk level and involving practitioners in the risk model development. The risk model used in the RB takes into account the status of most critical barriers, whose performance has a significant impact on risk. The information related to the status of these barriers is collected by a set of indicators [26]. The RB method consists of seven main steps [15]:
Step 1: Select scenarios. This step aims to select hazardous events and accident scenarios that match installation-specific interests. In some cases, relevant guidelines and standards may be applied for this step. For instance, the methodology for identification of major accident hazards (MIMAH) [27] can be implemented to identify hazards and represent the associated accident paths in a Bowtie diagram. A Bowtie diagram analysis is easily comprehended by practitioners and can be conducted in cooperation with installation personnel [28].
Step 2: Review relevant data sources. To identify barriers and indicators that are relevant to the scenario defined in step 1, available data sources, including generic industry data, plant-specific data, and interviews with personnel and judgments, should be reviewed. No single source can provide sufficient information to perform a risk analysis [15], and therefore, combining both qualitative information and quantitative information from various references is essential.
Step 3: Identify safety barriers and associated installations. Safety barriers and the associated installations that are linked to the scenario in step 1 are identified. Ensuring that critical safety barriers are taken into account, which should be supported by the information obtained in Step 2, is important. The result of step 3 can be presented by adopting the form of objective trees, which is extensively employed in nuclear facilities [14,29,30]. The top level of an objective tree is a specific safety objective, which can be achieved by the safety functions listed on the lower level. The challenges related to achieving each safety function and the mechanism that causes these challenges are listed. On the lowest level of the tree, a provision that denotes a set of barriers to prevent/mitigate the mechanism is listed [31].
Step 4: Evaluate the importance of barrier installations. In the RB method, critical safety barriers are defined as barriers whose performance has a relatively high impact on the risk level. To evaluate the criticality of barriers, risk contributions from performance variations of barriers are assessed.
Step 5: Select indicators to assess barrier status. In step 5, a set of key performance indicators is developed to measure the performance of the associated barriers. Step 2 can be iterated for indicator selection as discussions and reviews with operational personnel may confirm which indicator is available and can be collected during operations.
Step 6: Establish a risk model based on the aggregation of scaled indicators. As shown by Table 1, each indicator is translated into a mutually comparable score value that is defined on a standardized scale (e.g., 1 to 6). This translation can be obtained by an interpolation function (e.g., linear, geometric, or logarithmic). Weighted summations of these scores quantify the barrier performance. The safety barrier performance expressed on this scale is translated into the barrier failure probability. The iteration of the bow-tie analysis with new failure probability values enables the risk measure to be updated.
Step 7: Visualization. The results from the RB method need to be presented to the decision-makers and operational personnel, so that information about risks is used to support decisions. Adequate presentation formats can facilitate the communication of risk information. Typical formats include time-series trends, radar charts, tabular formats, and criticality plots. The RB method can provide a graphical representation of its underlying risk model using the mentioned formats and detailed information about risk contribution from model elements [32].

2.2. Validation Approaches

This section presents three validation approaches for risk analysis [24] that are considered for validation of a DRA method, such as the RB.

2.2.1. Reality Check

Comparison against past accidents and disturbances that occurred in installations similar to the object of study may determine the risk analysis capability of identifying hazards and contributors. Past accident analysis is an extensively employed tool for preliminary hazard identification in chemical and process facilities [33]. This study was inspired by this tool to provide insights that validate the results from a DRA and eventually identify issues beyond the scope of this study, which should have been addressed but have remained unidentified and unassessed. Real incidents and near-miss accidents can be used to assess whether an RB has the capability of identifying complete accident scenarios [34,35]. In addition, we may gain insight into the extent to which the RB method can identify causal factors. For example, a comparison may reveal that the method performs well in identifying technical component failures rather than human errors in different operational situations [24]. Based on what was suggested by Paltrinieri et al. [36], the past accident data analysis applied in this work adopts the following databases:
  • Online Major Accident Reporting System (eMARS) by the Major Accident Hazards Bureau (MAHB) of the European Commission’s Joint Research Centre (JRC) [37];
  • Analysis Research and Information on Accidents (ARIA) by the French Ministry of Environment [38].
  • Major Hazard Incident Data Service by Health and Safety Executive (MHIDAS) [39]
Google Scholar, web search engine of scholarly literature by Google [40].

2.2.2. Benchmark

A comparison with other recognized DRA methods can be employed to test whether the analyzed method is suitable for a specific application area. The activity of benchmarking primarily refers to the comparison of results from the two methods and allows identifying similarities and/or specificities on how the input data are processed. Fundamental aspects are the sensitiveness of the methods with respect to input changes (reflecting operational variations) and the overall conservativeness of their assessment.
Statistic metrics are to be used for comparison of results. The kurtosis and skewness metrics are important descriptors of a data distribution shape. Kurtosis shows whether the distribution is peaked or heavy-tailed relatively to a normal distribution [41]. This suggests whether the technique has a rather constant evaluation of risk during the period considered (peaked distribution) or it is subject to large variations (heavy-tailed distribution). For this reason, kurtosis comparison is an indication of the relative sensitiveness. Skewness measures the degree of asymmetry of the distribution. The skewness for a normal distribution is zero, while positive skewness values indicate data that are skewed right (the right tail is long relative to the left tail), and vice versa [41]. This provides an overall picture of how the technique has evaluated risk during the period considered. This metric comparison describes relative conservativeness.
Reference method for comparison. A recognized DRA method that has specific similarities to the analyzed method should be considered. This study uses the frequency modification methodology based on technical, operational, and organizational factors (TEC2O) [42] as it is based on the collection and evaluation of key performance indicators and was developed for the O&G domain. TEC2O is a consolidated method while RB is a method that has mainly been defined and used for specific industrial applications [15]. For this reason, validation by TEC2O was deemed to be not only appropriate but also functional to strengthening the RB methodology. In this work, this method is exclusively functional to the benchmark approach and, for this reason, is introduced in this section.
TEC2O focuses on updating the likelihood of hydrocarbon release from the equipment on O&G installations, which is a common application area of the two methods. Both methods use a set of indicators that are related to operational and technical causal factors. Indicator measurements are quantified on a standardized discrete scale and are important input parameters for both methods. The impact of indicators on the risk is calculated based on a weighted sum of the indicator values in both methods. However, the differences between RB and TEC2O should be noted. The RB identifies accident scenarios and the associated safety barriers, whereas TEC2O focuses on single equipment items included in the current QRA. The RB emphasizes on capturing the changes in the risk level, such that most indicators in the RB are related to the performance of safety barriers based on field data. Indicators of TEC2O are selected from a set of generic indicators that are related to the specific equipment characteristics. An extensive description of the method is reported elsewhere [4,42,43,44]. The key elements are summarized in the following section.
The fundamental relationship in the TEC2O method enables us to update the leak frequency as follows:
F ( t ) = F 0 × TMF × MMF
where F(t) is the timely updated accident frequency, t is the time, F0 is the baseline frequency value, TMF is the technical modification factor and MMF is the management modification factor. TMF and MMF are obtained by combining different scores, which are produced by monitoring the quantitative indicators. The TEC2O procedure is depicted in Figure 2.
TMF aims to synthetically account for the lifecycle of equipment to penalize “old” units, which may be more prone to leaks and failure due to aging, erosion and/or corrosion phenomena. Moreover, external factors (environmental issues, seismic zone, and harsh weather areas) are considered. TMF only contributes as a worsening element since the failure likelihood of typical mechanical and electrical components or systems increases with time, with an increasing rate that approaches (or in some cases extends) the end of the design life. TMF is based on four subfactors, as indicated in Figure 2a. Periodical monitoring of related indicators statuses enables an average score to be assigned to each of the four subfactors. The weighted combination of the scores enables the total technical score (ε) to be determined and converted to the TMF.
The evaluation of the MMF is based on the concept of resilience and follows the resilience-based early warning indicators (REWI) methodology [45]. Managerial aspects are related to the definition of the safety procedures, training, and competencies of the operators, safety culture, frequency of maintenance operations and communication at different levels of the organization. To introduce a quantitative evaluation of these factors, the REWI method proposes the use of indicators, which are quantitative parameters, so they can be monitored, modified and updated in time. According to [45], the MMF is divided into two main subfactors (Figure 2b): An operational subfactor and an organizational subfactor. Periodical monitoring of related indicators statuses enables an average score to be assigned to each subfactor. The weighted combination of the scores enables the total technical score (μ), which is converted to the MMF.

2.2.3. Peer Review

Rosqvist and Tuominen [46] introduce a specific peer review process for formal safety assessment. In this work, an adapted version of this process is implemented for validation of the DRA method. The results of this process should be reviewed by experts and operational personnel inasmuch as information from any QRA model should be peer-reviewed before accepted to be used for decision-making. A set of pivotal items are suggested in Table 2 to lay the foundations of the peer-review process. These items address the ultimate goal of the peer review of reducing uncertainty, which may be related to completeness, coherence, and accuracy. Coherence within risk assessment objectives and modeling is important, as they are the foundations of the study. Any incompleteness in the previous steps of risk assessment introduces a latent bias in the following steps. Accuracy in the evaluation of prior parameters and the risk index is essential to obtaining the correct definitions of safety barriers and their effect on risk. Incompleteness in the definition of safety barriers may negatively affect the redundancy of safety systems and the total installation safety.

3. Case Study

The O&G industry is gradually implementing IO strategies to support work processes [12,13,49,50,51,52,53]. This implies important changes compared to traditional operations where O&G production was almost totally managed by the platforms with little or no interaction with external parties. Now the boundaries of the system are reshaped by using available digital infrastructures and real-time data to monitor operations and control processes remotely. The exchange of information over large distances without significant delay and the use of high-quality collaboration technology connects different actors and increases access to expert knowledge.
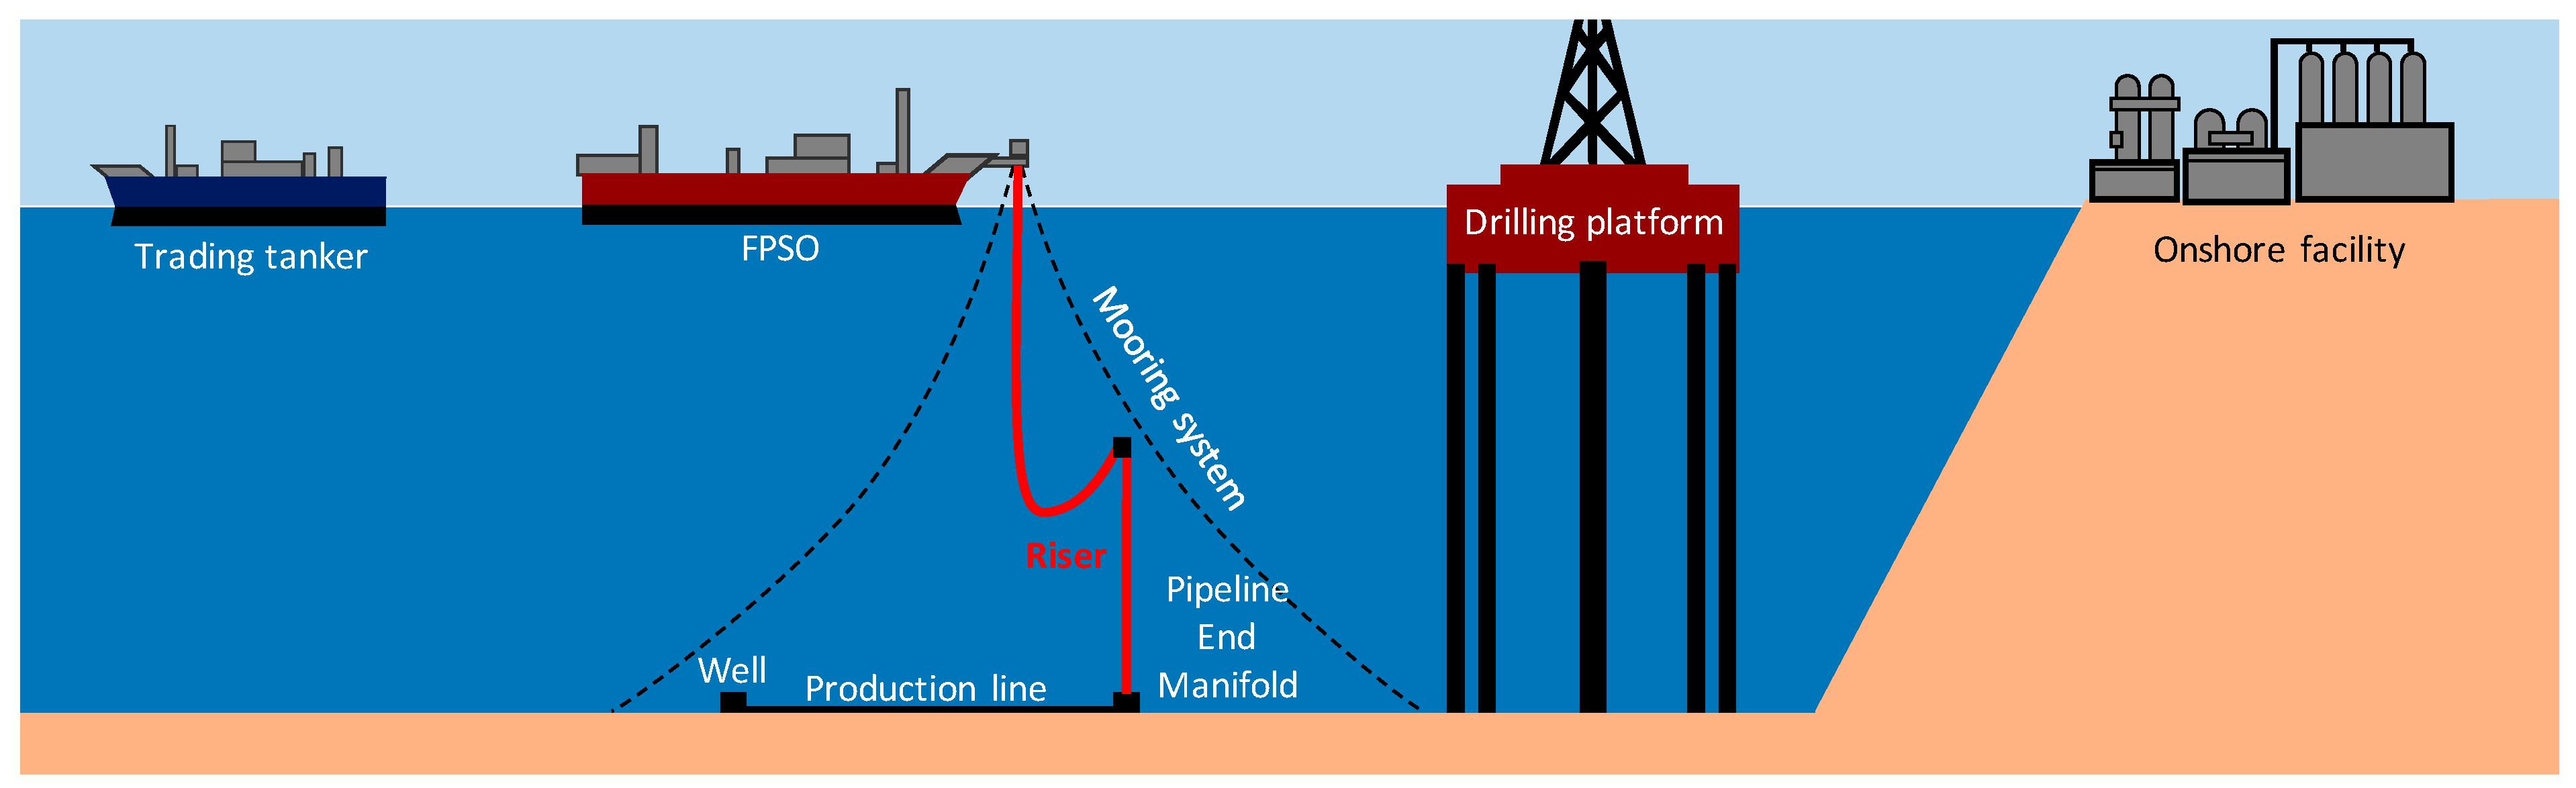
This is particularly important in complex installations characterized by numerous wells connected through flowlines to a floating production storage and offloading (FPSO) unit. The FPSO exports to trading tankers and collaborates with nearby drilling platforms, onshore facilities to process and distribute the product, and a number of contractors collaborating and depending on each other within the operations (Figure 3). Such installations may represent a virtual cluster of organizations with multiple expertise across disciplines, organizations, and locations [12,13].
Although the geographical location has progressively become secondary for the abovementioned aspects, it is still critical for what concerns production. For instance, installations producing from oil wells in soft formations commonly require appropriate precautions, such as control of sand or fines with fluids [54]. Sand does not have economic value and can plug wells, erode and corrode equipment, and reduce well productivity. In certain producing regions, sand control completions generate considerable operational expenses. Paltrinieri et al. [14,44] have previously suggested DRA strategies to effectively control the potential loss of containment due to oil sands. Continuous monitoring is essential for providing effective management of the safety barriers in place, regardless of the managers’ physical location. Due to these specific criticalities, this case is considered for the validation of the RB. The case is based on the results from a project with a major oil company within the overall framework of the Center for Integrated Operations in the Petroleum Industries [55]. Details are provided elsewhere [14,15,29,49].

3.1. Description of the Installation

The case study is based on a sand erosion issue in a real offshore oil production installation with multiple topside modules. A multi-jointing yard and marine supply base support the FPSO operations from onshore. The production installation is located subsea and connected with a spread-moored FPSO, which is used as a hub to process and store the fluids produced from the subsea wells. Figure 3 shows a representation of the facility that is considered for the case study. The analysis focuses on the riser of the FPSO (highlighted in red in Figure 3) and its material degradation due to the processes of erosion/corrosion. The riser is a piping system in which a multiphase stream (e.g., containing oil, gas, and water) is sent from the wells to the preliminary treatment on the on-board process facility.
An excessive sand production rate, i.e., an increase in both sand production and flow velocity that exceeds a critical threshold, causes pipeline material degradation. Sensors to detect oil sand are usually employed [14,44]:
  • An acoustic sand detector (ASD) performs online monitoring and provides immediate information. The ASD records the noise produced by sand carried in the process flow. The detectors are placed subsea on the outside of the flow line bends and detect the noise made when sand collides with the pipeline wall.
  • An erosion probe, i.e., a metallic surface inserted in the well stream is physically eroded by passing sand particles. This detector is placed topside and only reports accumulated effects over a longer time period.
One of the main safety measures that are used to prevent sand erosion at the root of the problem is the gravel pack. A gravel pack is a downhole filter that is held in place with a properly sized screen. In case the gravel pack is not sufficient and excessive sand production is detected, a specific sand response procedure should be performed.
A sand response procedure that is based on sensor-based monitoring [14,44] is also employed as a prevention measure. This procedure implies that if sand is detected and its rate exceeds a specific threshold, the flow line should be choked back until the sand production rate is acceptable. Generally, the acoustic sand detector is used for dynamic monitoring, and the erosion probe represents subsequent confirmation of the results.
A corrosive environment and sand deposit may also cause pipeline material degradation due to corrosion. The gravel pack is a safety measure for this scenario, as it can prevent sand production and sand deposit where the flow is slowed by line bends. Injection of appropriate chemicals into the fluids to inhibit corrosion (chemical treatment) is another safety measure that is defined to prevent a corrosive environment, which may be based on sensor detection of oil corrosiveness. Moreover, cleaning pigs to run within the riser can be employed if a sand deposit is expected from the results of the sand detectors.

3.2. FPSO Lifecycle

The study focuses on the operations during the FPSO lifecycle, which is assumed to be 25 years. For this reason, the evolution of 87 items that describe the installation’s technical, operational and organizational factors was simulated within this period. To avoid specific organizational and maintenance management implications, the following main assumptions are considered in the application:
  • no personnel change, and
  • no equipment replacement throughout the entire time period.
Table 3 illustrates a selection of the simulated items, which are not indicators but details that describe the evolution of the technical, operational and organizational factors that represent the FPSO lifecycle for a period of 25 years (for this reason, no measuring time is reported). The definition of these items was inspired by the aspects considered by the REWI method [56]. The DRA techniques that were considered in this study (RB and TEC2O) are based on indicators that are similar but not identical (e.g., they may be based on a different measuring time, the indicators are reported in Tables S1 and S2 in the Supplementary Materials) and the items in Table 3 are the basis for their definitions. While most of the technical items are simulated based on literature and statistical sources [57,58], the operational and organizational items are simulated using sinusoidal trends with a randomly changing mean value to reproduce the relative unpredictability. Time evolution is described using a hyperbola function and initial indicators values are set equal to the values reported by Øien and Sklet [59].

4. Results

4.1. RB Application

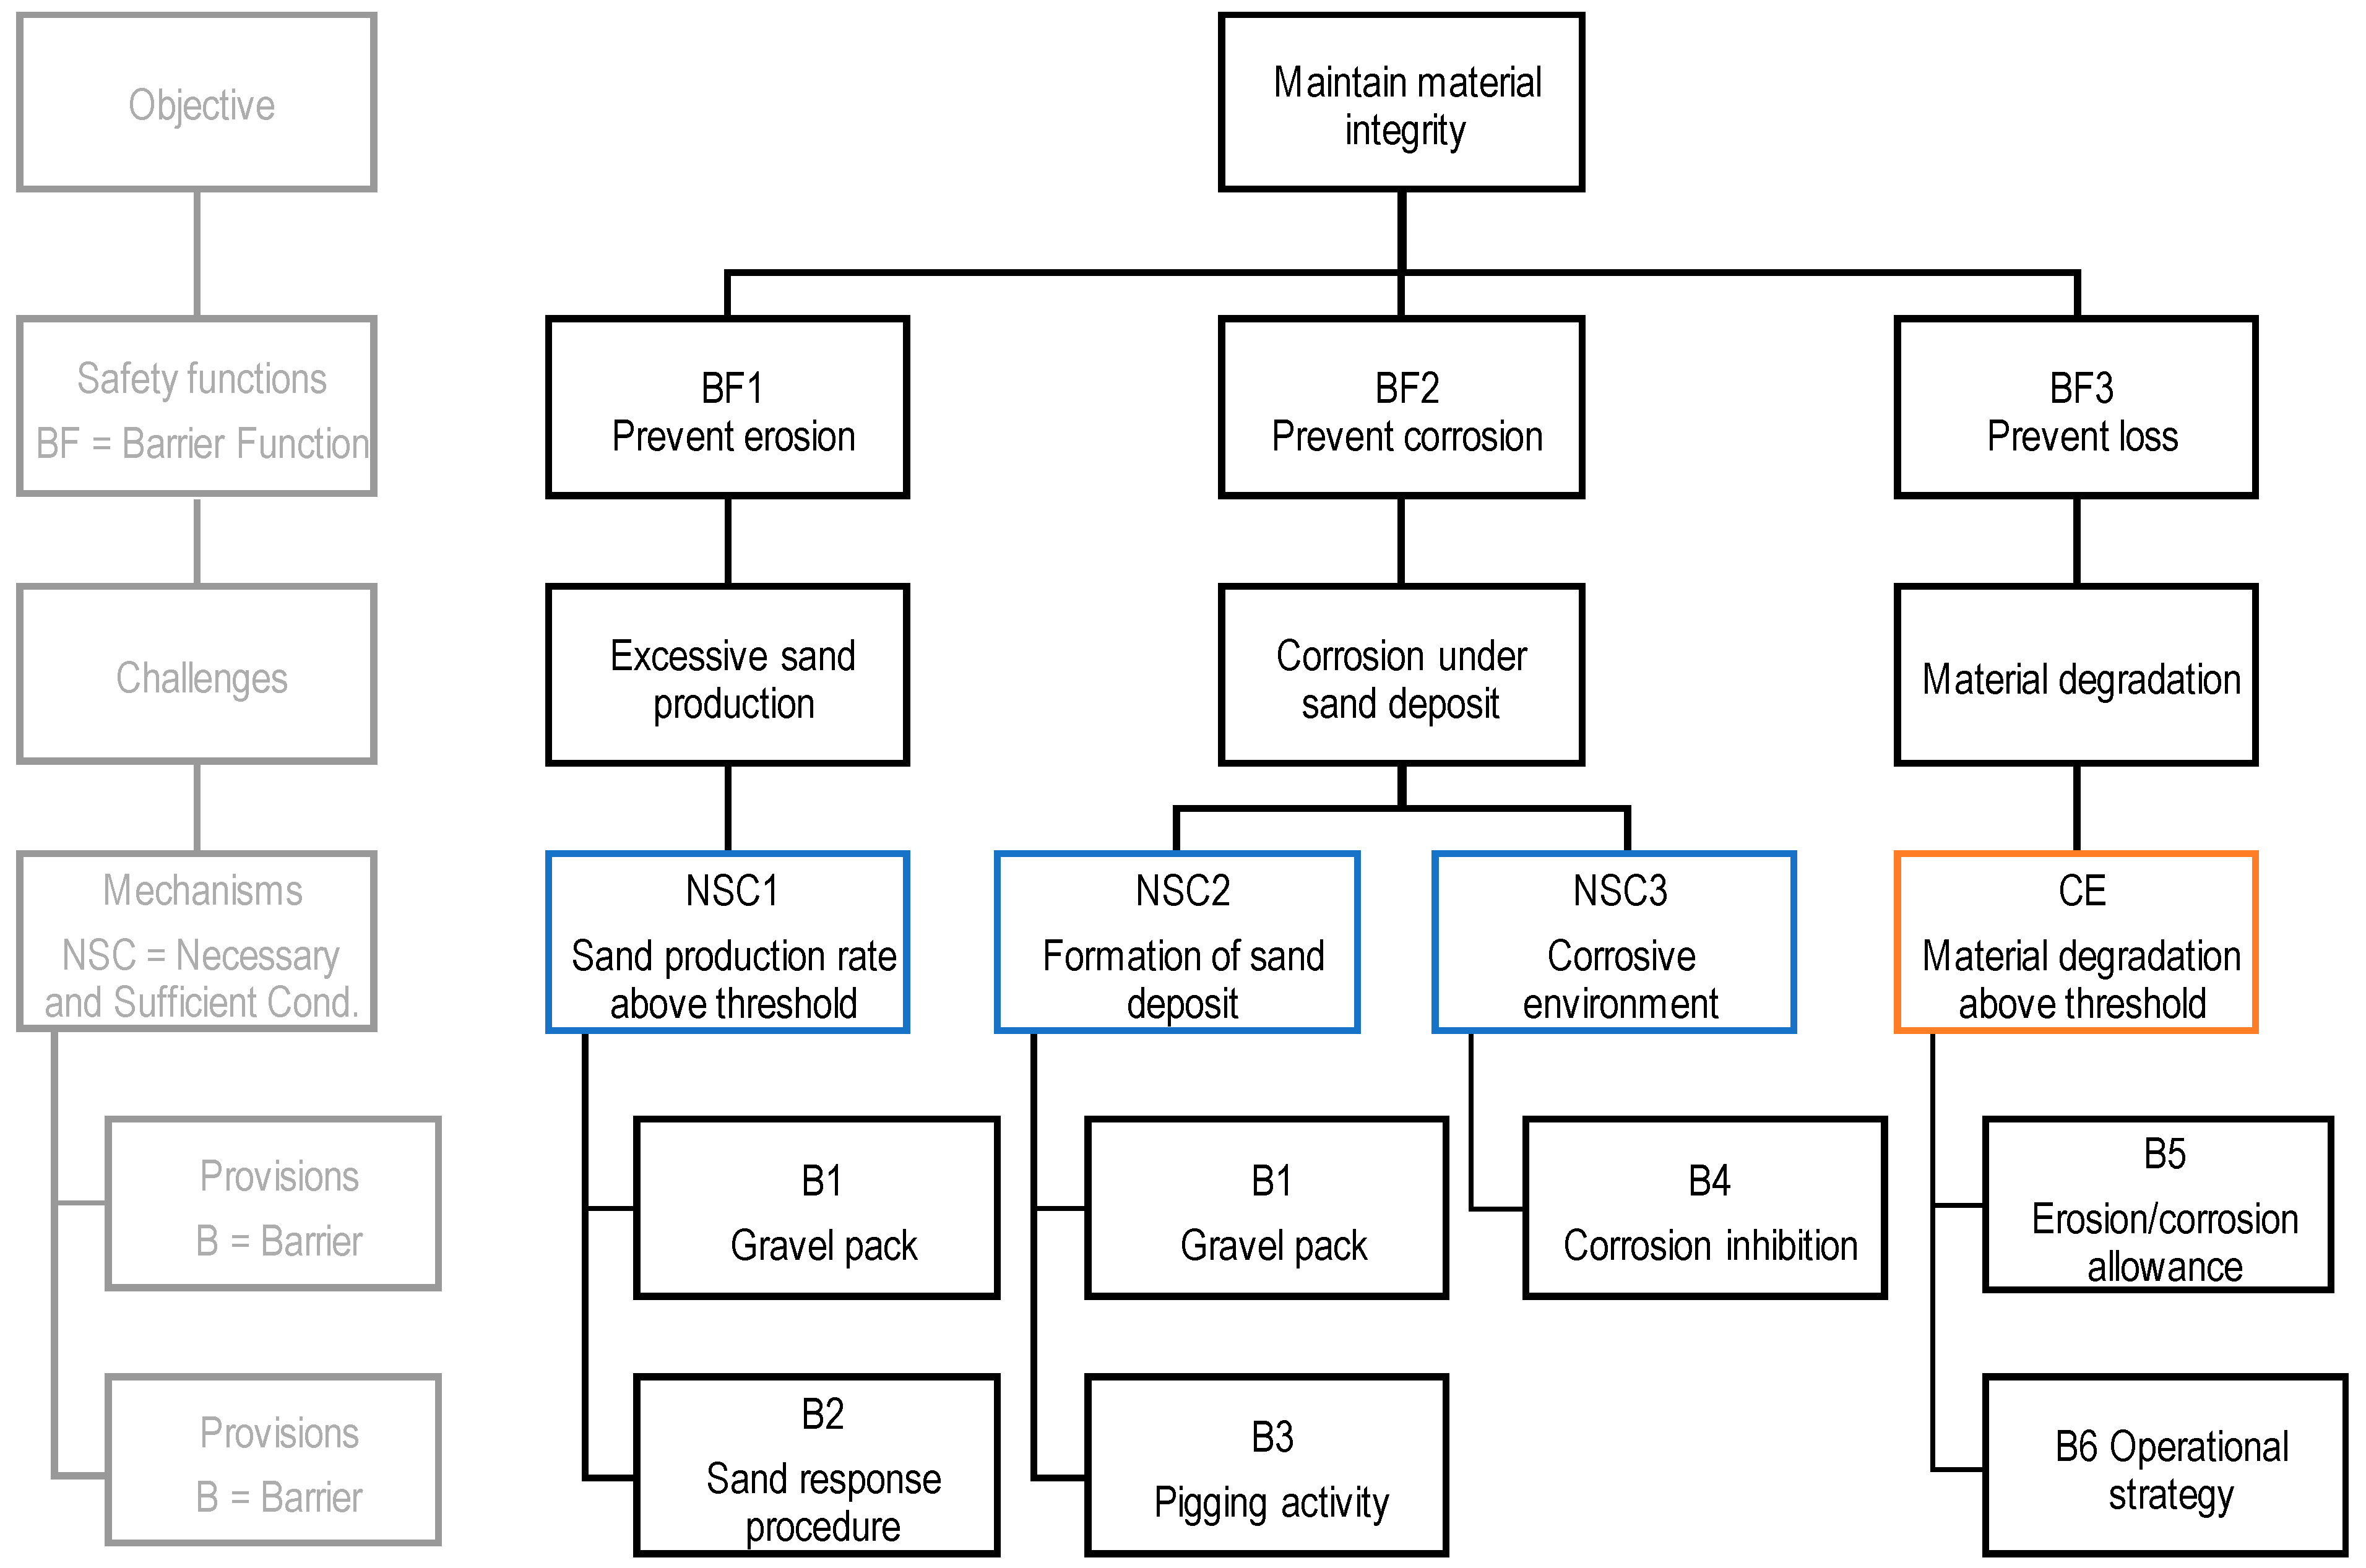
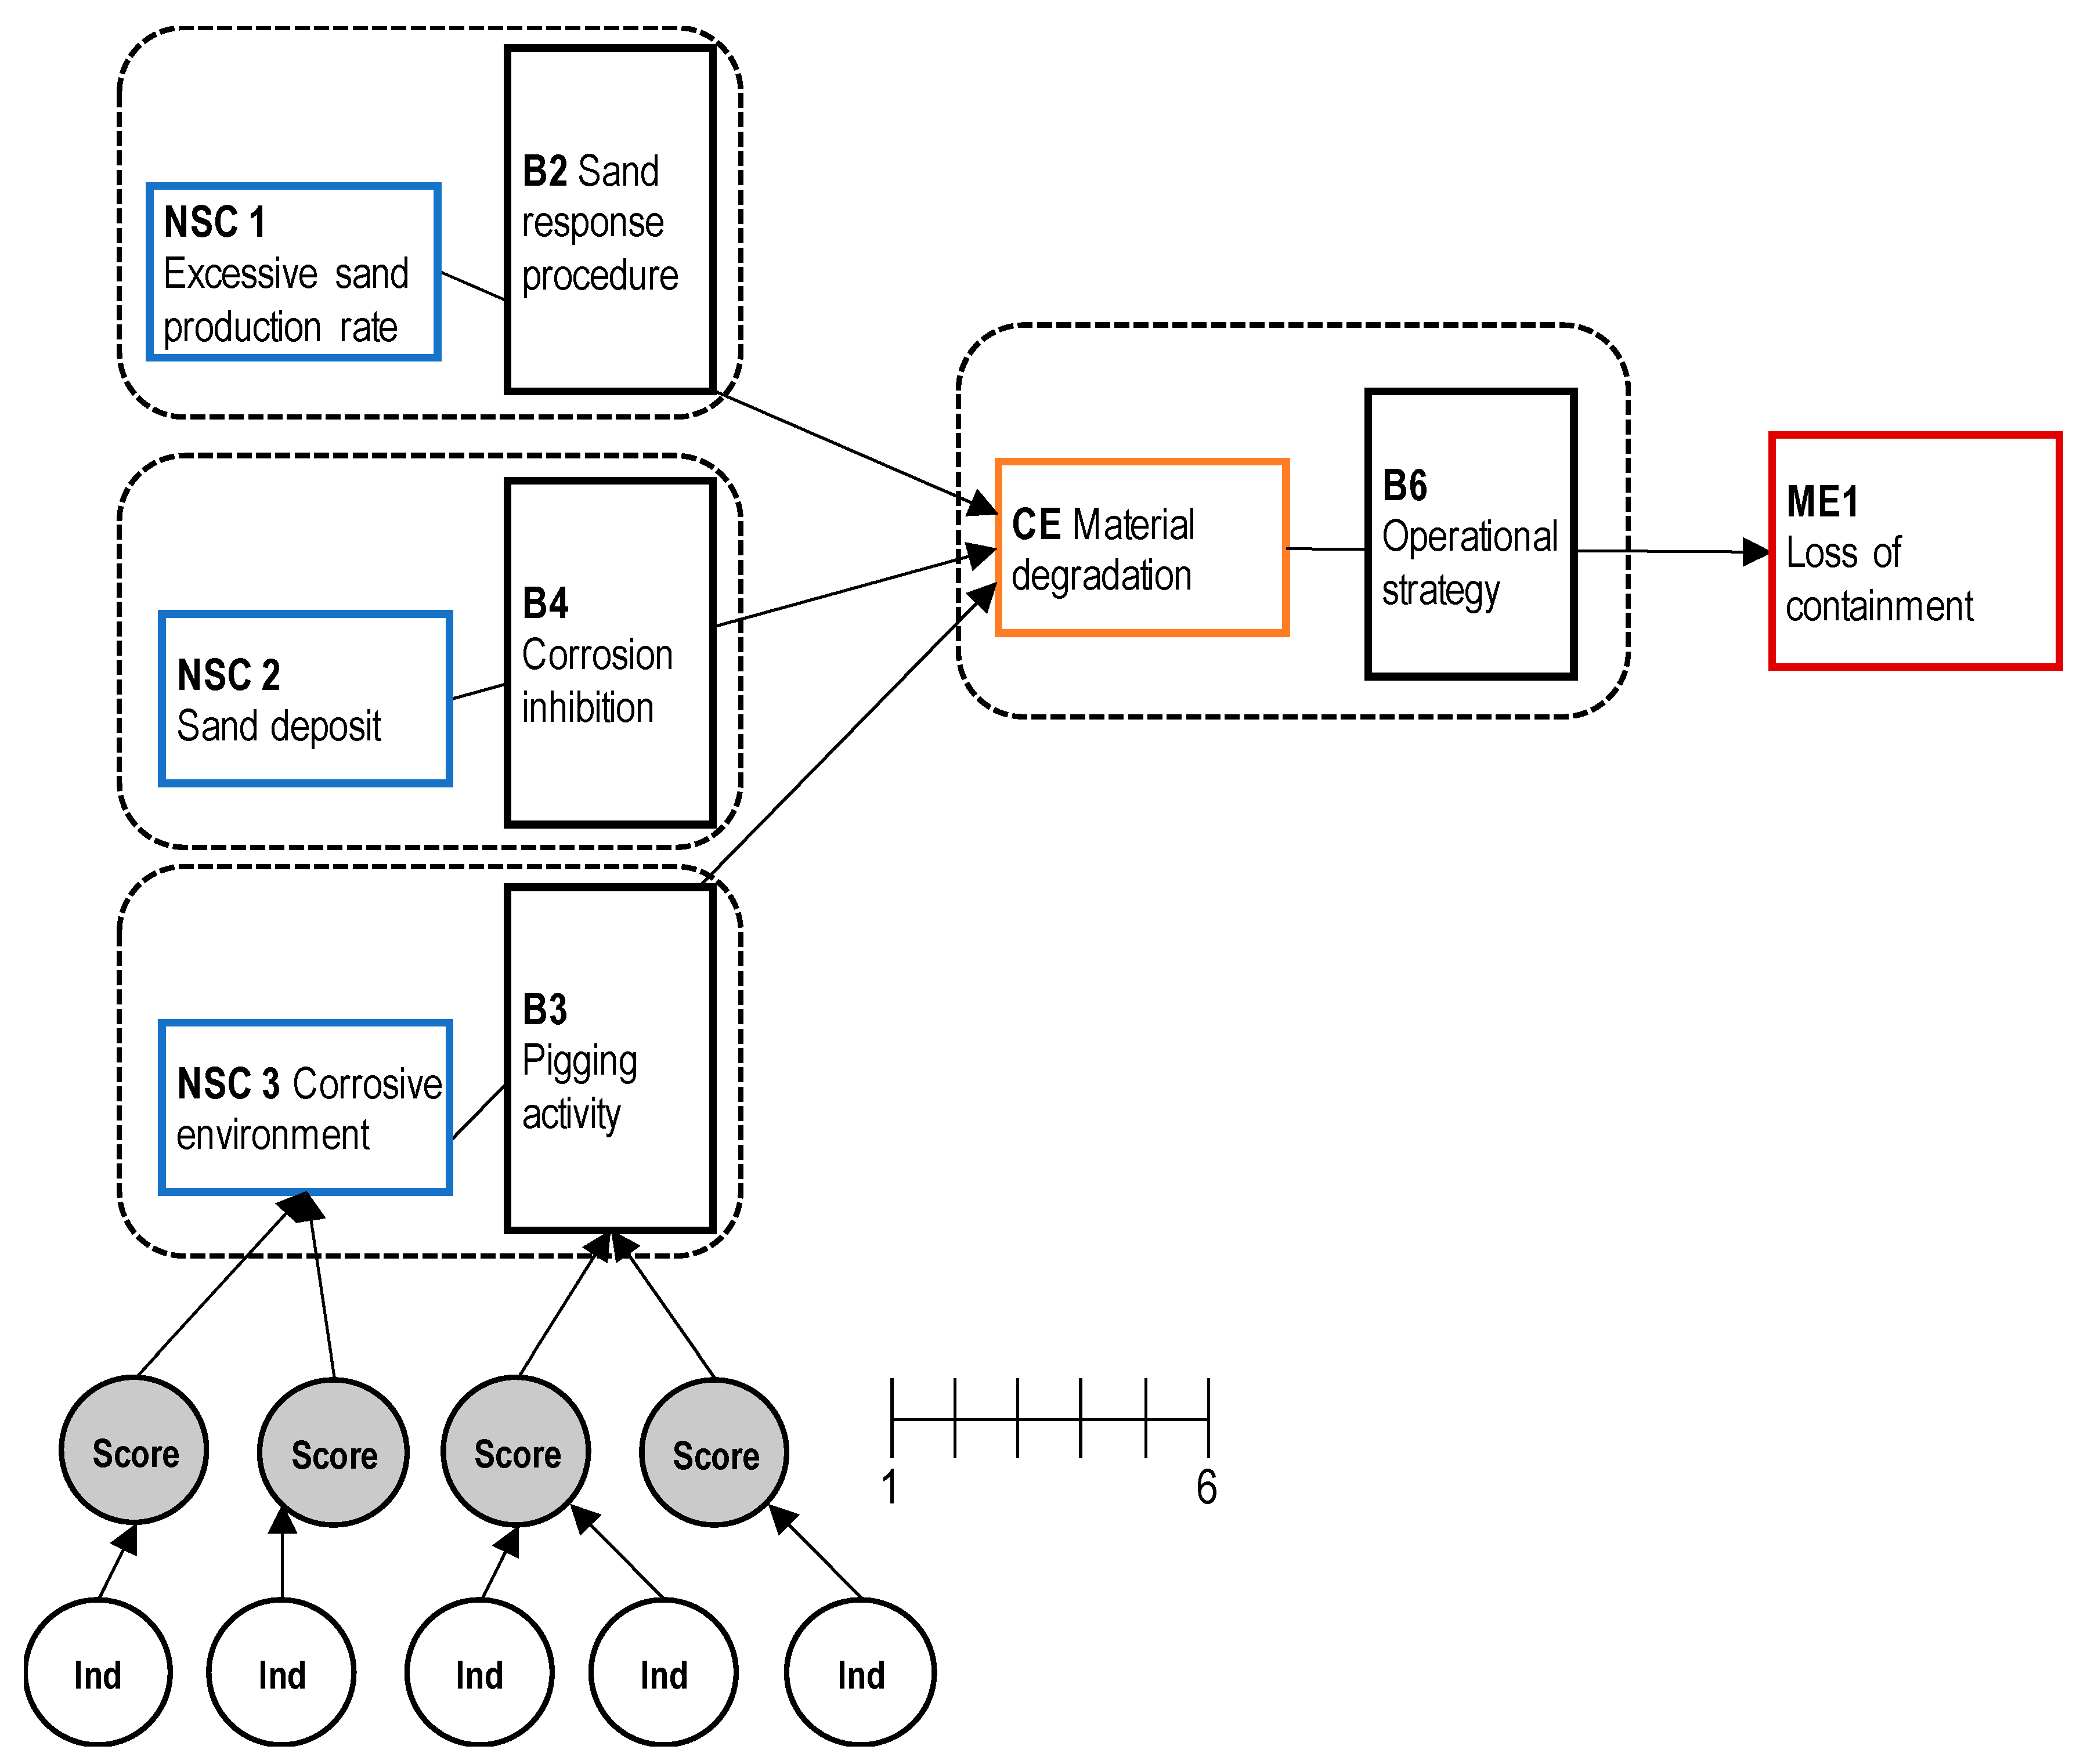
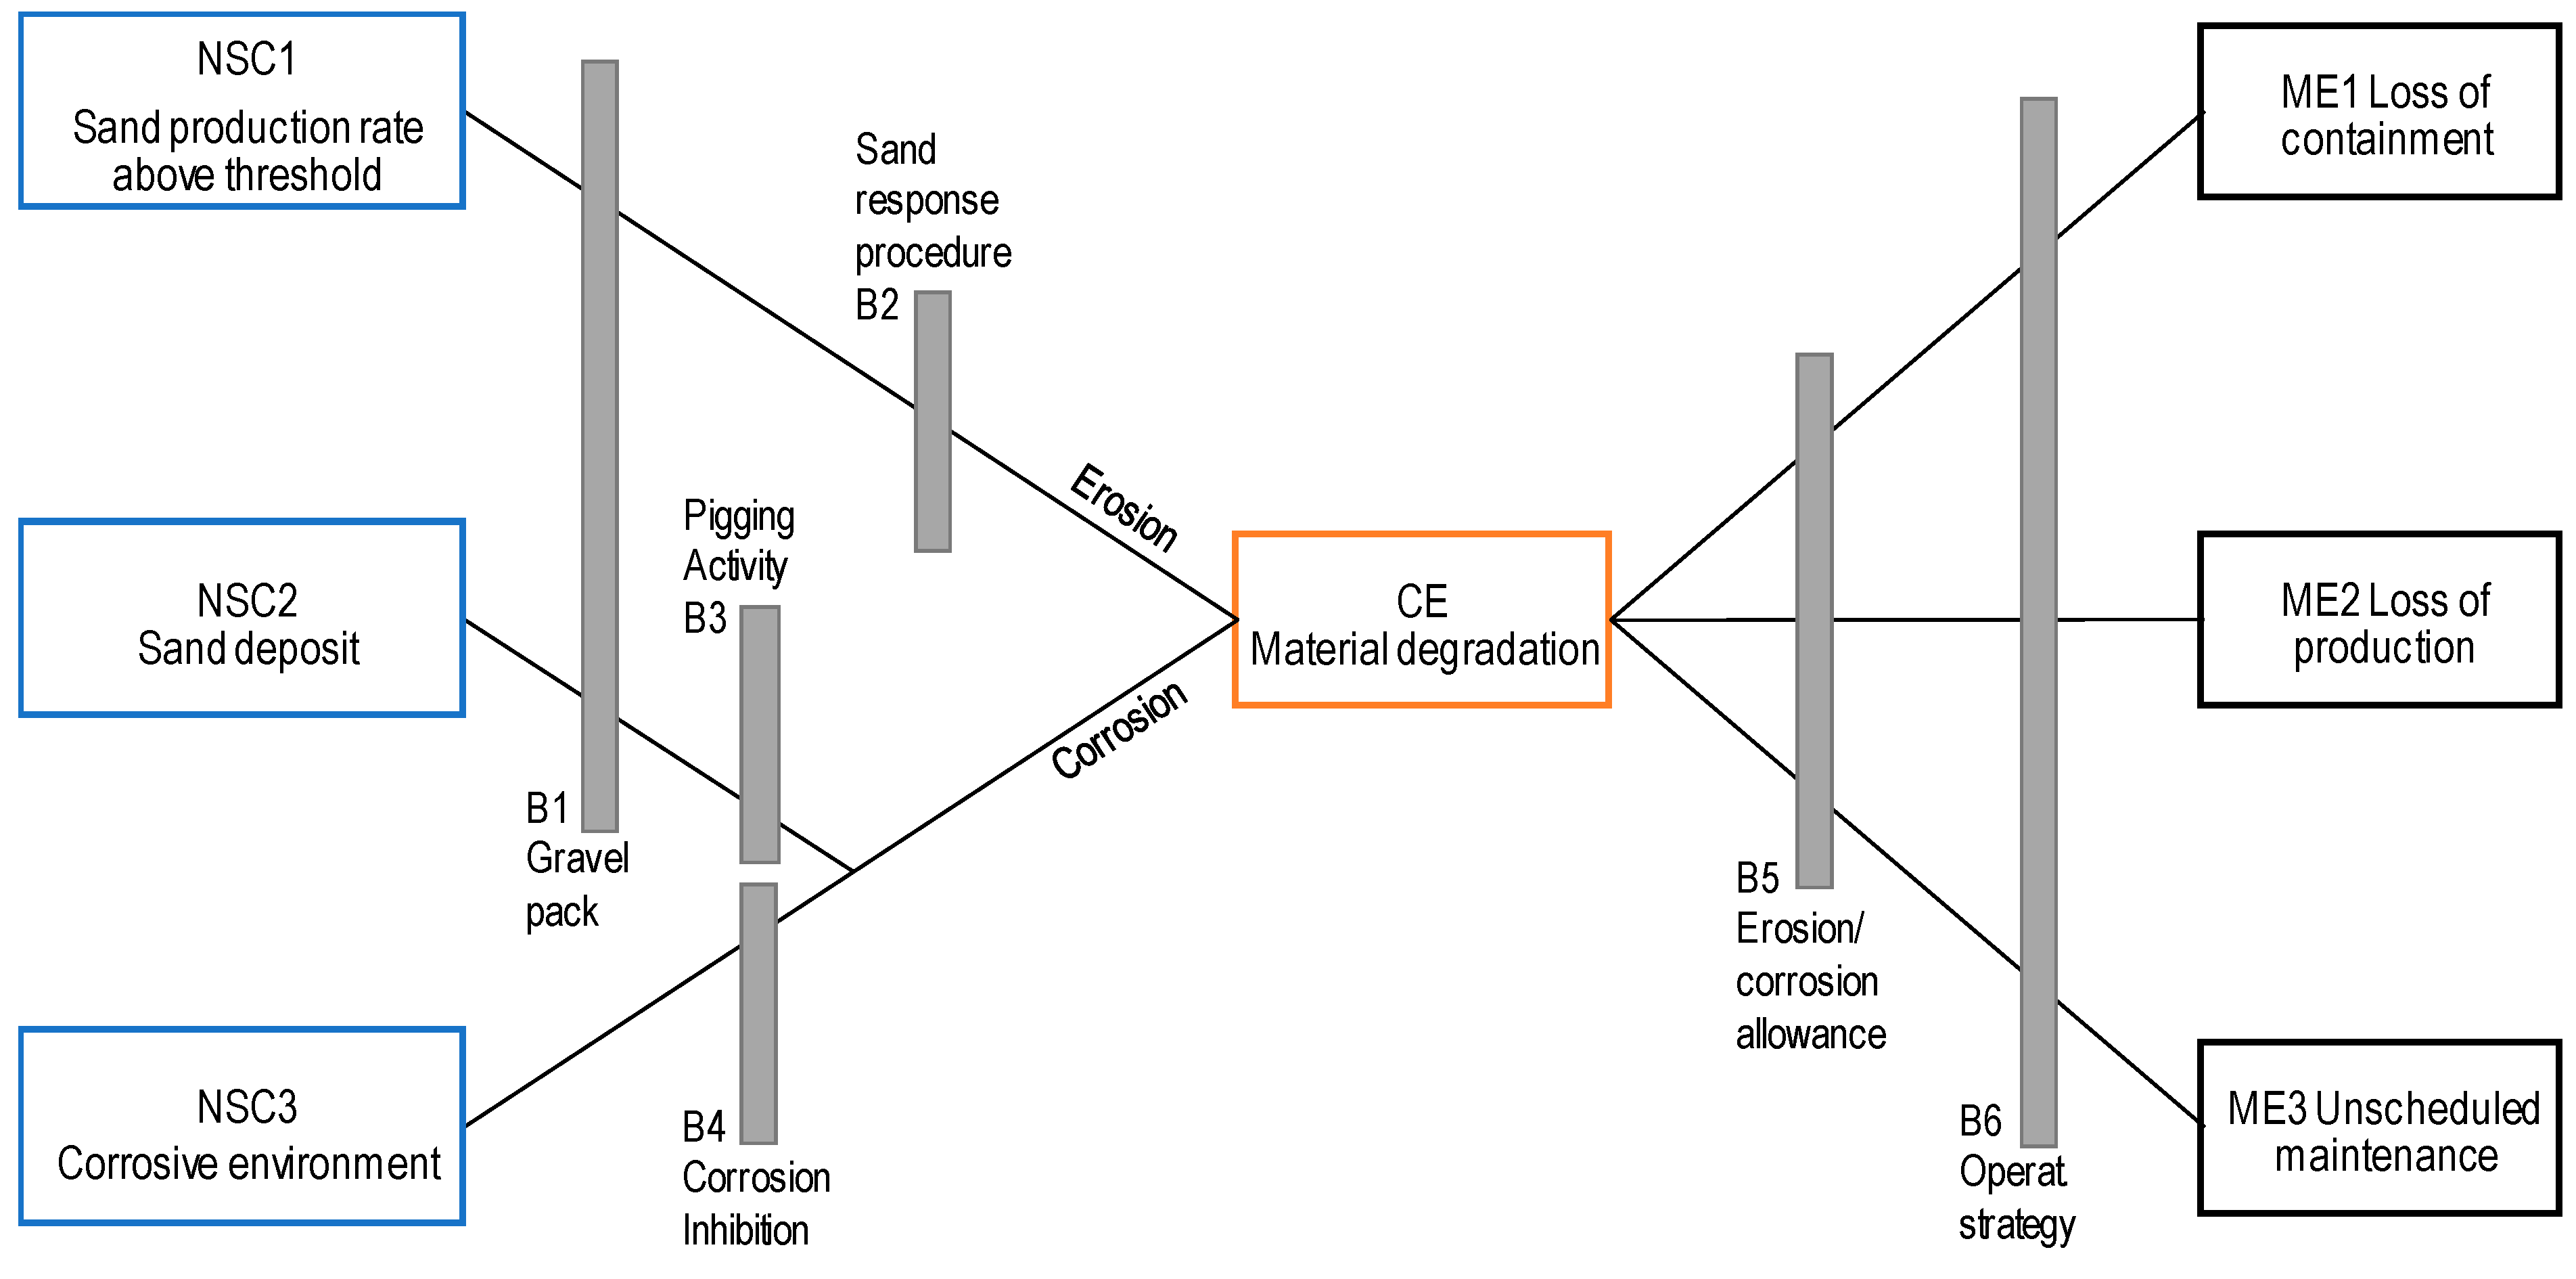
Step 1: Scenario definition. A hazardous event was defined as material degradation of the riser wall. The hazard is the presence of sand particles in the hydrocarbon flow from the well. The two identified events that cause degradation are (i) erosion due to excessive sand production with exceeding velocity, and (ii) corrosion due to sand under-deposit combined with corrosive environment.
After the identification of possible event sequences, barriers are considered. The existing proactive barriers include the gravel pack, the sand response procedure, pigging, and chemical treatment. Reactive barriers to degradation caused by erosion and corrosion are operational strategies and erosion/corrosion allowance. The final outcomes are listed as follows: (1) Loss of containment, (2) loss of production, and (3) unscheduled repair. The total result of Step 1 is presented in the bowtie diagram depicted in Figure 4.
Step 2: Review of relevant information sources. Specific information about the case was obtained from three workshops with the major oil company (participants listed in Table 4), which enabled a set of indicators to be identified based on the barrier systems and their relative importance.
Furthermore, the generic information employed for this step includes studies of sand production during extrusion of hydrocarbon [54], risk indicators [4,26,42,61,62,63], and expression of barrier criticality [19,29,49,64,65,66,67,68].
Step 3: Establishment of barrier functions and systems. The first degradation event sequence refers to erosion caused by an excessive amount of sand in which the critical threshold velocity of the oil flow is exceeded (NSC1). The involved safety function is “prevent erosion”, which is achieved by two safety barriers: B1 filtering sand particles with a gravel pack, and B2 sand response procedure after the detection of excessive sand. Two barrier elements are used for sand detection, i.e., ASD and erosion probe. The second degradation event sequence refers to corrosion, which may occur with sand under deposit (NSC2) in a corrosive environment (NSC3). The safety function, in this case, is “prevent corrosion”, which is achieved by three safety barriers: B1 gravel pack, B3 cleaning pigs, and B4 corrosion inhibitor. The major event of loss of containment is prevented by B5 (erosion/corrosion allowance) and B6 (operational strategy). The results of this step are represented by the objective tree depicted in Figure 5.
Step 4: Evaluation of relative importance of safety barriers. As the QRA is not available, the results from Steps 1–3 are used to perform a qualitative evaluation of the safety barriers and define their relative importance. A qualitative evaluation of the safety barriers is presented as follows:
B1.
The gravel pack (i.e., physically installed to prevent sand in the well fluid to flow to the production unit) is a passive barrier system. This system applies to the excessive sand production rate (NSC1) and sand deposit (NSC2).
B2.
The sand response procedure (i.e., operator intervention as a response to excessive sand production rate detected by ASD and erosion probe) consists of technical and operational barrier systems that apply to the sand production rate (NSC1) and can prevent sand erosion.
B3.
Pigging activity (i.e., the pigging equipment removes sand deposits in the riser) is a technical barrier that applies to the sand deposit (NSC3). However, it cannot prevent corrosion.
B4.
Inhibition (i.e., injection of corrosion inhibitors) is an operational barrier that applies to a corrosive environment (NSC2) but cannot prevent the corrosion phenomenon.
B5.
Pipe wall allowance (i.e., increased design thickness of the riser wall) is a passive technical barrier that can mitigate material degradation (CE).
B6.
Operational strategy (i.e., modification of production strategy) is an operational barrier that mitigates degradation (CE) and is the last barrier for preventing the final major events of release (ME1), loss of production (ME2), and unscheduled maintenance (ME3).
The following criteria are also considered for the definition of the barrier relative importance.
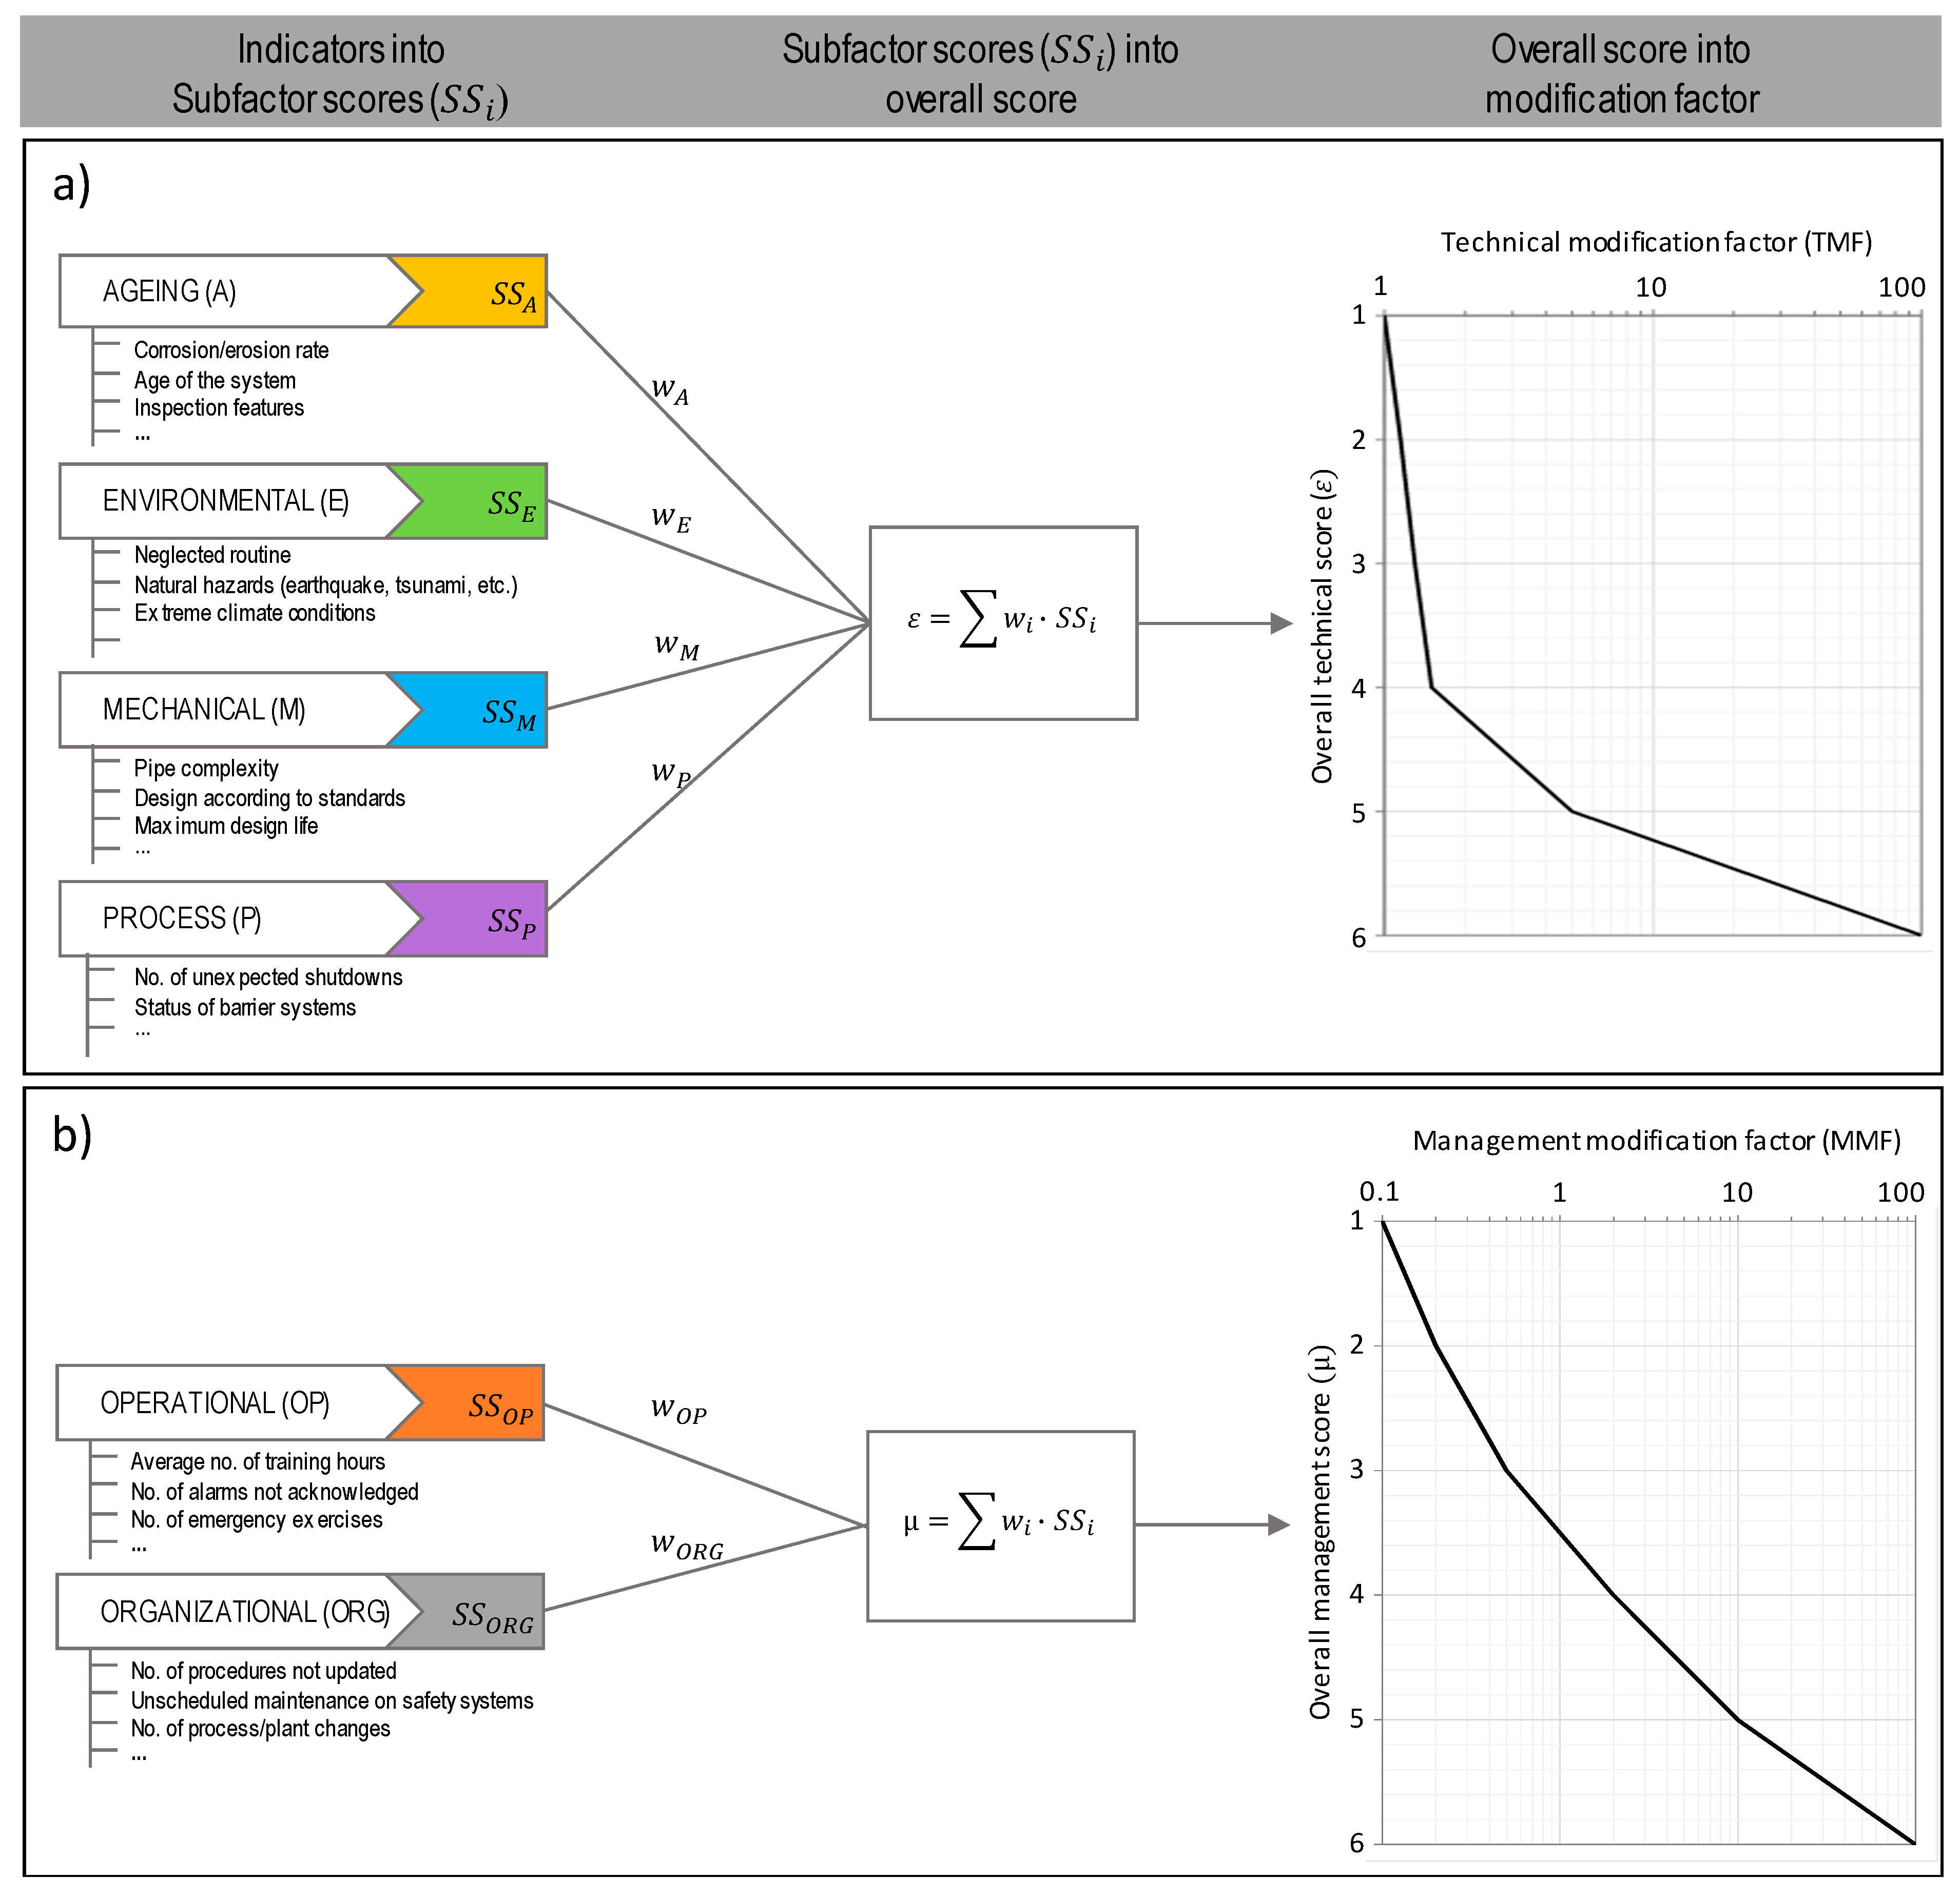
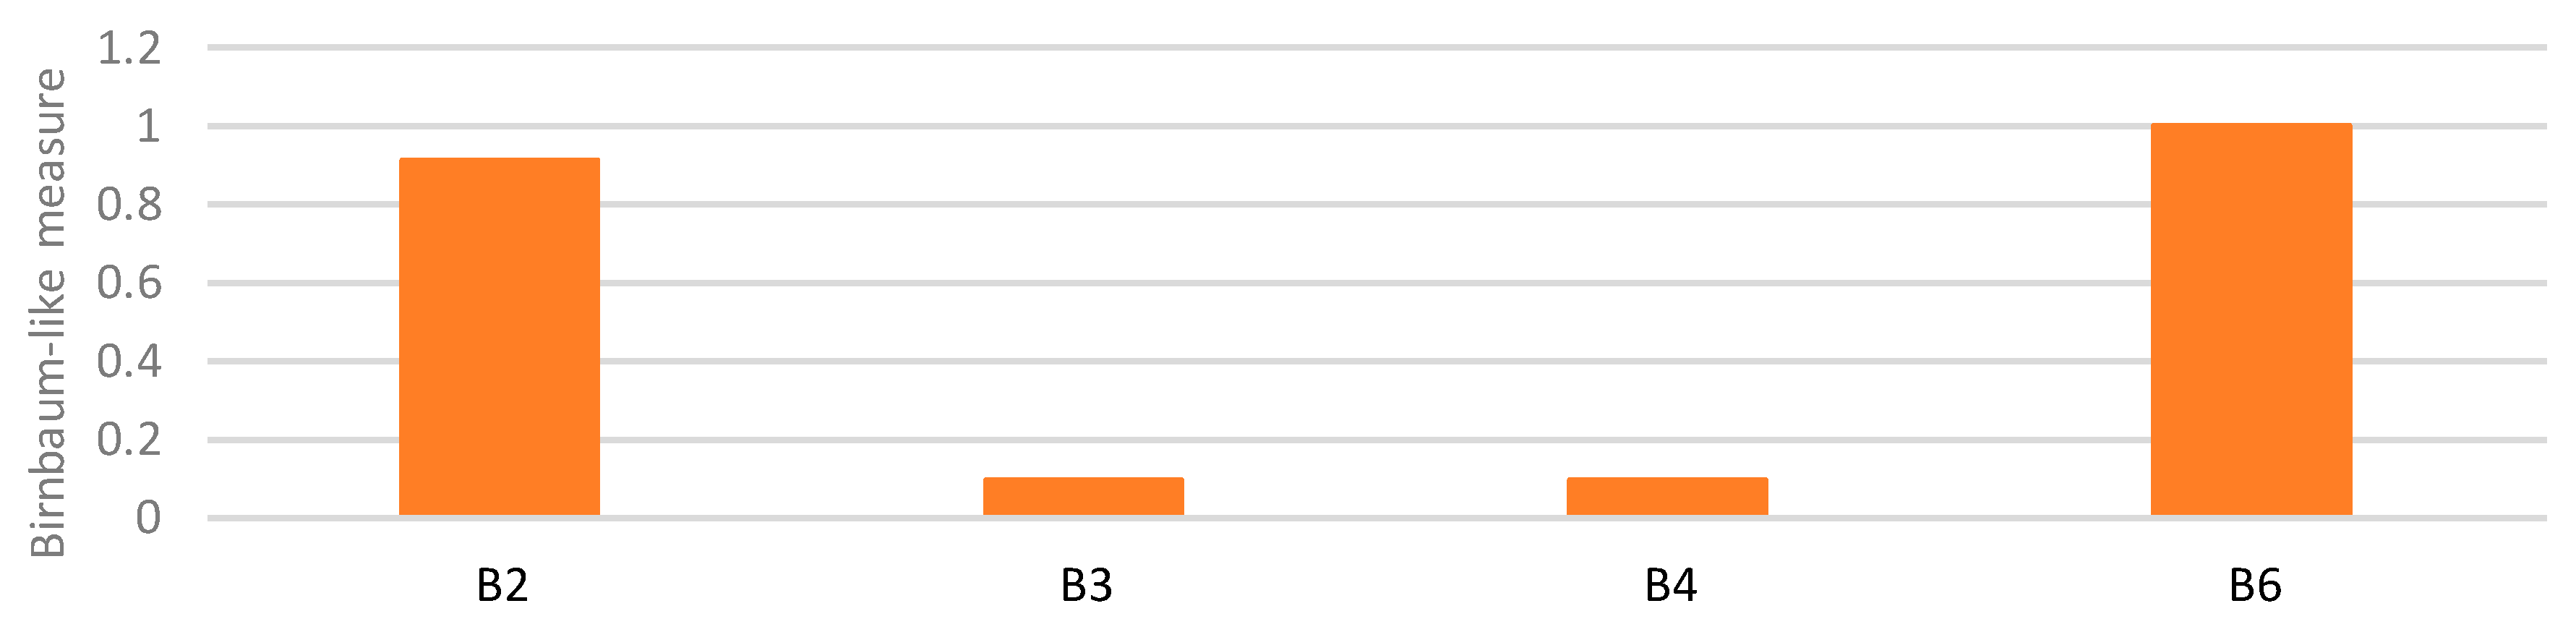
  • A safety barrier should be active (controllable) to be considered in the RB model. For simplicity, passive barriers are considered a constant factor as their degradation is not within the primary scope of the RB application. The RB primary scope is to provide operational support for actions that can directly control the process.
  • The relative importance of a safety barrier within the RB model increases with its proximity to the final major event. This importance is demonstrated by the sensitivity analysis performed on barrier i by assessing its Birnbaum-like measure I B ( i ) = R F P i (Figure 6), where R is the total risk and FP is the barrier failure probability [15,69]. The failure of a safety barrier at the beginning of a sequence of barriers can be considered relatively less critical than the failure of the last safety barrier that separates the target from a major accident.
  • The relative importance of a safety barrier within the RB model also increases with the number of unwanted events that it can address. This importance is demonstrated by the sensitivity analysis of barrier i that was performed by assessing the Birnbaum-like measure [15,69] (Figure 6).
Based on the qualitative evaluation and the mentioned criteria, the relative importance of the barriers is defined and expressed by the ranking in Table 5.
Step 5: Establishment of barrier performance indicators. Sets of barrier performance indicators are defined based on the information collected during the workshops with the major oil company involved in the case study (Table S1). For instance, the indicators defined for the barrier “sand response procedure” are shown in Table 6. Due to the lack of frequency values for the NSCs, a constant status is assumed to focus on barrier performance variations.
Step 6: Establishment of a risk model. The established risk model is based on the bowtie diagram in Figure 4. For simplicity, indicator weights were considered uniform, but assessment using the analytical hierarchy process (AHP) based on personnel’s feedback is necessary for further refinement [71]. Linear interpolation was used to obtain the indicator measure as the items mentioned in Section 3.2 were expressively simulated to facilitate the definition of indicators. However, other simulation functions may be used in case of sparse data. The gravel pack (B1) and erosion/corrosion allowance (B5) are passive barriers. For this reason, they were omitted (Step 4), as shown by Figure 7. Moreover, the model focuses on the worst-case consequence: Loss of containment (ME1). Risk is defined as the risk of loss of containment.
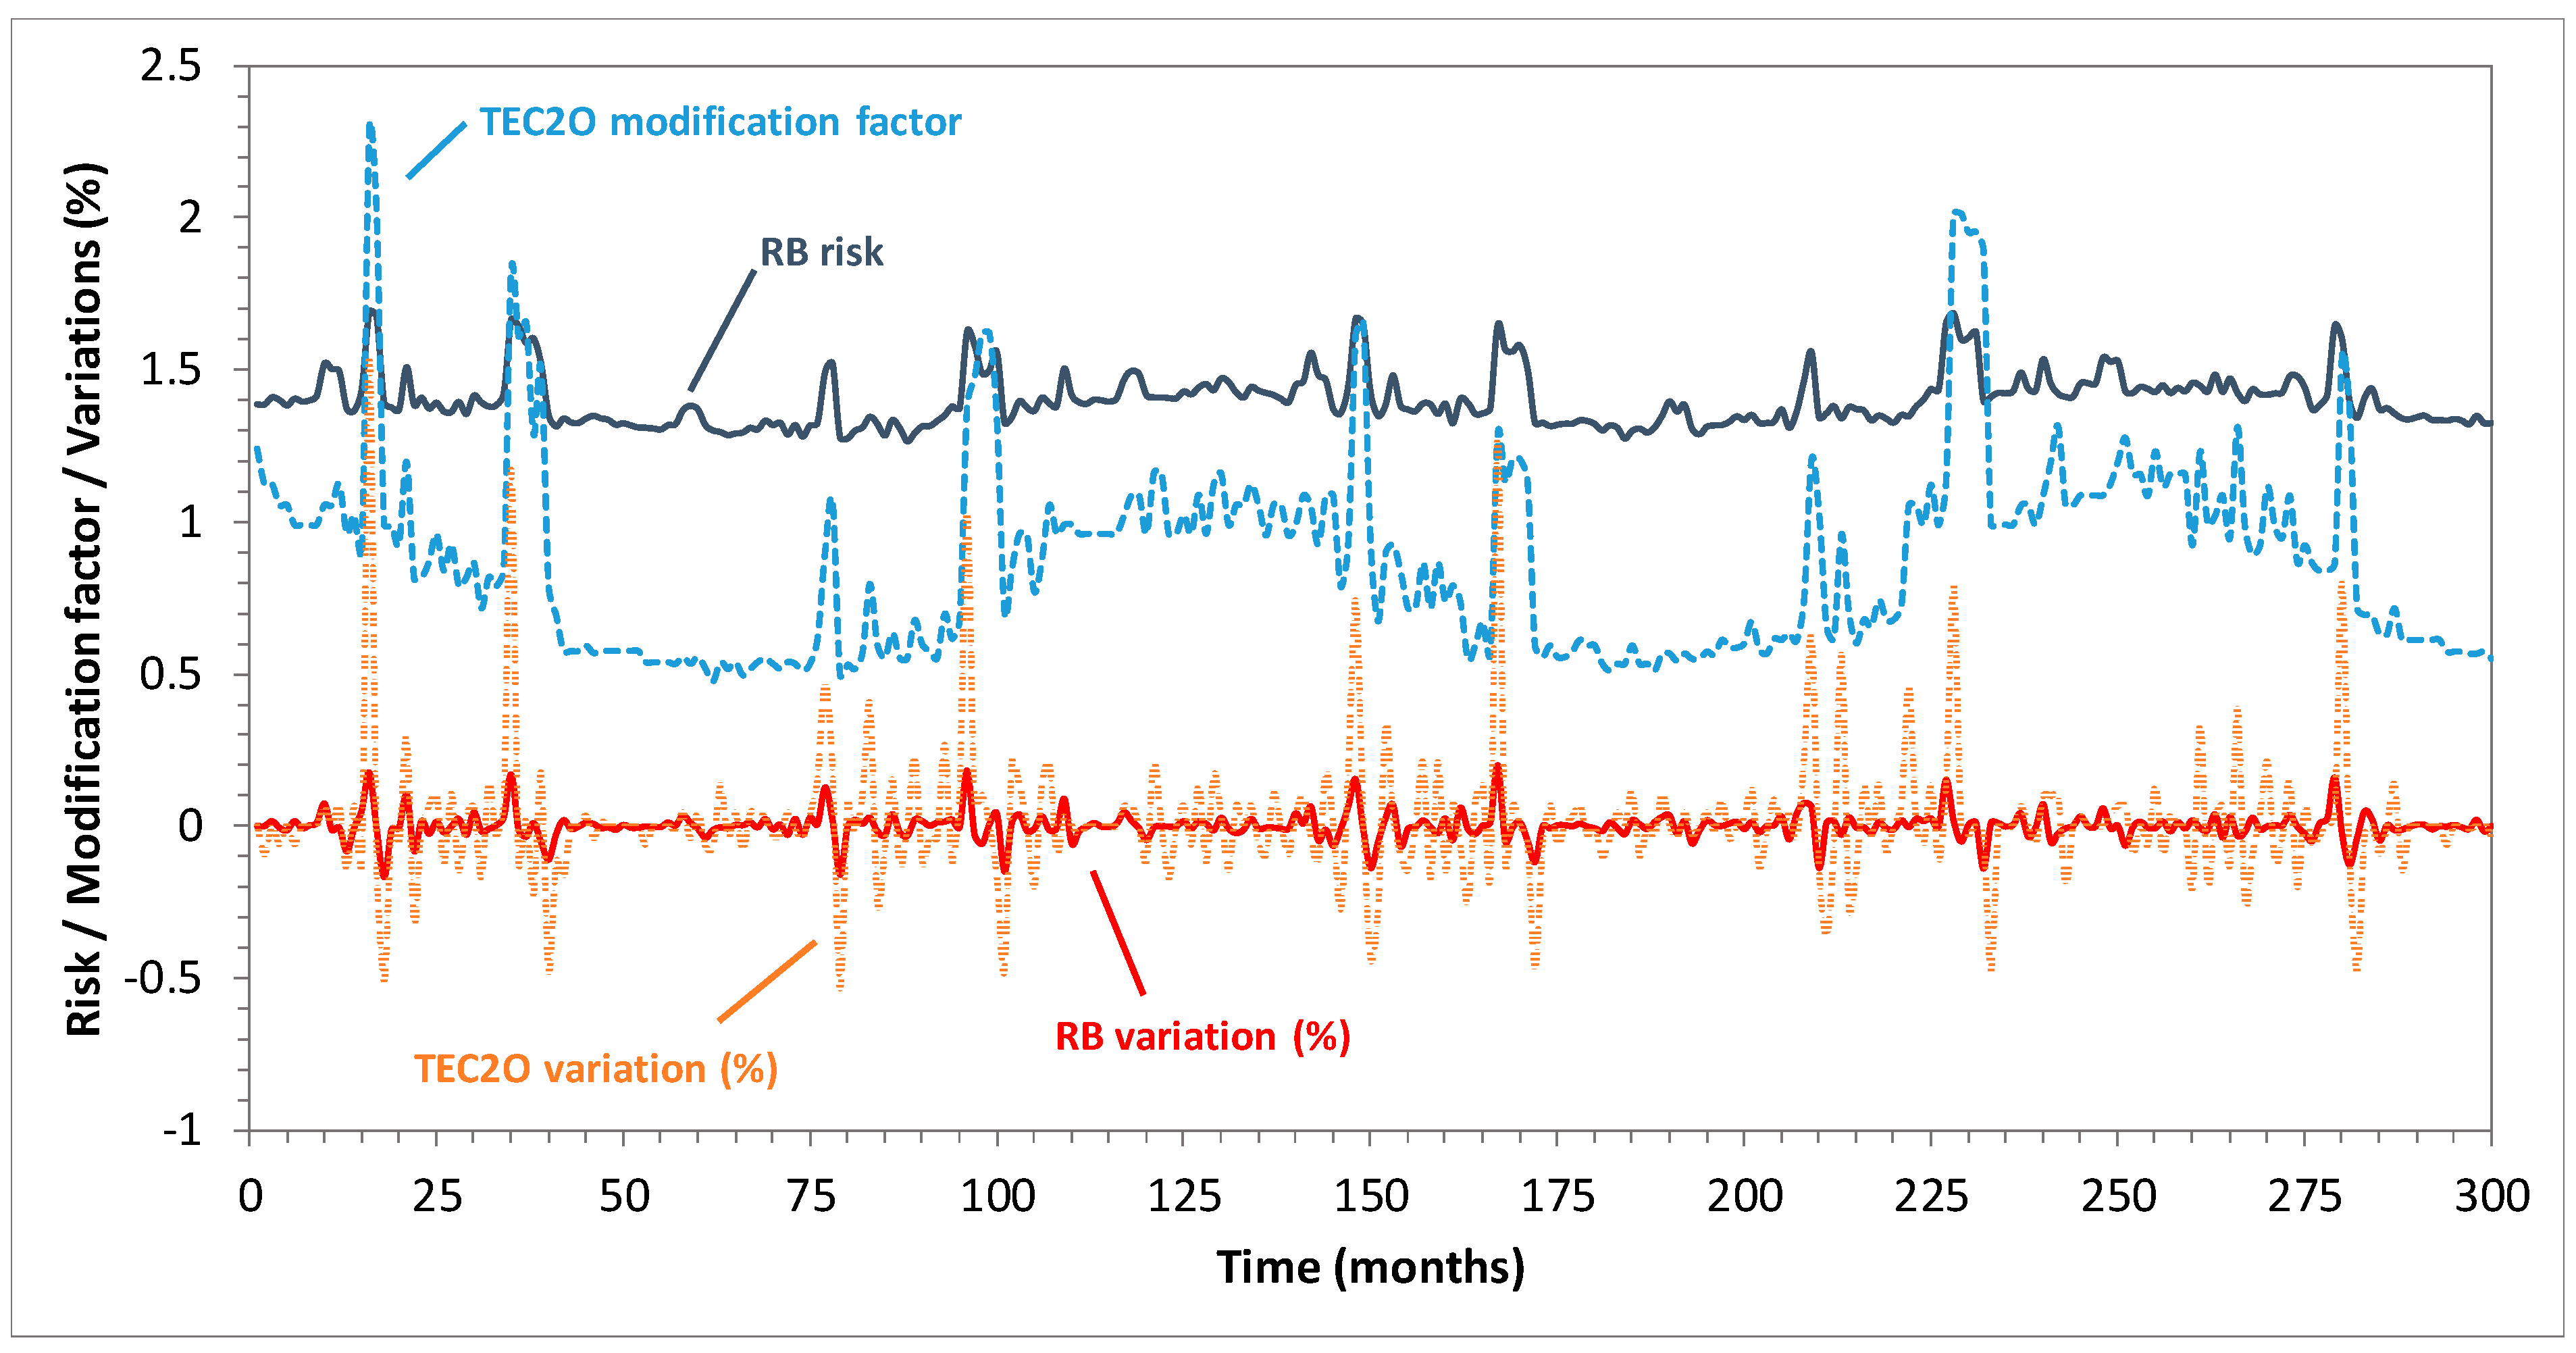
Step 7: Visualization. The total result of the RB application is the trend of the loss of containment risk for 25 years (300 months), as shown in Figure 8, considering the FPSO lifecycle simulation (Section 3.2).

4.2. Reality Check

Several queries were performed in the search and considered different combinations of the following keywords: “Corrosion”, “erosion”, “sand oil”, “hydrocarbon leak”, “hydrocarbon release”, “oil leak”, “oil leakage”, “offshore pipeline”, “oil pipeline”, and “pipeline”. In addition, the results were manually filtered based on their relevance to the case.
While the eMARS database [37] did not provide relevant information, one relevant event was identified from a search on ARIA [38]. The search on MHIDAS [39] generated two relevant reports on corrosion events and two reports on offshore oil releases. However, the results from these databases provided only limited information about the purpose of this work.
The search on Google Scholar [40] revealed further sources of information, such as the following reports on accidents in the petroleum offshore industry:
Doc. 1.
“Riser and pipeline release frequencies” by the International Association of Oil and Gas Producers [72];
Doc. 2.
“Offshore hydrocarbon releases statistics and analysis” by Health and safety Executive [73];
Doc. 3.
“Hydrocarbon leak on Oseberg A on 17 June 2013” by the Norwegian Petroleum Safety Authority [74].
Document 1 reports failure mechanisms and relative occurrence percentages for offshore pipelines. In 36% of the cases analyzed by the document, corrosion is the main failure mechanism. Document 2 does not specifically focus on one type of equipment, such as pipelines. However, the document reports a record of approximately 1600 equipment faults that occurred between 1 October 1992 and 31 March 2002. Almost 20% of the faults were caused by corrosion/erosion. Document 3 by Oseberg A focuses on a gas hydrocarbon leak that occurred on an offshore facility on 17 June 2013. This report indicates that sand production was the direct cause of the accident: “The main reason that the test manifold blown line was able to develop over time and eventually cause a gas leak was that an adequate review of the plant had not been conducted to verify that it could handle sand production”.
This past accident data analysis provides an overview of the sand production issues within the O&G sector. The collected data indicate the criticality of the causes and consequences of erosion/corrosion. These data match the scenario events identified by the RB, which confirm its ability to address major accident hazards. In particular, document 3 highlights the dynamic aspects of the hazardous event and implies that continuous monitoring of risk associated with erosion/corrosion risks is necessary.
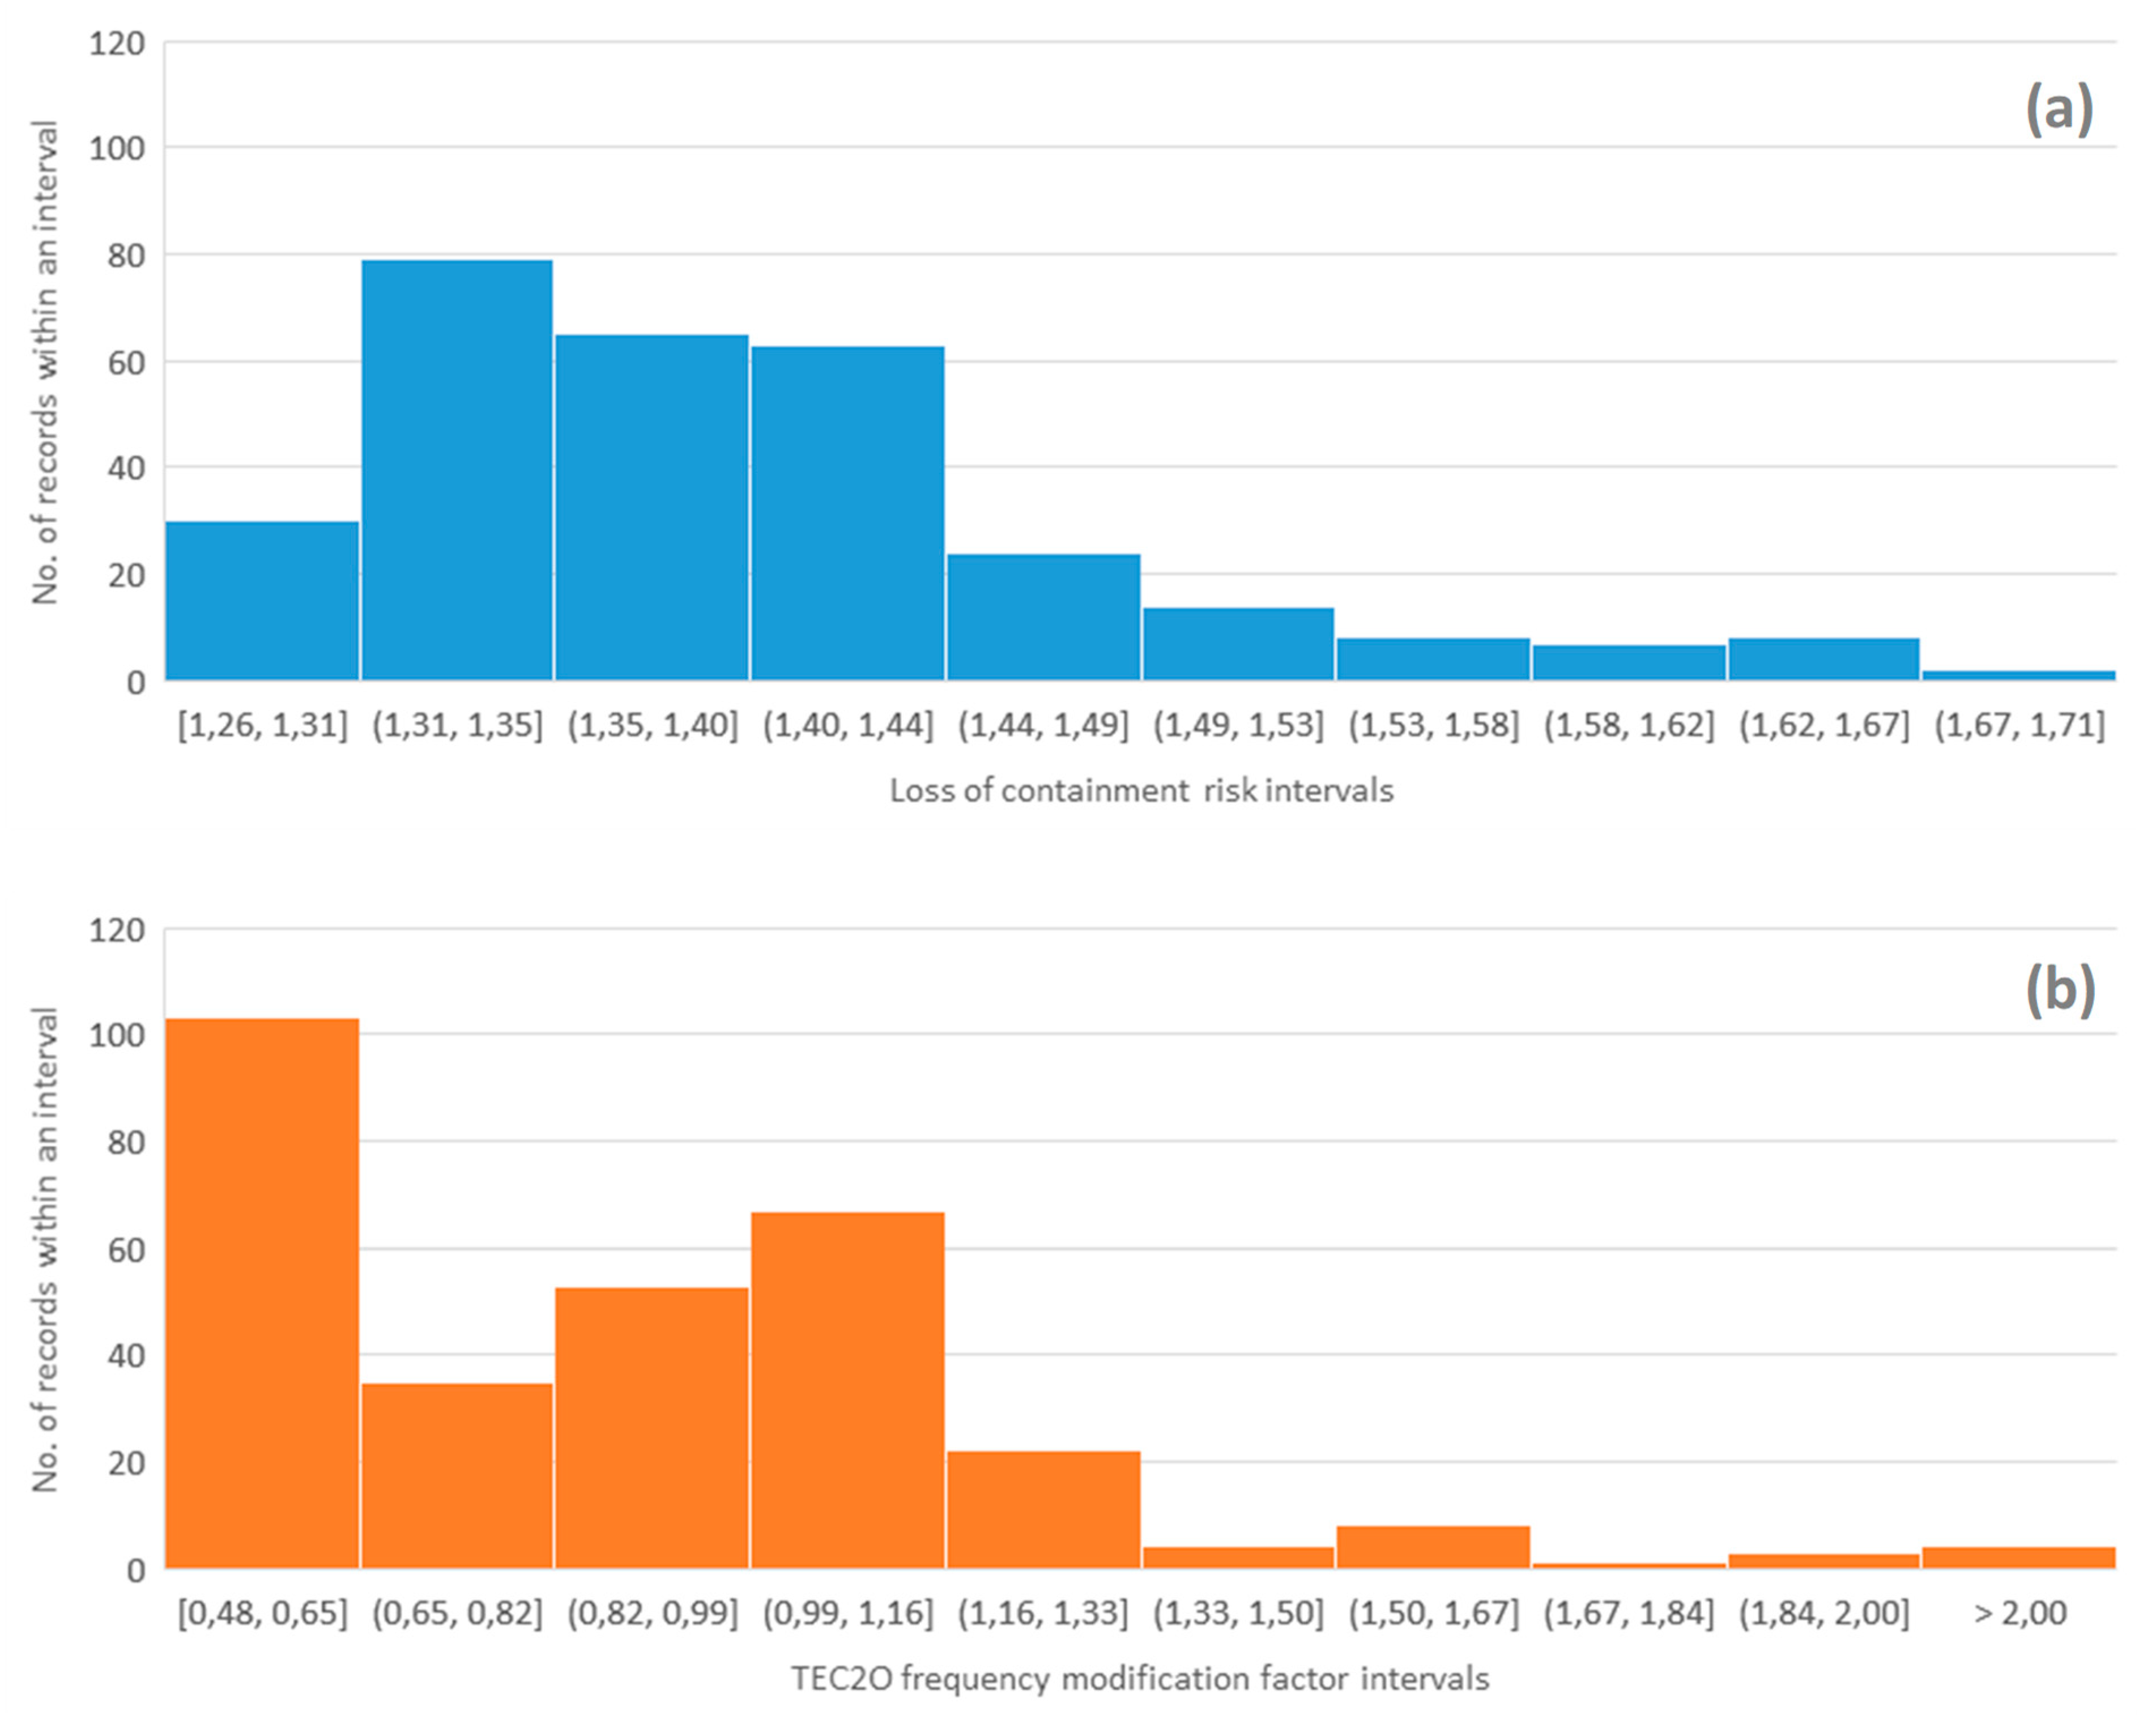
4.3. Benchmark

Despite similar inputs for RB and the parallel method TEC2O, a comparison of their results may not be straightforward. The RB method provides an adimensional value of risk level, while the TEC2O final result is an updated leakage frequency associated with the FPSO riser. For this reason, the adimensional TEC2O frequency modification factor (FMF) was used to represent the method results:
FMF = TMF × MMF
Figure 8 shows the RB risk and TEC2O FMF for a period of 25 years. The results from both methods follow a total common trend, as most of the peaks match. Moreover, both curves have sinusoidal behavior, which is accentuated in TEC2O FMF. This finding reflects the contribution of operational and organizational indicators, which were simulated by sinusoidal curves. The percentage variations in the RB risk and TEC2O FMF confirm the trend conformity. Note that the RB expresses the risk level on a scale from 1 to 6, while TEC2O FMF can range from 10−1 to 104. Considering these ranges, the RB results indicate a more conservative method, as TEC2O FMF eventually produces a negligible variation of the leakage frequency for the FPSO riser.
Considering that the two techniques have processed similar sets of input data, a kurtosis comparison shows how the techniques evaluate changes in controlling loss of containment. A pointed distribution suggests that the control of the loss of containment has a constant performance, as its risk or FMF are not subject to large variations. In this case, the RB kurtosis shows a situation that is less stable than that of TEC2O (Figure 9 and Table 7).
The skewness comparison (Figure 9 and Table 7) shows how the techniques evaluate the performance in the loss of containment control based on similar sets of input data. Positive skewness indicates a positive performance of loss of containment control, as the associated risk or FMF have relatively low values. In this case, the skewness values of both techniques are positive and similar, TEC2O is slightly higher.
Considering that TEC2O presents higher values of both kurtosis and skewness, we can affirm that the technique generally reports a more positive and stable evaluation for the case (despite a few higher peaks in its derivative, Figure 8), which confirms that RB is a more conservative technique that flags higher levels of risk.
For both methods, the selected set of indicators (i.e., main model inputs) will affect the selection of data to collect during the operation on a daily basis. Despite the careful selection of the matching indicators for the RB and TEC2O, the methods have different approaches to the translation of physical parameters (e.g., pipeline thickness and age) and qualitative information (e.g., inspection effectiveness) to the standardized range (1–6). The RB presents the relative changes in the risk level, while TEC2O has greater relevance to the existing QRA results (i.e., last updated leak frequency) as a basis.

4.4. Peer Review

The pivotal elements in Table 2 are considered and critically discussed, assuming the perspective of peer reviewers.
Objectives. Risk acceptance criteria for this case were initially established by the major oil company. However, an external requirement may be compliance with a decreasing trend in historical leak frequency with time for installations on the Norwegian continental shelf after year 2000 [75]. Moreover, changes in practices, procedures, regulations, or emerging risks associated with design modifications (e.g., new technology) may produce alternative criteria. For this reason, assessment of the validity of the acceptance criteria needs to be iterated with a focus on the coherence between the objectives and the application of the RB in practical cases.
Hazards/set of events. Identification of hazards and unwanted events included in the case study was also facilitated and subsequently validated by the company experts. However, changes to the equipment and plant during operations, such as the introduction of new technologies or the collection of previously disregarded risk notions, may require a review for completeness of hazard identification. Techniques such as the methodology for the identification of major accident hazards (MIMAH) [27] may provide generic accident scenarios and establish a basis for peer review. In addition, dynamic procedure of atypical scenarios identification (DyPASI) [28] can be adopted to consider atypical unwanted events.
Safety barriers. The RB model is related to the bowtie diagram defined by the hazard identification phase. This structure is also the result of workshops and follow-up communications with the involved oil company. Further validation may be sought by the Norwegian Petroleum Safety Authority principles for barrier management in the petroleum industry [68].
Model. The accident investigation report of the Macondo blowout accident [76] showed that some barriers had limited ability in performing the desired functions before the catastrophic event. The barrier structure should reflect the relationship between function and systems, which highlights its capabilities and limitations. The model is intentionally revisable to favor expert judgment input, but total coherence is needed. Sets of predefined indicators, such as the REWIs, may be used by peer reviewers for comparative assessment [62]. The weights assigned to the indicators have been considered uniform in this work due to limited feedback from the company, and accurate weighing enables further model refinement. This weighing is possible via AHP, which is valid only if the weight judgment is coherent [71].
Parameter values. Partial sets of risk indicators (input) can negatively affect the model and assessed risk. This work considers only a representative set of indicators and related values. A detailed integration is necessary for industrial applications. For instance, accurate human reliability indicators may be integrated by the SPAR-H (standardized plant analysis risk-human reliability analysis) method to estimate human error probabilities in the petroleum industry [77,78,79].
Risk index. RB enables drill-down capabilities, which indicates that the user can understand the cause of risk changes, which may reside in anomalous barrier performance. RB ensures that guidance given to operational staff and experts across systems pertains to parameters that can be directly controlled. The risk level is expressed by a barometer-type visualization and a trend over time. Results that accurately and proactively reflect critical conditions should not only be indicated by these risk indexes but also support user decision-making. The RB is explicitly designed to easily adapt to the user’s needs [32,80] based on the feedback collected within the involved company.

5. Discussion

5.1. Lessons Learned

This validation study for the RB method has addressed both the challenges that may be encountered in the validation of novel techniques and the issues associated with dynamic risk analysis. The research questions defined in Section 1 were addressed as follows:
Capability of identifying major accident scenarios and safety barriers. This issue highlights the correct identification of the accident scenarios that are subsequently modeled by the method. The reality check performed in this study provides an initial confirmation of the criticality of the scenarios considered by RB due to the similarities with past accidents [38,39]. The failure mechanisms of erosion and corrosion and the sand erosion causality are confirmed by a non-negligible number of minor events [72] with a well-reported accident in 2013 [73]. Moreover, the dynamic aspects of the accident scenarios are highlighted by an accident report, which suggests continuous risk monitoring [74]. The actual peer review for the RB application was performed in collaboration with the major oil company involved in the case study [15]. Company experts provided their feedback in an iterative process to confirm or suggest improvements in the description of the potential accident scenarios and the involved safety barriers. This application is ideal and enables continuous and effective validation. Further validation may be sought in other studies [27] or authority documents [68]. In addition, the method for dynamic hazard identification (DyPASI) [17,28] is a tool to iteratively improve the identification of accident scenarios and related safety barriers to satisfying the peer review requirements.
Suitability for capturing changes in the operations and updating risk. The validation by benchmarks highlighted this aspect of the RB, which is essential for DRA. Both TEC2O and RB aim to provide a dynamic estimation of the likelihood of hazardous materials release (namely, the leak frequency in TEC2O and the loss of containment in RB). However, the differences between TEC2O and RB should be noted. TEC2O focuses on single equipment items, while RB includes important safety barriers in a determined hazardous scenario. TEC2O selects risk indicators, which are gathered from a provisional generic set that is based on specific equipment characteristics. RB focuses on risk indicators that are specific to barriers and aims to provide the risk level variation. For both methods, the selected set of indicators (i.e., main model inputs) affect the selection of data to collect daily during operations. However, the methods have different approaches in the translation of physical parameters (e.g., pipeline thickness and age) and qualitative information (e.g., inspection effectiveness) to a value within the standardized range (1–6). TEC2O has systematic procedures for processing sub factors based on collected data [42], while the RB is based on interpolation functions. Both methods use a weighted sum approach to aggregate information. TEC2O has more relevance to the existing QRA results (i.e., the last updated leak frequency) and pursues a periodic update of the frequency based on both quantitative data and qualitative data collected during the operation or in the design/manufacturing features. However, RB can provide a visualized presentation of the barrier status and risk level, as it is based on a hierarchical structure of safety barriers inspired by the objective tree and bowtie diagram. Concerning the peer review, the collection of actual feedback on the RB model for updating risk was not possible but its design is intentionally revisable to promote and consider expert judgment. A peer review was performed for RB risk visualization, which was iteratively developed based on the needs of the involved major oil company.
Comparison of results with another DRA method. The benchmark showed that the RB results follow a trend that is comparable with the TEC2O FMF, as the peaks match the curves that have a sinusoidal behavior. The measures of kurtosis and skewness from statistics are also applied in the benchmark validation. The RB has a relatively unstable performance if compared with TEC2O, while the skewness values of both techniques are positive and similar. In general, conformity between the results from the RB and TEC2O is observed. However, it has to be noted that RB is considerably more conservative than TEC2O. A conservative approach may be preferable as it enhances prevention. If needed, appropriate weight calibration may attenuate this feature and prevent unnecessary warnings.
Realistic outcomes for industrial application. The RB peer review process for the case study has helped and demonstrated the usefulness of the industrial application as the development of a technique in collaboration with a company enables a continuous review to satisfy the company’s needs. However, the peer review for this application was not complete as it primarily addressed the aspects of hazard identification, safety barrier definition, and the use of risk indexes. In general, discussing this issue addresses the accuracy and cost-usefulness claims expressed by Rae et al. [20]:
-
Are the numbers sufficiently accurate to support decision-making? The benchmark results for this study show that RB has the potential to support and even improve decision-making compared with the TEC2O factors. As mentioned by Weinberg [81], “one of the most powerful methods of science (experimental observations) is inapplicable to the estimation of overall risk.” The reverse is also not true, as perfectly reliable measurement may be invalid if the wrong results are consistently obtained. Thus, a benchmark can rebut but not confirm the accuracy claim. Although the resulting numbers are comparable, they are more accurate in principle despite the application of a reality check, as uncertainty about the produced numbers, dominant scenarios, and relative importance of contributing factors remain [21].
-
Is the safety benefit from the DRA technique measurably better than a traditional QRA? In this case, usefulness is required for tracking the changes in risk over time [20], which is demonstrated by the results. These results confirm the requirements highlighted by Goerlandt et al. [21], which demonstrate how the RB (i) summarizes evidence from different sources via an extensive set of indicators, (ii) aims to facilitate communication among stakeholders with its risk visualization solutions and provide a platform for reflection and discussion, (iii) highlights areas of uncertainty by its drill-down capabilities, where additional information or research is necessary, and (iv) complements operational experience as demonstrated by the quality control of this study.
Sustainable operations across systems. Andersen and Mostue [12] review a series of risk analysis and risk management approaches for the petroleum industry from the perspective of applicability to IO concepts. On a generic level, they confirm that risk analysis methods are mostly used in design and modification projects and not during daily operation. Concerning IO, they show that they are mainly perceived as challenges by the operators. IO are considered to give good opportunities in the follow up of major accident risk for daily operations. However, a specific focus on human and organizational factors is required for a complete risk assessment within the IO framework.
The systematic validation approach in this contribution may have the benefit to build consensus in DRA and lead to confident sharing of evaluated risk levels across O&G virtual clusters. The tool has the potential to facilitate risk-informed collaboration between reservoir management, drilling, production optimization, operation and maintenance, logistics and HSE (health, safety, and environment). This represents a cornerstone to build effective communication practices and collaborative work processes between offshore and onshore organizations. The suggested validation approach explicitly addresses the method capabilities to monitor operations, which indirectly points to the need for monitoring human and organizational factors mentioned.
Overall, DRA validation within the IO framework entails the opportunities of improving DRA techniques and their consultation for daily activities from the perspective of the utilization of cross-system collaboration platforms.

5.2. Future Developments

In the RB, the emphasis is placed on defining and quantifying risk indicators related to the causes of a hazardous event. The set of indicators is linked to operational decisions that are associated with maintenance planning based on both conditions of the components and the deviations made by operators and management. A set of indicators is desired to be valid, or the indicator must measure the most important aspects of the associated barrier systems or performance-influencing factors [15]. In the case of human and organizational factors, the validation can be improved by using real-case data and comparing the outcomes of the method with the results from the human reliability analysis (HRA). This comparison may require a redefinition of the risk indicators set compared with the performance shaping factors (PSF) or adjustment of specific indicators values based on a task analysis for validation. Novel information systems may enable improvement in the reporting of planners, operators, and management, which can facilitate defining case-specific indicators [82] and relating the indicators to a generic HRA human error event for validation. For technical indicators, both the RB and TEC2O factors have the potential for improvement by taking into account the behaviors of the process systems influenced by dynamic operational and environmental conditions. Machine learning [9,69,83] can be qualitatively structured to provide reasoning between risk indicators (e.g., casual factors, incidences, testing result) and the safety barrier performance, and sensitivity analysis can be applied to rank the importance of the indicators.

6. Conclusions

In this work, an advanced approach to support the validation of DRA techniques dedicated to the process industry was illustrated. The validation approach relies on three parallel strategies: (i) Reality check, (ii) benchmark, and (iii) peer review.
The benefits of the suggested approach are the completeness and quality of the evaluation. These benefits are ensured by the application of different kinds of methods, which were previously proposed only for standard risk analysis. The effectiveness was demonstrated by a specific validation study. The RB, which is a novel method developed for DRA in the framework of O&G installations, was analyzed by the application of a case study to address sand erosion integrity in virtual O&G cluster, including an FPSO unit. The results from a past accident analysis confirmed the criticality of erosion/corrosion scenarios, as identified by the RB. Moreover, the dynamic nature of the event, which legitimizes the use of dynamic tools such as RB, was highlighted. The benchmark evaluation showed excellent conformity within the results from the RB and TEC2O factors, which validates the applicability of the RB indicators for the event with a loss of containment. A specific procedure for peer review that involves experts from the industrial domain confirmed the suitability of the RB in actual field applications.
This allows building consensus and trust in DRA techniques, as they represent a concrete solution for the implementation of integrated and safety-supported operations across the geographical, organizational, and disciplinary boundaries of the O&G industrial systems.

Supplementary Materials

The following are available online at https://www.mdpi.com/2071-1050/11/23/6745/s1, Table S1: RB indicators, Table S2: RB indicators.

Author Contributions

Supervision, G.L., G.R. and N.P.; Writing—original draft, S.L. and G.L.; Writing—review & editing, S.L. and N.P.

Funding

This research received no external funding.

Acknowledgments

The authors would like to thank Michele Filippetti, whose work inspired this study.

Conflicts of Interest

The authors declare no conflict of interest.

References

  1. Haugen, S.; Edwin, N.J.; Vinnem, J.E.; Brautaset, O.; Nyheim, O.M.; Zhu, T.; Tuft, V.L. Activity-Based Risk Analysis for Process Plant Operations. 2016. Available online: https://www.icheme.org/media/11793/hazards-26-paper-56-activity-based-risk-analysis-for-process-plant-operations.pdf (accessed on 26 November 2019).
  2. Yang, X.; Haugen, S.; Paltrinieri, N. Clarifying the concept of operational risk assessment in the oil and gas industry. Saf. Sci. 2018, 108, 159–268. [Google Scholar] [CrossRef]
  3. Pasman, H.J.; Rogers, W.J.; Mannan, M.S. Risk assessment: What is it worth? Shall we just do away with it, or can it do a better job? Saf. Sci. 2017, 99, 140–155. [Google Scholar] [CrossRef]
  4. Landucci, G.; Paltrinieri, N. Dynamic evaluation of risk: From safety indicators to proactive techniques. Chem. Eng. Trans. 2016, 53, 169–174. [Google Scholar] [CrossRef]
  5. Øien, K. A framework for the establishment of organizational risk indicators. Reliab. Eng. Syst. Saf. 2001, 74, 147–167. [Google Scholar] [CrossRef]
  6. Sklet, S.; Vinnem, J.E.; Aven, T. Barrier and operational risk analysis of hydrocarbon releases (BORA-Release). Part II: Results from a case study. J. Hazard. Mater. 2006, 137, 692–708. [Google Scholar] [CrossRef]
  7. Aven, T.; Sklet, S.; Vinnem, J.E. Barrier and operational risk analysis of hydrocarbon releases (BORA-Release). Part I. Method description. J. Hazard. Mater. 2006, 137, 681–691. [Google Scholar] [CrossRef]
  8. Gran, B.A.; Bye, R.; Nyheim, O.M.; Okstad, E.H.; Seljelid, J.; Sklet, S.; Vatn, J.; Vinnem, J.E. Evaluation of the Risk OMT model for maintenance work on major offshore process equipment. J. Loss Prev. Process Ind. 2012, 25, 582–593. [Google Scholar] [CrossRef]
  9. Paltrinieri, N.; Comfort, L.; Reniers, G. Learning about risk: Machine learning for risk assessment. Saf. Sci. 2019, 118, 475–486. [Google Scholar] [CrossRef]
  10. Bucelli, M.; Okstad, E.; Paltrinier, N.; Cozzani, V. Advanced methods for risk analysis with integrated perspective. In Proceedings of the Safety and Reliability—Theory and Applications—Proceedings of the 27th European Safety and Reliability Conference, ESREL 2017, Portorož, Slovenia, 18–22 June 2017; pp. 1335–1342. [Google Scholar] [CrossRef]
  11. Bucelli, M.; Paltrinieri, N.; Landucci, G. Integrated risk assessment for oil and gas installations in sensitive areas. Ocean Eng. 2018, 150, 377–390. [Google Scholar] [CrossRef]
  12. Andersen, S.; Mostue, B.A. Risk analysis and risk management approaches applied to the petroleum industry and their applicability to IO concepts. Saf. Sci. 2012, 50, 2010–2019. [Google Scholar] [CrossRef]
  13. Foss, B. Real-time production optimization and reservoir management at the IO center. IFAC Proc. Vol. 2012, 45, 7–12. [Google Scholar] [CrossRef]
  14. Paltrinieri, N.; Hauge, S.; Dionisio, M.; Nelson, W.R. Towards a dynamic risk and barrier assessment in an IO context. In Proceedings of the Safety, Reliability and Risk Analysis: Beyond the Horizon—Proceedings of the European Safety and Reliability Conference, ESREL 2013, Amsterdam, The Netherlands, 29 September–2 October 2013. [Google Scholar]
  15. Hauge, S.; Okstad, E.; Paltrinieri, N.; Edwin, N.; Vatn, J.; Bodsberg, L. Handbook for Monitoring of Barrier Status and Associated Risk in the Operational Phase; SINTEF F27045; Center for Integrated Operations in the Petroleum Industry: Trondheim, Norway, 2015. [Google Scholar]
  16. Villa, V.; Paltrinieri, N.; Khan, F.; Cozzani, V. Towards dynamic risk analysis: A review of the risk assessment approach and its limitations in the chemical process industry. Saf. Sci. 2016, 89, 77–93. [Google Scholar] [CrossRef]
  17. Paltrinieri, N.; Reniers, G. Dynamic risk analysis for Seveso sites. J. Loss Prev. Process Ind. 2017, 49, 111–119. [Google Scholar] [CrossRef]
  18. Sklet, S. Safety barriers: Definition, classification, and performance. J. loss Prev. Process Ind. 2006, 19, 494–506. [Google Scholar] [CrossRef]
  19. Scarponi, G.E.; Paltrinieri, N. Comparison and Complementarity between Reactive and Proactive Approaches. In Dynamic Risk Analysis in the Chemical and Petroleum Industry: Evolution and Interaction with Parallel Disciplines in the Perspective of Industrial Application; Elsevier: Amsterdam, The Netherlands, 2016; ISBN 9780128038239. [Google Scholar] [CrossRef]
  20. Rae, A.; Alexander, R.; McDermid, J. Fixing the cracks in the crystal ball: A maturity model for quantitative risk assessment. Reliab. Eng. Syst. Saf. 2014, 125, 67–81. [Google Scholar] [CrossRef]
  21. Goerlandt, F.; Khakzad, N.; Reniers, G. Validity and validation of safety-related quantitative risk analysis: A review. Saf. Sci. 2017, 99, 127–139. [Google Scholar] [CrossRef]
  22. Kirchsteiger, C. On the use of probabilistic and deterministic methods in risk analysis. J. Loss Prev. Process Ind. 1999, 12, 399–419. [Google Scholar] [CrossRef]
  23. Cumming, R.B. Is Risk Assessment A Science? Risk Anal. 1981, 1, 1–3. [Google Scholar] [CrossRef]
  24. Suokas, J. On the Reliability and Validity of Safety Analysis; Ampere University of Technology: Tampere, Finland, 1985; ISBN 9513823954. [Google Scholar]
  25. Suokas, J.; Rouhiainen, V. Quality control in safety and risk analyses. J. Loss Prev. Process Ind. 1989, 2, 67–77. [Google Scholar] [CrossRef]
  26. Paltrinieri, N.; Landucci, G.; Nelson, W.R.; Hauge, S. Proactive Approaches of Dynamic Risk Assessment Based on Indicators. In Dynamic Risk Analysis in the Chemical and Petroleum Industry: Evolution and Interaction with Parallel Disciplines in the Perspective of Industrial Application; Elsevier: Amsterdam, The Netherlands, 2016; ISBN 9780128038239. [Google Scholar] [CrossRef]
  27. Delvosalle, C.; Fievez, C.; Pipart, A.; Debray, B. ARAMIS project: A comprehensive methodology for the identification of reference accident scenarios in process industries. J. Hazard. Mater. 2006, 130, 200–219. [Google Scholar] [CrossRef]
  28. Paltrinieri, N.; Tugnoli, A.; Buston, J.; Wardman, M.; Cozzani, V. DyPASI methodology: From information retrieval to integration of HAZID process. Chem. Eng. Trans. 2013, 32. [Google Scholar] [CrossRef]
  29. Paltrinieri, N.; Hauge, S.; Nelson, W.R. Dynamic barrier management: A case of sand erosion integrity. In Proceedings of the Safety and Reliability of Complex Engineered Systems—Proceedings of the 25th European Safety and Reliability Conference, ESREL 2015, Zurich, Switzerland, 7–10 September 2015. [Google Scholar]
  30. Nelson, W.R.; Van Scyoc, K. Focus on mission success: Process safety for the Atychiphobist. J. Loss Prev. Process Ind. 2009, 22, 764–768. [Google Scholar] [CrossRef]
  31. IAEA. Assessment of Defence in Depth for Nuclear Power Plants; Safety Reports Series No. 46; IAEA: Vienna, Austria, 2005. [Google Scholar]
  32. Edwin, N.J.; Paltrinieri, N.; Østerlie, T. Risk Metrics and Dynamic Risk Visualization. In Dynamic Risk Analysis in the Chemical and Petroleum Industry; Elsevier: Amsterdam, The Netherlands, 2016; pp. 151–165. [Google Scholar] [CrossRef]
  33. CCPS—Center for Chemical Process Safety. Guidelines for Hevaluation Procedures, 2nd ed.; American Institute of Chemical Engineers—Center of Chemical Process Safety: New York, NY, USA, 1992. [Google Scholar]
  34. Aven, T.; Krohn, B.S. A new perspective on how to understand, assess and manage risk and the unforeseen. Reliab. Eng. Syst. Saf. 2014, 121, 1–10. [Google Scholar] [CrossRef]
  35. Sornette, D. Dragon-Kings, Black Swans and the Prediction of Crises. Int. J. Terraspace Sci. Eng. 2009, 2, 1–18. [Google Scholar]
  36. Paltrinieri, N.; Tugnoli, A.; Buston, J.; Wardman, M.; Cozzani, V. Dynamic Procedure for Atypical Scenarios Identification (DyPASI): A new systematic HAZID tool. J. Loss Prev. Process Ind. 2013, 26, 683–695. [Google Scholar] [CrossRef]
  37. Major Accident Hazards Bureau—MAHB. Emars; MAHB: Brussels, Belgium, 2018. [Google Scholar]
  38. BARPI—Bureau for Analysis of Industrial Risks and Pollutions. Analysis Research and Information on Accidents—ARIA; BARPI: Paris, France, 2018. [Google Scholar]
  39. AEA technology—Major hazards assessment unit. MHIDAS—Major Hazard Incident Data Service; AEA technology: Oxfordshire, UK, 2003. [Google Scholar]
  40. Google LLC Google Scholar. Available online: https://scholar.google.com/ (accessed on 20 December 2018).
  41. NIST/SEMATECH e-Handbook of Statistical Methods. Available online: http://www.itl.nist.gov/div898/handbook/ (accessed on 22 November 2019).
  42. Landucci, G.; Paltrinieri, N. A methodology for frequency tailorization dedicated to the Oil & Gas sector. Process Saf. Environ. Prot. 2016, 104, 123–141. [Google Scholar] [CrossRef]
  43. Landucci, G.; Paltrinieri, N. Proactive monitoring of risk-based indicators: Example of application in the Oil & Gas integrated operations. Inst. Chem. Eng. Symp. Ser. 2018, 163. [Google Scholar]
  44. Paltrinieri, N.; Landucci, G.; Salvo Rossi, P. Real-time data for risk assessment in the offshore oil&gas industry. In Proceedings of the International Conference on Offshore Mechanics and Arctic Engineering—OMAE, Trondheim, Norway, 25–30 June 2017; Volume 3B. [Google Scholar] [CrossRef]
  45. Øien, K.; Massaiu, S.; Tinmannsvik, R.K.; Størseth, F. Development of early warning indicators based on Resilience Engineering. In Proceedings of the 10th International Conference on Probabilistic Safety Assessment and Management 2010, PSAM 2010, Seattle, WA, USA, 7–11 June 2010; Volume 3, pp. 1762–1771. [Google Scholar]
  46. Rosqvist, T.; Tuominen, R. Qualification of Formal Safety Assessment: An exploratory study. Saf. Sci. 2004, 42, 99–120. [Google Scholar] [CrossRef]
  47. Paltrinieri, N.; Dechy, N.; Salzano, E.; Wardman, M.; Cozzani, V. Towards a new approach for the identification of atypical accident scenarios. J. Risk Res. 2013, 16, 337–354. [Google Scholar] [CrossRef]
  48. Hokstad, P.; Øien, K.; Reinertsen, R. Recommendations on the use of expert judgment in safety and reliability engineering studies. Two offshore case studies. Reliab. Eng. Syst. Saf. 1998, 61, 65–76. [Google Scholar] [CrossRef]
  49. Paltrinieri, N.; Hokstad, P. Dynamic risk assessment: Development of a basic structure. In Proceedings of the Safety and Reliability: Methodology and Applications—Proceedings of the European Safety and Reliability Conference, ESREL 2014, Wrocław, Poland, 14–18 September 2014; pp. 1385–1392. [Google Scholar]
  50. Foss, B. Process control in conventional oil and gas fields—Challenges and opportunities. Control Eng. Pract. 2012, 20, 1058–1064. [Google Scholar] [CrossRef]
  51. Yang, X.; Haugen, S. Risk information for operational decision-making in the offshore oil and gas industry. Saf. Sci. 2016, 86, 98–109. [Google Scholar] [CrossRef]
  52. Baraldi, P.; Mangili, F.; Zio, E.; Gola, G.; Nystad, B.H. A hybrid ensemble approach for process parameter estimation in offshore oil platforms. In Uncertainty Modeling in Knowledge Engineering and Decision Making; World Scientific: Singapore, 2012; pp. 1227–1232. [Google Scholar]
  53. Taylor, C.; Sarshar, S.; Larsen, S. How IO leaders can use technology to enhance risk perception and communication. In Proceedings of the SPE Intelligent Energy Conference & Exhibition; Society of Petroleum Engineers, Utrecht, The Netherlands, 1–3 April 2014. [Google Scholar]
  54. White, D.P.; Price-Smith, C.J.; Whaley, K.S.; Keatinge, P. Breaking The Completions Paradigm: Delivering World Class Wells In Deepwater Angola. In Proceedings of the SPE Russian Oil and Gas Technical Conference and Exhibition, Moscow, Russia, 28–30 October 2008. [Google Scholar] [CrossRef]
  55. IO Center Center for Integrated Operations in the Petroleum Industries. Available online: www.iocenter.no (accessed on 25 October 2019).
  56. Øien, K.; Massaiu, S.; Tinmannsvik, R.K. Guideline for Implementing the REWI Method; SINTEF Technology and Society: Trondheim, Norway, 2012. [Google Scholar]
  57. Filippetti, M. Innovative Tools for Dynamic Risk Analysis. Master’s Thesis, University of Bologna, Bologna, Italy, 2014. [Google Scholar]
  58. Department of Energy and Climate Change Well Data Index. Available online: https://www.gov.uk/government/organisations/department-of-energy-climate-change (accessed on 22 November 2019).
  59. Øien, K.; Sklet, S. Metodikk for Utarbeidelse av Organisatoriske Risikoindikatorer; SINTEF: Trondheim, Norway, 2001. [Google Scholar]
  60. Delvosalle, C.; Fiévez, C.; Pipart, A. ARAMIS D1C—Appendix 5 Methodology for the Building of Generic Event Trees (MIMAH); Faculté Polytechnique de Mons, Major Risk Research Centre: Mons, Belgium, 2004. [Google Scholar]
  61. Paltrinieri, N.; Cozzani, V.; Øien, K.; Grøtan, T.O. Prevention of atypical accident scenarios through the use of resilience based early warning indicators. In Proceedings of the Advances in Safety, Reliability and Risk Management—Proceedings of the European Safety and Reliability Conference, ESREL 2011, Troyes, France, 18-22 September 2011. [Google Scholar]
  62. Paltrinieri, N.; Tugnoli, A.; Øien, K.; Cozzani, V. Synergy between DyPASI and well-known safety indicator methodologies in the prevention of atypical accident scenarios. In Proceedings of the 11th International Probabilistic Safety Assessment and Management Conference and the Annual European Safety and Reliability Conference 2012, PSAM11 ESREL 2012, Helsinki, Finland, 25–29 June 2012; Volume 5. [Google Scholar]
  63. Park, J. Investigating a homogeneous culture for operating personnel working in domestic nuclear power plants. Reliab. Eng. Syst. Saf. 2016, 156, 256–265. [Google Scholar] [CrossRef]
  64. Bucelli, M.; Paltrinieri, N.; Landucci, G.; Cozzani, V. Safety barrier management and risk assessment: Integration for safer operations in the Oil & Gas industry. In Proceedings of the Institution of Chemical Engineers Symposium Series, Birmingham, UK, 10–12 May 2017. [Google Scholar]
  65. Paltrinieri, N.; Grøtan, T.O.; Bucelli, M.; Landucci, G. A case of dynamic risk management in the subarctic region. In Proceedings of the Risk, Reliability and Safety: Innovating Theory and Practice—Proceedings of the 26th European Safety and Reliability Conference, ESREL 2016, Glasgow, Scotland, 25–29 September 2016. [Google Scholar]
  66. Paltrinieri, N.; Khan, F.; Cozzani, V. Coupling of advanced techniques for dynamic risk management. J. Risk Res. 2015, 18, 910–930. [Google Scholar] [CrossRef]
  67. Paltrinieri, N.; Scarponi, G.E.; Khan, F.; Hauge, S. Addressing dynamic risk in the petroleum industry by means of innovative analysis solutions. Chem. Eng. Trans. 2014, 36, 451–456. [Google Scholar] [CrossRef]
  68. Petroleum Safety Authority. Principles for Barrier Management in the Petroleum Industry; PSA: Stavanger, Norway, 2013. [Google Scholar]
  69. Scarponi, G.E.; Paltrinieri, N.; Khan, F.; Cozzani, V. Reactive and Proactive Approaches: Tutorials and Example. In Dynamic Risk Analysis in the Chemical and Petroleum Industry: Evolution and Interaction with Parallel Disciplines in the Perspective of Industrial Application; Elsevier: Amsterdam, The Netherlands, 2016; ISBN 9780128038239. [Google Scholar] [CrossRef]
  70. Andersen, H.; Casal, J.; Dandrieux, A.; Debray, B.; De Dianous, V.; Duijm, N.J.; Delvosalle, C.; Fievex, C.; Goossens, L.; Gowland, R.T.; et al. ARAMIS—Accidental Risk Assessment Methodology for Industries in the Context of the SEVESO II Directive; Faculté Polytechnique de Mons, Major Risk Research Centre: Mons, Belgium, 2004. [Google Scholar]
  71. Saaty, T.L. The analytic hierarchy process. Eur. J. Oper. Res. 1990, 48, 9–26. [Google Scholar] [CrossRef]
  72. Association of Oil&Gas Producers. Riser & Pipeline Release Frequencies; Association of Oil&Gas Producers: London, UK, 2010. [Google Scholar]
  73. HSE-Health Safety Executive. Offshore Hydrocarbon Releases Statistics and Analysis; HSE-Health Safety Executive: London, UK, 2002. [Google Scholar]
  74. Petroleum Safety Authority. Hydrocarbon Leak on Oseberg A on 17 June 2013; Petroleum Safety Authority: Stavanger, Norway, 2014. [Google Scholar]
  75. Fossan, I.; Opstad, A.S. Process Leak for Offshore Installations Frequency Assessment Model—PLOFAM; Lloyd’s Register: Bergen, Norway, 2016. [Google Scholar]
  76. Tinmannsvik, R.K.; Albrechtsen, E.; Bråtveit, M.; Carlsen, I.M.; Fylling, I.; Hauge, S.; Haugen, S.; Hynne, H.; Lundteigen, M.A.; Moen, B.E.; et al. Deepwater Horizon-Ulykken: Årsaker, Lærepunkter og for-Bedringstiltak for Norsk Sokkel. [The Deepwater Horizon Accident: Causes, Learning and Recommendations for the Norwegian Continental Shelf]; SINTEF: Trondheim, Norway, 2011. [Google Scholar]
  77. Massaiu, S.; Paltrinieri, N. Human Reliability Analysis: From the Nuclear to the Petroleum Sector. In Dynamic Risk Analysis in the Chemical and Petroleum Industry: Evolution and Interaction with Parallel Disciplines in the Perspective of Industrial Application; Elsevier: Amsterdam, The Netherlands, 2016; ISBN 9780128038239. [Google Scholar] [CrossRef]
  78. Paltrinieri, N.; Massaiu, S.; Matteini, A. Human Reliability Analysis in the Petroleum Industry: Tutorial and Examples. In Dynamic Risk Analysis in the Chemical and Petroleum Industry; Butterworth-Heinemann: Oxford, UK, 2016; pp. 181–192. [Google Scholar] [CrossRef]
  79. Bye, A.; Laumann, K.; Taylor, C.; Rasmussen, M.; Øie, S.; van de Merwe, K.; Øien, K.; Boring, R.; Paltrinieri, N.; Wærø, I. The Petro-HRA Guideline; Institutt for energiteknikk: Kjeller, Norway, 2017. [Google Scholar]
  80. Bucelli, M.; Salvo Rossi, P.; Paltrinieri, N.; Utne, I.B. A system engineering approach to subsea spill risk management. Saf. Sci. 2020, in press. [Google Scholar]
  81. Weinberg, A.M. Reflections on Risk Assessment. Risk Anal. 1981, 1, 5–7. [Google Scholar] [CrossRef]
  82. Paltrinieri, N.; Hauge, S.; Albrechtsen, E. Risk Management Models in an Integrated Operations Context; Transactions of the American Nuclear Society: Chicago, IL, USA, 2013; Volume 109. [Google Scholar]
  83. Khakzad, N.; Yu, H.; Paltrinieri, N.; Khan, F. Reactive Approaches of Probability Update Based on Bayesian Methods. In Dynamic Risk Analysis in the Chemical and Petroleum Industry: Evolution and Interaction with Parallel Disciplines in the Perspective of Industrial Application; Elsevier: Amsterdam, The Netherlands, 2016; pp. 51–61. ISBN 9780128038239. [Google Scholar] [CrossRef]
Figure 1. Flowchart for dynamic risk analysis (DRA) validation.
Sustainability 11 06745 g001
Figure 2. Schematization of the procedure for the application of technical, operational, and organizational factors (TEC2O): (a) Evaluation of technical modification factor technical modification factor (TMF), (b) evaluation of management modification factor management modification factor (MMF). Adapted from [42].
Sustainability 11 06745 g002
Figure 3. Representation of the installation considered for the case study and identification of the reference equipment for the analysis (riser).
Sustainability 11 06745 g003
Figure 4. Bowtie diagram for a case of sand erosion and corrosion in offshore oil production. NSC = necessary and sufficient condition, B = barrier, CE = critical event, and ME = major event [27,60].
Sustainability 11 06745 g004
Figure 5. Objective tree for a case of sand erosion and corrosion in offshore oil production. BF = barrier function, NSC = necessary and sufficient condition, B = barrier.
Sustainability 11 06745 g005
Figure 6. Birnbaum-like measures for the barriers B2 (sand response procedure), B3 (pigging), B4 (inhibitor), and B6 (operational strategy), considering generic FPs from the ARAMIS guidelines (Accidental Risk Assessment Methodology for Industries in the context of the Seveso II directive) [70].
Sustainability 11 06745 g006
Figure 7. Graphical representation of the risk model for the RB. NSC = necessary and sufficient condition, B = barrier, CE = critical event, and ME = major event.
Sustainability 11 06745 g007
Figure 8. Trends of RB loss containment risk (1–6 score), TEC2O adimensional frequency modification factor, and respective percentage variations.
Sustainability 11 06745 g008
Figure 9. (a) Distribution of RB loss of containment risk, and (b) distribution of TEC2O frequency modification factor.
Sustainability 11 06745 g009
Table 1. Aggregation of scaled indicators.
Model LevelAggregation Rule
IndicatorIndicator measure x translated into indicator score s (both for barrier i) via interpolation function S.
s i = S ( x i )
Barrier performanceBarrier performance ( B i ) of barrier i obtained by the weighted sum of the indicator scores.
B i = w i , j · s i , j
Failure ProbabilityBarrier performance B i translated into failure probability F P i via direct proportionality P.
F P i = P ( B i )
Table 2. Pivotal elements for peer review.
ItemObject of ReviewComment
ObjectivesRisk acceptance criteria (e.g., ALARP).Acceptance criteria should match the external requirements (i.e., regulations and standards).
Hazards/scenariosSet of unwanted events.A relative lack of process experience may negatively affect this item [47].
Safety barriersSafety barriers defined for the set of unwanted events.Whether the barrier systems included in the analysis can realize the desired risk reduction should be validated.
ModelBarrier modeling, including risk indicators.Whether the safety barriers are well interpreted by the barrier system, subsystems, and related models should be assessed.
Prior parameter valuesPrior parameter values that are considered in barrier modelingStep formed in a formulated procedure, typically including [48] (1) preparation, (2) elicitation, and (3) calibration.
Risk indexResultsWhether the presentation of the risk level is appropriate for the purpose and provides concrete support to operations that directly control the process should be assessed.
Table 3. Selection of representative items describing the installation technical, operational, and organizational factors.
Technical, Operational and Organizational Items
  • Age of the technical barrier system
  • Amount of overtime worked
  • Average availability of critical safety systems
  • Average no. of exercises completed by operating personnel
  • Average no. of hours of training
  • Average no. of risk issues/cases discussed during weekly management meetings
  • Average no. of safety job analyses performed by operating personnel
  • Fraction of operating procedures that are risk assessed
  • Fraction of serious loss of barriers that are adequately treated
  • Fraction of work processes/procedures verified/tested in simulators
  • Inspection results
  • Loss of technical barrier signal
  • Maximum no. of control and safety functions in bypass
  • No. of alarms that are not acknowledged within 1 min or disabled (without acknowledgment)
  • No. of cases in which a decision to respond is delayed or experts are not alerted
  • No. of cases in which communication among actors is inadequate
  • No. of different persons who facilitate/lead safety job analyses
  • No. of emergency preparedness exercises
  • No. of feedbacks on procedures (tracked in the management system)
  • No. of hours of simulator training for operating personnel
  • No. of internal audits/inspections that address technical safety
  • No. of overrides of safety systems
  • No. of overrides of safety systems extended to next shift
  • No. of outdated procedures
  • No. of red traffic signals in the system for barrier control
  • No. of risk issues communicated to the entire organization
  • No. of times that critical ICT systems fail or are inoperable
  • No. of toolbox meetings
  • No. of violations for authorized entrance of systems
  • No. of visual inspections of real or simulated suspended bypasses
  • No. of years of personnel experience with this system
  • Number of unscheduled maintenance operations on safety systems (including possible maintenance call-backs)
  • Overdue inspections
  • Portion of a company that actively uses the risk register
  • Portion of operating personnel who are informed about risk analyses
  • Portion of operating personnel who receive training
  • Portion of operating personnel who take risk courses
  • Temporary repairs that become permanent and neglected routine
  • Unexpected shutdowns
Table 4. Workshop participants from the major oil company.
ParticipantsMain Responsibilities
Regional risk coordinatorBusiness owner for the risk management tool, including managing users, training, data and the developers. Working on risk team to review regional risks with the line and feed them up through the company annually for chief operating officers to review.
Threats Advisor ManagerManagement of the advisor system.
Threats Advisor System Project Management Office LeadEnsuring compliance with intellectual property and legal including technology project processes, branding, and marketing.
Subsea Integrity EngineerImproving the integrity management system for subsea operations team.
Material EngineerIntegrity management system for subsea operations team.
Table 5. Ranking of safety barriers, which expresses their relative importance within the Risk Barometer (RB) (B3 and B4 are equally ranked third).
RankingBarrier
1B6. Operational strategy
2B2. Sand response procedure
3B3. PiggingB4. Inhibitor
Table 6. Example of the indicator set for the “sand response procedure” barrier.
Barrier ElementIndicatorComment
ASD
  • Age of the technical barrier system.
  • Loss of technical barrier signal in the last three months
ASD is mounted in inhospitable conditions that impede maintenance activities.
Erosion Probes
  • Loss of technical barrier signal in the last three months
  • Overdue inspections
Overdue inspections indicate odd functioning, while signal loss reduces the probe performance.
Manual well-flow sampling
  • No. of feedback on procedures (tracked in the management system)
  • Fraction of operational procedures that have been risk-assessed
  • Average no. of hours of training in the last three months
This barrier requires laboratory equipment and adequate procedures by personnel.
Response to sand detection
  • No. of feedbacks on procedures (tracked in the management system)
  • Fraction of operational procedures that have been risk-assessed
  • Fraction of work processes/procedures verified/tested in simulators
  • Average no. of hours of training in the last three months
  • Portion of operating personnel who receive training in the last three months
  • No. of hours of simulator training for operating personnel each month
This barrier requires compliance to adequate procedure by personnel.
Table 7. Kurtosis and skewness of RB loss of containment risk and TEC2O frequency modification factor distributions.
MethodKurtosisSkewness
Risk Barometer1.4331.235
TEC2O2.3831.298

