Abstract
Strengthening research on urban tourism competitiveness is vital in evaluating the current situation and potential of urban tourism, maintaining the sustainable development of the tourism economy and assisting in the regional macro decision making. In this study, an index system evaluation of urban tourism competitiveness in city agglomerations across the Guanzhong Plain is established by collecting cross-section data from the years 2017 and 2010. The entropy value method is adopted to determine the index weight. Cluster analysis is performed and the spatial-temporal pattern and evolution laws of urban tourism competitiveness among city agglomerations in the Guanzhong Plain are analyzed and the geographic detector utilized to discuss the influencing factors. Results show that the spatial gradient difference of urban tourism competitiveness of agglomerations in the Guanzhong Plain is significant. In 2010, it presented the characteristic of ‘the high and middle levels having a zonal distribution from east to west, and the low level was distributed along the north and south wings’. In 2017, the characteristic of ‘polarization’ became highly prominent, that is, the scope of high-level and low-level cities expanded and the scope of medium-level cities decreased. Urban tourism competitiveness in city agglomerations across the Guanzhong Plain exhibited a trend of ‘strengthening in the east, weakening in the west’. The competitiveness of resources and management shifted aggressively and supporting factors competitiveness underwent a slight change. The urban tourism competitiveness of city agglomerations in the Guanzhong Plain is generally low, while the urban tourism competitiveness of Xi’an had an absolute advantage in city agglomerations of the Guanzhong Plain. According to the cluster analysis results, resources and management competitiveness, supporting factors competitiveness, demand conditions competitiveness, situational conditions competitiveness and urban tourism competitiveness of Xi’an in 2010 and 2017 were all at an extremely high level, which was relatively higher than the index values of other cities in the city agglomerations of the Guanzhong Plain. Tourism resources, service support capacity, infrastructure support capacity, tourism income scale, tourism reception scale and economic development power are the core influencing factors of urban tourism competitiveness among city agglomerations in the Guanzhong Plain. The single factor explanatory power of destination management indicates a downward trend while the single factor explanatory power of the ecological environment condition shows an upward trend. Tourism resources are the leading interactive factor of urban tourism competitiveness, and destination management and ecological environment condition are the most significant indicators for the collaborative effect.
1. Introduction
The Travel & Tourism Competitiveness Report 2019 pointed out that in 2018, the global tourism revenue amounted to the US$892.3 million, accounting for 10.4% of the global GDP and that the speed of industry development increased faster than the average level of global economic development. Meanwhile, China’s tourism competitiveness rose to 13th place in the global ranking [1]. Tourism has been listed as a strategic pillar industry in China [2] and has become an important driving force towards the promotion of the sustainable development of the regional economy and the upgrading of industrial structure. Numerous cities also regard tourism as a new economic growth point for urban development. Urban tourism is an important part of tourism [3], and the national and regional competition for tourism can be realized through urban competition [4]. Strengthening research on urban tourism competitiveness is crucial in evaluating the current situation and potential of urban tourism, optimizing the allocation of tourism resources, maintaining the sustainable development of tourism economy, promoting the upgrade of tourism industrial structure and assisting in regional macro decision making.
Urban tourism competitiveness refers to the ability for sustainable development as reflected by the sales of products by tourism enterprises in the tourism market under the comprehensive function of the quality of the tourism industry itself and the urban tourism environment. This competitiveness is reflected concretely in three levels, including tourism product competitiveness on the surface layer, tourism enterprise competitiveness on the operation layer and competitiveness of tourism production factors on the internal cause layer [5]. The methods for evaluating urban tourism competitiveness include grey relational analysis (GRA), structural equation, analytic hierarchy process (AHP), principal component analysis and entropy value method. Considering that the entropy value method can reflect fully the amount of information contained in the indices, the index weight obtained through calculation has high credibility. Thus, in this study, the entropy value method is used to calculate the weight of the urban tourism competitiveness and the geographical detector is adopted to analyze the dominant factors that affect the spatial and temporal patterns and evolution of urban tourism competitiveness.
In January 2018, The Development Plan for City Agglomerations in the Guanzhong Plain, which was formulated jointly by the National Development and Reform Commission and the Ministry of Housing and Urban-Rural Development, defined clearly the strategic positioning of ‘building the city agglomerations of the Guanzhong Plain as a state-level urban agglomeration with international influence and a new highland of inland reform and opening up’. The plan also emphasized that as the historical birthplace of the Chinese nation and a cultural enrichment region, the Guanzhong Plain should strengthen its regional tourism construction to enable it to transform into a world-class tourist destination [6]. At the same time, city agglomerations of the Guanzhong Plain connecting countries along the Belt and Road Initiative. Therefore, following the national policy, this study chose the city agglomerations of the Guanzhong Plain as the study area and explored the main influencing factors affecting the spatial difference by analyzing the level of development of urban tourism competitiveness of city agglomerations in the Guanzhong Plain. The results of this study could provide a theoretical basis for the formulation of macro decision making towards government departments and the realization of sustainable development towards regional tourism.
This study consists of seven parts. The first part includes the introduction, the second part provides the literature review, the third part contains the general situation of the study area, the fourth part consists of the data sources and research methods, the fifth part provides the results and analysis and the sixth part is the discussion. The seventh part outlines the conclusion.
2. Literature Review
In 1990, American strategic managerialist Michael Porter proposed the Michael Porter diamond model to analyze how a country forms an overall competitive advantage and gain strong international competitiveness [7]. Later, relevant scholars adopted various theories including the tourism system theory [8], tourism area life cycle theory [9,10] and urban tourism theory as reference theories and introduced the competitiveness model into the tourism industry to analyze urban tourism competitiveness.
In the research process, relevant scholars focused on the construction of the competitiveness model and evaluation index system. The most representative models are Crouch–Ritchie model and integrated model. Crouch and Ritchie analyzed the relationship between the tourism industry and social development and posited that the biggest problem faced by tourism industry in the prosperity and development process was how to measure. Hence, they proposed the tourism destination competitiveness model [11]. They constructed the concept model of destination competitiveness from five perspectives, including supporting factors and resources, core resources and attractors, destination policy, planning and development as well as qualifying and amplifying determinants [12]. Dwyer and Kim kept the frame of the Crouch–Ritchie model and improved the shortcomings of the Crouch–Ritchie model, and constructed the integrated model from the perspective of core resources, supporting factors and resources, destination management, demand conditions and situational conditions [13]. Then taking South Korea and Australia as examples, the destination competitiveness of bilateral tourism flows was studied [14]. Aquilino revised the integrated model and added a new determination condition. Through a questionnaire, he evaluated the tourism competitiveness of Italy’s Matera and Basilicata region, and believed that, before 2019 European Capital of Culture, policies should be formulated to maintain the competitiveness of regions and cities both at present and in future [15]. Mazanec believed that tourism demand, overnight tourism growth rate, tourist seasonal distribution and tourist destination carrying capacity were the main factors affecting the European urban tourism competitiveness. Hence, these five indicators were used to evaluate the tourism competitiveness of major European cities and consequently, a spatial distribution map was drawn [16]. Hanafiah et al. explored the influence of natural and cultural resources on regional tourism competitiveness by using the structural equation model [17]. Gooroochurn and Sugiyarto discussed the content covered by the competitiveness and chose eight indicators, including the price, openness, technology, infrastructure, human tourism, social development, environment and human resources, to evaluate and classify the urban tourism competitiveness of 200 countries across the world [18].
The evaluation of urban tourism competitiveness has also been carried out from a more diverse perspective. Tisdell believes that the relationship between tourism and economy, environment and policy is extensive and diverse [19]. Cracolici adopted the form of a questionnaire and took southern Italy as an example to evaluate urban tourism competitiveness from the perspective of tourists’ satisfaction [20]. Das et al. believed that the higher the level of national language classification, the lower the competitiveness of the tourism, and the national economic development level could reduce the difference to a certain extent [21]. Taking Milan, London and other cities as cases, Della Corte et al. discussed the influence of information, communication technology and local management on urban tourism competitiveness [22]. Yin Ping et al. analyzed the effects of the high-speed rail network on the tourism competitiveness of cities around Beijing and believed that the HSR network changed tourists’ travel preferences [23]. Taking Vienna film tourism as an example, Ruiz studied the importance of tourism destination management in improving cultural tourism competitiveness [24].
Subsequently, empirical research on urban tourism competitiveness is increasing rapidly. Enright and Newton used variance analysis and a t-test to compare the tourism competitiveness of Hong Kong, Singapore and Bangkok [25]. Fu Yunxin et al. evaluated the tourism competitiveness of 31 provinces in China from two perspectives, namely, tourism competitiveness and potential and believed that huge differences existed in the tourism competitiveness across various provinces [26]. Ma Caiwei et al. used the principal component analysis method to conclude that the tourism competitiveness of China’s first-tier cities is highly compatible with the spatial distribution of urban tourism attraction [27]. Wang Xia et al. calculated the absolute and relative differences of tourism competitiveness of underprivileged countries across the world and believed that although underprivileged countries were rich in tourism resources, their tourism competitiveness was weak on the whole [28]. Zhou Li et al. studied the spatial differentiation rules of urban tourism competitiveness of 29 cities in the Yangtze River Delta of China and verified them by combining it with the tourism attraction index [29]. Petrović determined that tourist demand is changing gradually towards returning to nature by comparing the rural tourism competitiveness levels of Serbia and Slovenia [30].
Relevant scholars have also studied urban tourism competitiveness among city agglomerations in the Guanzhong Plain from different perspectives. Through qualitative description, Li Shumin et al. compared the tourism competitiveness of Xi’an with cities of the same level such as Beijing and Chengdu [31]. Taking the Terracotta Army, which is the representative tourist attractions of the Guanzhong Plain, and regarding the tourist perception as the measurement basis, Bai Dan et al. evaluated the tourism competitiveness of the scenic spots [32]. Han Rune et al. analyzed the spatial differentiation and evolution rules of the tourism economy in the Guanzhong Plain Economic Zone by using the Theil indices and Herfindahl index [33]. Yan Yan et al. analyzed the development and evolution of tourism in the Guanzhong Plain Economic Zone by calculating the Gini coefficient of cities and believed that cities needed to strengthen tourism cooperation to achieve the goal of improving regional tourism competitiveness [34].
In conclusion, it is still a hot topic to study the characteristics of tourism competitiveness of typical regional cities and evaluate the status quo and potential of sustainable development of urban tourism. However, there are great deficiencies in the study on the urban tourism competitiveness among urban agglomeration in the Guanzhong Plain, both in terms of research depth and scale. First of all, in terms of the selection of research areas, some typical cities or tourist attractions in city agglomerations are mostly studied, but there is no macroscopic comparative study towards the entirety of city agglomerations. Secondly, in terms of research content, more attention is paid to the process of tourism industrial evolution, whilst the evaluation of the urban tourism competitiveness level and identification of main influencing factors have not been paid enough attention to. Finally, the study on time series is in the initial stage, and there is a lack of the latest research results.
To solve these problems, based on the 11 cities of city agglomerations across the Guanzhong Plain as a unit, urban tourism competitiveness evaluation index system is constructed from the perspective resources and management competitiveness, supporting factors competitiveness, demand conditions competitiveness and situational conditions competitiveness, and the entropy value method is used to determine the index weight. Meanwhile, through clustering analysis, the spatial-temporal differentiation pattern and evolution law of urban tourism competitiveness of city agglomerations in the Guanzhong Plain are analyzed. Then the factor detection and interaction detection of the geographical detector are used to carry out quantitative research on the spatial distribution influencing factors for the urban tourism competitiveness, so as to provide reference for the formulation of tourism sustainable development plan towards city agglomerations in the Guanzhong Plain (Figure 1).
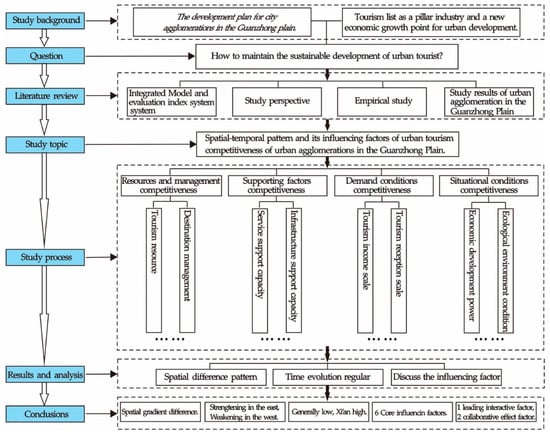
Figure 1.
Main research framework of the study.
3. Study Area
City agglomerations of the Guanzhong Plain mainly include 11 cities, namely Xi’an, Baoji, Xianyang, Tongchuan, Weinan and Shangluo in Shaanxi, Tianshui, Pingliang and Qingyang in Gansu, as well as Yuncheng and Linfen in Shanxi, with a total land area of 107,100 square kilometers, accounting for 1.12% of the total China territory (Figure 2). City agglomerations of the Guanzhong Plain, connecting the countries along the Belt and Road Initiative, are rich in cultural deposits and tourism resources, as there are not only natural landscapes, such as Qinling Mountains and Yellow River, but also historical relics, such as Terracotta Army, Greater Wild Goose Pagoda and Daming Gong Palace, as well as religious and cultural landscapes, such as Famen Temple and Maiji Mountain. The quality of tourism resources here is relatively high. There are 110 national 4A and 5A scenic spots, one world natural cultural heritage site, one world geopark and 85 national intangible cultural heritage sites. Towards the end of 2017, it had received 610 million domestic and foreign tourists, earned 422.48 billion Yuan from domestic tourism, and earned 146.81 million U.S. dollars from foreign exchange. As it is located in the inland centre of China and an important fulcrum of Eurasian land bridge, the traffic location advantage of the study area is remarkable. A ‘米’-shaped traffic network is formed and its centre is Xi’an. The main form of the traffic network includes the high-speed railway network, expressway network and international hub airport, which provide convenient transportation conditions for the development of regional tourism.
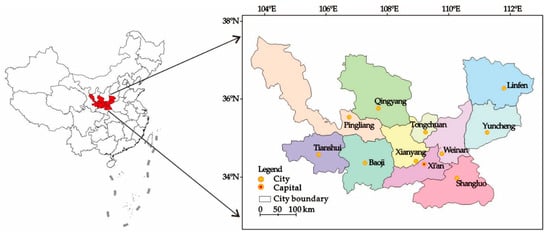
Figure 2.
Location of the study area.
4. Data and Methods
4.1. Data Sources
In this study, the data is mainly from the following resources: China City Statistical Yearbook 2018 [35], China City Statistical Yearbook 2011 [36], China Statistical Yearbook for Regional Economy 2011 [37], Shaanxi Statistical Yearbook 2018 [38], Shaanxi Statistical Yearbook 2011 [39], Shanxi Statistical Yearbook 2018 [40], Shanxi Statistical Yearbook 2011 [41], Qingyang Yearbook 2018 [42], Qingyang Yearbook 2011 [43], Tianshui Yearbook 2018 [44], Pingliang Yearbook 2018 [45], Gansu City Yearbook 2011 [46], etc. Some lacking data comes from the bulletin of national economic and social development in various regions. The data of A-level scenic spots are from the tourism lists published by the Ministry of Culture and Tourism of People’s Republic of China, and the data of other tourism resources origins from the Digital Museum of Intangible Cultural Heritages of China and the World Heritage Network.
The year 2010 is not only the closing year of China’s 11th five-year plan for national economic and social development but also the planning year of the 12th five-year plan. Therefore, the administrative division adjustment of prefecture-level cities amongst city agglomerations in the Guanzhong Plain has been essentially completed. 2017 is the most recent year of obtaining the data released by the National Bureau of Statistics, thus, this paper selects two-time sections of 2010 and 2017 for research.
4.2. Methods
4.2.1. Entropy Evaluation
Information entropy was proposed by Shannon in 1948 to solve the measurement problem of the information amount [47]. This method is one of the main methods of objective weighting, which calculates the utility value of the indicators by evaluating the intrinsic attributes of the indicators. Then determine the weight of the indicators according to the overall influence of the change degree of each indicator on the system, thus reducing the deviation caused by subjective factors. The larger the information entropy value is, the smaller the variation degree of the index value will be, indicating that the system structure is more balanced, and the change is slower. On the contrary, the smaller the information entropy value is, the greater the variation degree of the index value will be, indicating that the system structure is more volatile and changes faster. The weight calculation steps of each index are as follows:
Step 1: normalize Xij, the jth evaluation index of the ith city of urban agglomerations in the Guanzhong Plain:
Step 2: calculate yij, the proportion of the jth evaluation index of the ith city:
Step 3: calculate ej, the entropy of the jth evaluation index:
Step 4: calculate redundancy dj:
Step 5: calculate the index weight of various evaluation indices wj:
Step 6: calculate the comprehensive evaluation score of tourism competitiveness U:
4.2.2. Geographic Detector
The geographic detector is not only a tool to detect the spatial differentiation of geographic things, but also a statistical method to reveal the driving force behind geographic matters [48,49]. Its core idea is that if an independent variable has an important influence on a dependent variable, then the spatial distribution of the independent variable and the dependent variable should be similar. The geographical detector mainly includes factor detection, interaction detection, risk area detection and ecological detection. The biggest advantage of the geographic detector is that it does not have too many assumptions, and its application range is wider, and it has a clear physical meaning. Factor detection and interaction detection of the geographic detector are used to analyze the main influencing factors that lead to the spatial differentiation of urban tourism competitiveness of city agglomerations in the Guanzhong Plain.
(1) Factor detection:
To explore the explanatory power of different indicators on urban tourism competitiveness, its calculation formula is as follows:
where q-statistic is the measurement value of index differentiation, which is used to express the interpretation degree of the independent variable to dependent variable; N is the number of indicators; σ2 is the variance of the index and h = 1…, L, L is the number of categories or partitions. q∈[0,1], the larger the value is, the greater the influence of this indicator on the urban tourism competitiveness will be.
(2) Interaction detection:
The interaction between evaluation indicators, that is, whether the combined action of Cx and Cy will enhance or weaken the explanatory power to urban tourism competitiveness U. The interaction between the two indicators can be divided into the following categories (Table 1).

Table 1.
Types of interactions between the two indicators of the dependent variable.
4.2.3. Index System
In this paper, the integrated model proposed by Kim and Dwyer is used as the theoretical framework and the indicators are selected to evaluate the tourism competitiveness of Guanzhong Plain city agglomerations. As Kim and Dwyer mentioned, there is no set of competitiveness indicators applicable to all destinations, and each indicator must be relevant to the study case [13]. When the integrated model is applied in different regions, there will be a specific situation. Considering that the data used in the study in this paper was mainly from the National Bureau of Statistics, the accessibility of the index data, the consistency of statistical caliber and the operability of the calculation process were analyzed, and then some modifications of the integrated model were carried out. The revised integrated model mainly includes resources and management, supporting factors, demand conditions and situational conditions, and then the corresponding indicators are selected to establish an evaluation index system for the tourism competitiveness of Guanzhong Plain city agglomerations. The system is divided into four levels, namely: one-level index layer (A), which reflects the final evaluation result, such as urban tourism competitiveness; two-level index layer (B) refined urban tourism competitiveness from four aspects, including resources and management competitiveness, supporting factors competitiveness, demand conditions competitiveness and situational conditions competitiveness; three-level index layer (C) is the refinement and decomposition of the second class index layer, including eight-factor indicators and four-level index layer (D) includes 42 specific factors and indicators to evaluate the urban tourism competitiveness of city agglomerations in the Guanzhong Plain (Figure 3).
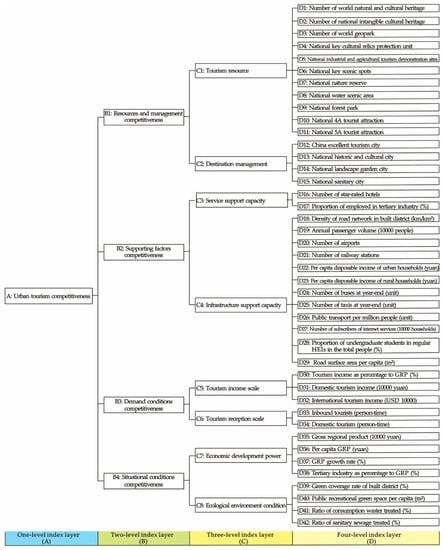
Figure 3.
Evaluation index system of urban tourism competitiveness in city agglomerations across the Guanzhong Plain.
Resources and management mainly include tourism resources and destination management. In the integrated model, tourism resources mainly include inherited resources and created resources. However, the Ministry of Culture and Tourism of the People’s Republic of China did not divide these two types of tourism resources in detail when assessing the level of scenic spots. Therefore, in this paper, a more detailed division of these two types of resources was not carried out in the indicator system construction. Destination management emphasizes to enhance the tourist attraction of cities through marketing, policy, planning and other activities. In this paper, four indicators including ‘China excellent tourism city’, ‘China’s famous historical and cultural city’, ‘national garden city’ and ‘national sanitary city’ were selected as a standard for judging the destination management level, because the four indicators were selected and evaluated by the national related departments according to the unified standards. Therefore, they reflect the management ability of cities in the process of tourism image positioning, publicity and marketing.
Supporting factors are the basis of maintaining the sustainable development of urban tourism, and they mainly include the content in terms of service quality, destination accessibility and market relevance. In this paper, 14 indicators including the number of star-rated hotels, the number of employees in the tertiary industry, the density of highway network, the number of railway stations/airports and the number of Internet users and so on, which are summarized as service support capacity and infrastructure support capacity, were selected to evaluate the supporting factors competitiveness of Guanzhong Plain city agglomerations.
Demand conditions are a relatively subjective evaluation indicator, which reflects the consciousness, perception and preference of tourism demand. From the perspective of tourism reception scale and tourism income scale, this paper collected five indicators, such as tourism income as percentage to GRP, domestic tourism income, international tourism income, number of inbound tourists and number of domestic tourists, and evaluated the demand conditions competitiveness of Guanzhong Plain city agglomerations.
Situational conditions are the external environment that affects the urban tourism competitiveness, and it mainly includes economy, society, policy, environment and other factors. Considering the consistency of statistical caliber, from the perspective of economic development power and ecological environment condition, eight indicators including the GRP growth rate, gross regional product, per capita GRP, tertiary industry as the percentage to GRP, green coverage rate of built district, public recreational green space per capita, ratio of consumption waster treated and ratio of sanitary sewage treated were selected to evaluate the competitiveness of situational conditions.
5. Results and Analysis
The weights of indicators at all levels (Table 2) were determined through Figure 3, and the spatial and temporal evaluation of urban tourism competitiveness, resources and management competitiveness, supporting factors competitiveness, demand conditions competitiveness and situational conditions competitiveness of city agglomerations in the Guanzhong Plain was conducted, respectively. According to the results of cluster analysis, the urban tourism competitiveness, resources and management competitiveness, supporting factors competitiveness, demand conditions competitiveness and situational conditions competitiveness were divided into four levels, namely extremely high, high, medium and low, respectively, and the spatial difference pattern and time evolution were analyzed.
Table 2.
Calculation results of index weights at all levels.
5.1. Spatial Difference Pattern of Urban Tourism Competitiveness
5.1.1. Spatial Difference of Urban Resource and Management Competitiveness
Resource and management competitiveness mainly include tourism resources and destination management, which is the source of tourism attraction. Figure 4 shows that there are significant spatial differences between Guanzhong Plain urban agglomeration resources and management competitiveness, presenting an unbalanced distribution. Xi’an has always been a highly competitive region in resources and management (42.13 in 2010 and 41.31 in 2017). In 2010 (Figure 4a), Baoji (19.31) was the only city with a high level of resource and management competitiveness. The areas with medium-level resources and management show an ‘east–west’ belt distribution in the Guanzhong Plain city agglomerations, including Pingliang (7.55), Tianshui (7.08), Xianyang (4.82), Weinan (4.21), Yuncheng (6.65) and Linfen (4.13). The areas with low-level resource and management competitiveness were distributed in the north and south sides of Guanzhong Plain city agglomerations, including Qingyang (1.60), Tongchuan (0.48) and Shangluo (2.05).
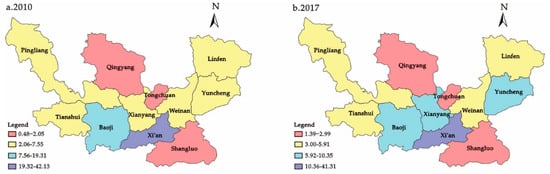
Figure 4.
Spatial difference of resource and management competitiveness in city agglomerations across the Guanzhong Plain. (a) Resource and management competitiveness in 2010; (b) resource and management competitiveness in 2017.
In 2017 (Figure 4b), the resources and management competitiveness of Xianyang (10.00) and Yuncheng (10.04) was improved, ranking with Baoji (10.35) as regions with high-level resources and management. The scope of areas with medium competitiveness in resources and management was reduced, including Pingliang (5.05), Tianshui (5.79), Weinan (5.91) and Linfen (5.62). The low-level areas did not change significantly, and they were still Qingyang (1.39), Tongchuan (1.55) and Shangluo (3.00).
Tourism resources are the most stable and core elements of tourism industry. By strengthening the management level of destinations, resources and management competitiveness can be enhanced. Xianyang, Yuncheng and other cities with medium-level resources and management are superior to Qingyang, Tongchuan and other cities in terms of tourism resources in 2010. By strengthening tourism publicity, reasonably planning tourism routes and introducing tourism service talents, the destination management can be effectively improved, so as to achieve the purpose of improving the competitiveness of resources and management. However, Qingyang, Tongchuan, Shangluo and other cities are short of tourism resources, have single tourism products and it is difficult to combine tourism routes, they are always the areas with low-level resources and management competitiveness among Guanzhong Plain city agglomerations.
5.1.2. Spatial Difference of Supporting Factors Competitiveness
Supporting factor competitiveness mainly includes the service support ability and infrastructure support ability, which reflect the support degree of urban infrastructure, service quality and destination accessibility to urban tourism development. As shown in Figure 5, Xi’an has always been an area with a high supporting factor competitiveness (36.47 in 2010 and 38.08 in 2017), which is because Xi’an is not only the largest city in Guanzhong Plain city agglomerations but also the city with the most complete infrastructure. In 2010 (Figure 5a), the regions with high supporting factor competitiveness include Xianyang (11.08) and Linfen (8.87). The regions with medium supporting factor competitiveness are distributed symmetrically on the east and west sides of Xianyang and Xi’an, including Tianshui (6.48) and Baoji (7.67) in the west, Qingyang (5.78) in the north, Tongchuan (5.42), Weinan (5.86) and Yuncheng (6.79) in the east. The regions with low supporting factor competitiveness include Qingyang (5.78) and Shangluo (2.85).
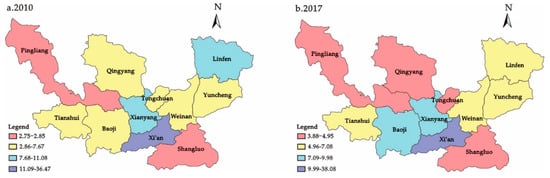
Figure 5.
Spatial difference of supporting factors competitiveness in city agglomerations across the Guanzhong Plain. (a) Supporting factors competitiveness in 2010; (b) supporting factors competitiveness in 2017.
In 2017 (Figure 5b), the regions with high and extremely high-level supporting factor competitiveness formed a high-value core area centering on Xi’an (38.08), Baoji (9.32) and Xianyang (9.98). The areas with low-level supporting factor competitiveness are distributed in the north and south of the high-level areas, including Pingliang (4.09), Qingyang (3.88), Tongchuan (4.95) and Shangluo (4.06). The supporting factor competitiveness of Linfen (5.76) was reduced, and it was listed as a medium-level area together with Yuncheng (7.08), Weinan (6.92) and Tianshui (5.87).
Compared with 2010, in 2017, the supporting factor competitiveness and spatial distribution characteristics of resources and management competitiveness level of varies cities among city agglomerations in Guanzhong Plain were basically consistent (except for Pingliang and Yuncheng), namely, the cities with relatively high supporting factor competitiveness also had a relatively high corresponding resource and management competitiveness level, and for the cities with low-level supporting factor competitiveness, the corresponding resource and management competitiveness level was also relatively low. It indicates the mutual influence among tourism resources, destination management, service support ability and infrastructure support ability promote the appreciation of tourism products. Taking Baoji for example, Baoji has always been a region with high-level resources, and the government gradually pays attention to the destination management, which begins to enhance the promotion of city image, attracts tourists and promotes the investment of a large amount of urban transport such as taxis and buses, increases starred hotels, encourages the development of the tertiary industry, increases the proportion of the tertiary industry practitioners and promotes the improvement of supporting factor competitiveness in Baoji.
5.1.3. Spatial Difference of Demand Conditions Competitiveness
Tourism income scale and tourism reception scale reflect the competitiveness of demand conditions, that is, the greater the comprehensive weight of tourism income scale and tourism reception scale is, the stronger the awareness, perception and preference of tourism demand will be. The smaller the comprehensive weight of tourism income scale and tourism reception scale is, the weaker the tourism demand awareness, perception and preference will be. As shown in Figure 6, Xi’an is an area with extremely high competitiveness of demand conditions (53.90 in 2010 and 50.08 in 2017). In 2010 (Figure 6a), the regions with high competitiveness of demand conditions only included Baoji (10.34), Xianyang (8.37), Weinan (7.55), Yuncheng (8.17) and Linfen (6.50). The region with medium-level competitiveness of demand conditions only included Shangluo (2.50). The regions with low demand competitiveness mainly included Tianshui (1.24), Pingliang (0.59), Qingyang (0.01) and Tongchuan (0.83) in the west of Guanzhong Plain city agglomerations.
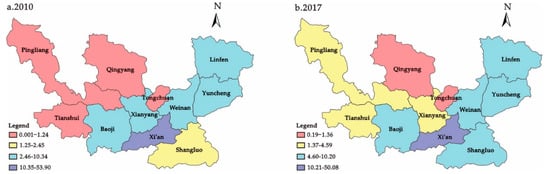
Figure 6.
Spatial difference of demand conditions competitiveness in city agglomerations across the Guanzhong Plain. (a) Demand conditions competitiveness in 2010; (b) demand conditions competitiveness in 2017.
In 2017 (Figure 6b), the demand competitiveness level of Guanzhong Plain city agglomerations was improved on the whole, and 81.81% of the cities had a medium and high demand competitiveness. Among them, the areas with high competitiveness of demand conditions included Baoji (10.20), Shangluo (5.97), Weinan (5.87), Yuncheng (9.26) and Linfen (7.48). Middle-level areas included Tianshui (2.74), Pingliang (2.26) and Xianyang (4.59). The scope of areas with low competitiveness of demand conditions was narrowed, with the four cities in 2010 reduced to two cities, namely Qingyang (0.19) and Tongchuan (1.36).
The areas with high competitiveness of demand conditions always present a ‘cluster-like’ distribution centering on Xi’an, that is, tourists’ awareness, perception and preference of tourism demand were continuously distributed in space. With abundant tourism resources and convenient transportation, Xi’an has always been a ‘peak’ city, which attracts tourists and creates tourism income in Guanzhong Plain city agglomerations. The tourist flow of peak city (Xi’an) and secondary peak cities (Weinan, Baoji, Shangluo, etc.) formed the characteristics of a two-way flow. Mount Hua in Weinan is regarded as the ‘root of China’ and attracts a large number of tourists. Taking Weinan as the node city, it drives some tourists to continue to travel to Yuncheng and Linfen in the east of Weinan for tourism experience.
5.1.4. Spatial Difference of Situational Conditions Competitiveness
Situational condition competitiveness mainly includes economic development strength and ecological environment condition, which generally reflect the impact of urban economic foundation and environmental conditions on the development of tourism industry, so it is an important index to evaluate the sustainable development level of urban tourism. Xi’an was not only the most economically developed city in Guanzhong Plain city agglomerations, but also a region with extremely high situational condition competitiveness (19.86 in 2010 and 27.56 in 2017). In 2010 (Figure 7a), the regions with high-level situational condition competitiveness included five cities: Baoji (11.54), Xianyang (9.97), Tongchuan (9.11), Yuncheng (9.86) and Linfen (9.11); the middle-level areas included Tianshui (6.48), Shangluo (6.81) and Weinan (8.32) and the lower-level areas included Pingliang (5.39) and Qingyang (3.54).
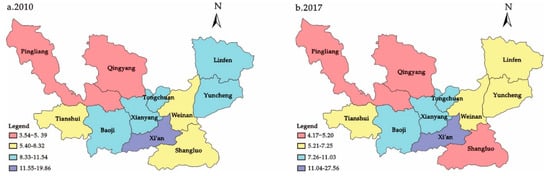
Figure 7.
Spatial difference of situational conditions competitiveness in city agglomerations across the Guanzhong Plain. (a) Situational conditions competitiveness in 2010; (b) situational conditions competitiveness in 2017.
In 2017 (Figure 7b), the scope of areas with high situational condition competitiveness decreased, while the scope of areas with medium and low situational condition competitiveness expanded. The regions with high-level situational condition competitiveness included Baoji (10.85), Xianyang (11.03) and Tongchuan (9.16), the middle-level regions included Tianshui (6.46), Weinan (7.25), Yuncheng (6.79) and Linfen (6.37), and the low-level regions included Pingliang (5.20), Qingyang (4.17) and Shangluo (5.17).
By comparing the spatial difference in situational condition competitiveness between 2010 and 2017, it is found that the situational condition competitiveness level of only Linfen, Yuncheng and Shangluo was changed, and the economic growth was obtained at the cost of destroying the ecological environment, which is the main reason for the decline of the situational condition competitiveness level of these three cities. In 2010, the per capita GDP of Shangluo, Yuncheng and Linfen was 12,209 Yuan, 16,175 Yuan and 20,851 Yuan, respectively. In 2017, the per capita GDP increased to 27,384 Yuan, 34,987 Yuan and 28,904 Yuan, with the per capita GDP growth rates of 124.29%, 116.30% and 38.62%, respectively. In 2010, the per capita green area of Shangluo, Yuncheng and Linfen was 9 m2, 15 m2 and 16 m2. In 2017, the per capita green area was 3.07 m2, 3.99 m2 and 0.46 m2. The per capita green area decreased by −65.89%, −73.40% and −97.12%. Therefore, the influence of situational conditions on urban tourism competitiveness may be positive or negative.
5.1.5. Spatial Difference of Urban Tourism Competitiveness
By carrying out the weighted sum of the evaluation results of resources and management competitiveness, supporting factors competitiveness, demand conditions competitiveness and situational conditions competitiveness of city agglomerations in the Guanzhong Plain, the comprehensive evaluation of urban tourism competitiveness of city agglomerations in the Guanzhong Plain was obtained (Figure 8). The entirety of competitiveness amongst city agglomerations in the Guanzhong Plain was at a low level, and there were significant spatial differences and regional imbalance. Xi’an (38.56 in 2010 and 39.22 in 2017) remains to be a region with extremely high urban tourism competitiveness and possesses absolute competitive advantages. In 2010 (Figure 8a), the region with high urban tourism competitiveness was solely Baoji (13.44), whilst the rest of the areas had medium and low urban tourism competitiveness. Amongst them, the regions with medium urban tourism competitiveness presented a zonal distribution in the city agglomerations of the Guanzhong Plain, including Pingliang (4.88), Tianshui (6.08), Xianyang (7.97), Weinan (5.74), Linfen (6.63) and Yuncheng (7.35). The regions with low urban tourism competitiveness were mainly distributed in the north and south wings of city agglomerations in the Guanzhong Plain, including Shangluo (3.05), Qingyang (2.99) and Tongchuan (3.33).
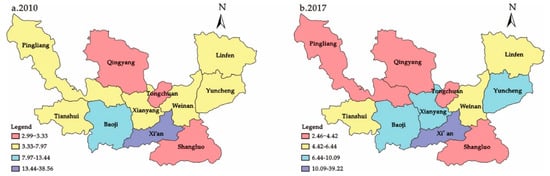
Figure 8.
Spatial difference of urban tourism competitiveness in city agglomerations across the Guanzhong Plain. (a) Urban tourism competitiveness in 2010; (b) urban tourism competitiveness in 2017.
In 2017 (Figure 8b), the urban tourism competitiveness of city agglomerations in the Guanzhong Plain showed a polarization trend, that is, the number of cities with high and low urban tourism competitiveness increased, whilst the number of middle-level cities decreased. The urban tourism competitiveness of Xianyang (9.46) and Yuncheng (8.49) increased and formed a highly competitive region together with Baoji (10.09). The urban tourism competitiveness of Pingliang (4.41) declined and formed a low-level region together with Qingyang (2.46), Tongchuan (3.82) and Shangluo (4.07). The scope of middle-level areas reduced from six cities in 2010 to three cities, namely Tianshui (5.53), Weinan (6.44) and Linfen (6.03).
In 2010, the spatial difference characteristics of urban tourism competitiveness and resources were consistent with that of management competitiveness, while in 2017, the two were significantly different, indicating that the factors influencing the tourism competitiveness of Guanzhong Plain city agglomerations changed in seven years. In 2010, the quality and organizational management level of tourism resources in Guanzhong Plain city agglomerations determined the level of tourism competitiveness. During seven years, the overall tourism development developed rapidly, and the factors affecting urban tourism competitiveness became more diversified. Meanwhile, infrastructure, ecological environment, service level and tourism preference of cities affect urban tourism competitiveness, and the influence degree of the tourism resources and organizational management gradually decreased, but it is still the main factors affecting the urban tourism competitiveness.
5.2. Time Evolution of Urban Tourism Competitiveness
The evaluation index values of city agglomerations across the Guanzhong Plain in 2010 and 2017 were collected to analyze the temporal evolution trend of urban tourism competitiveness from the perspective of resources and management competitiveness, supporting factors competitiveness, demand conditions competitiveness and situational conditions competitiveness.
5.2.1. Temporal Evolution of Resources and Management Competitiveness
Resource and management competitiveness present a trend of ‘increasing in east and decreasing in west’ (Figure 9a), and it was the index with the most drastic fluctuation and change in the secondary index layer. The resources and management competitiveness of Linfen, Yuncheng, Weinan, Shangluo, Tongchuan and Xianyang, which are located in the eastern part of the study area, showed an increasing trend, accounting for 54.54%, and the enhancement trend of Xianyang was the most significant. The resources and management competitiveness of Pingliang, Qingyang, Tianshui, Baoji and Xi’an, located in the western part of the study area, showed a weakening trend, accounting for 45.45%, and the weakening trend of Baoji showed was the most significant. The resource and management competitiveness changed most dramatically in Baoji (−8.96) and most slowly in Qingyang (−0.22).
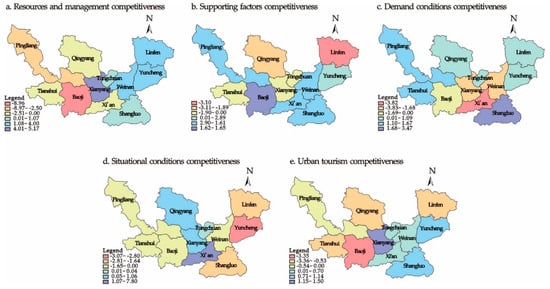
Figure 9.
Time change rate of urban tourism competitiveness in city agglomerations in the Guanzhong Plain.
The change in the quantity and quality of tourist attractions and the improvement of destination image management were the main factors that caused the change of urban resources and management competitiveness. The tourist product quality and destination image management of Tongchuan, Baoji, Weinan, Yuncheng and Linfen were improved in a different degree, for example, in 2010, Xianyang was the China excellent tourist city and national famous historical and cultural city, and in 2017, it was also named ‘China excellent tourism city’, ‘national famous historical and cultural city’, ‘national garden city’ and ‘national sanitary city’ and other titles. It is also the only city that won the honorary title among city agglomerations in Guanzhong Plain. However, the quantity and quality of tourist attractions in Qingyang, Pingliang, Tianshui, Xi’an, Baoji, Shangluo and other cities increased to different degrees, but the destination image did not change, and the resources and management competitiveness showed a downward trend.
5.2.2. Time Evolution of Supporting Factors Competitiveness
The temporal evolution trend of supporting factors competitiveness presented the characteristics of ‘strengthening in a continuous area, weakening in non-continuous area’ (Figure 9b). The cities whose supporting factors competitiveness presented an enhancement trend mainly included Pingliang, Baoji, Xi’an, Weinan, Shangluo and Yuncheng. The administrative boundary of the above seven cities was connected with one another, accounting for 54.54%. Therefore, they formed a zonal enhancement region, and Baoji had the most significant enhancement trend. The cities showing a weakening trend were distributed amongst city agglomerations of the Guanzhong Plain in the form of non-continuous area, mainly including Tianshui, Qingyang, Xianyang, Tongchuan and Linfen, accounting for 36.36%, and Linfen had the most significant weakening trend. Linfen had the highest change trend of supporting factors competitiveness, reaching −3.10, and Baoji held the lowest at 0.29.
From 2010 to 2017, the service level and infrastructure conditions of the research area changed. The number of starred hotels in Xi’an, Baoji, Shangluo and other cities increased, with a growth rate of more than 100%, and the number of starred hotels in Tianshui, Tongchuan, Linfen and other cities gradually decreased, which is because the evaluation standards of starred hotels become gradually strict. The basic conditions of the destination were gradually improved. Taking Internet users as an example, the average growth rate reached over 66.37%. In addition to Qingyang, Tongchuan and Xianyang, the other nine cities have added new railway stations or airports, providing a basic guarantee for the sustainable development of urban tourism.
5.2.3. Temporal Evolution of Demand Conditions Competitiveness
Demand condition competitiveness showed a trend of ‘external enhancement, internal weakening’ (Figure 9c). The demand condition competitiveness of Tianshui, Pingliang, Qingyang, Tongchuan, Linfen, Yuncheng and Shangluo, which are located in the periphery of the study area showed an enhancement trend, accounting for 63.64%, and the enhancement trend of Shangluo was the most obvious. The demand condition competitiveness of Baoji, Xianyang, Weinan and Xi’an, which are located in the study area showed a weakening trend, accounting for 36.36%, and Xi’an showed the most obvious weakening trend. Xi’an had the most significant change in demand condition competitiveness (−3.82), and Baoji had the slowest (−0.15).
Xi’an is a region with extremely high demand condition competitiveness, and it is also the region with the most obvious weakening trend of time evolution. Xi’an is not only the central city of Guanzhong Plain city cluster, but also an important hub city in China. Meanwhile, it has complex urban functions, and bears the functions of the urban economic and cultural centre, causing a great pressure on the development of urban tourism in Xi’an, which is not conducive to the development of historical and cultural tourism resources. Due to the process of urbanization, a large number of cultural relics have been destroyed, and their cultural characteristics have been gradually lost. Besides, traffic jams in Xi’an city lead to more negative comments from tourists. Based on the above reasons, although Xi’an has a large number of tourists (180 million person-times by the end of 2017), tourists’ satisfaction with tourism experience gradually declines, which leads to changes in tourists’ consciousness, perception as well as preference.
5.2.4. Temporal Evolution of Situational Conditions Competitiveness
The situational condition competitiveness showed a variation trend of ‘enhancement in axis parts and weakening in both sides’ (Figure 9d). The situational condition competitiveness of Qingyang, Tongchuan, Xianyang and Xi’an, which are located in the central axis of the study area, showed an enhanced trend, accounting for 36.36%, and Xi’an had the most obvious enhancement trend. The situational condition competitiveness of Pingliang, Tianshui and Baoji on the west side of the central axis of the study area and Linfen, Yuncheng, Weinan and Shangluo on the east side of the central axis showed a weakening trend, accounting for 63.64%, and Yuncheng showed the most obvious weakening trend. Xi’an had the most significant change in the situational condition competitiveness (7.70), and the slowest is Tianshui (−0.03).
The temporal evolution trend of situational conditional competitiveness is correlated with the spatial differentiation characteristics: that is, the regions with high spatial situational competitiveness are the regions with an obvious increasing trend of temporal situational competitiveness. On the other hand, the regions with low situational competitiveness in space are the regions with an obvious weakening trend of situational competitiveness in time. Taking Xi’an and Yuncheng for example: Xi’an is the most economically developed region in the study area, and it is paid much attention to by national policies. By the end of 2017, the GDP income of Xi’an accounted for 65.16% of the total GDP of the study area, and the per capita green area was 31.27 m2, so it was the area with the most significant growth trend of situational competitiveness. Yuncheng is a less economically developed region in the study area. By the end of 2017, its GDP income accounted for 0.26% of the total GDP of the study area, and its per capita green space area was 0.46 m2, so it was the region with the most significant decline in situational competitiveness. Therefore, economic development strength and ecological environment conditions have a magnifying effect on situational competitiveness in both positive and negative directions.
5.2.5. Temporal Evolution of Urban Tourism Competitiveness
The urban tourism competitiveness presented a variation trend of ‘strengthening in the east, weakening in the west’ (Figure 9e). Cities located in the east of the study area with the exception of Linfen, namely, Xianyang, Xi’an, Tongchuan, Weinan, Shangluo and Yuncheng, all showed an increasing trend of urban tourism competitiveness, accounting for 54.55%, and Xianyang increased the most significantly. Linfen as well as Pingliang, Tianshui, Qingyang, Baoji and other cities located in the west showed a declined trend of urban tourism competitiveness, accounting for 45.45%, and Baoji held the most significant decreasing trend. Baoji had the highest shift in urban tourism competitiveness (−3.35), whilst Pingliang had the lowest (−0.46).
The variation trend of urban tourism competitiveness is influenced by the variation trend of resource and management competitiveness, supporting factor competitiveness, demand condition competitiveness as well as situational condition competitiveness. The time evolution of urban tourism competitiveness in Pingliang and Xianyang was mainly affected by tourism resources, destination management, ecological environment conditions, economic development strength and other factors. The time evolution of urban tourism competitiveness in Qingyang and Weinan was mainly influenced by tourism resources, destination management, infrastructure supporting capability, service supporting ability and other factors. The time evolution of urban tourism competitiveness in Xi’an and Linfen was mainly influenced by the infrastructure supporting capacity, service supporting capability, economic development strength, ecological environmental conditions and so on. The time evolution of urban tourism competitiveness of Shangluo and Yuncheng was mainly influenced by tourism resources, destination management, infrastructure supporting capacity, service supporting capacity, tourism income, reception scale, etc. The time evolution of urban tourism competitiveness of Baoji and Tongchuan was mainly affected by tourism resources, destination management, tourism income and reception scale, economic development strength, ecological environmental conditions and so on. The time evolution of urban tourism competitiveness of Tianshui was mainly influenced by tourism resources, destination management, infrastructure supporting capability, service supporting capability, economic development strength, ecological environmental conditions and so on.
On the basis of comprehensive analysis, resources and management competitiveness was the factor with the strongest change trend, ranging from −8.96 to 5.17, and supporting factors competitiveness had the gentlest change trend, ranging from −3.10 to 1.65.
6. Discussion
In recent years, the development of urban tourism has become a new economic growth point for many cities, and maintaining the sustainable development of urban tourism has also become a social concern. Analyzing the development level of tourism competitiveness of typical regional cities is conducive to optimizing the allocation of tourism resources, promoting the upgrading of urban industrial structure, maintaining the sustainable development of urban tourism and making macro decisions for the development of urban tourism. In this study, four second-level indicators, eight third-level indicators and 42 fourth-level indicators were constructed, and the urban tourism competitiveness of 11 cities in city agglomerations of the Guanzhong Plain was quantitatively and objectively evaluated by the entropy method. The results indicated that there was a significant gradient difference in urban tourism competitiveness of city agglomerations in the Guanzhong Plain and the tourism competitiveness of different levels in cities had different characteristics. However, the evaluation of the tourism competitiveness amongst cities failed to simply reflect the results of the competitiveness, but aimed to unravel the deep reasons behind the differences in the urban tourism competitiveness to provide feasible suggestions to realize the sustainable development of intra-regional urban tourism.
Therefore, through factor and interaction detections of geographical detector, this study selected eight index factors of the three-level index layer, including tourism resources (C1), destination management (C2), service support capacity (C3), infrastructure support capacity (C4), tourism income scale (C5), tourism reception scale (C6), economic development power (C7) and ecological environment condition (C8), to discuss the reasons affecting the spatial differentiation of urban tourism competitiveness.
6.1. Influence of a Single Factor on Urban Tourism Competitiveness
Factor detection was used to identify the spatial differentiation of urban tourism competitiveness and quantify the explanatory power of each index to urban tourism competitiveness. The factor interpretation power of the eight indicators was obtained through factor detection (Figure 10) and q-statistic value of all indicators was at a high level. In 2010, the explanatory power behind the indicators of urban tourism competitiveness was as follows from large to small: C5 > C2 > C7 > C6 > C3 > C1 > C4 > C8, with a value of 0.990, 0.987, 0.963, 0.956, 0.953, 0.944, 0.940 and 0.288, respectively. In 2017, the explanatory power of the indicators of urban tourism competitiveness was as follows from large to small: C3 > C4 > C7 > C6 > C1 > C5 = C8 > C2, with a value of 0.988, 0.987, 0.977, 0.972, 0.968, 0.959, 0.959 and 0.584, respectively. Among them, the explanatory power of C2 destination management and C8 ecological environment condition were the two indices that changed significantly.
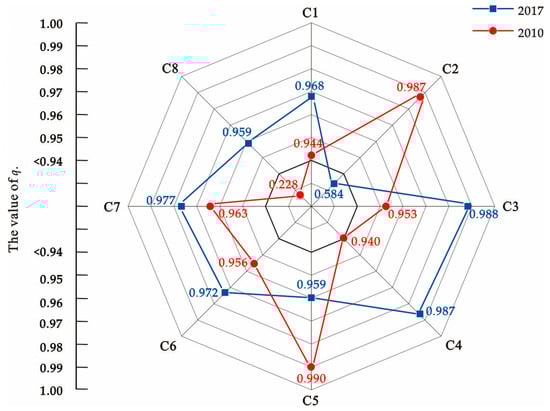
Figure 10.
Influence detection index of urban tourism competitiveness of city agglomerations in the Guanzhong Plain.
The effect of destination management (C2) on urban tourism competitiveness indicated a weakening trend (Figure 10). The q-statistic value decreased from 0.987 in 2010 to 0.584, with a decreasing rate of 40.83%. The positioning and shaping of a city’s image have become the key factors in attracting tourists. On the one hand, under the social background of new media, tourists’ access to information tends to be diversified. From the initial ‘word of mouth’ to the current ‘Internet +’ and multi-media publicity, tourists have more information channels, which help shape their travel choices. On the other hand, various cities focus on shaping the city card, such as ‘Fuxi Emperor hometown’ for Tianshui, ‘Huaxia ancient capital, the city of landscape’ for Xi’an, ‘To see China, visit Baoji.’ for Baoji, etc. The inherent impression of cities was updated constantly, gradually narrowing the polarized gap of city publicity, causing the explanatory power of destination management (C2) to exhibit a weakening tendency. However, it was still one of the most important factors that affect urban tourism competitiveness.
The effect of ecological environment condition (C8) on urban tourism competitiveness presented a sharply increasing trend (Figure 10). The q-statistic value was 0.228 in 2010 and 0.959 in 2017, with an increase rate of 321.11%, and represented the fastest growth rate. Consumers’ motivation preference was one of the reasons for promoting an ecological environment condition. Meanwhile, the rising pressure of modern living and the continued prominence of environmental problems, such as PM2.5, compelled tourists to be more likely to choose destinations with aesthetic ecological environment for tourism experience. Simultaneously, the tourism economy has become a new growth point towards urban development. In addition, with the requirements of ‘striving to build a beautiful China and placing ecological civilization at a prominent position’ proposed by the 18th session of the National Party Congress of the CPC and under the joint drive of economic benefits and policy guidance, administrative departments are more inclined to invest funds to improve the urban ecological environment. From 2010–2017, the growth rate of domestic tourism revenue in Guanzhong city agglomerations reached 354.62%, with an average annual growth rate of 44.33%. The foreign exchange earnings from tourism grew by 120.54%, with an average annual growth rate of 15.07%. The green coverage rate of urban built-up areas increased by 8.28%. The joint efforts of consumers and management departments caused the effects of ecological environment condition on urban tourism competitiveness to strengthen considerably.
Compared with destination management (C2) and ecological environment condition (C8), the effects of tourism resources (C1), service support capacity (C3), infrastructure support capacity (C4), tourism income scale (C5), tourism reception scale (C6) and economic development power (C7) on urban tourism competitiveness remained stable at a high level, with the q-statistic value above 0.940, and presented a slight increase, indicating that the six indices are still the core factors affecting urban tourism competitiveness (Figure 10). Xi’an and Tongchuan are the two cities with the strongest and weakest tourism competitiveness in city agglomerations of the Guanzhong Plain, respectively, which can be attributed to relatively stable factors, such as rich tourism resources, city function positioning and location characteristics. Taking Xi’an for example, the ‘米’-shaped high-speed traffic network connecting the north and the south and running through the west and the east, the historic culture of the ancient capital of 13 dynasties known as the ‘stereo history museum’, the unique natural resources of Taibai Mountain, and the city positioning of building an international metropolis with historical and cultural characteristics represent the absolute advantages of Xi’an in the urban tourism competitiveness of Guanzhong city agglomerations. By contrast, the industrial development of Tongchuan, as a typical resource-based city, entailed obvious path dependence and the second industry accounted for 43.23% of GDP. The city also witnessed a larger resistance in the industry transformation process. Simultaneously, the geographical location in the transition zone of the Guanzhong Basin and Loess Plateau restricted the development of tourism products, and thus, Tongchuan remains a region with relatively weak urban tourism competitiveness among Guanzhong city agglomerations.
6.2. Influence of Factor Interaction on Urban Tourism Competitiveness
Interaction detection was used to identify different indicators and determine whether a collaborative effect exists, that is, whether the increase, decrease or weakening of the explanatory power of urban tourism competitiveness had an effect. Hence, the formation mechanism of urban tourism competitiveness was discussed. The results indicate that the interaction of any two indicators of urban tourism competitiveness of the Guanzhong city agglomerations was characterized by bi-factor enhancement (Table 3). Ultimately, the explanatory power after the interaction of any two indicators increased in varying degrees, indicating that the difference in spatial distribution of urban tourism competitiveness of Guanzhong city agglomerations was determined commonly by a variety of indicators.
Table 3.
Interactive detection of the q-statistic value of urban tourism competitiveness in city agglomerations across the Guanzhong Plain.
Tourism resources (C1) remain the leading interactive index affecting urban tourism competitiveness (Table 3). Following the interaction between tourism resources (C1) and tourism income scale (C5) in 2010, and tourism resource (C1) and infrastructure support capacity (C4) in 2017, the explanatory power reached the maximum value of that particular year and q-statistic value reached 0.999. Tourism resources is the quantification of the quantity and quality of tourism resources, and tourism resources are the premised guarantee for the development of the tourism industry and an important influencing factor for tourists to make tourism decisions. Reasonable development of tourism resources into tourism products and tourist destinations require corresponding planning and design, capital investment and social infrastructure as the basic guarantee. From 2010 to 2017, the tourism traffic conditions in city agglomerations of the Guanzhong Plain saw a remarkable improvement. In 2010, the density of highway network was 0.85 km/km2, with nine railway stations and three airports. Towards the end of 2017, the density of highway network increased to 1.04 km/km2, with 18 railway stations and six airports. The density of the highway network, number of railway stations and number of airports increased by 22.35%, 50% and 50%, respectively. Both the number of scenic spots and the person-time of domestic tourists received increased considerably. The number of high A-level scenic spots (4A and 5A) increased from 89 in 2010 to 110 in 2017, with a growth rate of 23.60%. The person-time of domestic tourists increased from 157 million in 2010 to 607 million in 2017, with an increase of 286.62%. Therefore, under the interactive influence of other indicators, tourism resources had an enhancement influence on urban tourism competitiveness, making it the leading interactive index influencing urban tourism competitiveness.
Destination management (C2) and ecological environment condition (C8) are the most significant indicators of collaborative effect (Table 3). In 2010, the explanatory power of the single-factor index ecological environment condition (C8) was 0.228 and followed the interaction with tourism resources (C1), destination management (C2), service support capacity (C3), infrastructure support capacity (C4), tourism income scale (C5), tourism reception scale (C6) and economic development power (C7). The q-statistic values were 0.990, 0.993, 0.991, 0.998, 0.995, 0.994 and 0.996, respectively, and the explanatory power increased significantly. In 2017, the explanatory power of the single-factor destination management (C2) was 0.584 and the following interaction with other indicators, the explanatory power became greater than 0.990 (q(C1∩C2) = 0.996, q(C2∩C3) = 0.998, q(C2∩C4) = 0.991, q(C2∩C5) = 0.991, q(C2∩C6) = 0.997, q(C2∩C7) = 0.991 and q(C2∩C8) = 0.993). These findings indicate that the effects of destination management and ecological environment condition on urban tourism competitiveness of city agglomerations in the Guanzhong Plain depend on the indicators that interact with them, that is, merely emphasizing environmental construction or image building cannot enhance urban tourism competitiveness effectively. On the contrary, focusing on the cooperative effect of multiple indicators will cause considerable changes in the spatial differentiation characteristics of urban tourism competitiveness. Therefore, when planning regional tourism in city agglomerations of the Guanzhong Plain, the collaborative effects among various factors need to be considered to construct targeted decisions and improve the urban tourism competitiveness and ultimately maintain the sustainable development of urban tourism.
7. Conclusions
By selecting the index, this study built the evaluation index system of urban tourism competitiveness in city agglomerations across the Guanzhong Plain. The entropy value method was used to analyze the spatial-temporal pattern of urban tourism competitiveness of city agglomerations in the Guanzhong Plain. The rooted reason affecting the spatial differentiation of tourism competitiveness was discussed by combining factor detection and interaction detection. The main conclusions are as follows:
A significant gradient difference in the urban tourism competitiveness of city agglomerations in the Guanzhong Plain was observed. In 2010, the urban tourism competitiveness in the study area showed that ‘the high and middle levels had a zonal distribution in the direction from east to west, and the low level was distributed along with the north and south wings’. In 2017, the urban tourism competitiveness in the study area was significantly polarized, that is, the scope of cities in the high and low levels expanded while the scope of cities at the medium level decreased.
The urban tourism competitiveness of city agglomerations in the Guanzhong Plain indicated a spatial-temporal evolution trend of ‘strengthening in the east, weakening in the west’. The urban tourism competitiveness of Xianyang, Xi’an, Tongchuan, Weinan, Shangluo and Yuncheng in the east indicated an increasing trend. Linfen, Pingliang, Tianshui, Qingyang, Baoji and other cities located in the west indicated a declined trend in urban tourism competitiveness. Resources and management competitiveness was the factor with the most intense change in urban tourism competitiveness of city agglomerations in the Guanzhong Plain while supporting factors development competitiveness has the smallest change.
The predominant level of urban tourism competitiveness of city agglomerations in the Guanzhong Plain was low. However, Xi’an held an absolute advantage in city agglomerations across the Guanzhong Plain. In 2017, seven cities in the study area had medium or low urban tourism competitiveness, accounting for 63.64% of the total. In 2010, nine cities in the study area had medium or low urban tourism competitiveness, accounting for 81.82% of the total. However, according to the results of the cluster analysis, the resources and management competitiveness, supporting factors competitiveness, demand conditions competitiveness, situational conditions competitiveness and urban tourism competitiveness of Xi’an in 2010 and 2017 were at an extremely high level and were exceptionally higher than other cities in the city agglomerations of the Guanzhong Plain.
Tourism resources, service support capacity, infrastructure support capacity, tourism income scale, tourism reception scale and economic development power were the core factors affecting the urban tourism competitiveness of city agglomerations in the Guanzhong Plain, with the explanatory power remaining above 0.940. Simultaneously, the explanatory power of single factor destination management showed a downward trend, while the explanatory power of single factor ecological environment condition presented a sharp upward trend.
Tourism resources were the leading interactive factor affecting the urban tourism competitiveness of city agglomerations in the Guanzhong Plain. Once the tourism resources interacted with tourism income scale and infrastructure support capacity, the explanatory power of urban tourism competitiveness soared to 0.999. The collaboration effect of destination management and ecological environment condition was the most significant indicator. Following the interaction with other indicators, the explanatory power improved significantly compared with that of a single factor. In the process of optimizing the allocation of tourism resources and upgrading the industrial structure of city agglomerations across the Guanzhong Plain, macro decisions could be made based on the research conclusions of this study to achieve the improvements in urban tourism competitiveness on the premise of maintaining the sustainable development of urban tourism.
Author Contributions
The individual contributions and responsibilities of all authors are as follows: J.W. proposed and designed research and wrote manuscripts; J.Y. reviewed the logic of the article and putted forward suggestions for revision; Z.L. collected the data; X.W. and T.W. proofread the manuscripts; H.W. provided technical support for the software operation. All authors reviewed and approved the final manuscript.
Funding
This research was supported by the National Natural Science Foundation of China (grant number 41877519)
Conflicts of Interest
The authors declare that they have no conflicts of interest.
References
- Schwab, K. The Travel & Tourism Competitiveness Report 2019; World Economic Forum: Geneva, Switzerland, 2019. [Google Scholar]
- Freya, H.D. Sustainable tourism: Sustaining tourism or something more? Tour. Manag. Perspect. 2018, 25, 157–160. [Google Scholar]
- Xu, Z.; Liu, J.P.; Liang, Y.H. Comparative study on quantitative evaluation for urban tourism competitiveness of Jilin. J. Arid Land Resour. Environ. 2010, 24, 191–196. [Google Scholar]
- Gan, M.Y.; Bao, J.G. Primary study on the urban tourism competitiveness. Mod. Urban Res. 2003, 4, 22–25. [Google Scholar]
- Su, W.Z.; Yang, Y.B.; Gu, C.L. A study on the evaluation of competitive power of urban tourism. Tour. Tribune 2003, 3, 39–42. [Google Scholar]
- National Development and Reform Commission; Ministry of Housing and Urban-Rural Development. The Development Plan for City Agglomerations in the Guanzhong Plain; National Development and Reform Commission & Ministry of Housing and Urban-Rural Development: Beijing, China, 2018.
- Bartlett, C.A. Building and managing the transnational: The new organizational challenge. Compet. Glob. Ind. 1986, 1, 114–146. [Google Scholar]
- Leiper, N. The framework of tourism: Towards a definition of tourism, tourist, and the tourist industry. Ann. Touris. Res. 1979, 6, 390–407. [Google Scholar] [CrossRef]
- Butler, R.W. Tourism Area Life Cycle; Goodfellow Publishers Limited: Oxford, UK, 2006. [Google Scholar]
- Butler, R.W. The concept of a tourist area cycle of evolution: Implications for management of resources. Can. Geogr. 1980, 24, 5–12. [Google Scholar] [CrossRef]
- Crouch, G.I.; Ritchie, J.R.B. Tourism, competitiveness, and societal prosperity. J. Bus. Res. 1999, 44, 137–152. [Google Scholar] [CrossRef]
- Ritchie, J.R.B.; Crouch, G.I. The Competitive Destination: A Sustainable Tourism Perspective; CABA Publishing: London, UK, 2003; p. 63. [Google Scholar]
- Dwyer, L.; Kim, C. Destination competitiveness: Determinants and indicators. Curr. Issues Tour. 2003, 6, 369–414. [Google Scholar] [CrossRef]
- Kim, C.; Dwyer, L. Destination competitiveness and bilateral tourism flows between Australia and Korea. J. Tour. Stud. 2004, 14, 55–67. [Google Scholar]
- Aquilino, L.; Armenski, T.; Wise, N. Assessing the competitiveness of Matera and the Basilicata Region (Italy) ahead of the 2019 European Capital of Culture. Tour. Hosp. Res. 2018, 19, 503–517. [Google Scholar] [CrossRef]
- Mazanec, J.A. Competition among European tourist cities: A comparative analysis with multidimensional scaling and self-organizing maps. Tour. Econ. 1995, 1, 283–302. [Google Scholar] [CrossRef]
- Hanafiah, M.H.; Hemdi, M.A.; Ahmad, I. The influence of tourism core resources on travel and the tourism competitiveness index and tourism performance; Springer: Berlin, Germany, 2017; pp. 377–384. [Google Scholar]
- Gooroochurn, N.; Sugiyarto, G. Competitiveness indicators in the travel and tourism industry. Tour. Econ. 2005, 11, 25–43. [Google Scholar] [CrossRef]
- Tisdell, C.A. Tourism Economics, the Environment and Development: Analysis and Policy; Edward Elgar: Cheltenham, UK, 2001. [Google Scholar]
- Cracolici, M.F.; Nijkamp, P. The attractiveness and competitiveness of tourist destinations: A study of southern Italian regions. Tour. Manag. 2009, 30, 336–344. [Google Scholar] [CrossRef]
- Das, J.; Dirienzo, C.E. Tourism competitiveness and the role of fractionalization. Int. J. Tour. Res. 2012, 14, 285–297. [Google Scholar] [CrossRef]
- Della, V.; Andrea, C.; Savastano, I.; Zamparelli, P. Smart cities and destination management: Impacts and opportunities for tourism competitiveness. Eur. J. Tour. Res. 2017, 17, 7–27. [Google Scholar]
- Yin, P.; Pagliara, F.; Wilson, A. How does high-speed rail affect tourism? A case study of the capital region of China. Sustainability 2019, 11, 472. [Google Scholar] [CrossRef]
- Flores-Ruiz, D. Film tourism and local economic development. The festival of cinema of Huelva. Cuad. Tur. 2015, 36, 175–196. [Google Scholar] [CrossRef]
- Enright, M.J.; Newton, J. Determinants of tourism destination competitiveness in Asia Pacific: Comprehensiveness and universality. J. Travel Res. 2005, 43, 339–350. [Google Scholar] [CrossRef]
- Fu, Y.X.; Hu, B.; Wang, Y. Research on spatial-temporal evolution of tourism competitiveness in 31 provinces of China. Econ. Geogr. 2012, 32, 144–149. [Google Scholar]
- Ma, C.W.; Norman, A. Empirical analysis and spatial differentiation of tourism competitiveness in China’s first tier cities. Southeast. Acad. Res. 2016, 5, 155–162. [Google Scholar]
- Wang, X.; Liu, D.L.; Shen, L.Z.; He, J.; Sun, X. Time variation and influencing factors of tourism competitiveness in global poverty-stricken countries. Resour. Sci. 2018, 40, 369–380. [Google Scholar]
- Zhou, L.; Jiang, J.L. Comprehensive evaluation of urban tourism competitiveness in the Yangtze River delta and its spatial patterns analysis. Econ. Geogr. 2015, 35, 173–179. [Google Scholar]
- Petrović, M.D.; Vujko, A.; Gajić, T. Tourism as an approach to sustainable rural development in post-socialist countries: A Comparative study of Serbia and Slovenia. Sustainability 2018, 10, 54. [Google Scholar] [CrossRef]
- Li, S.M.; Chen, S.; Shao, J.P. The study on comparison of competitive power of city tourism in Xi’an. J. Northwest Univ. Philos. Soc. Sci. Ed. 2002, 4, 103–106. [Google Scholar]
- Bai, D.; Ma, Y.F.; Liu, J.S. Evaluation of the tourists’ perception to the world heritage tourism destination based on grounded theory. J. Arid Land Resour. Environ. 2016, 30, 198–203. [Google Scholar]
- Han, R.E.; Zhao, F. Analysis on spatial differential evolution of tourism economy in Guanzhong-Tianshui economic zone. Resour. Dev. Mark. 2015, 31, 509–512. [Google Scholar]
- Yan, Y.; Wei, H. The tourism economic disparity of Guanzhong-Tianshui economic zone based on temporal and spatial characters. J. Northwest Univ. Nat. Sci. Ed. 2012, 42, 505–508. [Google Scholar]
- Chen, X.L. China City Statistical Yearbook 2018; China Statistics Press: Beijing, China, 2019.
- Chen, X.L. China City Statistical Yearbook 2011; China Statistics Press: Beijing, China, 2011.
- Sheng, K.Y.; Ye, Z.C. China Statistical Yearbook for Regional Economy 2011; China Statistics Press: Beijing, China, 2012.
- Zhang, Y. Shaanxi Statistical Yearbook 2018; China Statistics Press: Beijing, China, 2018.
- Zhang, X.G. Shaanxi Statistical Yearbook 2011; China Statistics Press: Beijing, China, 2011.
- Wei, Y.J. Shanxi Statistical Yearbook 2018; China Statistics Press: Beijing, China, 2018.
- Lu, J.M. Shanxi Statistical Yearbook 2011; China Statistics Press: Beijing, China, 2011.
- Gao, Q. Qingyang Yearbook 2018; China Statistics Press: Beijing, China, 2018.
- Gao, Q. Qingyang Yearbook 2011; China Statistics Press: Beijing, China, 2011.
- Li, K.Y. Tianshui Yearbook 2018; Chinese Cultural and Historical Press: Beijing, China, 2018. [Google Scholar]
- Mao, C.X. Pingliang Yearbook 2018; Zhongzhou Ancient Books Publishing House: Zhengzhou, China, 2018. [Google Scholar]
- Xian, L.Q. Gansu City Yearbook 2011; China Statistics Press: Beijing, China, 2012.
- Shannon, C.E. A mathematical theory of communication. Bell Syst. Tech. J. 1948, 27, 379–423. [Google Scholar] [CrossRef]
- Wang, J.F.; Zhang, T.L.; Fu, B.J. A measure of spatial stratified heterogeneity. Ecol. Indic. 2016, 67, 250–256. [Google Scholar] [CrossRef]
- Wang, J.F.; Xu, C.D. Geodetector: Principle and prospective. Acta Geogr. Sci. 2017, 72, 116–134. [Google Scholar]
© 2019 by the authors. Licensee MDPI, Basel, Switzerland. This article is an open access article distributed under the terms and conditions of the Creative Commons Attribution (CC BY) license (http://creativecommons.org/licenses/by/4.0/).