Search for Measure of the Value of Baltic Sustainability Development: A Meta-Review


Abstract
1. Introduction
2. Literature Review
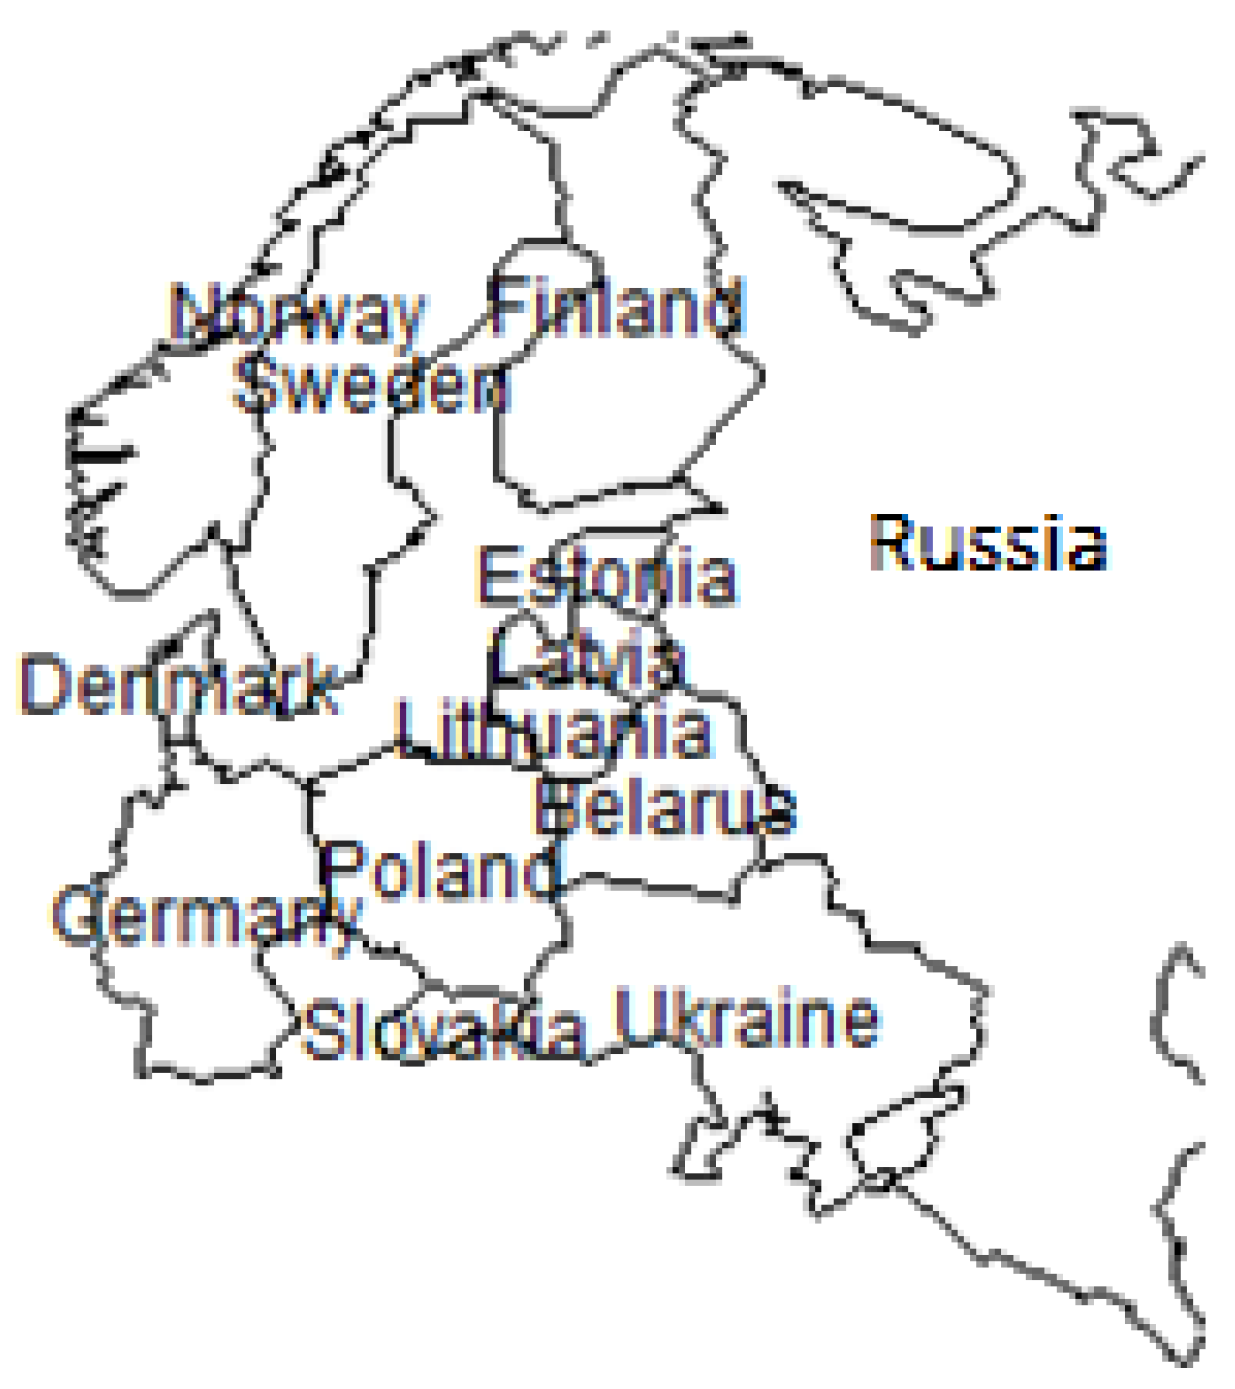
3. Outline of the Test Method
4. Dataset
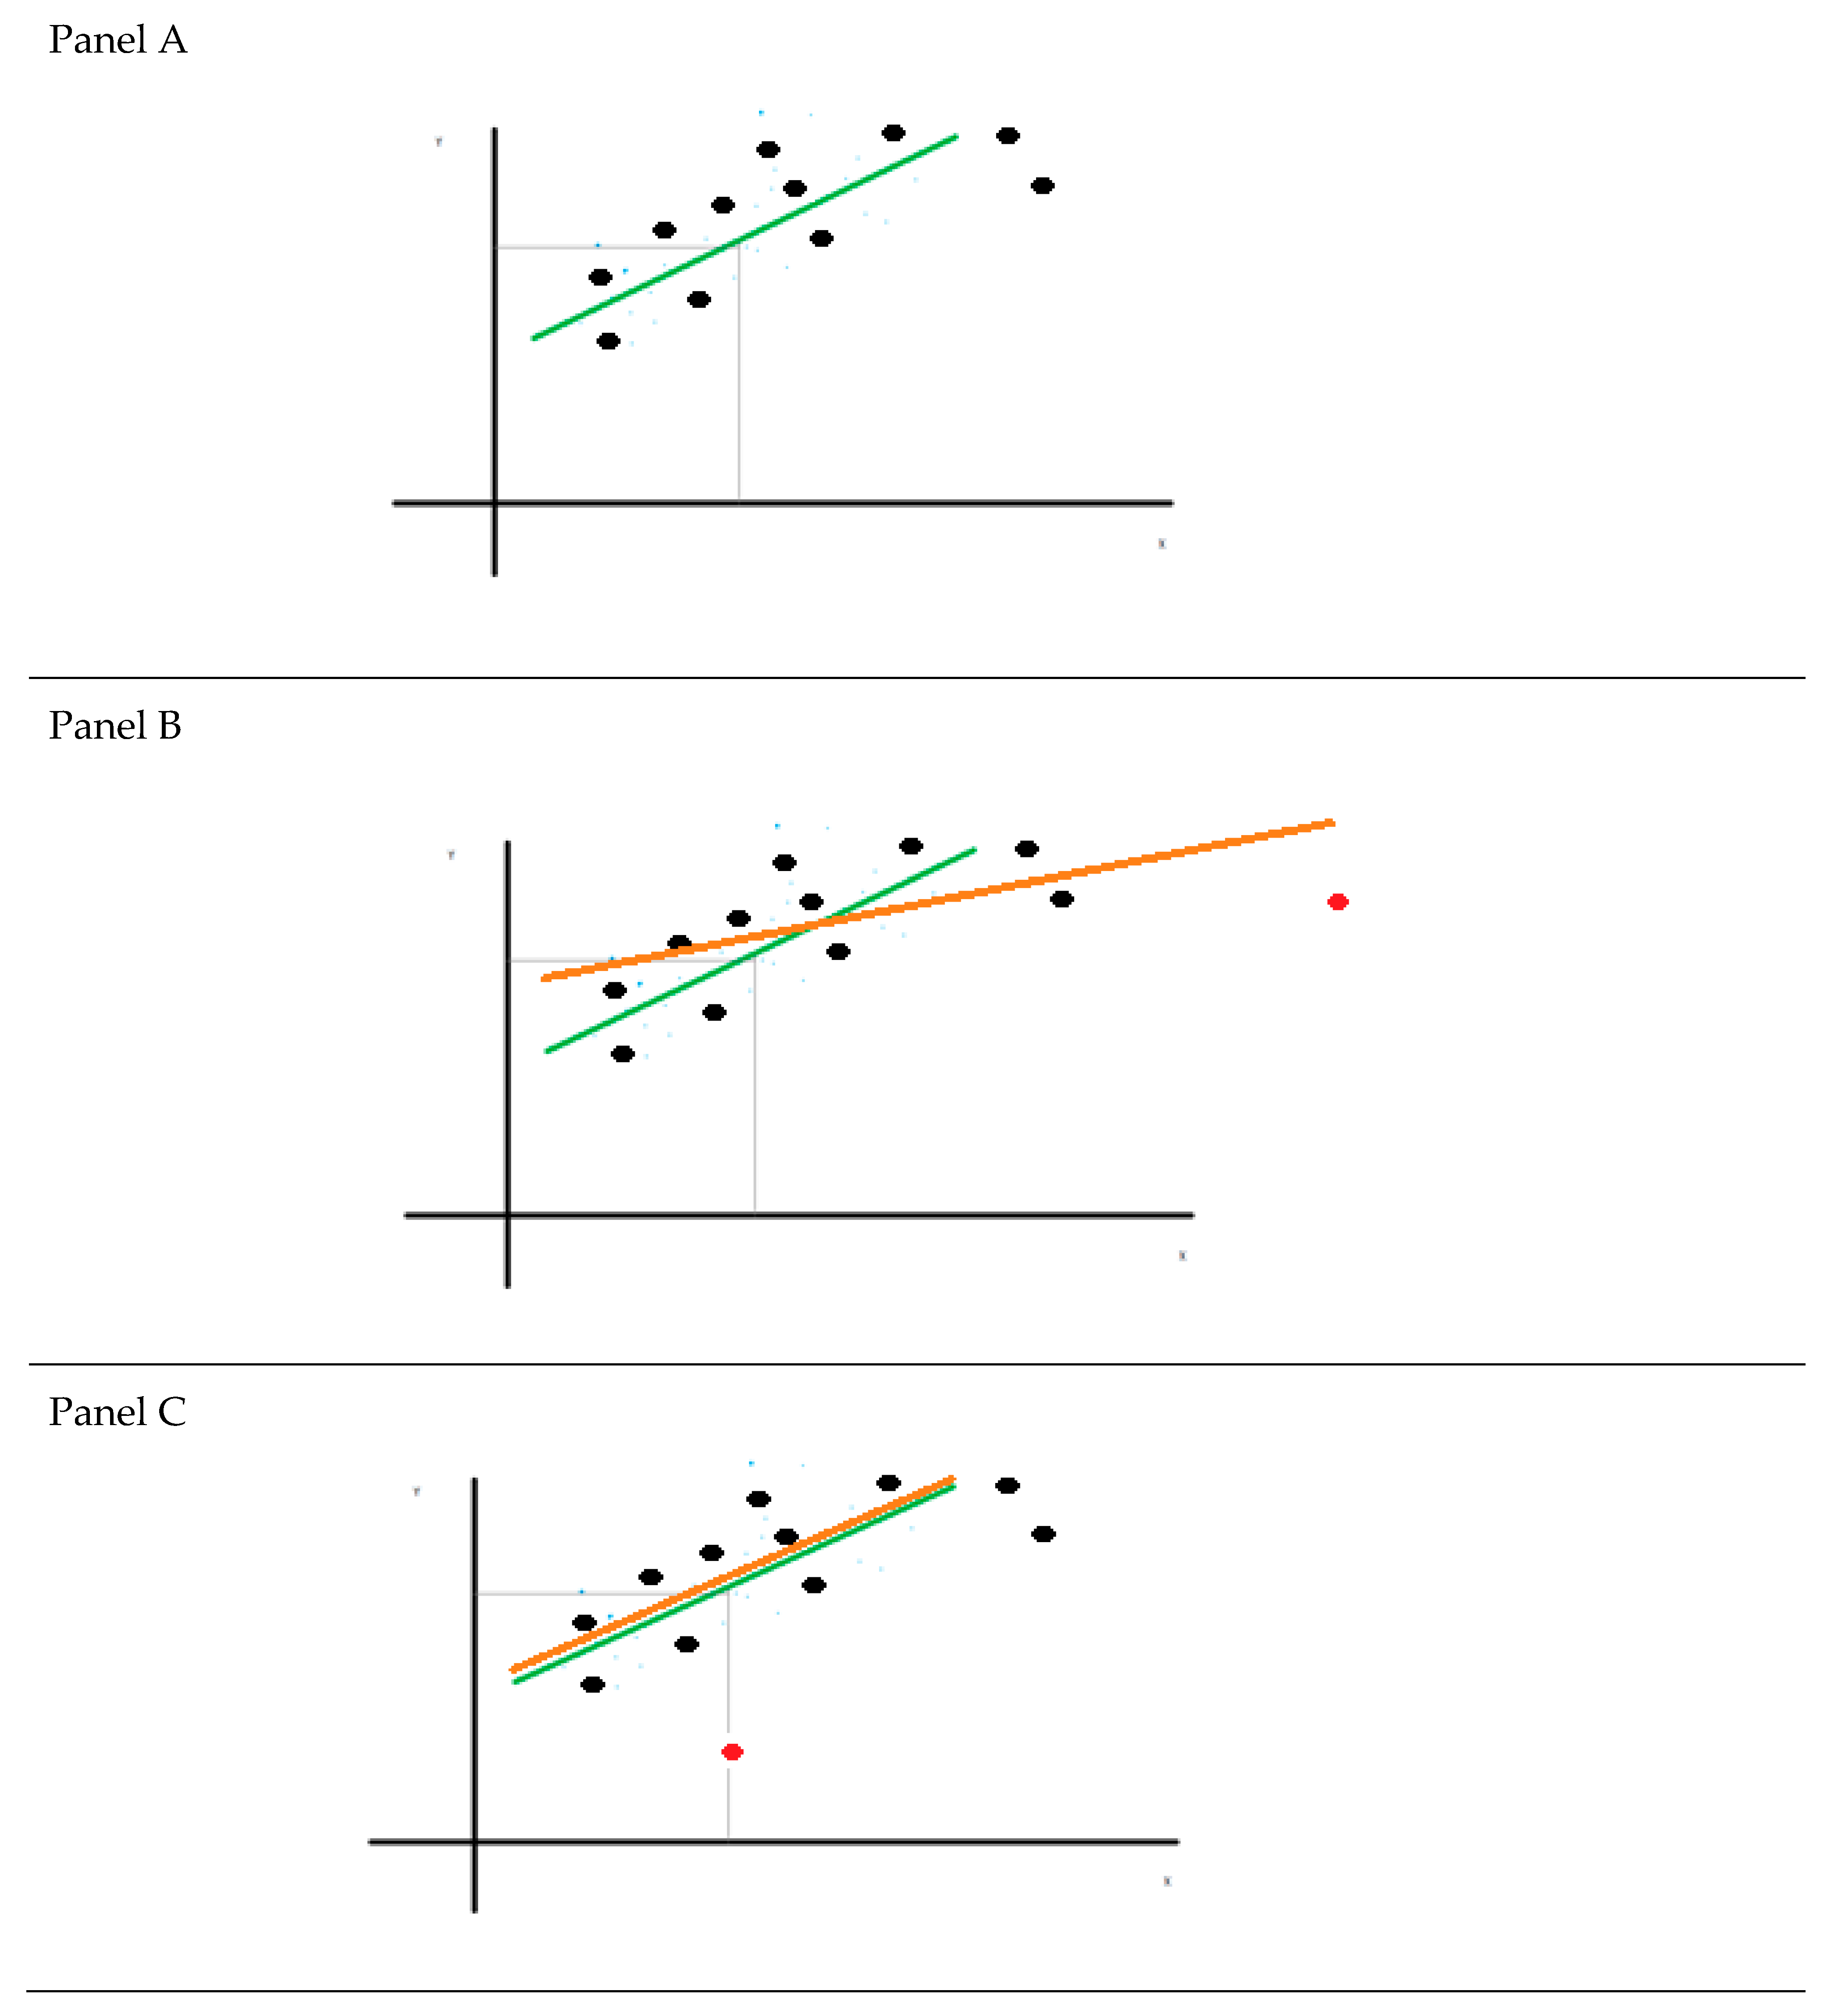
5. Results
6. Discussion
7. Conclusions
Funding
Acknowledgments
Conflicts of Interest
Appendix A
References
- Staszkiewicz, P. The application of citation count regression to identify important papers in the literature on non-audit fees. Manag. Audit. J. 2019, 34, 96–115. [Google Scholar] [CrossRef]
- Kaczmarek, J. The Mechanisms of Creating Value vs. Financial Security of Going Concern—Sustainable Management. Sustainability 2019, 11, 2278. [Google Scholar] [CrossRef]
- Ma, H.; Sun, Q.; Gao, Y.; Gao, Y. Resource Integration, Reconfiguration, and Sustainable Competitive Advantages: The Differences between Traditional and Emerging Industries. Sustainability 2019, 11, 551. [Google Scholar] [CrossRef]
- Gorynia, M.; Nowak, J.; Trąpczyński, P.; Wolniak, R. Friend or Foe? On the role of institutional reforms in the investment development path of Central and East European economies. Int. Bus. Rev. 2019, 28, 575–587. [Google Scholar] [CrossRef]
- Waniak-Michalak, H.; Sapkauskiene, A.; Leitonienė, S. Do companies manipulate CSR information to retain legitimacy? Eng. Econ. 2018, 29. [Google Scholar] [CrossRef]
- Sustainable, T.; Goals, D. The Sustainable Development Goals Report 2016; Afghanistan Centre at Kabul University: Kabul, Afghanistan, 2016. [Google Scholar]
- Griggs, D.; Stafford-Smith, M.; Gaffney, O.; Rockström, J.; Öhman, M.C.; Shyamsundar, P.; Steffen, W.; Glaser, G.; Kanie, N.; Noble, I. Sustainable development goals for people and planet. Nature 2013, 495, 305–307. [Google Scholar] [CrossRef] [PubMed]
- Costanza, R.; Daly, L.; Fioramonti, L.; Giovannini, E.; Kubiszewski, I.; Mortensen, L.F. The UN Sustainable Development Goals and the Dynamics of Well-being. Front. Ecol. Environ. 2016, 14, 59. [Google Scholar] [CrossRef]
- Gaffney, O. Quiet green revolution starts to make some noise. Nature 2014, 505, 587. [Google Scholar] [CrossRef] [PubMed]
- Bebbington, J.; Unerman, J. Achieving the United Nations Sustainable Development Goals. Account. Audit. Account. J. 2018, 31, 2–24. [Google Scholar] [CrossRef]
- Fuso Nerini, F.; Tomei, J.; To, L.S.; Bisaga, I.; Parikh, P.; Black, M.; Borrion, A.; Spataru, C.; Castán Broto, V.; Anandarajah, G.; et al. Mapping synergies and trade-offs between energy and the Sustainable Development Goals. Nat. Energy 2018, 3, 10–15. [Google Scholar] [CrossRef]
- Leal Filho, W.; Azeiteiro, U.; Alves, F.; Pace, P.; Mifsud, M.; Brandli, L.; Caeiro, S.S.; Disterheft, A. Reinvigorating the sustainable development research agenda: The role of the sustainable development goals (SDG). Int. J. Sustain. Dev. World Ecol. 2018, 25, 131–142. [Google Scholar] [CrossRef]
- Kondyli, J. Measurement and evaluation of sustainable development. Environ. Impact Assess. Rev. 2010, 30, 347–356. [Google Scholar] [CrossRef]
- Mori, K.; Christodoulou, A. Review of sustainability indices and indicators: Towards a new City Sustainability Index (CSI). Environ. Impact Assess. Rev. 2012, 32, 94–106. [Google Scholar] [CrossRef]
- Ruiz-Guerra, I.; Molina-Moreno, V.; Cortés-García, F.J.; Núñez-Cacho, P. Prediction of the impact on air quality of the cities receiving cruise tourism: The case of the Port of Barcelona. Heliyon 2019, 5, e01280. [Google Scholar] [CrossRef]
- Alfaro-Navarro, J.L.; López-Ruiz, V.R.; Peña, D.N. A New Sustainability City Index Based on Intellectual Capital Approach. Sustainability 2017, 9, 860. [Google Scholar] [CrossRef]
- Zorn, A.; Esteves, M.; Baur, I.; Lips, M. Financial Ratios as Indicators of Economic Sustainability: A Quantitative Analysis for Swiss Dairy Farms. Sustainability 2018, 10, 2942. [Google Scholar] [CrossRef]
- Molina-Sánchez, E.; Leyva-Díaz, J.; Cortés-García, F.; Molina-Moreno, V. Proposal of Sustainability Indicators for the Waste Management from the Paper Industry within the Circular Economy Model. Water 2018, 10, 1014. [Google Scholar] [CrossRef]
- Martínez-Molina, A.; Tort-Ausina, I.; Cho, S.; Vivancos, J.L. Energy efficiency and thermal comfort in historic buildings: A review. Renew. Sustain. Energy Rev. 2016, 61, 70–85. [Google Scholar] [CrossRef]
- Bobinaite, V. Financial sustainability of wind electricity sectors in the Baltic States. Renew. Sustain. Energy Rev. 2015, 47, 794–815. [Google Scholar] [CrossRef]
- Sundkvist, A.; Jansson, A.; Larsson, P. Strengths and limitations of localizing food production as a sustainability-building strategy—An analysis of bread production on the island of Gotland, Sweden. Ecol. Econ. 2001, 37, 217–227. [Google Scholar] [CrossRef]
- Hammer, M.; Jansson, A.; Jansson, B.O. Diversity change and sustainability: Implications for fisheries. Ambio 1993, 22, 97–105. [Google Scholar]
- Svanbäck, A.; McCrackin, M.L.; Swaney, D.P.; Linefur, H.; Gustafsson, B.G.; Howarth, R.W.; Humborg, C. Reducing agricultural nutrient surpluses in a large catchment—Links to livestock density. Sci. Total Environ. 2019, 648, 1549–1559. [Google Scholar] [CrossRef] [PubMed]
- Yatskiv, I.; Budilovich, E. A comprehensive analysis of the planned multimodal public transportation HUB. In Transportation Research Procedia; Elsevier: Amsterdam, The Netherlands, 2017; Volume 24. [Google Scholar]
- Reidla, K.; Nurmet, M. Sustainability performance indicators in dairy farms of Baltic States. In STRATEGIES FOR THE AGRI-FOOD SECTOR AND RURAL AREAS—DILEMMAS OF DEVELOPMENT; Wigier, M., Kowalski, A., Eds.; INSTITUTE OF AGRICULTURAL AND FOOD ECONOMICS NATIONAL RESEARCH INSTITUTE: Warsaw, Poland, 2017; pp. 145–155. [Google Scholar]
- Schröder, M.; Prause, G. Transportation of Dangerous Goods in Green Transport Corridors—Conclusions from Baltic Sea Region. Transp. Telecommun. 2016, 17, 322–334. [Google Scholar] [CrossRef]
- Boonstra, W.J.; Björkvik, E.; Haider, L.J.; Masterson, V. Human responses to social-ecological traps. Sustain. Sci. 2016, 11, 877–889. [Google Scholar] [CrossRef]
- Beifert, A. Role of Air Cargo and Road Feeder Services for Regional Airports—Case Studies from the Baltic Sea Region. Transp. Telecommun. 2016, 17, 87–99. [Google Scholar] [CrossRef]
- Brankovic, N.; Salketic, S.; Ferizovic, A. Analysis of the possibilites of the construction a railway line VARES-BANOVICI. In Proceedings of the Third International Conference on Traffic and Transport Engineering (ICTTE), Belgrade, Serbia, 24–25 November 2016; pp. 467–475. [Google Scholar]
- Proskurina, S.; Heinimö, J.; Mikkilä, M.; Vakkilainen, E. The wood pellet business in Russia with the role of North-West Russian regions: Present trends and future challenges. Renew. Sustain. Energy Rev. 2015, 51, 730–740. [Google Scholar] [CrossRef]
- Streimikiene, D. Monitoring of energy supply sustainability in the Baltic Sea region. Energy Policy 2007, 35, 1658–1674. [Google Scholar] [CrossRef]
- Urboniene, R.; Kelpšaite, L.; Borisenko, I. Vegetation impact on the dune stability and formation on the Lithuanian coast of the Baltic sea. J. Environ. Eng. Landsc. Manag. 2015, 23, 230–239. [Google Scholar] [CrossRef]
- Lotz, C. Expanding the space for future resource management: Explorations of the timber frontier in northern europe and the rescaling of sustainability during the nineteenth century. Environ. Hist. 2015, 21, 257–279. [Google Scholar] [CrossRef]
- Dekker, W.; Sjöberg, N.B. Assessment of the fishing impact on the silver eel stock in the Baltic using survival analysis. Can. J. Fish. Aquat. Sci. 2013, 70, 1673–1684. [Google Scholar] [CrossRef]
- Lindholm, M.; Behrends, S. Challenges in urban freight transport planning—A review in the Baltic Sea Region. J. Transp. Geogr. 2012, 22, 129–136. [Google Scholar] [CrossRef]
- Taagepera, R. Albert, Martin, and Peter too: Their roles in creating the Estonian and Latvian nations. J. Balt. Stud. 2011, 42, 125–141. [Google Scholar] [CrossRef]
- Deutsch, L.; Folke, C. Ecosystem Subsidies to Swedish Food Consumption from 1962 to 1994. Ecosystems 2005, 8, 512–528. [Google Scholar] [CrossRef]
- Valpasvuo-Jaatinen, P.; Rekolainen, S.; Latostenmaa, H. Finnish agriculture and its sustainability: Environmental impacts. Ambio 1997, 26, 448–455. [Google Scholar]
- Libert, B. The transition of Baltic agriculture. Ambio 1997, 26, 473–475. [Google Scholar]
- Altman, E.I. The success of business failure prediction models. J. Bank. Financ. 1984, 8, 171–198. [Google Scholar] [CrossRef]
- Altman, E.I.; Iwanicz-Drozdowska, M.; Laitinen, E.K.; Suvas, A. Financial Distress Prediction in an International Context: A Review and Empirical Analysis of Altman’s Z- Score Model. J. Int. Financ. Manag. Account. 2017, 28, 131–171. [Google Scholar] [CrossRef]
- Holma, M.; Lindroos, M.; Romakkaniemi, A.; Oinonen, S. Comparing economic and biological management objectives in the commercial Baltic salmon fisheries. Mar. Policy 2019, 100, 207–214. [Google Scholar] [CrossRef]
- Siksnelyte, I.; Zavadskas, E.K.; Bausys, R.; Streimikiene, D. Implementation of EU energy policy priorities in the Baltic Sea Region countries: Sustainability assessment based on neutrosophic MULTIMOORA method. Energy Policy 2019, 90–102. [Google Scholar] [CrossRef]
- Oleinikova, I.; Mutule, A.; Obushevs, A. Baltic transmission expansion planning considering wholesale electricity market. In Proceedings of the International Conference on the European Energy Market, Lisbon, Portugal, 19–22 May 2015. [Google Scholar] [CrossRef]
- Holmgren, J.; Nikopoulou, Z.; Ramstedt, L.; Woxenius, J. Modelling modal choice effects of regulation on low-sulphur marine fuels in Northern Europe. Transp. Res. Part D Transp. Environ. 2014, 28, 62–73. [Google Scholar] [CrossRef]
- Jokikokko, E.; Huhmarniemi, A. The large-scale stocking of young anadromous whitefish (Coregonus lavaretus) and corresponding catches of returning spawners in the River Tornionjoki, northern Baltic Sea. Fish. Manag. Ecol. 2014, 21, 250–258. [Google Scholar] [CrossRef]
- Zhang, J.; Gilbert, D.; Gooday, A.J.; Levin, L.; Naqvi, S.W.A.; Middelburg, J.J.; Scranton, M.; Ekau, W.; Peña, A.; Dewitte, B.; et al. Natural and human-induced hypoxia and consequences for coastal areas: Synthesis and future development. Biogeosciences 2010, 7, 1443–1467. [Google Scholar] [CrossRef]
- Larsson, M.; Granstedt, A. Sustainable governance of the agriculture and the Baltic Sea—Agricultural reforms, food production and curbed eutrophication. Ecol. Econ. 2010, 69, 1943–1951. [Google Scholar] [CrossRef]
- Orru, M.; Orru, H. Sustainable use of Estonian peat reserves and environmental challenges. Est. J. Earth Sci. 2008, 57, 87–93. [Google Scholar] [CrossRef]
- Hallemaa, H.; Vitsur, H.; Oja, T.; Mander, Ü. Sustainability of energy use in Estonian settlements and regions. WIT Trans. Ecol. Environ. 2006, 93, 509–519. [Google Scholar] [CrossRef]
- Heikinheimo, O.; Setälä, J.; Saarni, K.; Raitaniemi, J. Impacts of mesh-size regulation of gillnets on the pikeperch fisheries in the Archipelago Sea, Finland. Fish. Res. 2006, 77, 192–199. [Google Scholar] [CrossRef]
- Raukas, A.; Tavast, E. Sustainable management of mineral resources, soil cover and geosites in Estonia. Pol. Geol. Inst. Spec. Pap. 2004, 13, 191–197. [Google Scholar]


| Variable | Definition |
|---|---|
| TC/Year | The number of citations divided by the number of years (in the denominator the year of publication - one value) |
| Publication_Year | 2019 + 1 minus year of publication natural number |
| Method | Binary variable value 1 for the survey when regression methods are used, 0 in other cases |
| Time_Span | The time range in the years of the sample |
| Sample | Size of the test sample in units of measurement |
| Agriculture | Binary variable value 1 for the agricultural survey, 0 in other cases |
| Transport | Binary variable value 1 for the transport survey, 0 in other cases |
| Fishing | Binary variable value 1 for the fishing survey, 0 in other cases |
| Energy | Binary variable value 1 for the energy survey, 0 in other cases |
| Pollution_Control | Binary variable value 1 for pollution damages, 0 in other cases |
| Business_Finance_Mgt | Binary variable value 1 for the finance business or economy survey, 0 in other cases |
| Area | Number of Papers |
|---|---|
| Agriculture | 7 |
| Transport | 6 |
| Fishing | 28 |
| Energy | 12 |
| Pollution_Control | 16 |
| Business_Finance_Mgt | 16 |
| Unallocated | 74 |
| Sum | 159 |
| Variable | Mean | Med. | Min. | Max. | . Std. Dev. | Skew. | Kurt. | 5% Perc. | 95% Perc. |
|---|---|---|---|---|---|---|---|---|---|
| TC_Year | 1.8 | 0.6 | 0.0 | 19.2 | 3.2 | 3.1 | 10.2 | 0.0 | 11.0 |
| Publication_Year | 9.1 | 7.0 | 1.0 | 27.0 | 5.9 | 0.9 | 0.1 | 1.0 | 23.0 |
| Method | 0.1 | 0.0 | 0.0 | 1.0 | 0.3 | 3.2 | 8.3 | 0.0 | 1.0 |
| Time_Span | 8.0 | 0.0 | 0.0 | 1000.0 | 79.4 | 12.4 | 152.1 | 0.0 | 14.0 |
| Sample | 113.5 | 0.0 | 0.0 | 18,000.0 | 1427.5 | 12.5 | 154.0 | 0.0 | 0.0 |
| Agriculture | 0.0 | 0.0 | 0.0 | 1.0 | 0.2 | 4.4 | 17.8 | 0.0 | 0.0 |
| Transport | 0.0 | 0.0 | 0.0 | 1.0 | 0.2 | 4.9 | 21.5 | 0.0 | 0.0 |
| Fishing | 0.2 | 0.0 | 0.0 | 1.0 | 0.4 | 1.7 | 0.9 | 0.0 | 1.0 |
| Energy | 0.1 | 0.0 | 0.0 | 1.0 | 0.3 | 3.2 | 8.3 | 0.0 | 1.0 |
| Pollution_Control | 0.1 | 0.0 | 0.0 | 1.0 | 0.3 | 2.7 | 5.0 | 0.0 | 1.0 |
| Business_Finance_Mgt | 0.1 | 0.0 | 0.0 | 1.0 | 0.3 | 2.7 | 5.0 | 0.0 | 1.0 |
| Coefficient | Std. Error | t-ratio | p-Value | ||||||
|---|---|---|---|---|---|---|---|---|---|
| Const. | 1.65278 | 0.548219 | 3.0148 | 0.0030 | *** | ||||
| Publication_Year | 0.0240776 | 0.0463692 | 0.5193 | 0.6044 | |||||
| Method | −0.49815 | 0.481207 | −1.0352 | 0.3023 | |||||
| Time_Span | −0.00156831 | 0.000483838 | −3.2414 | 0.0015 | *** | ||||
| Sample | −0.000111668 | 3.92137 × 10⁻⁵ | −2.8477 | 0.0050 | *** | ||||
| Agriculture | −0.869443 | 0.719052 | −1.2092 | 0.2285 | |||||
| Transport | 0.236317 | 1.2931 | 0.1828 | 0.8552 | |||||
| Fishing | 0.828027 | 0.790064 | 1.0481 | 0.2963 | |||||
| Energy | −0.984779 | 0.469697 | −2.0966 | 0.0377 | ** | ||||
| Pollution_Control | 0.181339 | 1.0242 | 0.1771 | 0.8597 | |||||
| Business_Finance_Mgt | −1.07773 | 0.452412 | −2.3822 | 0.0185 | ** | ||||
| Model diagnostics | |||||||||
| Mean dependent var | 1.760225 | S.D. dependent var. | 3.205253 | ||||||
| Sum squared resid. | 1553.164 | S.E. of regression | 3.239499 | ||||||
| R-squared | 0.043168 | Adjusted R-squared | −0.021483 | ||||||
| F(10, 148) | 5.052342 | P-value(F) | 2.56 × 10⁻⁶ | ||||||
| Log-likelihood | −406.8033 | Akaike criterion | 835.6065 | ||||||
| Schwarz criterion | 869.3645 | Hannan-Quinn | 849.3153 | ||||||
| No | First author | error | leverage | Year | Ref. |
|---|---|---|---|---|---|
| u | 0 < = h < = 1 | ||||
| 1 | Svanback, A | −0.79016 | 0.161 * | 2019 | [23] |
| 2 | Yatskiv, I | −1.9613 | 0.167 * | 2017 | [24] |
| 3 | Reidla, K | −0.85557 | 0.154 * | 2017 | [25] |
| 4 | Schroder, M | −1.2354 | 0.167 * | 2016 | [26] |
| 5 | Boonstra, WJ | 3.3704 | 0.151 * | 2016 | [27] |
| 6 | Beifert, A | −0.62965 | 0.151 * | 2016 | [28] |
| 7 | Brankovic, N | −1.9854 | 0.167 * | 2016 | [29] |
| 8 | Proskurina, S | 1.3984 | 0.167 * | 2015 | [30] |
| 9 | Streimikiene, D | −0.09024 | 0.161 * | 2007 | [31] |
| 10 | Urboniene, R | −1.2375 | 0.157 * | 2015 | [32] |
| 11 | Bobinaite, V | 2.2094 | 0.189 * | 2015 | [20] |
| 12 | Lotz, C | −2.0095 | 0.167 * | 2015 | [33] |
| 13 | Dekker, W | 0.001682 | 1.000 * | 2013 | [34] |
| 14 | Lindholm, M | 5.7933 | 0.169 * | 2012 | [35] |
| 15 | Taagepera, R | 0.14328 | 0.995 * | 2011 | [36] |
| 16 | Deutsch, L | −0.21117 | 0.147 * | 2005 | [37] |
| 17 | Sundkvist, A | −0.25419 | 0.170 * | 2001 | [21] |
| 18 | Valpasvuo-Jaatinen, P | 0.45333 | 0.174 * | 1997 | [38] |
| 19 | Libert, B | −1.3371 | 0.174 * | 1997 | [39] |
| 20 | Hammer, M | −0.53465 | 0.148 * | 1993 | [22] |
| First author | Agriculture | Transport | Fishing | Energy | Pollution | Business finance |
|---|---|---|---|---|---|---|
| Svanback, A | 1 | 0 | 0 | 0 | 0 | 0 |
| Yatskiv, I | 0 | 1 | 0 | 0 | 0 | 0 |
| Reidla, K | 1 | 0 | 0 | 0 | 0 | 0 |
| Schroder, M | 0 | 1 | 0 | 0 | 0 | 0 |
| Boonstra, WJ | 1 | 0 | 0 | 0 | 0 | 0 |
| Beifert, A | 0 | 1 | 0 | 0 | 0 | 0 |
| Brankovic, N | 0 | 1 | 0 | 0 | 0 | 0 |
| Proskurina, S | 0 | 1 | 0 | 0 | 0 | 0 |
| Urboniene, R | 0 | 0 | 0 | 0 | 1 | 0 |
| Bobinaite, V | 0 | 0 | 0 | 1 | 0 | 1 |
| Lotz, C | 0 | 1 | 0 | 0 | 0 | 0 |
| Dekker, W | 0 | 0 | 1 | 0 | 0 | 0 |
| Lindholm, M | 0 | 1 | 0 | 0 | 0 | 0 |
| Taagepera, R | 0 | 0 | 0 | 0 | 0 | 0 |
| Streimikiene, D | 0 | 0 | 0 | 0 | 0 | 0 |
| Deutsch, L | 1 | 0 | 0 | 0 | 0 | 0 |
| Sundkvist, A | 0 | 0 | 0 | 1 | 1 | 0 |
| Valpasvuo-Jaatinen, P | 1 | 0 | 0 | 0 | 0 | 0 |
| Libert, B | 1 | 0 | 0 | 0 | 0 | 0 |
| Hammer, M | 0 | 0 | 1 | 0 | 0 | 1 |
© 2019 by the author. Licensee MDPI, Basel, Switzerland. This article is an open access article distributed under the terms and conditions of the Creative Commons Attribution (CC BY) license (http://creativecommons.org/licenses/by/4.0/).
Share and Cite
Staszkiewicz, P. Search for Measure of the Value of Baltic Sustainability Development: A Meta-Review. Sustainability 2019, 11, 6640. https://doi.org/10.3390/su11236640
Staszkiewicz P. Search for Measure of the Value of Baltic Sustainability Development: A Meta-Review. Sustainability. 2019; 11(23):6640. https://doi.org/10.3390/su11236640
Chicago/Turabian StyleStaszkiewicz, Piotr. 2019. "Search for Measure of the Value of Baltic Sustainability Development: A Meta-Review" Sustainability 11, no. 23: 6640. https://doi.org/10.3390/su11236640
APA StyleStaszkiewicz, P. (2019). Search for Measure of the Value of Baltic Sustainability Development: A Meta-Review. Sustainability, 11(23), 6640. https://doi.org/10.3390/su11236640