1. Introduction
According to the data of the World Bank, on average, the GDP per capita in high-income countries was over 20 times higher than that of low-income countries. Explaining the sources of these astonishing differences in the income per capita across countries constitutes one of most challenging issues in Macroeconomics. We can look at this in greater detail. If the Central African Republic is compared with another African country, such as Botswana, we realize that in the 1960s the income per capita of the former was higher than the income per capita of the latter country. Nevertheless, at the beginning of the 1970s, Botswana overtook the Central African Republic, and from then to 2018 the growth rate of the Central African Republic has been −44.07%, for Botswana this has been 1019.49%, while Singapore, one of the richest countries in 2018, “only” grew 748% in the same period.
The success of Botswana has attracted the attention of many researchers. Robinson et al. [
1] have highlighted the role of inclusive institutions, which brings us directly to the crucial issue, namely, what has enabled the development of these types of institutions. Although this question has many answers, since the contribution of Easterly and Levine [
2], the issue of the ethnolinguistic diversity has become to be one of the most relevant. Based on the data provided by Alesina et al. [
3], the index of ethnic fractionalization for Central African Republic is the double that of Botswana (0.82 against 0.41). Likewise, this index is over 0.8 for other low-income countries like Chad (0.86), Liberia (0.90) or Madagascar (0.87). A simple descriptive analysis show that the average for different ethnolinguistic diversity indices decreases from low-income to high-income countries (see
Appendix A,
Table A3 and
Table A8). In fact, a growing number of cross-country studies have tested the negative impact of ethnolinguistic diversity on income and on several aspects of economic performance, such as economic growth [
3], income distribution [
4], unemployment rate [
5], and quality of institutions [
6]. In an increasingly heterogeneous world, these results are alarming. They highlight the potential detrimental effects of diversity, which can foster xenophobic attitudes, which, in the end, are those that are really harmful to society as a whole.
Moreover, from a theoretical point of view, ethnic diversity presents not only costs but also benefits since diversity implies a variety of skills that results in greater productivity [
7]. These positive effects are more salient when empirical studies are conducted at a micro level. Furthermore, Putnam [
8] argues that, despite the negative effects that could arise from ethnic heterogeneity in the short run, diversity could show benefits in the long run, if we learn to handle diversity properly. In other words, the key point is not the ethnic diversity itself, but the way in which society manages said ethnic diversity. As Alesina and Zhuravskaya ([
6], p. 1872) assert, “What makes different countries more or less capable of handling diversity, or even benefiting from it, remains an open question.” In an effort to answer this question, Van Staveren and Pervaiz [
9] point out that social cohesion plays a key role in gaining all the benefits from diversity. Along these lines, Buitrago et al. Buitrago et al. [
10] show that tolerance overcomes the negative effects of ethnolinguistic diversity on institutional quality.
On this basis, our aim is to show that the benefits of diversity are greater than costs if the population attains a certain level of education, since this plays a key role in achieving social cohesion, because education provides the means to be more tolerant and cooperative [
11,
12]. This allows diversity to boost productivity and innovation and to avoid any conflicts that would otherwise arise due to a lack of understanding between the different ethnolinguistic groups. This ultimately leads to the disappearance of the negative impact of ethnic diversity, even at a macro level.
In short, this paper strives to answer three questions:
- (1)
Can education manage to alleviate the adverse effects of ethnic diversity on economic performance?
- (2)
Is education capable of reversing these adverse effects even when the diversity indices that consider distance between groups are included in the analysis?
- (3)
Which level of education is required in order to overcome the possible adverse effects of ethnolinguistic diversity?
In order to answer these questions, we use a sample of 116 developing and developed countries. For the measurement of diversity, we consider the indices of fractionalization of Alesina et al. [
3] and Montalvo and Querol [
13], which are widely used in the literature. These indices fail to take into account the degree of difference between groups, and therefore new indices have been developed that measure the distance among groups from a variety of perspectives. These perspectives include those that consider factors that are cultural [
14], physical (segregation index of Alesina and Zhuravskaya [
6]), the size of the groups (polarization indices of Montalvo and Querol [
13], Esteban and Ray [
15], Desmet et al. [
16]), or income inequality [
17]. From these approaches, we have chosen the latter based on the results of Alesina et al. [
17]. These authors document a strong negative association between ethnic inequality (an index that measures the economic differences between ethnicities coexisting in the same country) and real GDP per capita across countries. This association holds when they control for cultural diversity, polarization, and segregation, while these three indices appear as non-significant.
We test the negative impact of diversity on the level of income when education is absent. However, when education is present, we show that at certain level of secondary and tertiary education, the marginal effect of diversity on income becomes positive, that is, education overcomes the negative effect of diversity on income per capita.
Our main contributions include the following: First, the paper gives a new insight into the effects of ethnic diversity on income by introducing the role of education as an enhancer of the possible benefits derived from ethnic heterogeneity. Second, the results obtained show that education provides the means to overcome the adverse effects of ethnolinguistic diversity on economic performance shown by the empirical literature at macro level. The results are robust when various indices of ethnic diversity are employed: both for fractionalization indices and indices that include measures of the distance between groups. Finally, we calculate the level of education required in order to reverse the negative impacts of ethnolinguistic diversity. To the best of our knowledge, this is the first paper to calculate this magnitude.
In an increasingly diverse world, the results achieved in this paper are significant for policy makers. Our results provide tools to handle diversity, while allowing its possible adverse effects to be overcome and its benefits to be used to great advantage.
The rest of the paper is organized as follows:
Section 2 summarizes the main theoretical arguments on the effects of ethnic diversity.
Section 3 describes the data and variables. In
Section 4, the methodology and results are presented, and finally, the discussion is offered and conclusions are drawn in
Section 5.
2. The Effects of Ethnolinguistic Diversity and the Role of Social Cohesion. A Literature Review
From the theoretical point of view, there are different settings trying to model the positive and negative effects of ethnolinguistic diversity. For example, Cerqueti et al. [
18] consider a game with bureaucrats, controllers, and entrepreneurs, producing a single commodity. The cost of monitoring the activities of the agents plays a key role in their model. They assume that, on the one hand, heterogeneity increases the cost of supervising, fostering corruption and harming economic growth but, on the other hand, diversity increases the level of control between ethnic groups, facilitating control, reducing corruption and then encouraging growth. From the proposed game, they conclude that there is a non-linear relationship between ethnic diversity and growth: homogeneous and fragmented societies are characterized by low economic growth and middle fragmented societies show higher growth rates.
Nevertheless, the theoretical framework closer to our paper is the one proposed by Alesina and La Ferrara [
7]. In their model, diversity generates both costs and benefits. On the one hand, ethnic diversity brings about variety in abilities, experiences, and cultures that may lead to innovation and creativity, which results in higher levels of productivity. To capture these benefits, they assume that the skills of individuals from different ethnic groups enter as complementary in the production process of the private goods, which, in turn, implies that more diversity encourages productivity. On the other hand, diversity could give rise to conflicts of preferences, racist and xenophobic attitudes that cause social unrest and discrimination to minorities. In order to overcome these problems, the policy makers have to develop measures that are counterproductive for society because these measures require resources that could be devoted to productive investments. These costs are introduced in the model considering that individual utility depends not only on the consumption of private goods (where the benefits of diversity are included), but also on a shared public commodity. The conflicts arise because the preferences on the type of public commodity to provide are different among the several ethnic groups. Therefore, the greater the diversity, the lower the utility from the consumption of public goods.
Alesina and La Ferrara [
7] test the model for cross-sectional data on countries and localities in the United States. The results differ depending on the level of disaggregation. At a country level, the higher the ethnic diversity, the lower the growth rates, while across localities, the association between the two variables is positive, as is also found by Sparber [
19] for US cities. There are several studies at city level that find a positive association between diversity and economic performance, such as that by Ottaviani and Peri [
20,
21] for the US, Nathan [
22] for the UK, Bakens [
23] for the Netherlands, and Suedekum et al. [
24] for Germany. However they use the birthplace diversity as a measure of heterogeneity, which, strictly speaking, is not the same as ethnolinguistic fractionalization. In fact, even at a macro level, birthplace diversity is positively related to economic growth [
25]. In this respect, Montalvo and Querol [
26] analyse the effect of the size of geographical units on the relationship between ethnic diversity and economic growth. In the same way as Alesina and La Ferrara [
7], they find a positive relationship for small geographical areas. However, their results show that there is no effect of diversity on growth for large areas and countries.
In addition, Alesina and La Ferrara [
7] also conclude that ethnic diversity can be beneficial (or, at least, less detrimental) at higher levels of development. They argue that countries that are more highly developed are more capable of capturing the benefits from ethnic heterogeneity, since the diversification of the production process allows the variety of skills generated by ethnic diversity to be used to greater advantage. Furthermore, richer countries are better prepared for absorbing the costs of diversity that appear with more evidence at a macro level in terms of conflicts and social unrest since they have the resources to develop better institutions in order to overcome these costs. Therefore, the negative relation for cross-country studies could vanish in highly developed countries, because these countries are better equipped to deal with diversity than are developing countries.
These arguments lead us to conclude that the effects of ethnolinguistic diversity depend on the tools available to each society to handle such diversity. In this respect, and following Van Staveren and Pervaiz [
9], we underline the role of social cohesion as constituting one of these tools. From theoretical and empirical perspectives, the literature shows that ethnic diversity can have both negative and positive impacts on social cohesion (see Sturgis et al. [
27] for a brief summary on this topic). Along a different line of argumentation, we consider that social cohesion should not be confused with homogeneity. We focus on the fact that education contributes towards social cohesion by providing the tools that allow social cohesion to occur in a diverse world.
Social cohesion is a broad concept on which there is little agreement regarding what it precisely entails. Schiefer and Van der Noll ([
28], p. 595) review the literature on the concepts of social cohesion, and determine its three main characterizing features. These essential features of social cohesion are: (1) the quality of social relations (including social networks, trust, acceptance of diversity, and participation); (2) identification with the social entity; and (3) orientation towards the common good (sense of responsibility, solidarity, and compliance to social order).
Based on Van Staveren and Pervaiz [
9], we focus on the first feature: the quality of social relations. According to these authors, what matters for development is not so much the number of groups but how groups relate to each other. As Alesina and La Ferrara ([
7], p. 795) point out, “in a more integrated world, the question of how different people can peacefully interact is the critical problem for the next many decades”. Tolerance, trust, and cooperation among groups contribute towards social cohesion through the avoidance, or at least the mitigation, of the potential conflicts that could arise from diversity. Based on this argument, Buitrago et al. [
10] consider that social cohesion could be achieved in a heterogeneous society through tolerance, which might help the integration of all members of a community, thereby overcoming any friction caused by heterogeneity. In the same vein, we argue that education contributes towards social cohesion since it provides the instruments to become more tolerant, cooperative, and trusting; it facilitates social networks [
12]; and it reduces the cultural distances between ethnic groups [
11]. In this respect, for example, d’Hombres and Nunziata [
29], using the European Social Survey and Labour Force Survey data for the period 2002–2012, find that higher levels of education contribute towards a more positive attitude towards immigrants.
Our hypothesis is that education enhances the positive effects of diversity on income, thereby achieving the reversal of the negative sign of ethnic heterogeneity observed in cross-country studies. In order to test our hypothesis, we will proceed as follows.
As a first step, we will check the standard results of the literature. If we denote DIVi as an index of ethnic diversity, EDUCi as an index of education, and Xi as the matrix of control variables, then the income per capita GDPi can be explained by Equation (1):
where the subscript i refers to country i. In expression (1), the marginal effect of diversity on growth is given by β
1, which empirical evidence finds to be negative. Our aim is to show that when education is present, once it achieves a certain level, the marginal effect of diversity becomes positive. Therefore, in a second step, we introduce the interaction effect of diversity with education in Equation (2):
In Equation (2), β3 measures how the level of education affects the relationship between ethnic diversity and the income level. Our hypothesis is that the interaction is going to be positive. However, this could be insufficient to balance the negative effect of diversity.
Therefore, as a third step, we calculate the marginal effect of diversity, given by Equation (3):
Equation (3) allows us to calculate the level of education required for (3) to be positive.
3. Data and Variables
We use a sample of 116 developing and developed countries (see
Appendix A,
Table A1). Those countries for which data is available for all variables have been selected. In order to explain the differences in the level of income, different indices of diversity are used, and the interaction with different levels of education is studied. We also include two control variables.
3.1. Index of Diversity
As a proxy of ethnolinguistic diversity, we have taken the usual Ethnolinguistic Fractionalization Index, which measures the probability that two randomly selected people from a given country will not belong to the same ethnolinguistic group ([
3], pp. 158–159):
where sij is the share of group j (j = 1, …, n) in country i.
One of the most common indices used in the literature in this field is the ethnolinguistic fractionalization index (ELF) provided by Taylor and Hudson [
30], which jointly includes the linguistic and ethnic features in order to classify the different groups. In a further step, Alesina et al. ([
3], p. 156) suggest that the ELF index relies largely “on linguistic distinctions, which may obscure other aspect of ethnicity, like racial origin, skin color, etc.”. For this reason, these authors provide an ethnic fractionalization index (ALE) based solely on ethnic characteristics and an index based strictly on language (ALL) (they construct a third index based strictly on religion, but we are not going to consider this dimension. Alesina et al. [
3] find that religious fractionalization is non-significant or even appears to be positively associated to income). However, the correlation between these indices and ELF is very high. More precisely, in our sample, the correlation between ELF and ALE is 0.70, between ELF and ALL is 0.84, and between ALE and ALL it is 0.72. Said authors find that both ethnic and linguistic fractionalization indices are negatively related to the level of income.
In this paper, we select these two indices for ethnic and linguistic groups from Alesina et al. [
3]. Moreover, to test the robustness of our results, we also use the ethnolinguistic fractionalization index (ETFRA) constructed by Montalvo and Querol [
13]. Based on Vanhanen [
31], they aggregate ethnolinguistic families according to genetic features. The level of disaggregation is lower than in the indices of Alesina et al. [
3]. Nevertheless, the correlation between indices is again very high: the correlation of ETFRA with ALE is 0.86; that with ALL is 0.72; and its correlation with ELF is 0.70.
These three indices (ALE, ALL, ETFRA) refer to a period that covers from the early to mid-1990s and, as Alesina et al. [
3] point out, they can be assumed to be stable over a 30-year horizon.
In our sample, the countries that show the highest degree of fractionalization (over 0.8) for all three indices at the same time are Cameroon, Kenya, Liberia, and Uganda. These countries were categorized as low- or lower-middle-income countries by the World Bank in 2016. The countries with the lowest values for all three indices (below 0.1) are Bangladesh, Iceland, Japan, Norway, the Republic of Korea, and Portugal. With the sole exception of Bangladesh, all of these countries are classified as high-income countries.
The three fractionalization indices above fail to consider any degree of dissimilarity between groups. In fact, if we consider two ethnic groups with the same language and religion, they are generally less dissimilar than two ethnic groups with different languages and religions. Nevertheless, this issue is not taken into account in the fractionalization indices. In the attempt to overcome these shortcomings, there are alternative indices that strive to improve fractionalization measures by including a measure of the distance between groups from different perspectives. In this respect, among the most significant approaches, we can find the cultural index [
14], the segregation index [
6], the polarization indices [
13,
15,
16], and the ethnic inequality index [
17].
From among these, we have chosen the ethnic inequality index (ETIN) due to the robust results documented by Alesina et al. [
17]. They find a strong negative correlation between ETIN and real GDP per capita across countries. In addition, the negative association between the different measures of ethnolinguistic diversity and income weakens with the inclusion of ETIN in the regressions.
The ethnic inequality index is an ethnic Gini index that measures the economic differences between ethnicities coexisting in the same country. They use the luminosity per capita based on the satellite image data on light density at night as a proxy for the income per capita of the ethnic groups. ETIN is calculated as follows:
where n denotes the number of ethnic groups and yj is the luminosity per capita of each group j.
From the years of available data, we select the data for 2000 because this data is closer to the three indices of fractionalization considered in this paper. In our sample, the five countries with the highest ETIN are Afghanistan, Algeria, Bolivia, Brazil, and Peru, while those with the lowest include Bahrain, Iceland, Jamaica, the Republic of Korea, and Malta.
The correlation between ETIN and the fractionalization indices in our sample is low: 0.45 with ALE, 0.36 with ALL, and 0.53 with ETFRA.
A first glance at our data shows that there could be an association between income and diversity.
Table A3 in the
Appendix A shows the mean and the median for the four diversity indices when countries are grouped in terms of level of income. The results indicate that the lower the income, the higher the diversity indices. Furthermore, there are 24 countries with the four indices over 0.5. Of these 24 countries, 16 are classified as having low income, seven as lower-middle-income countries and only one, Gabon, is a upper-middle-income country. In contrast, there are 32 countries with the four indices below 0.5, of which 20 are high-income countries, six are upper-middle-income, five are lower-middle-income and only one, Burundi, is of low income. Of the high-income countries, there are several striking cases, such as those of Belgium, Canada, and Switzerland, which present all the indices at over 0.5 except for ethnic inequality. In contrast, Australia, Chile, Finland, Norway, and Sweden show only the ETIN index to be over 0.5. Finally, of the low-income countries, we find only Burundi and Zimbabwe with at least one index below 0.5. For Haiti and Rwanda, there is no data for ALL, but of the other three indices, at least two remain below 0.5. (See
Appendix A,
Table A5 and
Table A6 for details).
3.2. Index of Education
As a proxy of education (EDUC), we employ the average number of years of schooling completed among adult people over the age of 25 (EDUCT). Since we are interested in the level of education required to balance the negative effect of diversity, the disaggregated data is also used, that is, the average number of years of primary, secondary, and tertiary education completed (EDUC1, EDUC2, and EDUC3, respectively). The data is taken from Barro and Lee [
32] and is grouped into 5-year intervals. We use the data corresponding to year 2000.
3.3. Control Variables
As control variables, on the one hand, we include the legal origin, following La Porta et al. [
33]. They identify five possible legal origins: Common Law (British system), German commercial code, Scandinavian commercial law, French commercial code (Civil law), and Socialist/communist law. La Porta et al. [
33] assert that the Common Law, and, to a lesser extent both the German and Scandinavian legal systems, are based on the promotion of economic freedom and the defence and respect for property rights. These features foster private initiative and limit the intervention of the government in the economy. In contrast, the French commercial code and, to an even greater degree, the Socialist/communist law were conceived to organize state intervention in the economy. This leads to a weakening of the recognition of property rights and individual freedom and also hinders private initiative by increasing bureaucracy. According to these arguments, La Porta et al. [
33] show that countries whose legal system is based on the French and Socialist/communist laws exhibit lower income levels than countries with British and Nordic legal traditions.
In our sample, we identify 39 countries whose legal origin is the Common Law, 57 with the Civil Law, 11 with the Socialist/communist law, with the German commercial code, and 5 with the Scandinavian commercial law (see
Appendix A,
Table A1). This has led us to include a dummy variable for the English legal origin, and another for the French legal origin, while the excluded dummy variable corresponds to countries with Socialist, German, and Scandinavian legal traditions.
On the other hand, we have also selected openness as a control variable. Although it is true that there is no agreement in the literature on the link between trade openness and economic performance, Yanikkaya [
34] argues that this lack of consensus arises, to a large extent, from the different ways of defining openness. Of the five categories distinguished by Yanikkaya [
34], this author points out that research using openness as the sum of imports plus exports of goods and services as a percentage of the GDP shows a positive relationship with economic growth (see, for example, [
35,
36]). Based on these arguments, we have selected this measure of openness (data from World Bank). We employ the five-year average for the same period as that used for education.
3.4. Dependent Variable
The dependent variable is the level of income measured by the log of the GDP per capita in PPP (purchasing power parity) in constant 2011 international dollars, as taken from the World Bank. To avoid a mechanical correlation with openness and education, the data for GDP is that of two periods ahead.
The descriptive statistics for all the variables appear in the
Appendix A (
Table A2). Finally,
Table 1 provides a summary of the variables included in the model, the index chosen, their acronyms, and their source.
4. Methodology and Results
Based on the results of the aforementioned literature, our starting point is that there is a negative association between ethnolinguistic diversity and the level of income. As stated in
Section 2, this negative association could be overcome if diversity is handled in an appropriate way. More precisely, we stress the role of social cohesion. Unlike Buitrago et al. [
10], who focus on tolerance, and Van Staveren and Pervaiz [
9], who stress the inclusion of minorities, we point out that education promotes all these values and constitutes the key element for handling diversity and obtaining all its benefits. Therefore, our hypothesis is that diversity is negatively correlated with the level of income per capita when education is absent, but positively correlated when education is present.
In order to test this hypothesis, as a first step, we estimate Equation (6) using EDUCT as the index for education:
The results appear in columns (1), (3), (5), and (7) in
Table 2. As expected, the marginal effect of diversity on income (β
1) is negative and significant for the four indices of diversity, and the impact of education (β
2) is positive.
In a second step, our aim is to verify whether education is capable of overcoming the negative effect of diversity, and if so, at which level of education this occurs. To this end, we estimate Equation (7) where we introduce an interaction term between diversity and an index of education (total education and disaggregated levels):
Columns (2), (4), (6), and (8) in
Table 2 show the results when we consider total education (total average number of schooling years completed among adult people) in the interaction term. Although the interaction term shows a positive coefficient (β
3), it is significant only for ETIN. To test whether the level of education is relevant, the disaggregated levels of education (primary, secondary, and tertiary) are considered in the interaction term. The results in
Table 3 suggest that the level of education attained does indeed matter. When EDUC is the average number of years of primary education completed among adult people, β
3 is positive but non−significant; however, it is positive and significant both for secondary and tertiary education.
Nevertheless, as Brambor et al. ([
38], p. 74) assert, “one cannot determine whether a model should include an interaction term simply by looking at the significance of the coefficient on the interaction term”. As these authors explain, when a multiplicative interaction model is employed, the focus is much more on the marginal effect of the variable of interest on the dependent variable than on the value and significance of the coefficients. In our case, we are interested in determining the level of education at which this marginal effect becomes positive. Recall that the marginal effect of diversity is given by Equation (8):
In order to obtain the precise level of education, the standard error of Equation (8) is required. This is given by:
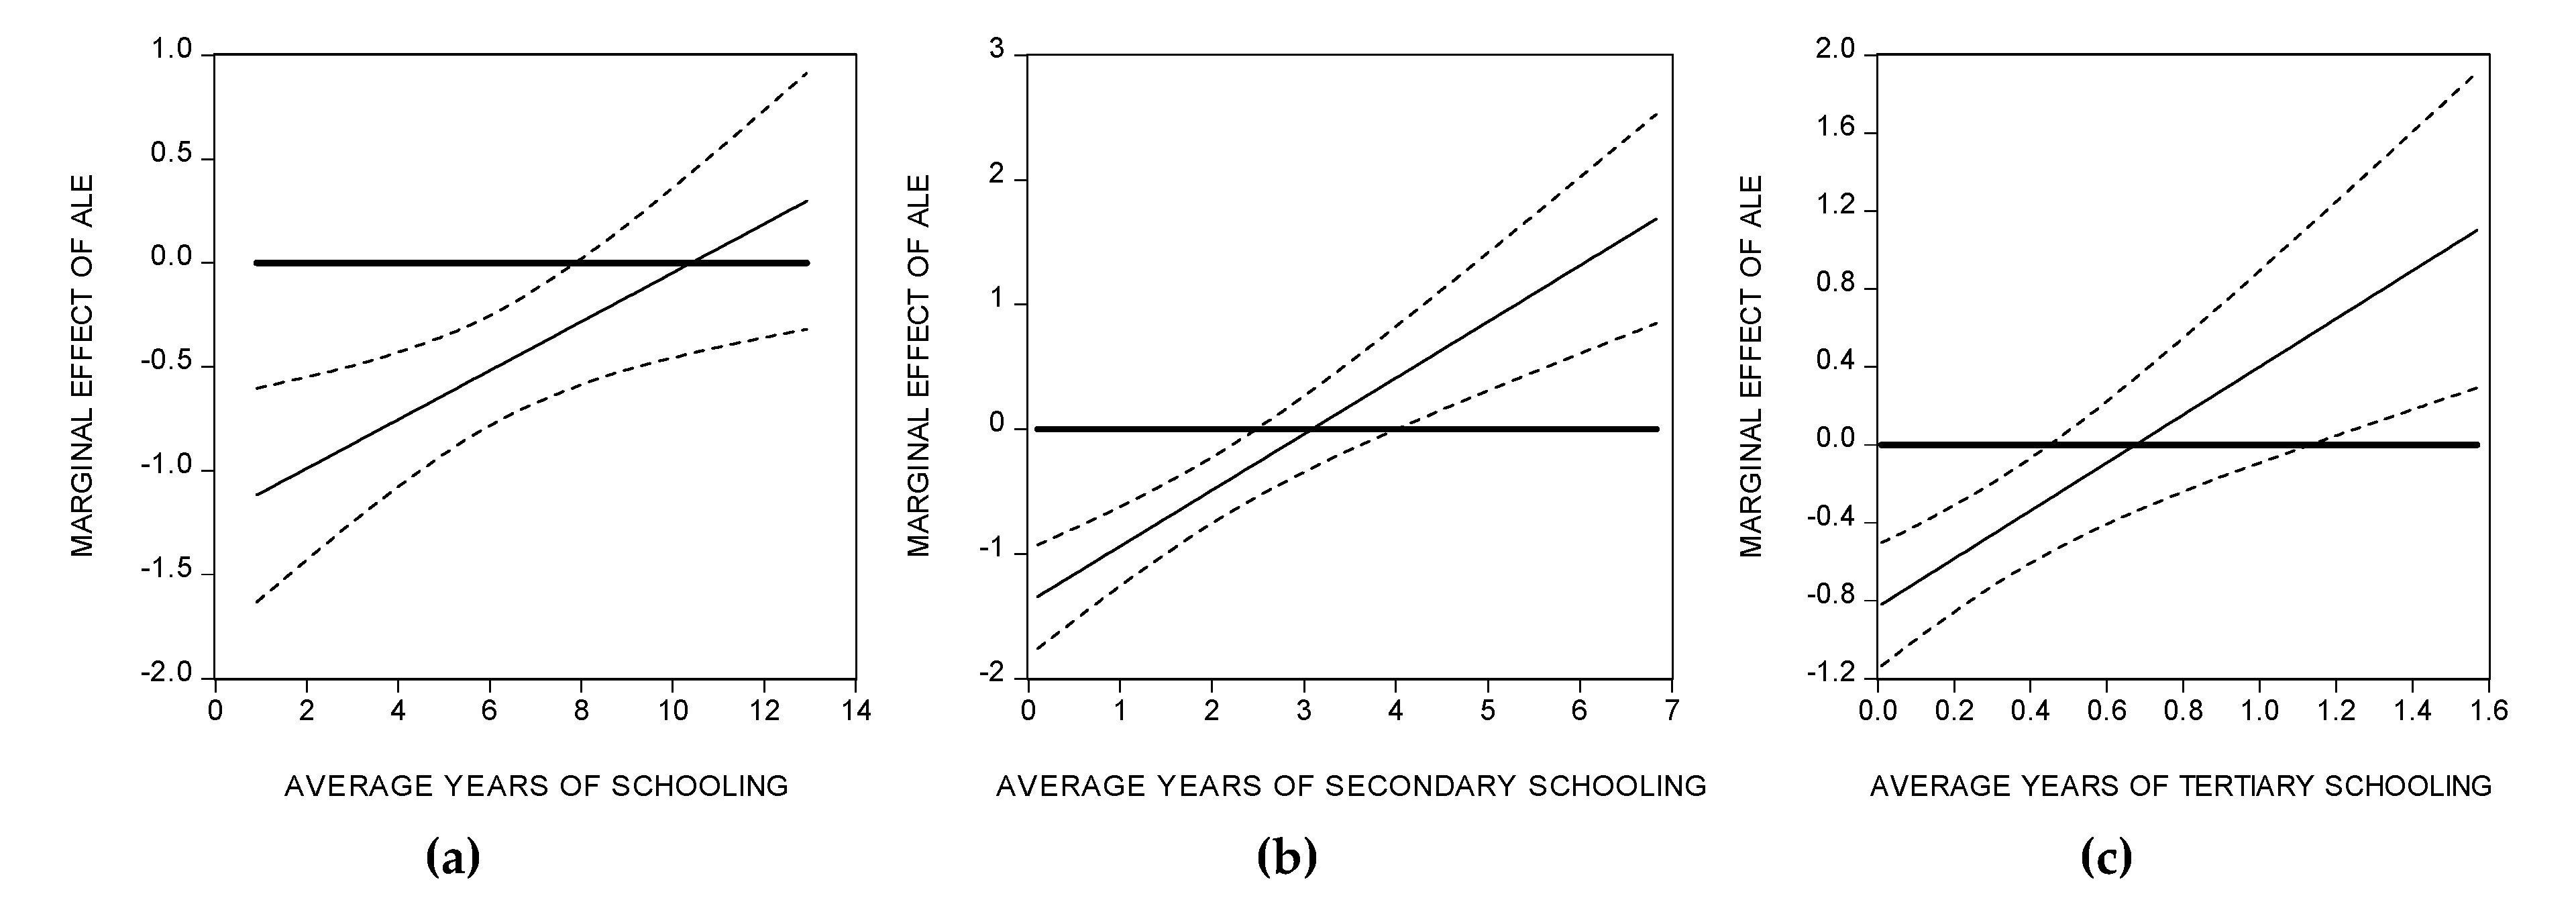
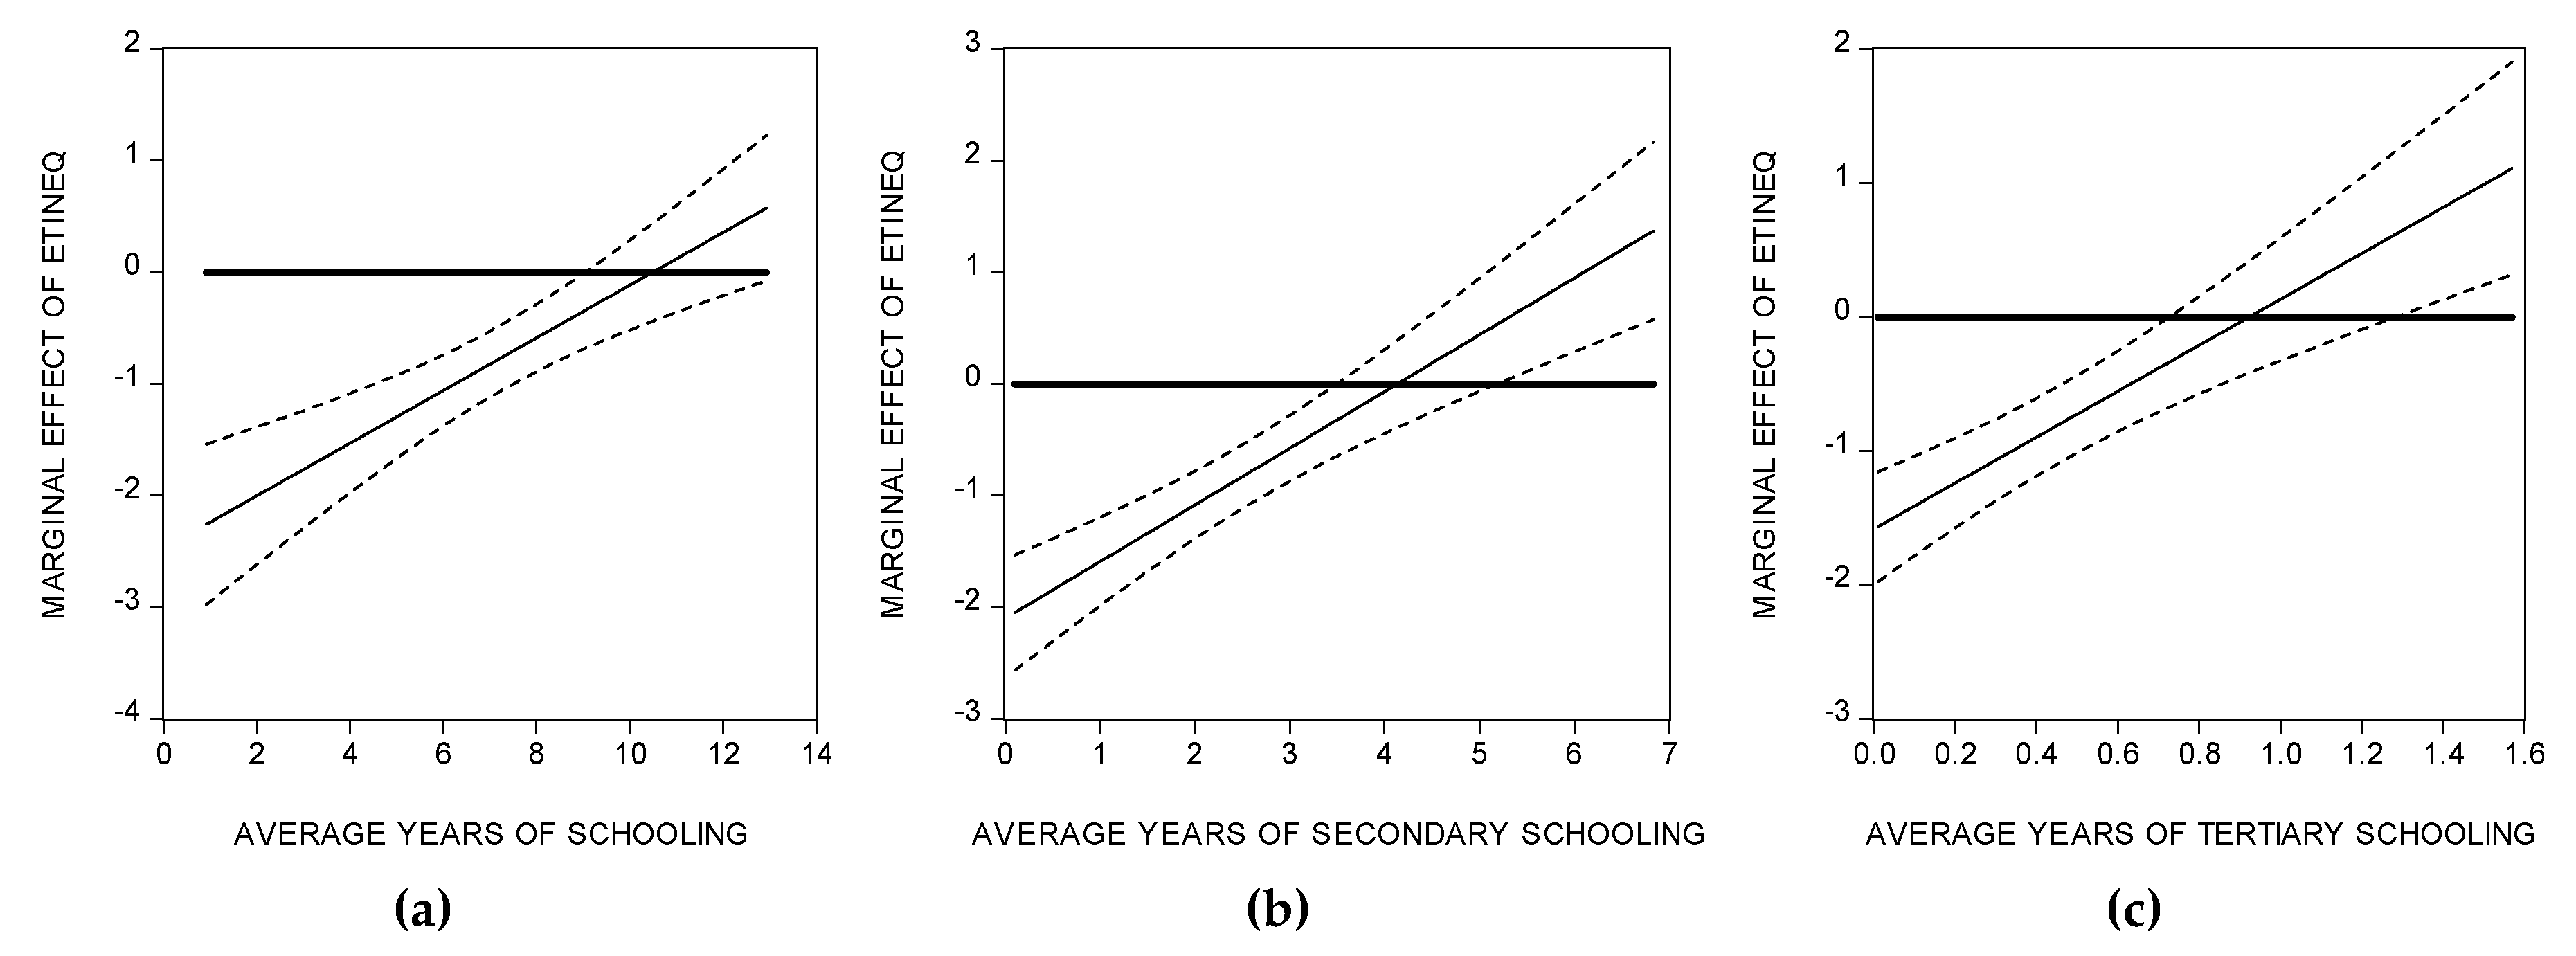
We calculate the marginal effects with a confidence interval of 95%. Results in
Figure 1 and
Figure 2 show that the effects of diversity become positive when a certain number of years of secondary and tertiary schooling are attained: more precisely, more than four years for fractionalization measures and five for ethnic inequality, and approximately a year for tertiary education (both dashed and solid lines over zero) Similar results to those for fractionalization are obtained for the index of diversity proposed by Fearon [
14]. However, with the
ELF index, the number of years is reduced to 2.5 for secondary education and to 0.5 for tertiary education. The descriptive statistic for all countries and results for estimations of (2′) are all presented in
Appendix A (
Table A7 and
Table A8). The results for estimations (3) and (4) using
ELF and the index of Fearon [
14] are available from the authors upon request.
Figure 1 and
Figure 2 omit the results for ALL and ETFRA because they are very similar to those of ALE, and also omit the results with primary education, because years of primary education are not capable of balancing the negative impact of diversity. (The results are available from authors upon request).
5. Discussion and Conclusions
A vast number of empirical studies show that ethnolinguistic diversity is negatively associated to economic performance. In an increasingly heterogeneous world, these results are alarming. They stress the potential adverse effects of diversity, and exacerbate xenophobic attitudes, which, in the end, are extremely harmful. Hence, social welfare requires suitable policy measures to overcome any possible negative effects of ethnic heterogeneity.
It is obvious that countries cannot decide their ethnic composition. However, this is not the point. It cannot be concluded that the best of the scenarios would be a more homogenous society. What matters for development is not so much the number of groups and the differences between them but how groups interact. Therefore, the relevant issues that should be taken into account are related to respect and tolerance between groups, the ability to generate social networks, trust, acceptance of diversity, and participation. All these topics, as mentioned in the paper, correspond to a dimension of social cohesion. In other words, we argue that it is social cohesion which is necessary for a better economic performance, and social cohesion is highly relevant in a peaceful interaction between people, with homogeneity being only a marginal issue.
From this perspective, we stress the role of education in providing the tools required to develop the attitudes and behaviour that foster social cohesion. This allows heterogeneity to be discovered as being much more enriching than homogeneity since it implies different skills and capacities and different ways of approaching problems and solving them.
In order to test our hypothesis, a sample of 116 developing and developed countries and several indices have been employed to measure ethnic diversity, both fractionalization indices and indices that include a measure of distance between ethnic groups. A first look at our data shows that the average for various ethnolinguistic diversity indices decreases from low−income to high−income countries. Moreover, most of the countries with all indices over (below) 0.5 are low−income (high−income) countries.
Our estimations, in line with the previous literature, show that the marginal effect of ethnolinguistic diversity on income per capita is negative when education is absent. However, we find that the presence of education is capable of mitigating the adverse effects of ethnolinguistic fractionalization on the level of income. More precisely, the attainment of certain levels of education, especially secondary and tertiary, succeeds in reversing the sign of the marginal effect of diversity on GDP per capita for all indices used herein. Therefore, we respond affirmatively to the first two research questions laid out in the introduction: (1) Can education manage to alleviate the adverse effects of ethnic diversity on economic performance? and (2) Is education capable of reversing these adverse effects even when the diversity indices that consider distance between groups are included in the analysis?
Furthermore, an answer to the third question (Which level of education is required in order to overcome the possible adverse effects of ethnolinguistic diversity?) is also provided: We find that, for fractionalization indices provided by Alesina et al. [
3] and by Montalvo and Querol [
13], more than four years of secondary education and a year of tertiary education are required to reverse the negative effect of fractionalization. This result is also confirmed for the fractionalization index proposed by Fearon [
14]. When the ethnic inequality index is used [
17], which measures the economic differences between ethnic groups in the same country, the number of years of secondary education required increases by one year.
The results presented in this paper provide a new insight into the studies on the effects of ethnolinguistic diversity on economic performance, by stressing the role of education as a means of fostering social cohesion and, accordingly, by enabling the possible benefits derived from ethnic diversity to be used to full advantage.
Moreover, these results could shed more light on the debate on the effects of diversity and on the responsibility of the Governments in handling diversity. Current societies are increasingly heterogeneous, and, when properly managed, diversity might notably enrich both society and the economy. In this respect, we have focused on social cohesion, and particularly on education, as one of the main elements to be taken into account in the design of policy measures. Likewise, other ingredients of social cohesion have been introduced in the form of tolerance and the inclusion of minorities. The preliminary results obtained and the relevance of the topic in a world with growing migratory flows pave the way for further research in this area. Moreover, the implications of the qualitative aspects of education appear as a relevant issue that should be to take into account in further research. In this sense, we intend to explore the effects of incorporating the characteristics of different educational systems in our analysis.


