Article

Ecological Environment Vulnerability and Driving Force of Yangtze River Urban Agglomeration

1
Binjiang College, Nanjing University of Information Science & Technology, Wuxi 214105, China
2
School of Management Science and Engineering, Nanjing University of Information Science & Technology, Nanjing 210044, China
3
School of Business, Nanjing University of Information Science and Technology, Nanjing 210044, China
4
Department of Mathematics and Computer Science, University of North Carolina at Pembroke, Pembroke, NC 28372, USA
*
Authors to whom correspondence should be addressed.
Sustainability 2019, 11(23), 6623; https://doi.org/10.3390/su11236623
Submission received: 15 September 2019 / Revised: 19 November 2019 / Accepted: 21 November 2019 / Published: 23 November 2019

Abstract

:
The vulnerability of ecological environment threatens social and economic development. Recent studies failed to reveal the driving mechanism behind it, and there is little analysis on the spatial clustering characteristics of the vulnerability of urban agglomerations. Therefore, this article estimates ecological environment vulnerability in 2005, 2011, and 2017, determines Moran Index (MI) with spatial autocorrelation model, analyzes the spatial-temporal difference characteristics of ecological environment vulnerability of Yangtze River Urban Agglomeration and the spatial aggregation effect, and discusses its driving factors. The study results estimate that the overall vulnerability index of the Yangtze River Urban Agglomeration is in a mild fragile state. However, most fragile and slightly fragile cities are developing in the direction of moderate to severe vulnerability. The spatial agglomeration effect of the ecological environment vulnerability of the Yangtze River Urban Agglomeration is not obvious, and the effect of mutual ecological environment influence among cities is not obvious. Moreover, the driving factors of ecological environment vulnerability of Yangtze River city group changed from natural factors to social economic factors and then to policy factors. It is necessary to develop an ecological economy, coordinate the spatial agglomeration of urban agglomerations, and make balance the internal differences of urban agglomerations.

1. Introduction

Urban agglomeration is an important form of urban regionalization development [1]. However, in the process of urban agglomeration development, the construction of ecological environment is neglected. Consequently, contradiction between ecology and urban agglomeration development gradually developed, and the vulnerability of ecological environment has become more prominent. In the early 20th century, Clement, an American scholar, proposed the concept of “ecological transition zone” [2]. The ecological environment vulnerability refers to the weak ability of the ecological environment that can resist when the regional environment is externally interfered [3]. The ability to recover after being disturbed is low, and it is difficult to change the current vulnerability status. Currently, ecological and environmental problems such as global warming has reduced per capita arable land, forest resources, supply of fresh water, and biological species [4]. This destruction has increased the vulnerability of the ecological environment.
China’s urban ecological environment has low carrying capacity, is sensitive and difficult to recover, and has weak anti-interference ability. Barry and Wandel (2006) [5] studies the ecological adaptability of communities but have not focused on urban agglomerations. However, in the mature stage of urban development, the collection of highly integrated cities forms urban agglomerations [
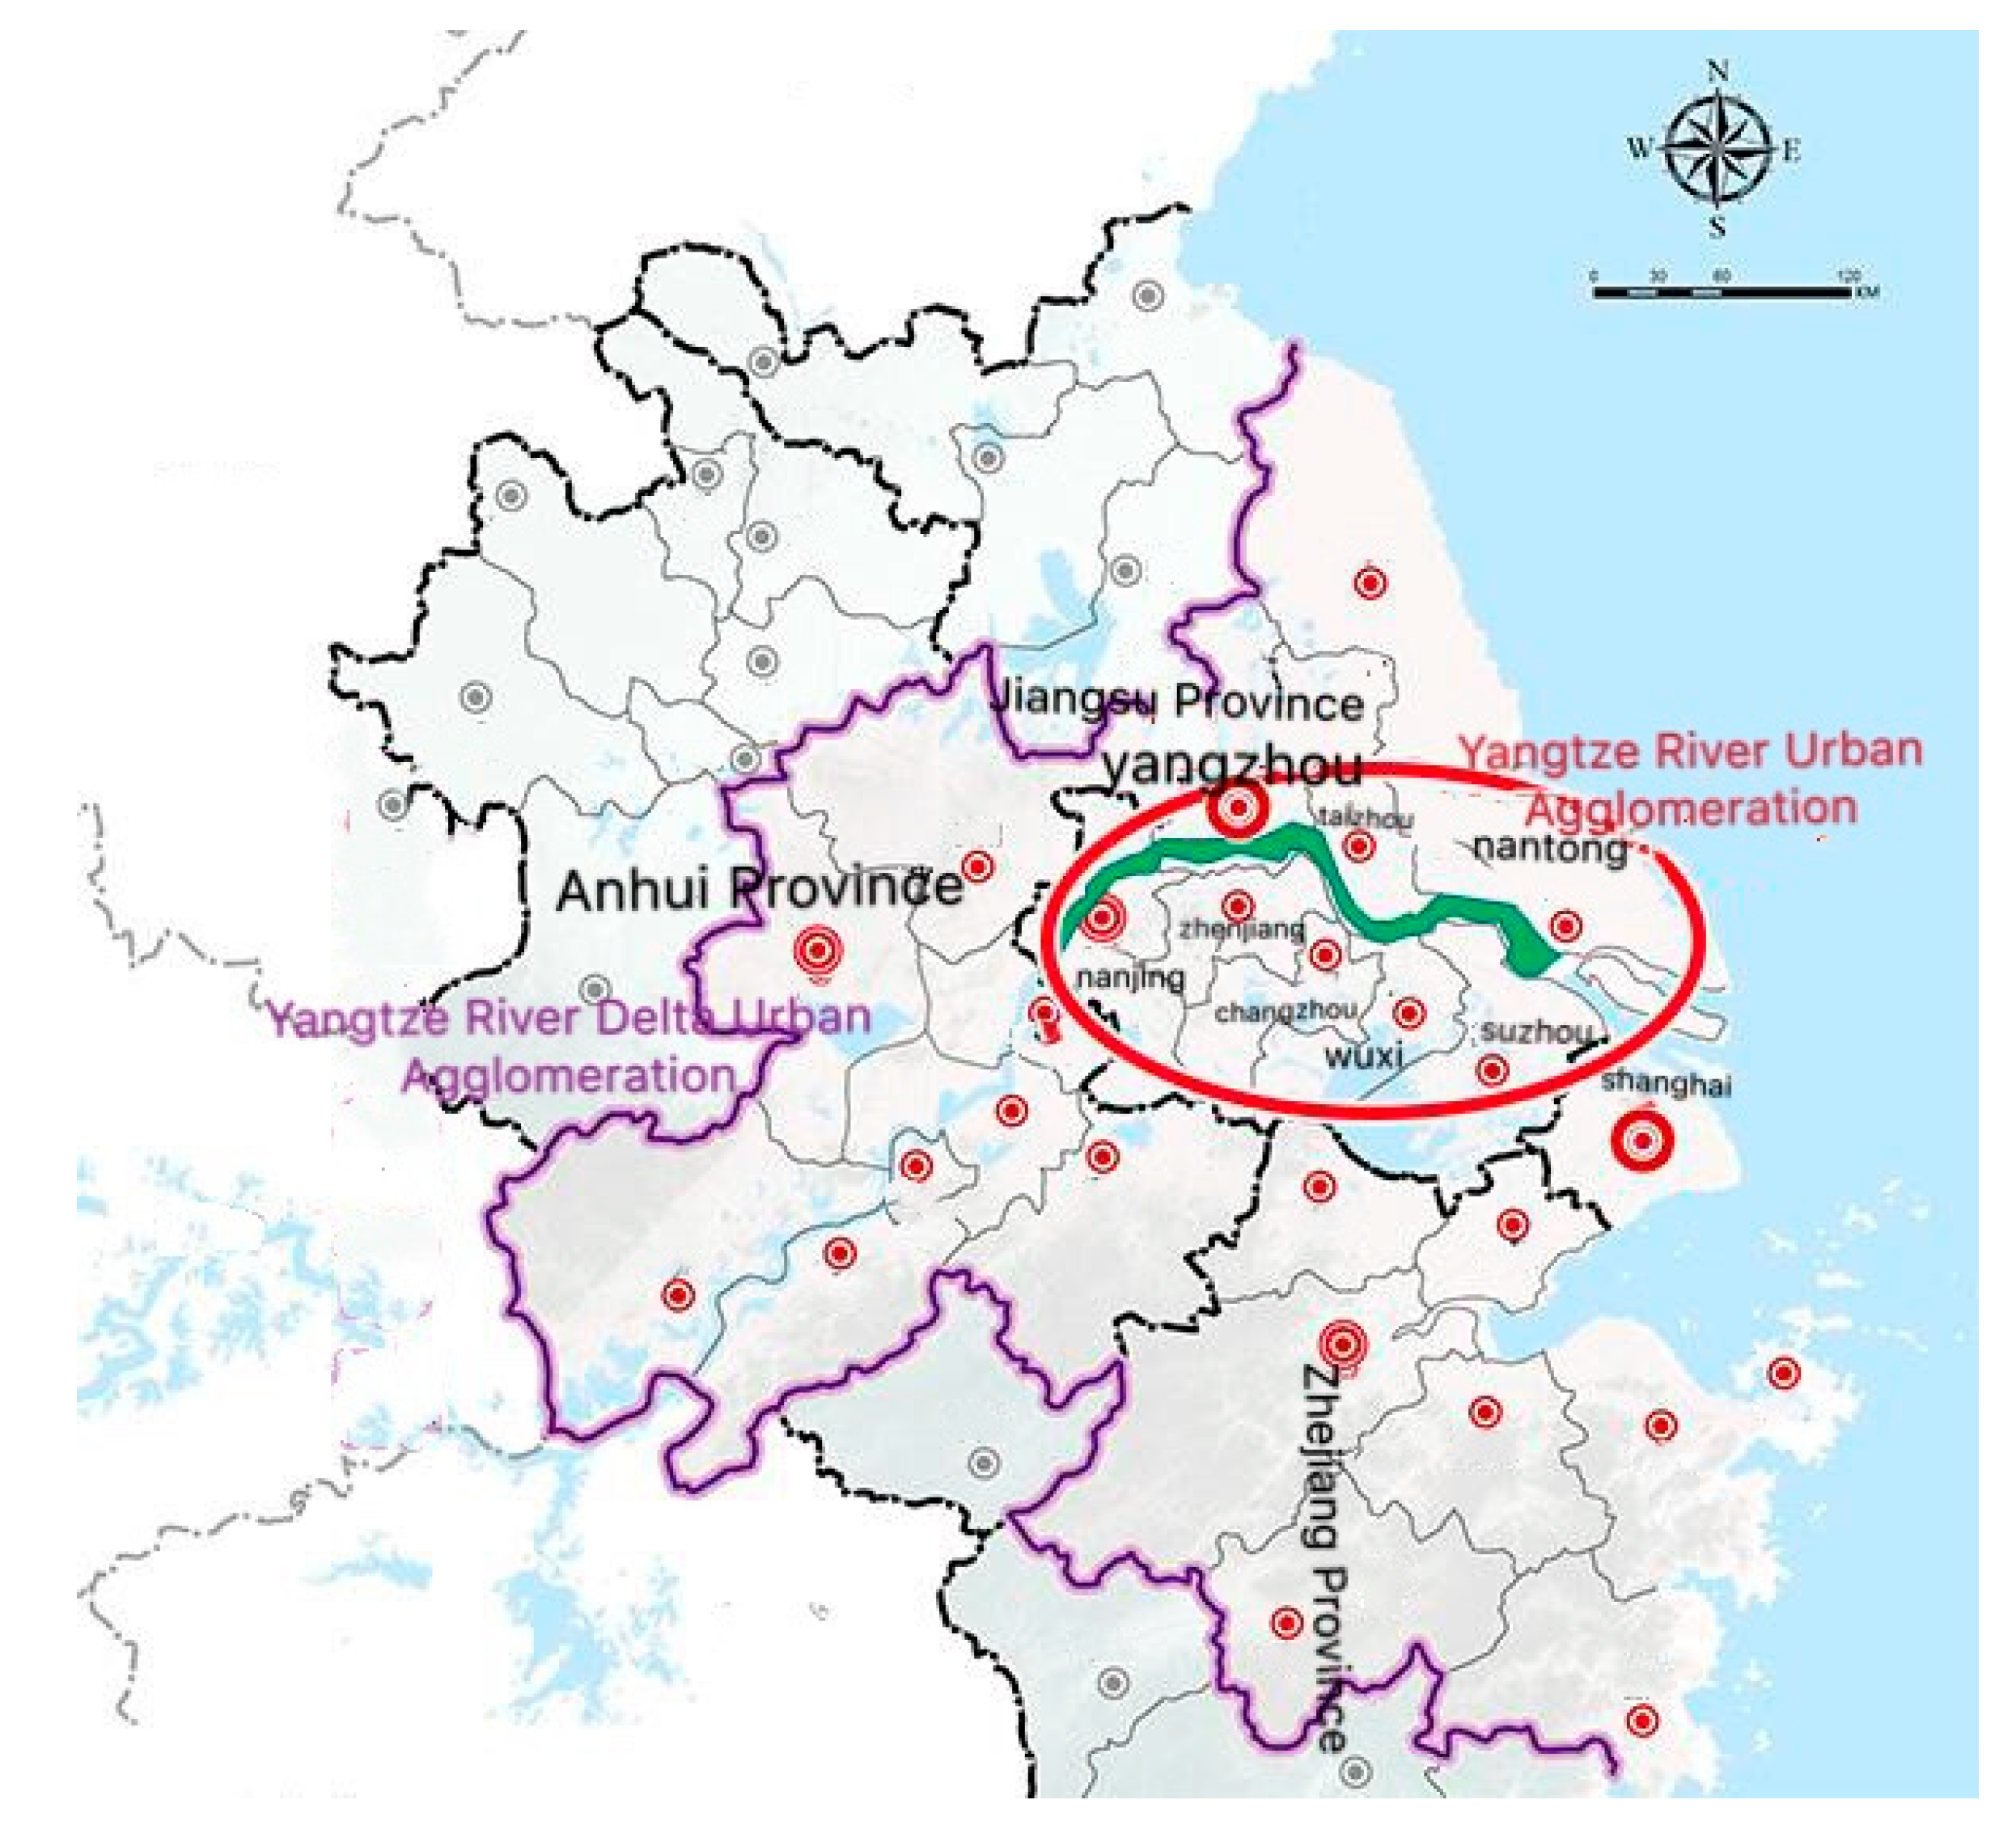
6]. Under the rapid development of the Yangtze River Urban Agglomeration, it faces problems such as over-exploitation, lagging ecological governance, and imperfect environmental governance mechanisms. These restrict the realization of high-quality development of the ecological environment and the upgrading of urban agglomerations [7]. From the perspective of ecological environment vulnerability, this article studies the ecological environment of the Yangtze River Urban Agglomeration, solves outstanding environmental problems, examines its ecological environment vulnerability, and explores the driving factors behind it [8].
At present, scholars at home and abroad have carried out a wealth of research on the vulnerability of ecological environment and achieved fruitful results. From the perspective of research objects, most of them are concentrated in river basins [9,10], extremely arid desert climate areas [11], developed cities [12], and areas rich in ecological resources [13], but for the newly divided Yangtze River city group with high level of economic development, high intensity of industrial agglomeration and opening up in recent years. There are few studies on environmental vulnerability. In terms of research methods, the current research on ecological vulnerability evaluation mainly includes SRP evaluation model [12], analytic hierarchy process [14], fuzzy cloud model [15], comprehensive index method [16], and principal component analysis method [12]. At the same time, combining MI and Lisa cluster map [17], geographic information system, and remote sensing data image [18], quantitative analysis of the driving forces affecting the ecological vulnerability of the study area is carried out. For example, Li et al. (2016) [12] used the SRP evaluation model to obtain the spatiotemporal dynamics of ecological environment vulnerability in Chaoyang County, Beijing, China. Li et al. (2016) [12] used principal component analysis to explore the main driving factors of ecological environment vulnerability. However, the existing research methods have the following problems. First, the selection of evaluation factors will have the influence of human subjective factors, which is difficult to reflect the objectivity of evaluation indicators, and the subjective weighting of evaluation factors will also affect the objectivity of results. Second, the repeatability of evaluation indicators, whether it is natural indicators, social and economic indicators, or policy indicators, will have internal indicators. In the evaluation process, there will be redundancy and repeated conclusions. From the perspective of research content, most of them are from the analysis of ecological environment vulnerability, such as biological quantitative characteristics, spatial distribution and differences. The analysis of driving factors and spatial agglomeration characteristics of ecological environment vulnerability in different years is insufficient.
According to the above analysis, the work of this paper is as follows. First, to build the evaluation index of ecological environment vulnerability of Yangtze River Urban Agglomeration. Second, to calculate the index of ecological environment vulnerability, to use the spatial principal component analysis method and Moran index analysis, and to get the interaction relationship between ecological environment vulnerability regions. Finally, to analyze the driving mechanism of ecological environment vulnerability of Yangtze River Urban Agglomeration. This paper summarizes the temporal and spatial evolution law of the ecological environment vulnerability of the Yangtze River Urban Agglomeration and puts forward suggestions and Countermeasures for the green development of the ecological environment of the Yangtze River Urban Agglomeration.

2. Research Methodology

2.1. Study Area

The Yangtze River Urban Agglomeration is located in the southeastern part of China, including Jiangsu Nanjing, Zhenjiang, Changzhou, Wuxi, Suzhou, Yangzhou, Taizhou, and Nantong along the Yangtze river [19]. Figure 1 illustrates the key ecological protection area for the ecological environment of the Yangtze River Urban Agglomeration. Within the red circle is the Yangtze River city group, and each red circle is a city. It is quite necessary to work on environmental vulnerability to create a good ecological environment and improve the protection mechanism of the Yangtze river basin [20].

2.2. Data Source

The data of elevation, slope, and land use degree were obtained from remote sensing maps and DEM analysis of elevation, slope, and land use degree of each city. Landscape diversity is based on land related data. Lithology and soil type data were mainly obtained by digitizing geological maps on the website of China geological bureau. The normalized difference vegetation index (NDVI) was sourced from the Resource and Environmental Science Data Center of the Chinese Academy of Sciences (www.resdc.cn). The annual precipitation, annual temperature population density, per capita GDP, and road network density were mainly derived from the annual statistical yearbook and statistical bulletin of the municipal statistics bureau of the Yangtze River Urban Agglomeration.

2.3. Construction of Ecological Environment Vulnerability Assessment Model

Referring to the index selection method of Tian (2012) [21] genetic model, 12 indicators such as elevation and slope were selected to construct the evaluation index system (Table 1). Among them, the slope and elevation are positive indicators, reflecting the characteristics of topography and geomorphology. When the slope and elevation are larger, the stability is worse, and it is easy to be eroded by rainstorm. The soil type and lithology are literal data, different types of soil reflect the intensity of erosion, and the lithology reflects the geological conditions of the area, reflecting the weathering resistance. NDVI is a negative indicator, reflecting the growth of vegetation, and the larger the value is, the more stable the ecosystem is, while the more moderate the annual average precipitation is, the more abundant the annual average precipitation is. The more negative the annual average temperature is, the more stable the ecosystem is. The population density, per capita GDP, and road network density are positive indicators, which reflect the stress of the social and economic development on the ecological environment. The landscape diversity and land use degree reflect the environmental pressure brought by unreasonable land use. Land use degree is a positive indicator while landscape diversity is a negative indicator.

2.4. Standardization of the Data

Following Li (2016) [12] 12 indicators such as elevation, slope, lithology, soil type, NDVI, annual precipitation, annual temperature, population density, per capita GDP, road network density, landscape diversity, and land use degree in 2005, 2011, and 2017 were selected. The original digital data need to input, but the lithology and soil type are written data which is not convenient for data analysis. Therefore, following Lin (2018) [17] on the basis of the cause analysis, the standardized valuation method of was used and two indexes of lithology and soil type were normalized to 2, 4, 6, 8, and 10 to ensure the analysis of data and make it unified (Table 2).
According to the grading standard of Du (2016) [22] ecological environment vulnerability assessment, the ecological environment vulnerability index in 2005 was graded by natural breaks method, and the grading of ecological environment vulnerability index is shown in Table 3 below.
Following Ord and Arthur (2010) [25], Local Indicators of Spatial Association (LISA) clustering map was obtained by spatial clustering on the calculation results of the local MI. The meaning of different spatial aggregation modes is defined in Table 4.

3. Analytical Methods

3.1. Principal Component Analysis

The principal component analysis can simplify through dimensionality reduction analysis.
F i = α 1 x 1 + α 2 x 2 + α 3 x 3 + + α n x n
where F i is the i-th principal component, α is a feature vector, and x i , i { 1 , 2 , 3 n } is the selected evaluation index.

3.2. MI Analysis

The current spatial autocorrelation statistical analysis methods mainly include MI and Geary’s C index. Following Cliff and Ord (1981) [26], the global and local MI were used to evaluate and analyze the ecological vulnerability. The spatial distribution diagram and LISA cluster diagram of vulnerability were drawn to facilitate the analysis of spatiotemporal differences of ecological environment vulnerability and its driving forces in the following sections.
The grading standard of global MI can be calculated as:
I = i = 1 n j = 1 n w i j ( x i x ) ( x j x ) i = 1 n j = 1 n w i j i = 1 n ( x i x ) 2
The calculation formula for the local MI is given as:
I = ( x i x ) s 2 j w i j ( x j x )
where I represents the MI, xi, xj represents the mean of the vulnerability index in the i-th, j-th evaluation unit, x refers to the mean of the vulnerability of all evaluation units, Wij refers to the spatial weight matrix, and S represents the sum of the elements of the spatial weight matrix.

3.3. Ecological Environment Vulnerability Index

The ecological environment vulnerability index of the Yangtze River Urban Agglomeration can be determined by using Equation (4):
E V I = r 1 y 1 + r 2 y 2 + r 3 y 3 + + r n y n
where EVI is the eco-vulnerability composite index, r i is the contribution rate of the i-th spatial principal component, and y i is the value of the i-th spatial principal component.

4. Results and Discussion

4.1. Ecological Environment Vulnerability and its Ecological Characteristics

The Eco-environment Vulnerability Index (EVI) was used to evaluate the ecological environment vulnerability of the Yangtze River Urban Agglomeration. Principal component analysis was used to analyze 12 evaluation indicators to eliminate the overlap and correlation in the indicator information. The four principal components of 2005, 2011, and 2017 were determined according to the cumulative contribution rate of the principal component of 85% or more (Table 5). Among them, the cumulative contribution rate in 2005 was 90.64%, the cumulative contribution rate in 2011 was 88.36%, and the cumulative contribution rate in 2017 was 92.14%, respectively.
Using data of Table 5, the Equations (5)–(7) can be estimated.
E V I 2005 = 0.3497 × Y 1 + 0.2662 × Y 2 + 0.1877 × Y 3 + 0.1028 × Y 4
E V I 2011 = 0.3202 × Y 1 + 0.2179 × Y 2 + 0.1824 × Y 3 + 0.1632 × Y 4
E V I 2017 = 0.2967 × Y 1 + 0.2912 × Y 2 + 0.1841 × Y 3 + 0.1494 × Y 4
where Y 1 Y 4 are the normalized values of the first four principal components extracted by spatial principal component analysis. Due to the excessive number of charts related to normalized values, EVI in 2005, 2011, and 2017 are mainly shown.
Table 6 depicts that only Nanjing was severely vulnerable in 2005 and 2011. In 2017, both Nanjing and Suzhou were severely vulnerable. Nantong has been in a state of mild vulnerability, and Nantong city ranked first in the province in terms of its green development index in 2016. Recently, with the implementation of ecological protection related policies, the ecological environment vulnerability index of the Yangtze River Urban Agglomeration has gradually become better, but the economic development would always be moderately and severely fragile with the development and utilization of the ecological environment.

4.2. Characteristics of Time Difference of Ecological Environment Vulnerability

The time distribution characteristics of the ecological environment vulnerability of the Yangtze River Urban Agglomeration from 2005 to 2017 were obtained (Figure 2). Results found that in 2005, Nanjing was relatively fragile, while Zhenjiang, Changzhou, and Suzhou were moderately vulnerable. Taizhou and Wuxi were slightly fragile, and the rest of the cities were slightly vulnerable. In 2011, Nanjing and Suzhou were relatively weak and vulnerable. Yangzhou was in the middle vulnerability, Nantong was slightly fragile, and other cities were slightly vulnerable. In 2017, Nanjing and Suzhou were relatively weak, while Zhenjiang and Wuxi were moderately vulnerable. Nantong was slightly fragile, and the rest of the cities were slightly vulnerable. Overall, the ecological environment of the Yangtze River Urban Agglomeration is moderately and slightly fragile. Our results are in line with [27]. (In Figure 2, “horizontal ordinate 1” represents 2005, “horizontal ordinate 2” represents 2011, and “horizontal ordinate 3” represents 2017. The vertical coordinate represents the EVI.)
Figure 3 illustrates that the vulnerability index of Nanjing has declined, but it is still in a severe vulnerability. The vulnerability index of Zhenjiang, Changzhou, Suzhou, and Yangzhou has changed repeatedly, showing a trend of first rise and then fall or, first fall and then rise. Suzhou and Yangzhou have improved gradually, but other regions were more serious. The severity in Taizhou was increased year by year but the vulnerability index was always low. The vulnerability index of Nantong was decreased year by year and the ecological environment was excellent.

4.3. Spatial Difference Characteristics of Ecological Environment Vulnerability

The distribution map of the ecological environment vulnerability of the Yangtze River Urban Agglomeration illustrates that during 2005 and 2017, the ecological environment fragility of the Yangtze River Urban Agglomeration showed an increasing trend from the central to the northwest. The east and west were more vulnerable and the middle was weaker. Moreover, between 2005 and 2011, the ecological environment vulnerability of Nanjing and Suzhou were basically relatively fragile, which was closely related to the rapid development of industrial economy and over-exploitation in recent years (Figure 4). Overall, between 2005 and 2017, the vulnerable areas of the Yangtze River Urban Agglomeration were mainly distributed in the southeast and west and the vulnerability of the central and northeastern parts did not change significantly.

4.4. Characteristics of Spatial Clustering of Ecological Environment Vulnerability

4.4.1. Global MI

Based on the evaluation results of ecological environment vulnerability in 2005, 2011, and 2017, the global MI of ecological environment vulnerability was calculated (Table 7). Moran Index is calculated as −0.0567, −0.2636, and −0.0745, indicating that there is a negative correlation, which is not significant. It is speculated that this is related to the selected indicators.

4.4.2. Local MI

On the basis of the global MI, the local MI was analyzed and a LISA clustering map is drawn as to explore the vulnerability aggregation state (Figure 5). Since the analysis in 2017 showed no correlation, the LISA maps in 2005 and 2011 did not change, and only the ecologically vulnerable LISA cluster map in 2005 was retained. From the perspective of space, in 2005 and 2011, the ecological environment vulnerability of the Yangtze River Urban Agglomeration has showed a small spatial agglomeration, especially in Suzhou, showing high-low concentration and indicating that there was no obvious spatial agglomeration. The low-low concentration of the Taizhou area indicates that the ecological environment of the area is better.

4.5. Analysis of the Driving Force of Ecological Environment Vulnerability

Using principal component analysis, the Yangtze River Urban Agglomeration spatial and temporal differences of ecological environment vulnerability and its driving force was analyzed for 2005, 2011, and 2017 using the indexes of ecological environment vulnerability.

4.5.1. Analysis of the Driving Force of Ecological Environment Vulnerability (2005)

In 2005, in the PC1, the contribution rate of annual average precipitation and road network density is large; in the PC2, the contribution rate of NDNI is large; in the PC3, the contribution rate of slope is large; in the PC4, the contribution rate of lithology is large (Table 8). This is in line with the rapid development of social economy in the region and the impact of industrial development on the ecological environment has initially appeared, but the main driving factor is the natural factor.

4.5.2. Analysis of the Driving Force of Ecological Environment Vulnerability (2011)

In the PC1 in 2011, the larger contribution rate is population density and land use degree, indicating that with the development and utilization of land, its impact on environmental vulnerability is gradually increasing. In the PC2, the greater contribution rate is road network density; in the PC3, the greater contribution rate is slope; and in the PC4, the greater contribution rate is lithology (Table 9). Compared with 2005, with the sustained and high-speed development of social economy, more social and economic factors have become the driving factors of the vulnerability of ecological environment. The reason lies in that in 2011, cities first developed industrial economy, and the increase of personnel density indirectly affected the intensity of land development. However, the overall topographic and geomorphic characteristics have not changed greatly, so the slope and lithology are still the main components.

4.5.3. Analysis of the Driving Force of Ecological Environment Vulnerability (2017)

In 2017, in the PC1, the larger contribution rate is population density and land use degree, indicating that with the development and utilization of land, its impact on environmental vulnerability is gradually increasing. In the PC2, the greater contribution rate is road network density; in the PC3, the greater contribution rate is slope; and in the PC4, the greater contribution rate is lithology (Table 10). Compared with the driving factors of ecological environment vulnerability in 2011, only the population density is still the main component because the government carries out a series of ecological protection leading areas, promotes environmental supervision reform, etc. With the increase of environmental protection and environmental awareness, policy factors become the main driving force of ecological environment vulnerability.
Results found that in 2005, urban development paid more attention to develop rapidly, ignoring the ecological environment protection under the blind development economy. Since 2011, socioeconomic factors have become the main driving force of ecological environment vulnerability, indicating that the ecological environment of the Yangtze River Urban Agglomeration is increasingly affected by human socioeconomic activities. Cities with better development momentum are beginning to realize the importance of environmental protection. These findings are in line with [28].
In 2017, the Yangtze River Urban Agglomeration found negative effects of human activities on the ecological environment. Zhao et al. (2006) [29] conducted a study on the ecological consequences of rapid urban expansion in Shanghai province of China and also found negative interaction of human activities with ecological environment. Implementation of environmental policies are required to protect ecological system [30]. However, due to weak ecological resilience, it takes years of efforts to restore the ecological environment. Once the ecological environment is destroyed, it takes 100 years to recover, but with the changes in driving factors, it also reflects that the environmental behavior of these years is still effective [31].

5. Conclusion and Recommendations

Taking the Yangtze River Urban Agglomeration as the research object, the dynamic ecological environment vulnerability index of each region is calculated and classified. Based on the Moran Index (MI), the spatial agglomeration characteristics were obtained, and the spatial and temporal distribution characteristics and driving forces of the ecological environment vulnerability in the region were explored. From the analysis, the results can be summarized as:
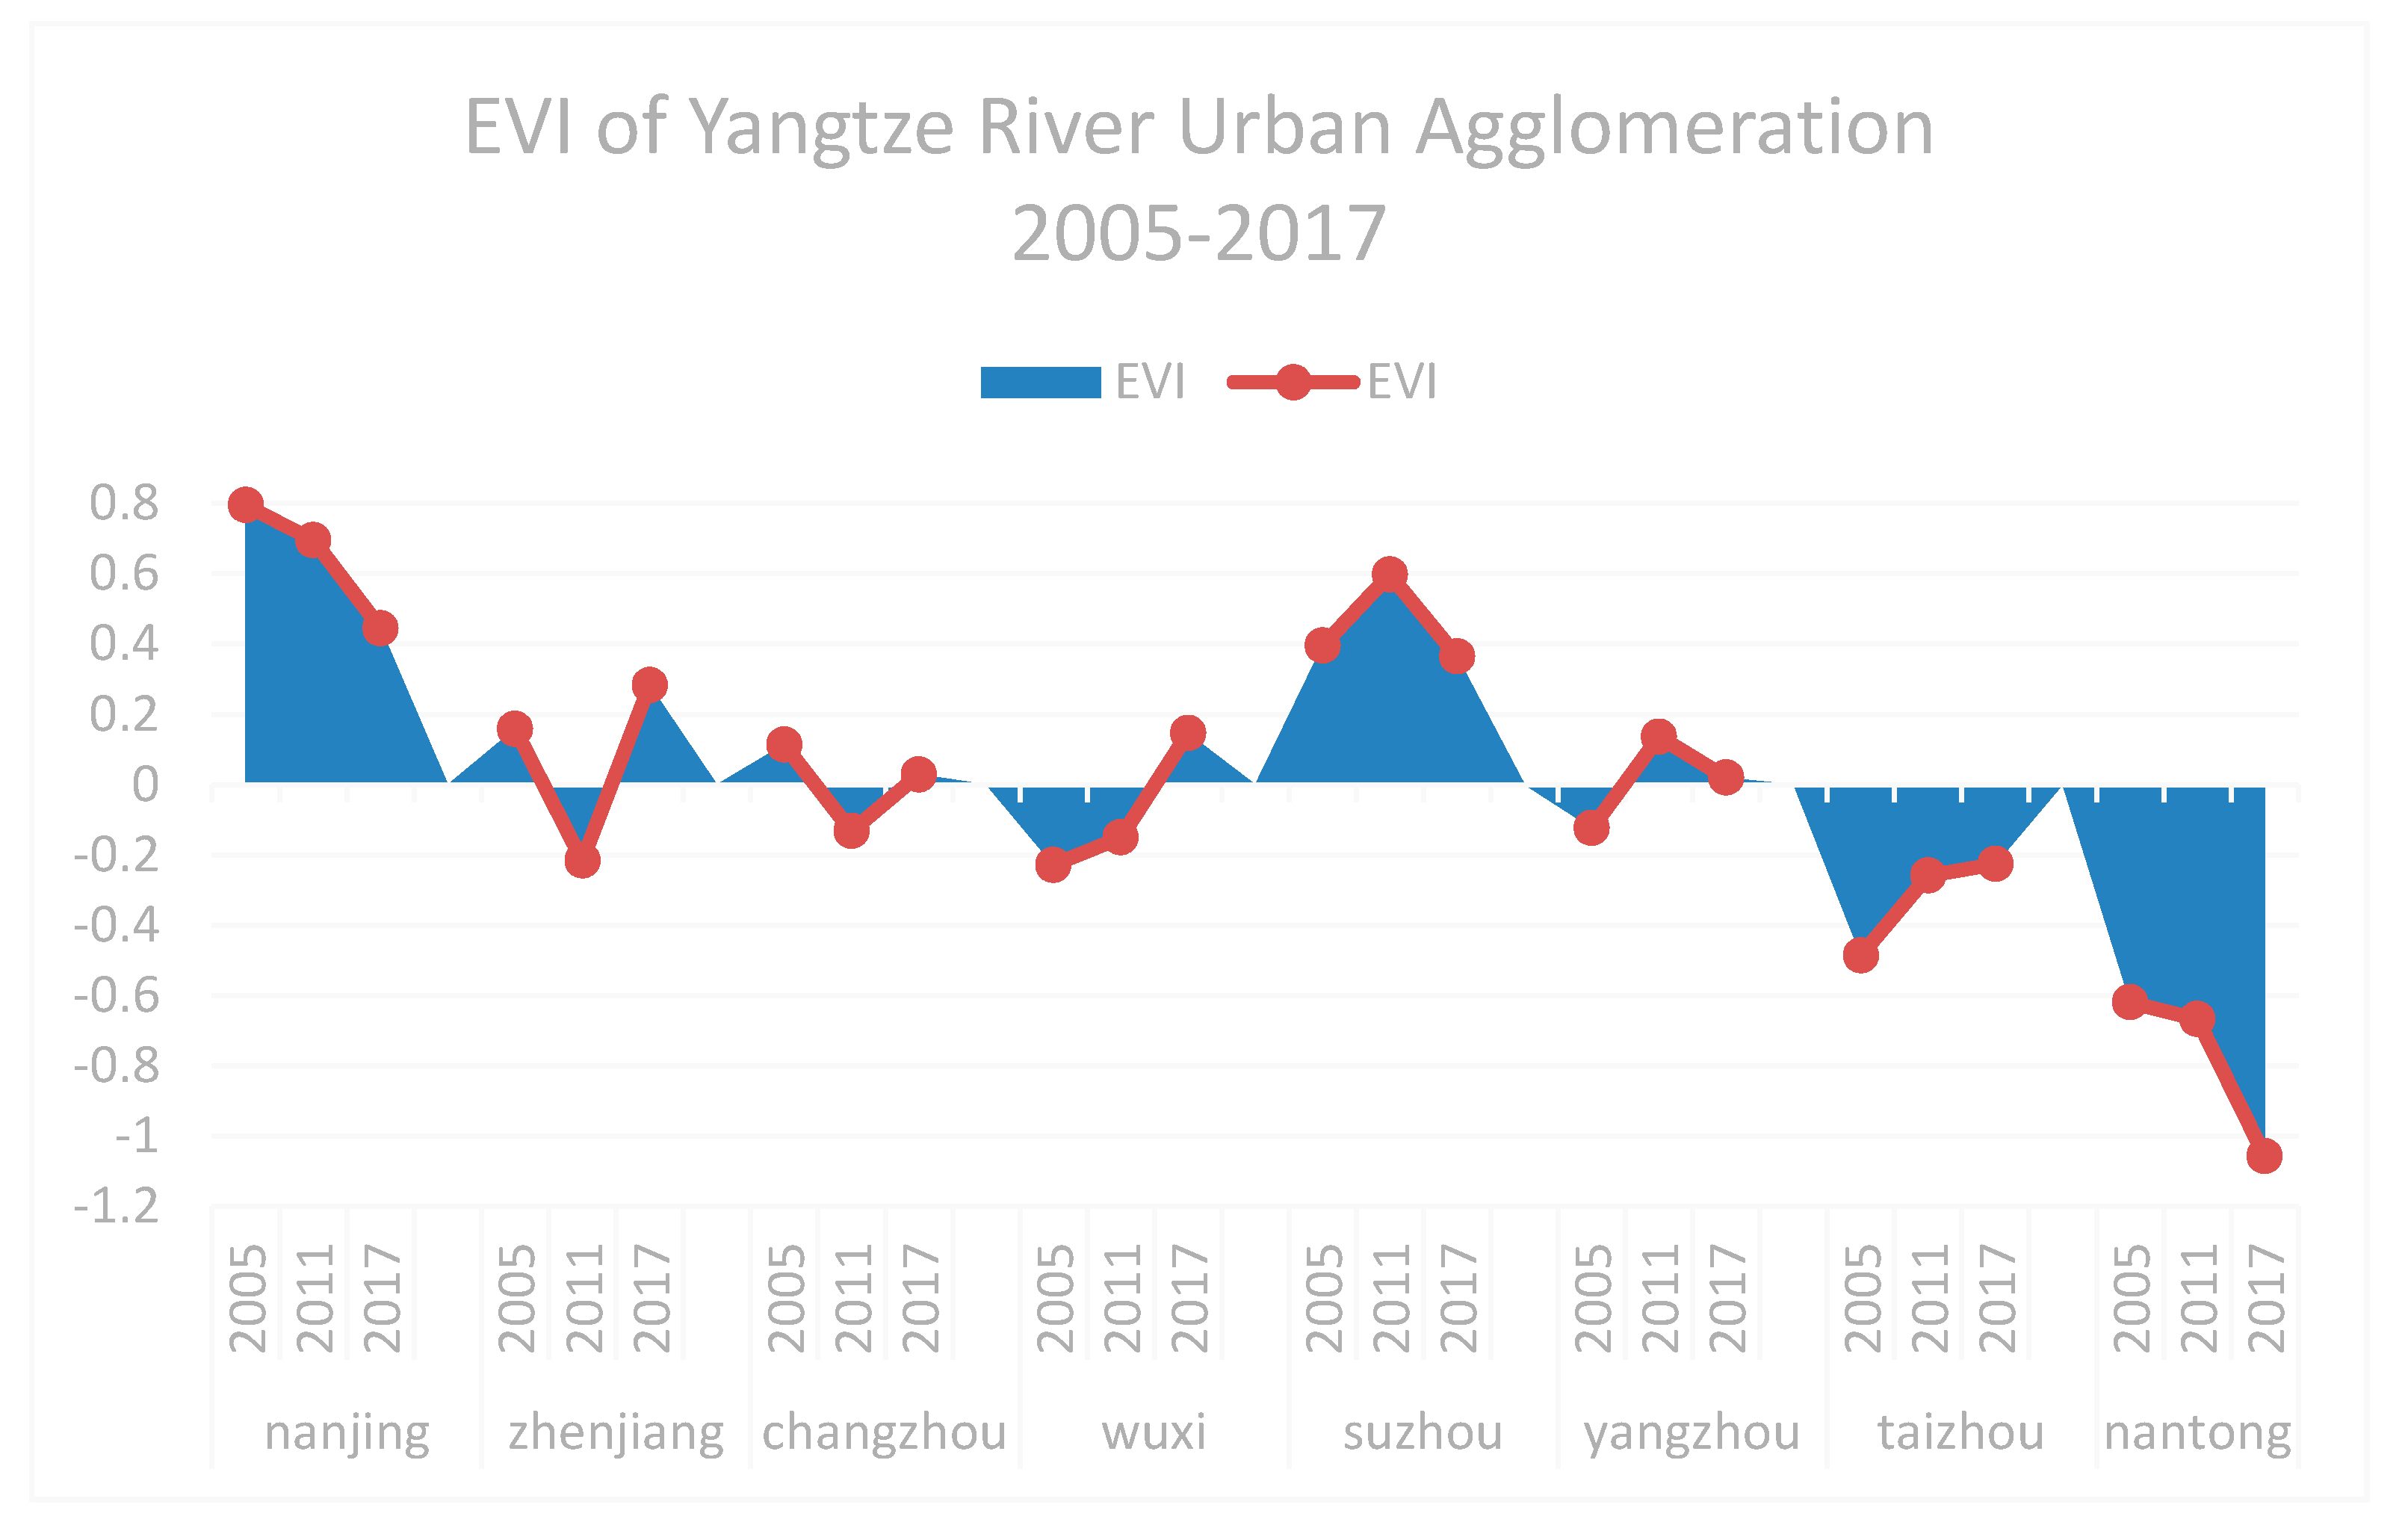
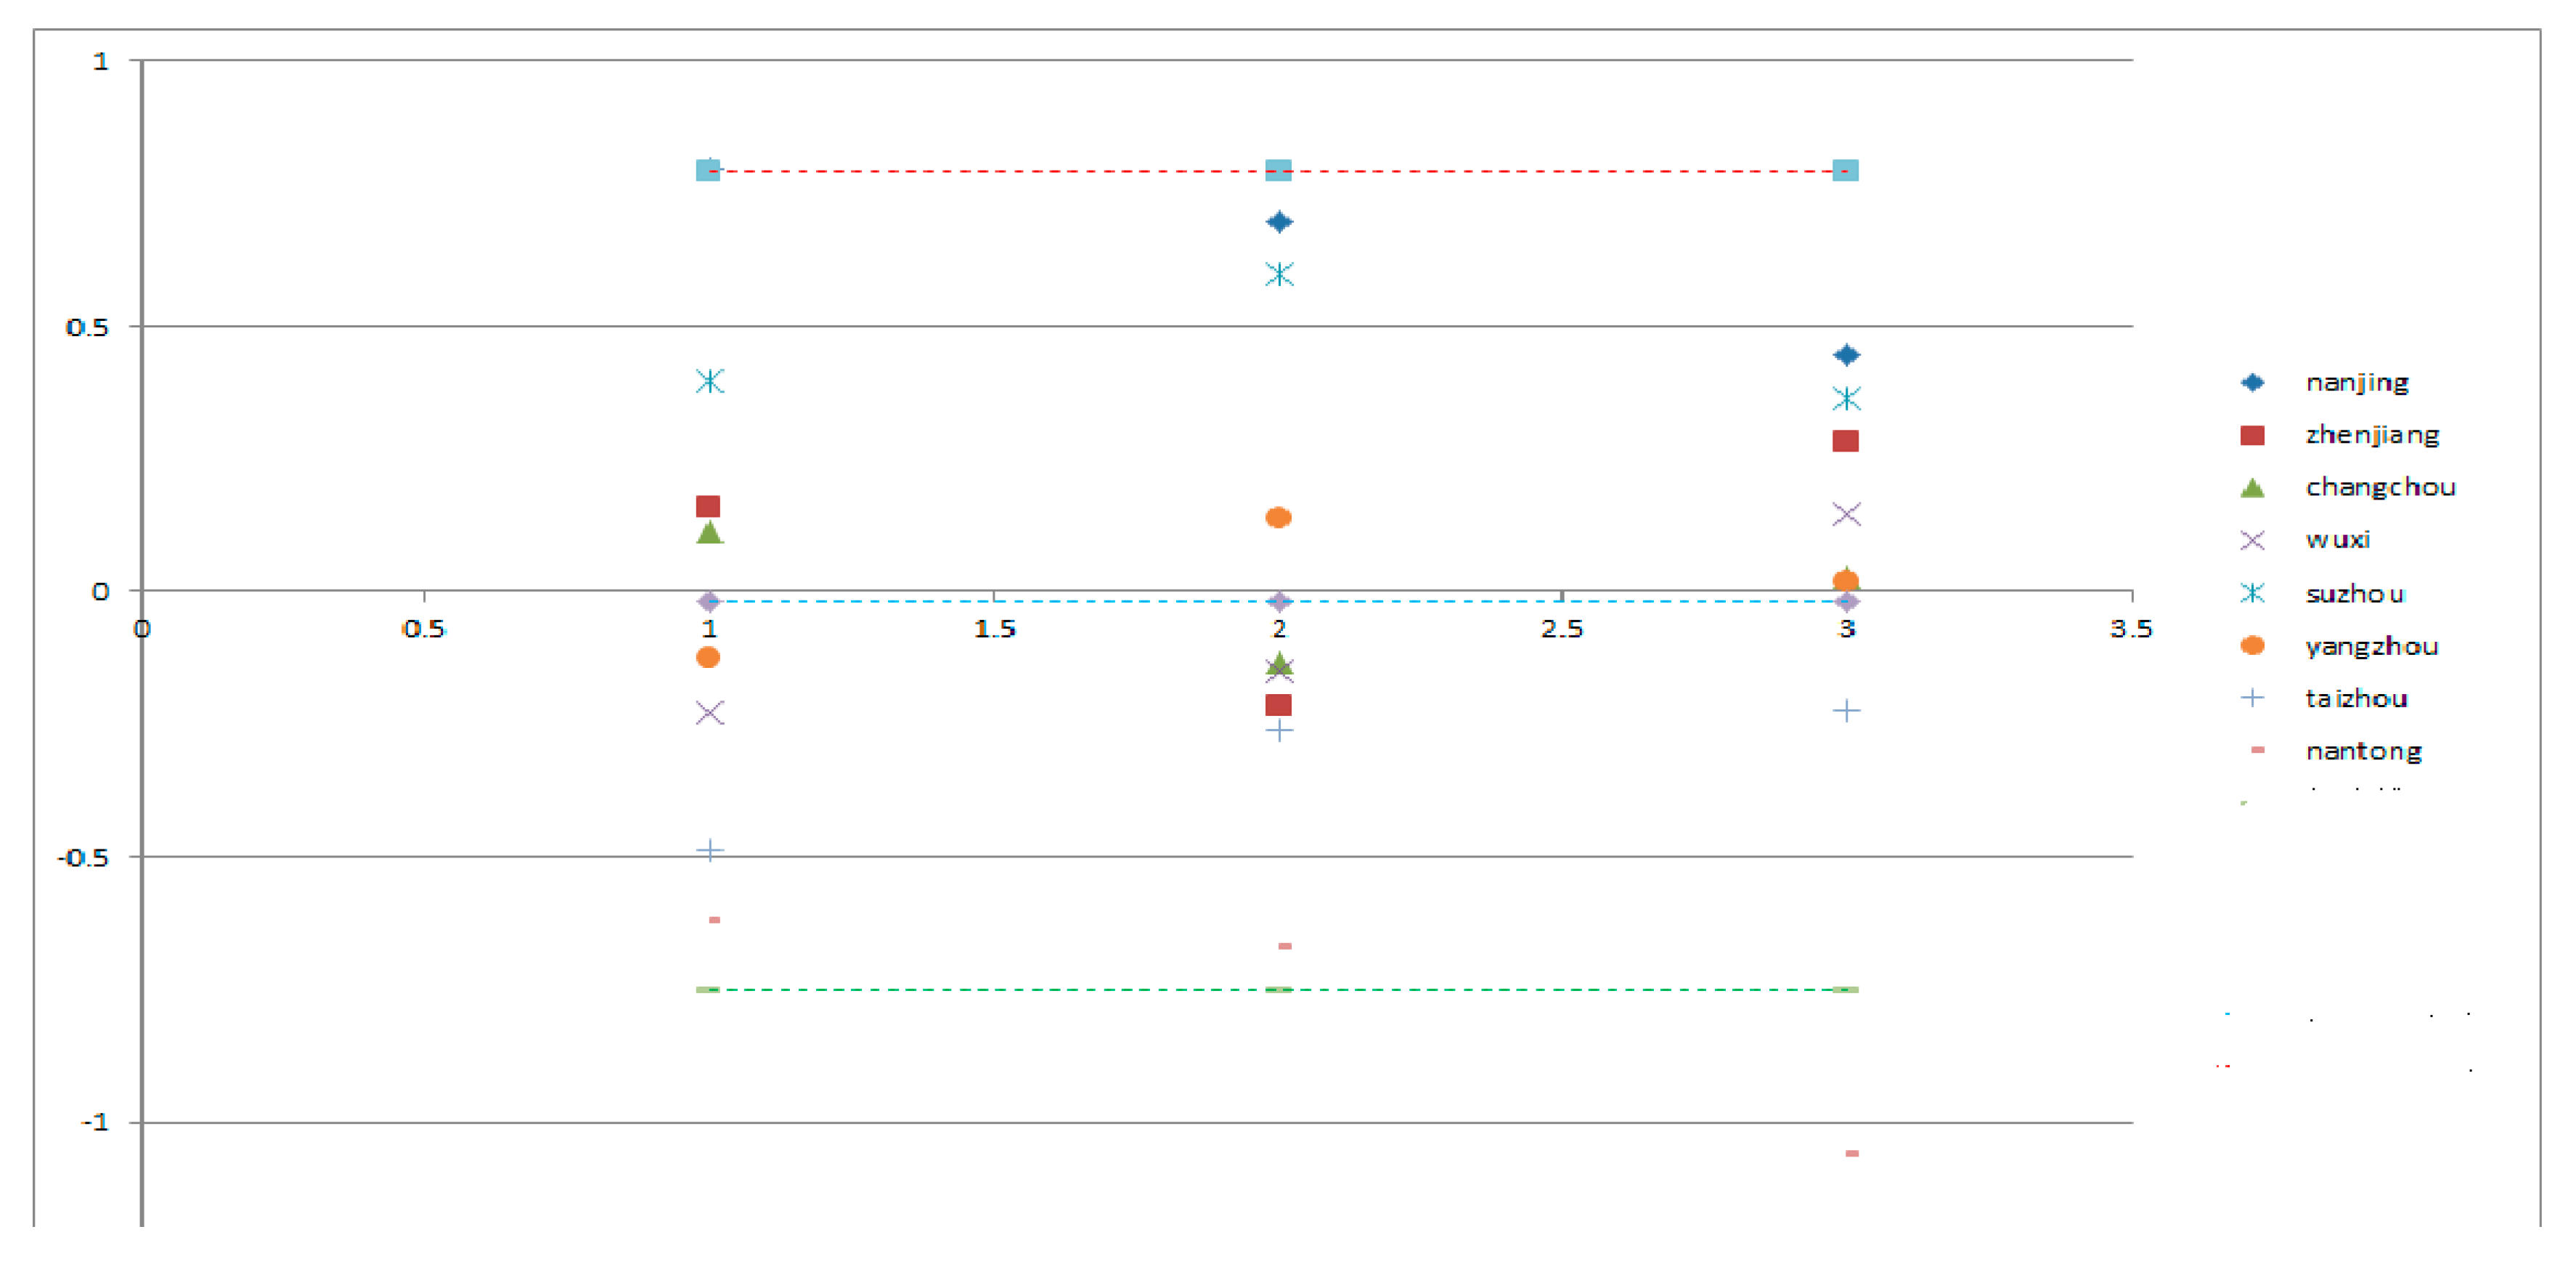
(1) The degree of economic development has a great impact on the ecological vulnerability index. Nanjing and Suzhou have been at the forefront of economic development, facing severely fragile ecological risks. The economic aggregates of Nantong and Taizhou in the northeast are behind Nanjing and Suzhou, but the ecological environment is good. In the past 10 years, the industrial structure of Nanjing and Suzhou has focused on the chemical industry. Air pollution, water pollution, and land pollution have caused certain damages to the ecological environment. In addition, increasing population size and distribution have negative impact on the ecological environment.
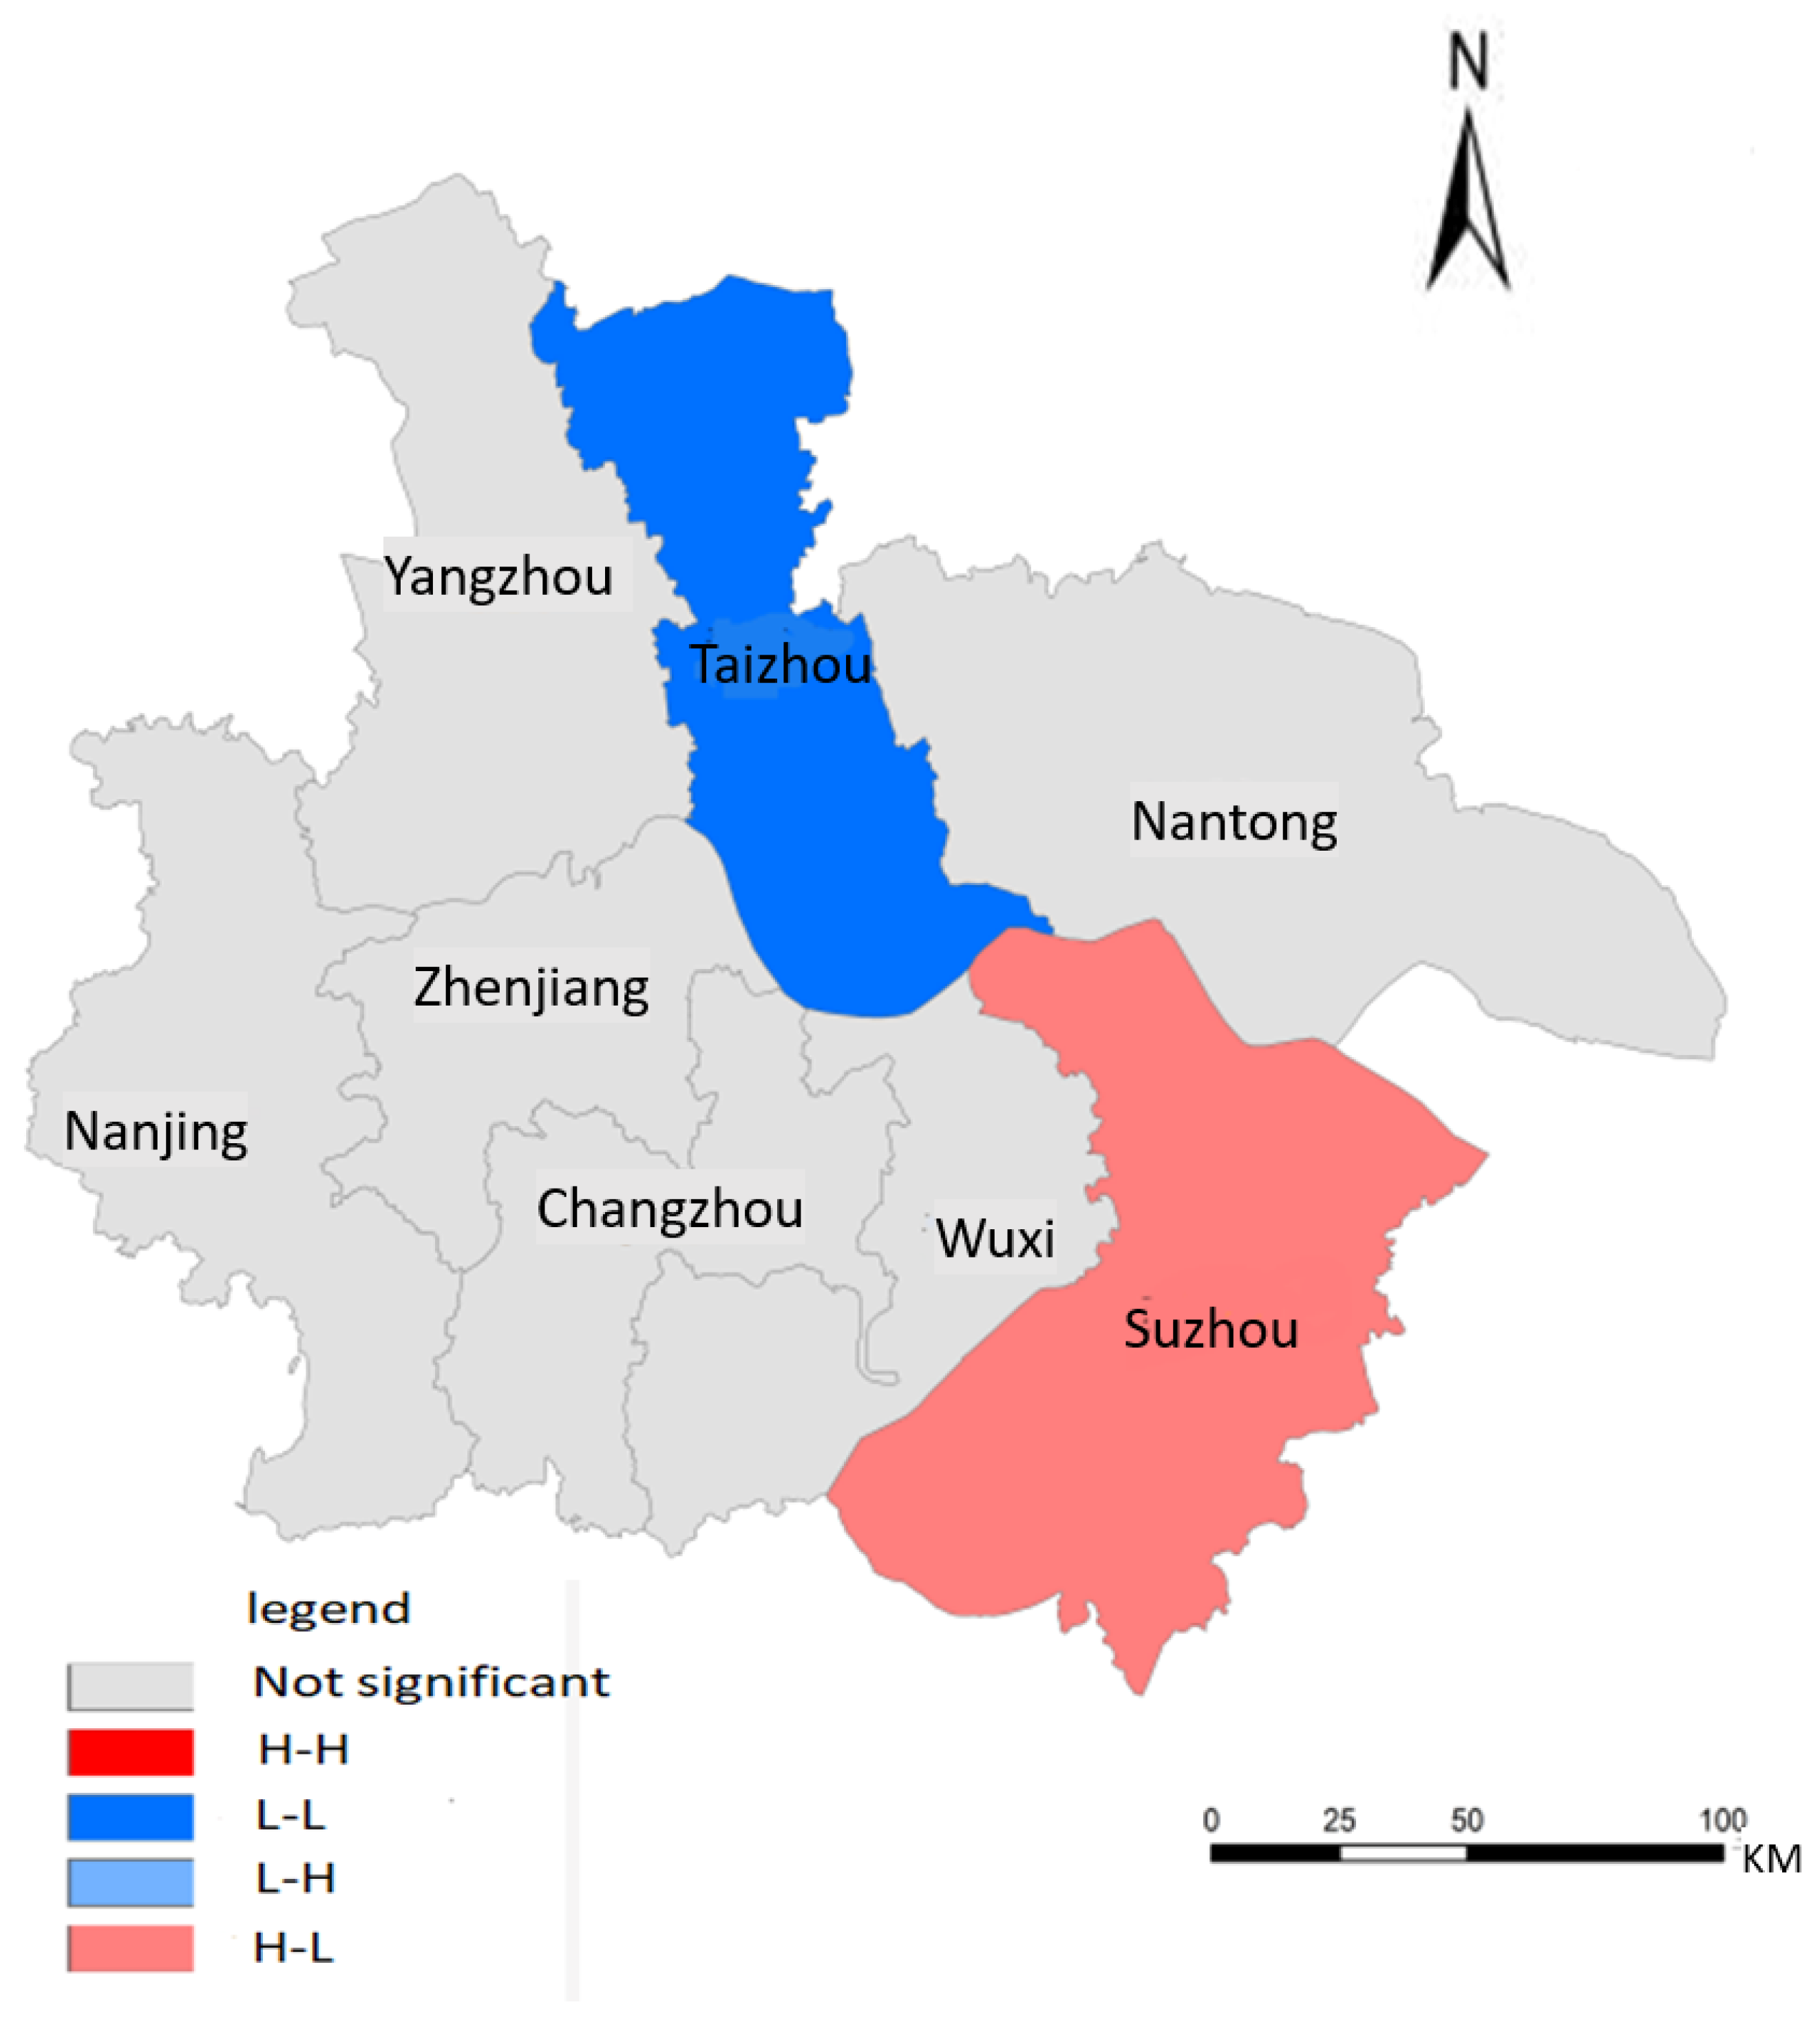
(2) The spatial agglomeration of ecological fragility is low and the ecological environment hazards among cities are weak. The spatial agglomeration of the Yangtze River Urban Agglomeration has not changed significantly, and the interaction between cities was little. The spatial agglomeration of Suzhou presents high-low concentration, indicating that Suzhou’s ecological environment vulnerability index is large, ecological and environmental issues are significant, and other cities ecological vulnerability index was lower than that of Suzhou. Taizhou, which was a good ecological environment, presents low-low concentration, indicates that the ecological environment of Taizhou and its surrounding cities is good. The spatial agglomeration effect was not significant and it would have a great impact on the economic development of the Yangtze River Urban Agglomeration. In the process of urban development in the new era, the spatial agglomeration effect was significantly more beneficial than disadvantages.
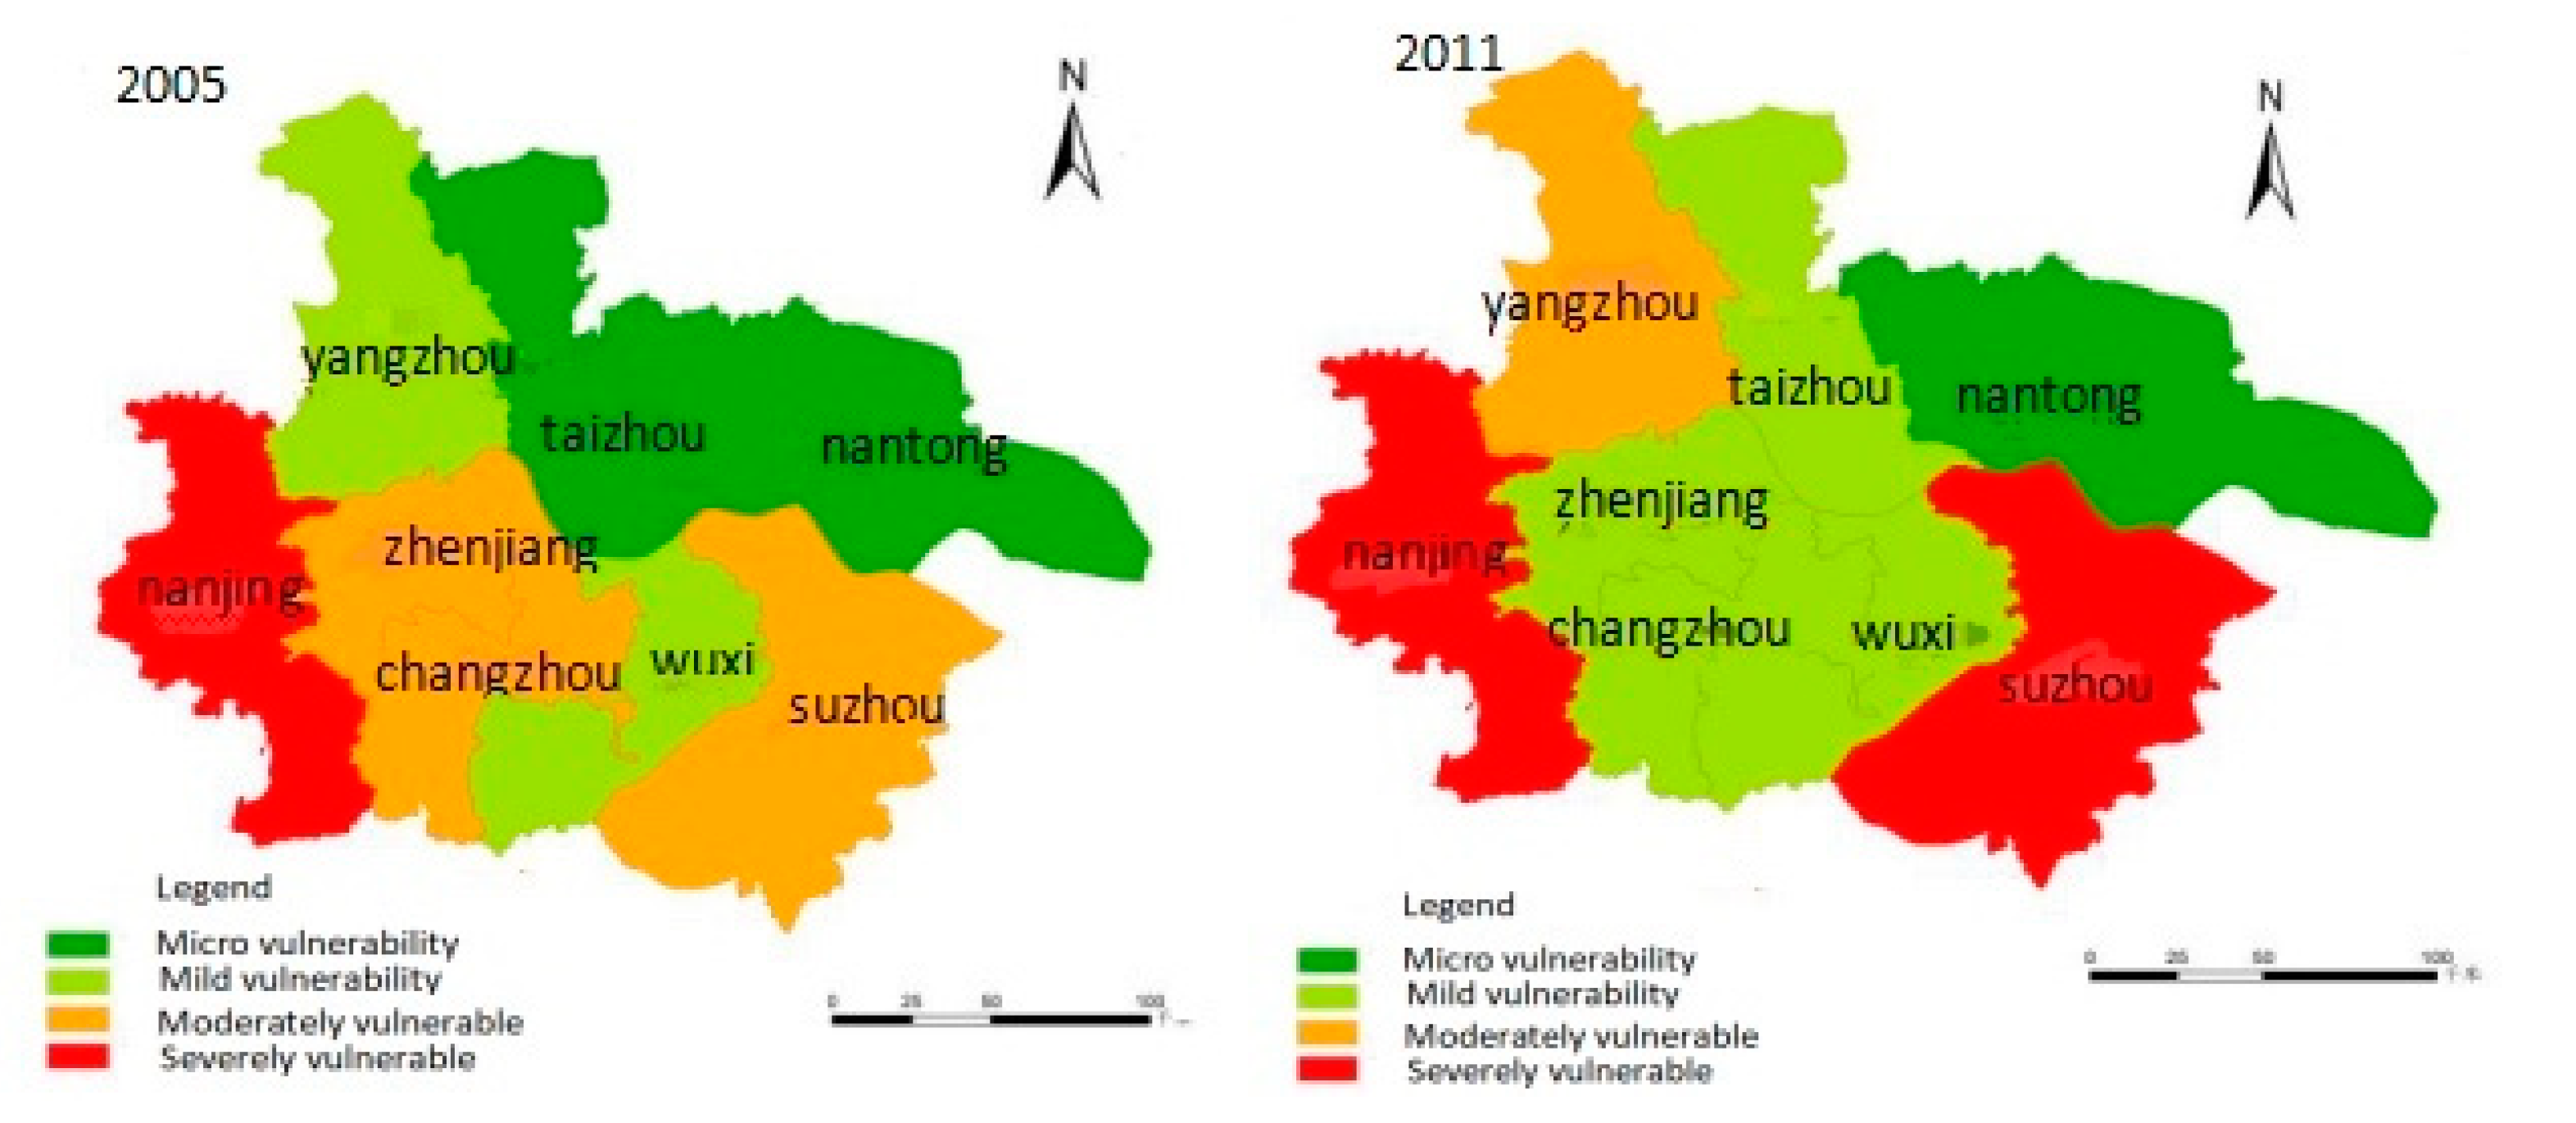
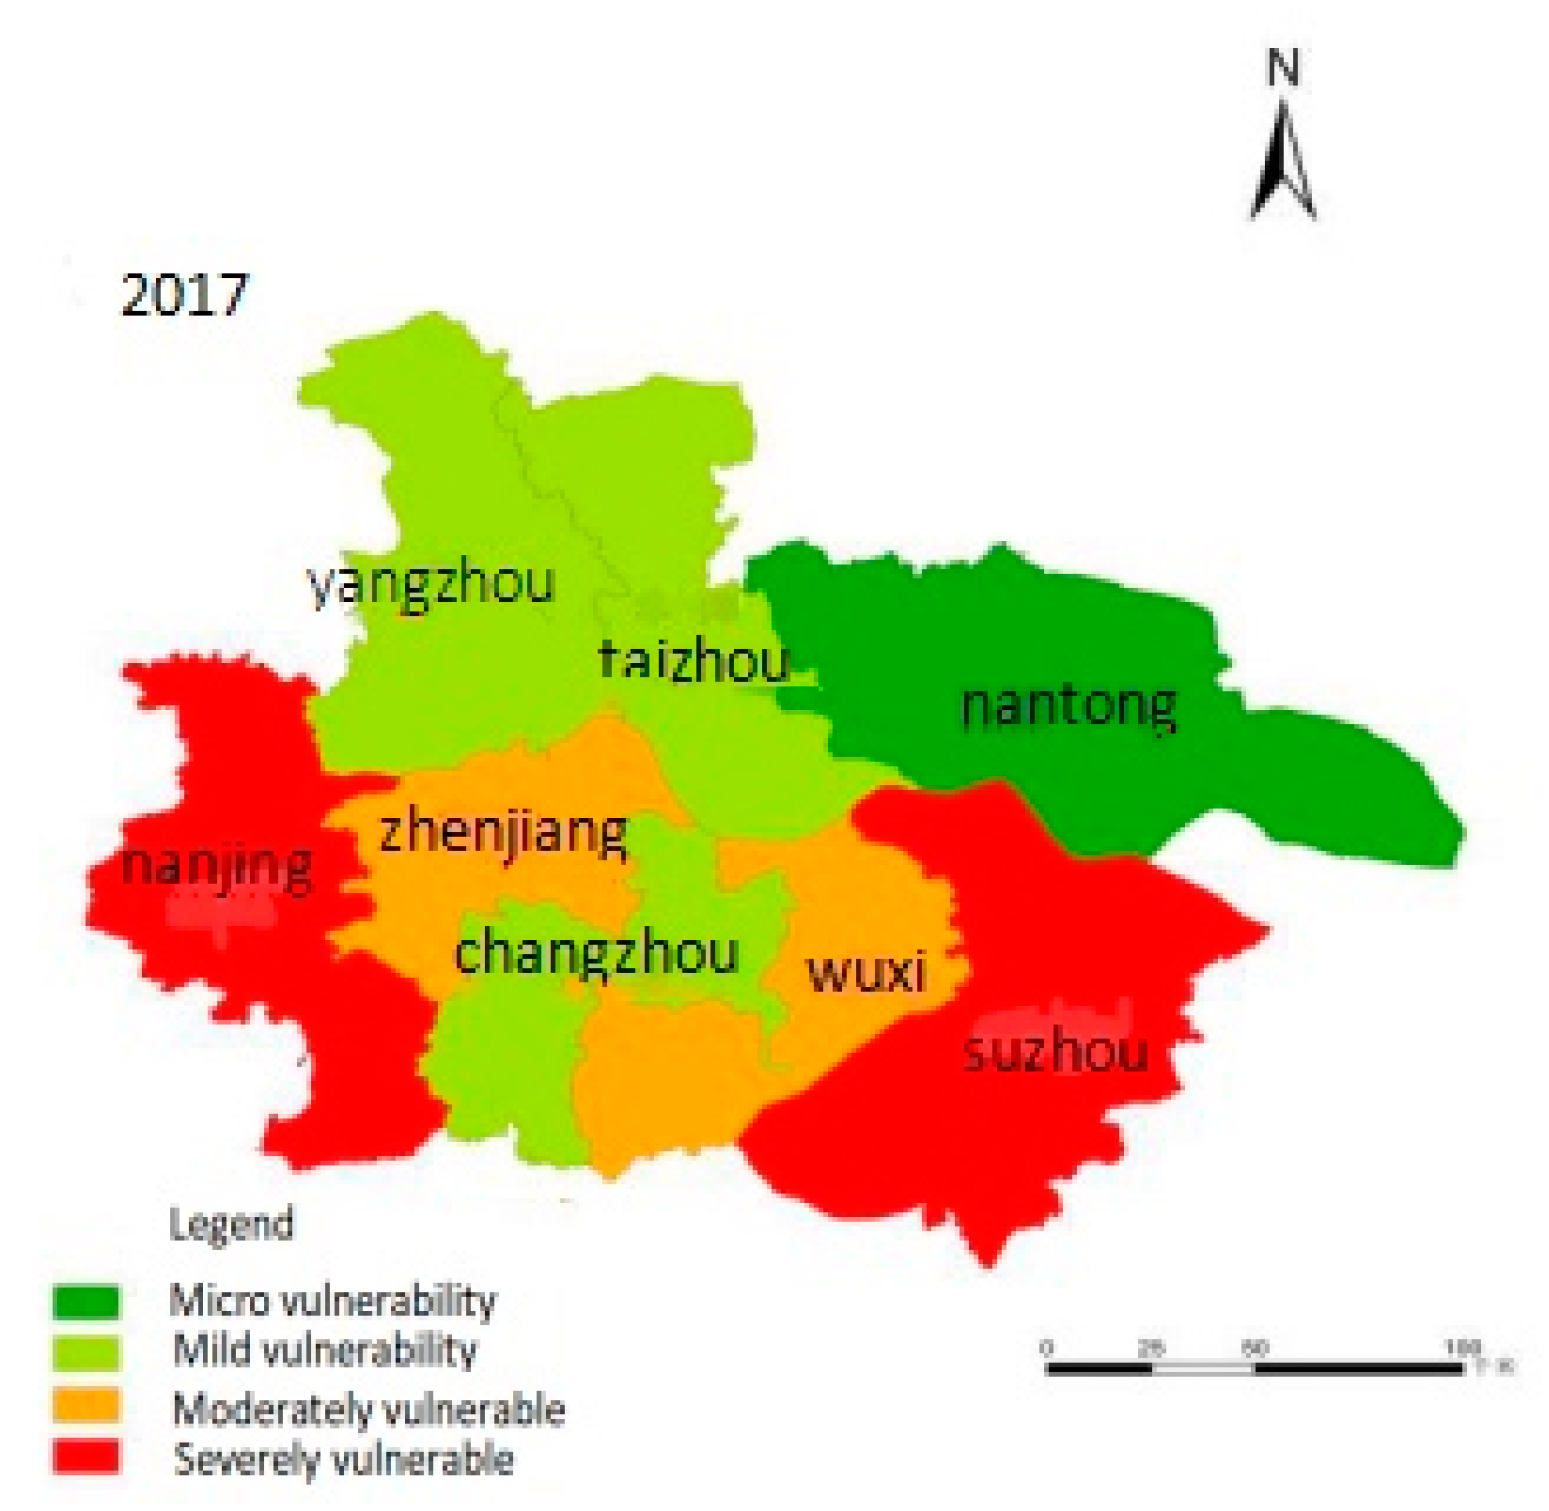
(3) The driving factors of ecological environment vulnerability have changed, and it has been found that from natural factors to social factors to policy factors. In 2005, it was still the initial stage of economic development of the Yangtze River Urban Agglomeration. It is in the stage of economic growth, with good ecological carrying capacity, and can be well digested and treated for human activities. In 2011, the cities within the Yangtze River Urban Agglomeration were gradually developed, and the demand for natural resources was increased, which caused certain damages to the ecological environment. The gradual policy influence factors appear in 2017, and the government has formulated a strategic goal of ecological environmental protection to provide a solid ecological environment for high-quality development. Based on results, the study suggests following recommendations.
The driving factors of the ecological environment vulnerability of the Yangtze River Urban Agglomeration were changed from natural to social economic factors. It is necessary to properly control the population to adapt to the development of the ecological environment, rationally plan to use the land, establish an ecological protection zone, reasonably plan the mileage and location of the railway and highway, and the density of the road network should be consistent with the development of the ecological environment. It is a dire need to strictly control pollution sources, integrate various resources and technologies to rectify contaminated areas, and increase the construction of infrastructure conditions necessary to protect the ecological environment.

Author Contributions

Conceptualization, B.P. and G.W.; Data curation, Q.H.; Formal analysis, Q.H.; Investigation, E.E.; Methodology, B.P.; Project administration, B.P. and G.W.; Software, B.P. and Q.H.; Supervision, E.E.; Writing—original draft, B.P. and Q.H.; Writing—review & editing, B.P., Q.H., E.E. and G.W.

Funding

This research was funded by HRSA, US DHHS, grant number H49MC00068; and was funded by The National Natural Science Foundation of China, grant number 71263040; and was funded by Key Project of National Social and Scientific Fund Program, grant number 18ZDA052; and was funded by Project of National Social and Scientific Fund Program, grant number 17BGL142; and was funded by Open Project of Jiangsu Productivity Society, grant number JSSCL 2018A005; and was funded by Soft Science Project of China Meteorological Administration, grant number 2019ZDIANXM25; and was funded by The Natural Science Foundation of China, grant number 91546117.

Acknowledgments

The authors are grateful to the case company for permitting and supporting this research. This work was financially supported by HRSA, US DHHS (Grant number. H49MC00068), the National Natural Science Foundation of China (No. 71263040), Key Project of National Social and Scientific Fund Program (18ZDA052), Project of National Social and Scientific Fund Program (17BGL142), Open Project of Jiangsu Productivity Society (JSSCL 2018A005), Soft Science Project of China Meteorological Administration (2019ZDIANXM25). The Natural Science Foundation of China (91546117).

Conflicts of Interest

The authors declare no conflict of interest.

References

  1. Herold, M.; Goldstein, N.C.; Clarke, K.C. The spatiotemporal form of urban growth: Measurement, analysis and modeling. Remote Sens. Environ. 2003, 86, 286–302. [Google Scholar] [CrossRef]
  2. Rakotoarisoa, J.-E.; Raheriarisena, M.; Goodman, S.M. A phylogeographic study of the endemic rodent Eliurus carletoni (Rodentia: Nesomyinae) in an ecological transition zone of northern Madagascar. J. Hered. 2013, 104, 23–35. [Google Scholar] [CrossRef] [PubMed]
  3. Zhao, Y.Z.; Zou, X.Y.; Cheng, H.; Jia, H.K.; Wu, Y.Q.; Wang, G.Y.; Zhang, C.L.; Gao, S.Y. Assessing the ecological security of the Tibetan plateau: Methodology and a case study for Lhaze County. J. Environ. Manag. 2006, 80, 120–131. [Google Scholar] [CrossRef] [PubMed]
  4. Wackernagel, M.; Onisto, L.; Bello, P.; Linares, A.C.; Falfán, I.S.L.; García, J.M.; Guerrero, A.I.S.; Guerrero, M.G.S. National natural capital accounting with the ecological footprint concept. Ecol. Econ. 1999, 29, 375–390. [Google Scholar] [CrossRef]
  5. Smit, B.; Wandel, J. Adaptation, adaptive capacity and vulnerability. Glob. Environ. Chang. 2006, 16, 282–292. [Google Scholar] [CrossRef]
  6. Whitford, V.; Ennos, A.R.; Handley, J.F. “City form and natural process”—Indicators for the ecological performance of urban areas and their application to Merseyside, UK. J. Arch. Eng. 2001, 57, 91–103. [Google Scholar]
  7. Hongfu, X. Current situation and Countermeasures of sustainable development of water resources in small and medium-sized cities in water shortage areas of China. Res. Water Conserv. Dev. 2007, 11, 48–50. [Google Scholar]
  8. Collins, S.L.; Carpenter, S.R.; Swinton, S.M.; Orenstein, D.E.; Childers, D.L.; Gragson, T.L.; Grimm, N.B.; Grove, J.M.; Harlan, S.L.; Kaye, J.P. An integrated conceptual framework for long-term social–ecological research. Front. Ecol. Environ. 2011, 9, 351–357. [Google Scholar] [CrossRef]
  9. Wang, S.Y.; Liu, J.S.; Yang, C.J. Eco-environmental vulnerability evaluation in the Yellow River Basin, China. Pedosphere 2008, 18, 171–182. [Google Scholar] [CrossRef]
  10. Kong, L.Q.; Zhang, L.; Zheng, H.; Xu, W.H.; Xiao, Y.; Ouyang, Z.Y. Driving forces behind ecosystem spatial changes in the Yangtze River Basin. Acta Ecol. Sin. 2018, 38, 741–749. [Google Scholar] [CrossRef]
  11. Chen, H.M.; Li, Q. Assessment and analysis on the water resource vulnerability in arid zone based on the PSR model. Adv. Mater. Res. 2014, 955–959, 3757–3760. [Google Scholar] [CrossRef]
  12. Li, Y.; Fan, Q.; Wang, X.; Xi, J.; Wang, S.; Yang, J. Temporal and spatial differentiation of ecological vulnerability in natural disaster-prone areas based on SRP model: A case study of Chaoyang County, Liaoning Province. Geogr. Sci. 2016, 11, 1452–1459. (In Chinese) [Google Scholar]
  13. Shi, Y.Z.; Li, F.L.; Fan, M.Y.; Liu, H.J.; Yang, X.F. Applications of variable fuzzy set theory and GIS for water resources vulnerability assessment of Yellow River Delta. Appl. Mech. Mater. 2014, 700, 501–505. [Google Scholar] [CrossRef]
  14. Nguyen, A.K.; Liou, Y.A.; Li, M.H.; Tran, T.A. Zoning eco-environmental vulnerability for environmental management and protection. Ecol. Indic. 2016, 69, 100–117. [Google Scholar] [CrossRef]
  15. Jing, S. Comprehensive Assessment of Ecological Vulnerability and Research on Development Strategies; North China Electric Power University: Beijing, China, 2018. [Google Scholar]
  16. Yao, X.; Yu, K.Y.; Liu, J.; Yang, S.P.; He, P.; Deng, Y.B.; Yu, X.Y.; Chen, Z.H. Spatial and temporal changes of the ecological vulnerability in a serious soil erosion area, Southern China. Yingyong Shengtai Xuebao J. Appl. Ecol. 2016, 27, 735–745. [Google Scholar]
  17. Lin, J.; Hu, G.; Yan, X.; Xu, C.; Zhang, A.; Chen, W.; Shuai, C.; Liang, C. The ecological environment vulnerability and its driving force in the urban agglomeration of the Yangtze River Delta. Acta Ecol. Sin. 2018, 38, 4155–4166. (In Chinese) [Google Scholar]
  18. Kang, H.; Tao, W.; Chang, Y.; Zhang, Y.; Li, X.; Chen, P. A feasible method for the division of ecological vulnerability and its driving forces in Southern Shaanxi. J. Clean. Prod. 2018, 205, 619–628. [Google Scholar] [CrossRef]
  19. Chen, W.; Cutter, S.L.; Emrich, C.T.; Shi, P. Measuring social vulnerability to natural hazards in the Yangtze River Delta region, China. Int. J. Disaster Risk Sci. 2013, 4, 169–181. [Google Scholar] [CrossRef]
  20. Gu, C.; Hu, L.; Zhang, X.; Wang, X.; Guo, J. Climate change and urbanization in the Yangtze River Delta. Habitat Int. 2011, 35, 544–552. [Google Scholar] [CrossRef]
  21. Tian, Y.; Chang, W. Bibliometric analysis of the research progress of ecological vulnerability in China. Acta Geogr. Sin. 2012, 67, 1515–1525. (In Chinese) [Google Scholar]
  22. Du, Y.; Peng, J.; Zhao, S.; Hu, Z.C.; Wang, Y.L. Ecological risk assessment of landslide hazards in Southwestern China: A case study of Dali Bai Autonomous Prefecture. J. Geogr. Sci. 2016, 71, 1544–1561. (In Chinese) [Google Scholar]
  23. Ma, J.; Li, C.; Wei, H.; Ma, P.; Yang, Y.; Ren, Q.; Zhang, W. Evaluation of ecological vulnerability in the three gorges reservoir area. Chin. J. Ecol. 2015, 35, 7117–7129. (In Chinese) [Google Scholar]
  24. Xu, G.; Kang, M.; Metzger, M.; Li, Y. Ecological vulnerability of Xilin Gol League. Chin. J. Ecol. 2012, 32, 1643–1653. (In Chinese) [Google Scholar]
  25. Ord, J.K.; Getis, A. Local spatial autocorrelation statistics: Distributional issues and an application. Geogr. Anal. 2010, 27, 286–306. [Google Scholar] [CrossRef]
  26. Cliff, A.D.; Ord, J.K. Spatial Processes: Models & Applications; Pion Ltd.: London, UK, 1981; pp. vii+266. ISBN 0-85086-081-4. [Google Scholar]
  27. Gu, Q.; Wang, H.; Zheng, Y.; Zhu, J.; Li, X. Ecological footprint analysis for urban agglomeration sustainability in the middle stream of the Yangtze River. Ecol. Model. 2015, 318, 86–99. [Google Scholar] [CrossRef]
  28. Liu, H. Comprehensive carrying capacity of the urban agglomeration in the Yangtze River Delta, China. Habitat Int. 2012, 36, 462–470. [Google Scholar] [CrossRef]
  29. Zhao, S.; Da, L.; Tang, Z.; Fang, H.; Song, K.; Fang, J. Ecological consequences of rapid urban expansion: Shanghai, China. Front. Ecol. Environ. 2006, 4, 341–346. [Google Scholar] [CrossRef]
  30. McKenzie, D.H.; Hyatt, D.E.; McDonald, V.J. Ecological Indicators; Springer: Berlin/Heidelberg, Germany, 2012. [Google Scholar]
  31. Guiltinan, J. Creative destruction and destructive creations: Environmental ethics and planned obsolescence. J. Bus. Ethics 2009, 89 (Suppl. S1), 19–28. [Google Scholar] [CrossRef]
Figure 1. Location map of Yangtze River Urban Agglomeration.
Sustainability 11 06623 g001
Figure 2. Distribution of ecological environment vulnerability index of Yangtze River Urban Agglomeration from 2005 to 2017.
Sustainability 11 06623 g002
Figure 3. The EVI trend map of Yangzijiang urban agglomeration from 2005 to 2017.
Sustainability 11 06623 g003
Figure 4. Spatial distribution of ecological environment vulnerability of the Yangtze River Urban Agglomeration from 2005 to 2017.
Sustainability 11 06623 g004aSustainability 11 06623 g004b
Figure 5. LISA cluster diagram of the ecological environment vulnerability of the Yangtze River Urban Agglomeration.
Sustainability 11 06623 g005
Table 1. The index system for assessing the vulnerability of the Yangtze River Urban Agglomeration based on the “genesis-result” model.
Sub IndicatorUnitNature of the IndicatorSource of Indicators
ElevationMeterNegative indicatorLi (2016) [12]
Landscape diversity——Positive indicator
Annual average temperatureCelsiusPositive indicator
Lithology——Negative indicatorDu (2016) [22]
slopedegreeNegative indicatorLi (2016) [12]
Soil type——Negative indicator
NDVI——Positive indicator
Average annual precipitationMillimeterNegative indicator
The population densityPeople per square kilometerNegative indicator
Per capita GDPTen thousand yuan/personNegative indicatorMa (2015) [23]
Road network densityKm/km2Negative indicatorXu (2012) [24]
Land use%Negative indicatorTian (2012) [21]
Table 2. Assignment and standardization of ecological environment vulnerability assessment indicators.
Evaluation IndexStandardized Assignment
246810
LithologyMudstone, limestone, clay rock, shaleConglomerate, breccia, siltstoneSchist, quartzite, marble, amphiboliteAndesite, fluke, tuffGranite, granite porphyry, monzonite
Soil typePaddy soil, gray tidal soilSaline soil, wind sandBrick red soil, red soilYellow soil, coarse soil, lime soilPurple soil
Table 3. Ecological environment vulnerability and its ecological characteristics.
Vulnerability LevelVulnerability IndexEcological Characteristics
Micro-fragility<−0.75Good ecological environment, reasonable structure, strong anti-interference ability, stable ecosystem, and high ecological security.
Mildly fragile(−0.75)–(−0.02)The ecological environment is relatively good, the structural configuration is relatively reasonable, the anti-interference ability is relatively strong, the ecological system is relatively stable, and the ecological security degree is relatively high.
Moderately vulnerable(−0.02)–0.79The ecological environment is general, the structure is general, the anti-interference ability is general, the ecosystem is unstable, and the ecological security is general.
Heavier and more fragile>0.79Poor ecological environment, unreasonable structural configuration, poor anti-interference ability, unstable ecosystem, and low ecological security.
Table 4. Connotation of different LISA aggregation modes.
Aggregate TypeMeaning
High-High accumulation (H-H)Areas with high observations are surrounded by high-value areas space agglomeration.
High-Low accumulation (H-L)High-value areas around low-value areas space agglomeration.
Low-High accumulation (L-H)High-value areas around low-observation areas space agglomeration.
Low-Low accumulation (L-L)Areas with low observations are surrounded by low-value areas spatial agglomeration feature.
Not obviousThere are no significant spatial agglomeration features.
Table 5. Characteristic values of each principal component, contribution rate, and cumulative contribution rate.
YearsPrincipal Component CoefficientMain Ingredient
PC1PC2PC3PC4
2005Characteristic value λ4.23.192.251.23
Contribution rate%34.9726.6218.7710.28
Accumulated contribution rate%34.9761.5980.3690.64
2011Characteristic value λ3.842.622.191.96
Contribution rate%32.0221.7918.2416.32
Accumulated contribution rate%32.0253.8172.0588.36
2017Characteristic value λ3.563.52.21.8
Contribution rate%29.6729.1218.4114.94
Accumulated contribution rate%29.6758.7977.292.14
Table 6. The EVI (2005–2017).
CITY2005 EVI2011EVI2017EVI
Nanjing0.79480.69500.4443
Zhenjiang0.1580−0.21630.2825
Changzhou0.1131−0.13280.0284
Wuxi−0.2294−0.15130.1455
Suzhou0.39480.59730.3643
Yangzhou−0.12420.13570.0192
Taizhou−0.4868−0.2596−0.2264
Nantong−0.6203−0.6680−1.0580
Table 7. Spatial autocorrelation parameters of ecological environment vulnerability from 2005 to 2017.
YearMoran IExpected ValueZ Valuep Value
2005−0.0567−0.14290.18880.2700
2011−0.2636−0.14290.65400.2740
2017−0.0745−0.14290.14240.2740
Table 8. Principal component load matrix (2005).
IndexFactor Load Factor
PC1PC2PC3PC4
Road network density0.910.04−0.250.266
Average annual precipitation0.897−0.081−0.0840.335
NDVI−0.2490.919−0.0220.072
Slope−0.009−0.2090.9110.173
Lithology0.5820.5120.179−0.605
The population density−0.858−0.027−0.4390.063
Landscape diversity−0.789−0.0050.401−0.026
Annual average temperature−0.7030.050.201−0.237
Soil type0.4660.6580.331−0.464
Land use−0.2320.8590.0720.41
Elevation0.162−0.1960.9010.286
Per capita GDP−0.1130.907−0.0010.352
Table 9. Principal component load matrix (2011).
IndexFactor Load Factor
PC1PC2PC3PC4
The population density0.969−0.156−0.1120.135
Land use0.760.361−0.240.152
Road network density0.009−0.874−0.0260.015
Slope−0.4140.550.693−0.043
Lithology−0.4570.187−0.3170.806
Per capita GDP0.6570.713−0.0560.151
NDVI0.6320.6250.453−0.011
Landscape diversity0.542−0.1680.6750.385
Elevation−0.4760.3930.671−0.081
Average annual precipitation−0.4160.761−0.289−0.246
Soil type−0.3510.425−0.240.794
Annual average temperature0.1240.629−0.551−0.481
Table 10. Principal component load matrix. (2017).
IndexFactor Load Factor
PC1PC2PC3PC4
Per capita GDP0.8230.3090.390.038
Soil type0.77−0.002−0.3050.549
The population density0.1770.9240.311−0.053
Landscape diversity−0.2140.3880.7930.292
Annual average temperature0.749−0.097−0.211−0.596
Road network density−0.7180.377−0.3130.276
Average annual precipitation0.694−0.6−0.3340.014
Land use0.6630.6070.1090.245
Lithology0.6550.279−0.5320.304
NDVI0.516−0.0820.764−0.269
Slope0.14−0.7950.5190.196
Elevation0.007−0.7790.3370.421

