Article

Planning Nature-Based Solutions for Urban Flood Reduction and Thermal Comfort Enhancement

1
IHE Delft, Institute for Water Education, Westvest 7, 2611 AX Delft, The Netherlands
2
School of Engineering and Technology, Asian Institute of Technology, P.O. Box 4 Klong Luang, Pathumthani 12120, Thailand
3
College of Engineering, Mathematics and Physics, University of Exeter, Exeter EX4 4QF, UK
4
Faculty of Civil Engineering, Department of Hydraulic and Environmental Engineering, University of Belgrade, Bulevar kralja Aleksandra 73, 11000 Beograd, Serbia
5
Hydro and Agro Informatics Institute (HAII), Khwaeng Thanon Phaya Thai, Khet Ratchathewi, Krung Thep Maha Nakhon, Bangkok 10400, Thailand
6
NoorderRuimte, Centre of Applied Research and Innovation on Area Development, Hanze University of Applied Sciences, Zernikeplein 7, P.O. Box 3037, 9701 DA Groningen, The Netherlands
7
TAUW, Zekeringstraat 43g, P.O. Box 20748, 1001 NS Amsterdam, The Netherlands
8
Amsterdam University of Applied Sciences, Urban Technology, Weesperzijde 190, 1097 DZ Amsterdam, The Netherlands
*
Author to whom correspondence should be addressed.
Sustainability 2019, 11(22), 6361; https://doi.org/10.3390/su11226361
Submission received: 20 September 2019 / Revised: 25 October 2019 / Accepted: 29 October 2019 / Published: 12 November 2019

Abstract

:
As a consequence of climate change and urbanization, many cities will have to deal with more flooding and extreme heat stress. This paper presents a framework to maximize the effectiveness of Nature-Based Solutions (NBS) for flood risk reduction and thermal comfort enhancement. The framework involves an assessment of hazards with the use of models and field measurements. It also detects suitable implementation sites for NBS and quantifies their effectiveness for thermal comfort enhancement and flood risk reduction. The framework was applied in a densely urbanized study area, for which different small-scale urban NBS and their potential locations for implementation were assessed. The overall results show that the most effective performance in terms of flood mitigation and thermal comfort enhancement is likely achieved by applying a range of different measures at different locations. Therefore, the work presented here shows the potential of the framework to achieve an effective combination of measures and their locations, which was demonstrated on the case of the Sukhumvit area in Bangkok (Thailand). This can be particularly suitable for assessing and planning flood mitigation measures in combination with heat stress reduction.

1. Introduction

There is an increasing awareness that the interplay between the supposed effects of climate change and global warming combined with rapid and uncontrolled urbanization can lead to serious challenges to urban water managers and city planners. Since the vegetation coverage and green areas are decreasing significantly, the imperviousness rate in different urban areas is increasing [1,2]. As a consequence, many cities will deal with less reliable drainage systems, more flooding, extreme heat stress and droughts.
Urban flooding leads to numerous direct and indirect impacts, and it causes high social, environmental and financial damages to the more vulnerable and less prepared cities around the world [3,4]. Heat stress is considered to be a phenomenon induced by a hot atmospheric condition, implying an increase of heat-related mortality and morbidity [5]. The increase in urban air temperature can affect human well-being and energy consumption due to the need for extra cooling. Therefore, in order to reduce the vulnerability and increase the capacity of cities to cope with these effects, a paradigm shift in the management and design of urban water systems is required. In this new management approach, multifunctional designs will deal with multiple hazards, meaning that the hazards are not targeted individually, and therefore that urban water systems will now deal with multiple challenges at the same time [6,7].
In urban drainage management, similar structures are named differently. For instance, green infrastructure (GI), best management practices (BMP), low impact development (LID), water sensitive urban design (WSUD), sustainable drainage systems (SuDS), ecosystem-based adaptation (EbA) and nature-based solutions (NBS), are broadly used. In this work we use the term nature-based solutions. NBS is a relatively new concept; it comprises solutions inspired and supported by nature, which provide multiple benefits and help society to adapt to climate change [8,9].
Several studies have investigated the effectiveness of NBS for different aspects in urban areas. In particular, several works focus upon the application of NBS to achieve multiple benefits at the same time, e.g., [10,11,12,13]. Furthermore, several studies have assessed the effectiveness of NBS measures separately on either urban flooding, e.g., [2,14,15,16], or on heat stress, e.g., [17,18,19,20,21,22]. However, urban flooding and heat stress frequently occur simultaneously, and NBS have the potential to be effective in mitigating both. To the best of our knowledge and the literature review to date, there are no reports of an integrated (combined) assessment using quantitative effectiveness of NBS measures for both flooding and heat stress mitigation. Moreover, a limited number of works studied the effectiveness of these measures in a highly dense urban area of a tropical environment [23,24,25].
Further to the above, there is a need to undertake more studies towards the understanding of interactions between different hazards and how they shape vulnerabilities and risk. This can help city planners to make better decisions, and to gain a better understanding of how urban development on one site can influence vulnerability on the other site, and how both of them can happen within the same urban area. Such understanding can lead towards a better identification of locations where mitigation strategies can contribute more efficiently in achieving sustainable urban conditions.
The present work provides a contribution in this direction, and it presents a novel framework for the selection and location of NBS to achieve both urban flood reduction and heat stress mitigation. This framework was applied in a case study area in Bangkok (Thailand) through the application of a macro scale model for urban flooding, and a micro scale microclimatic model for human thermal comfort.

2. Methods and Application

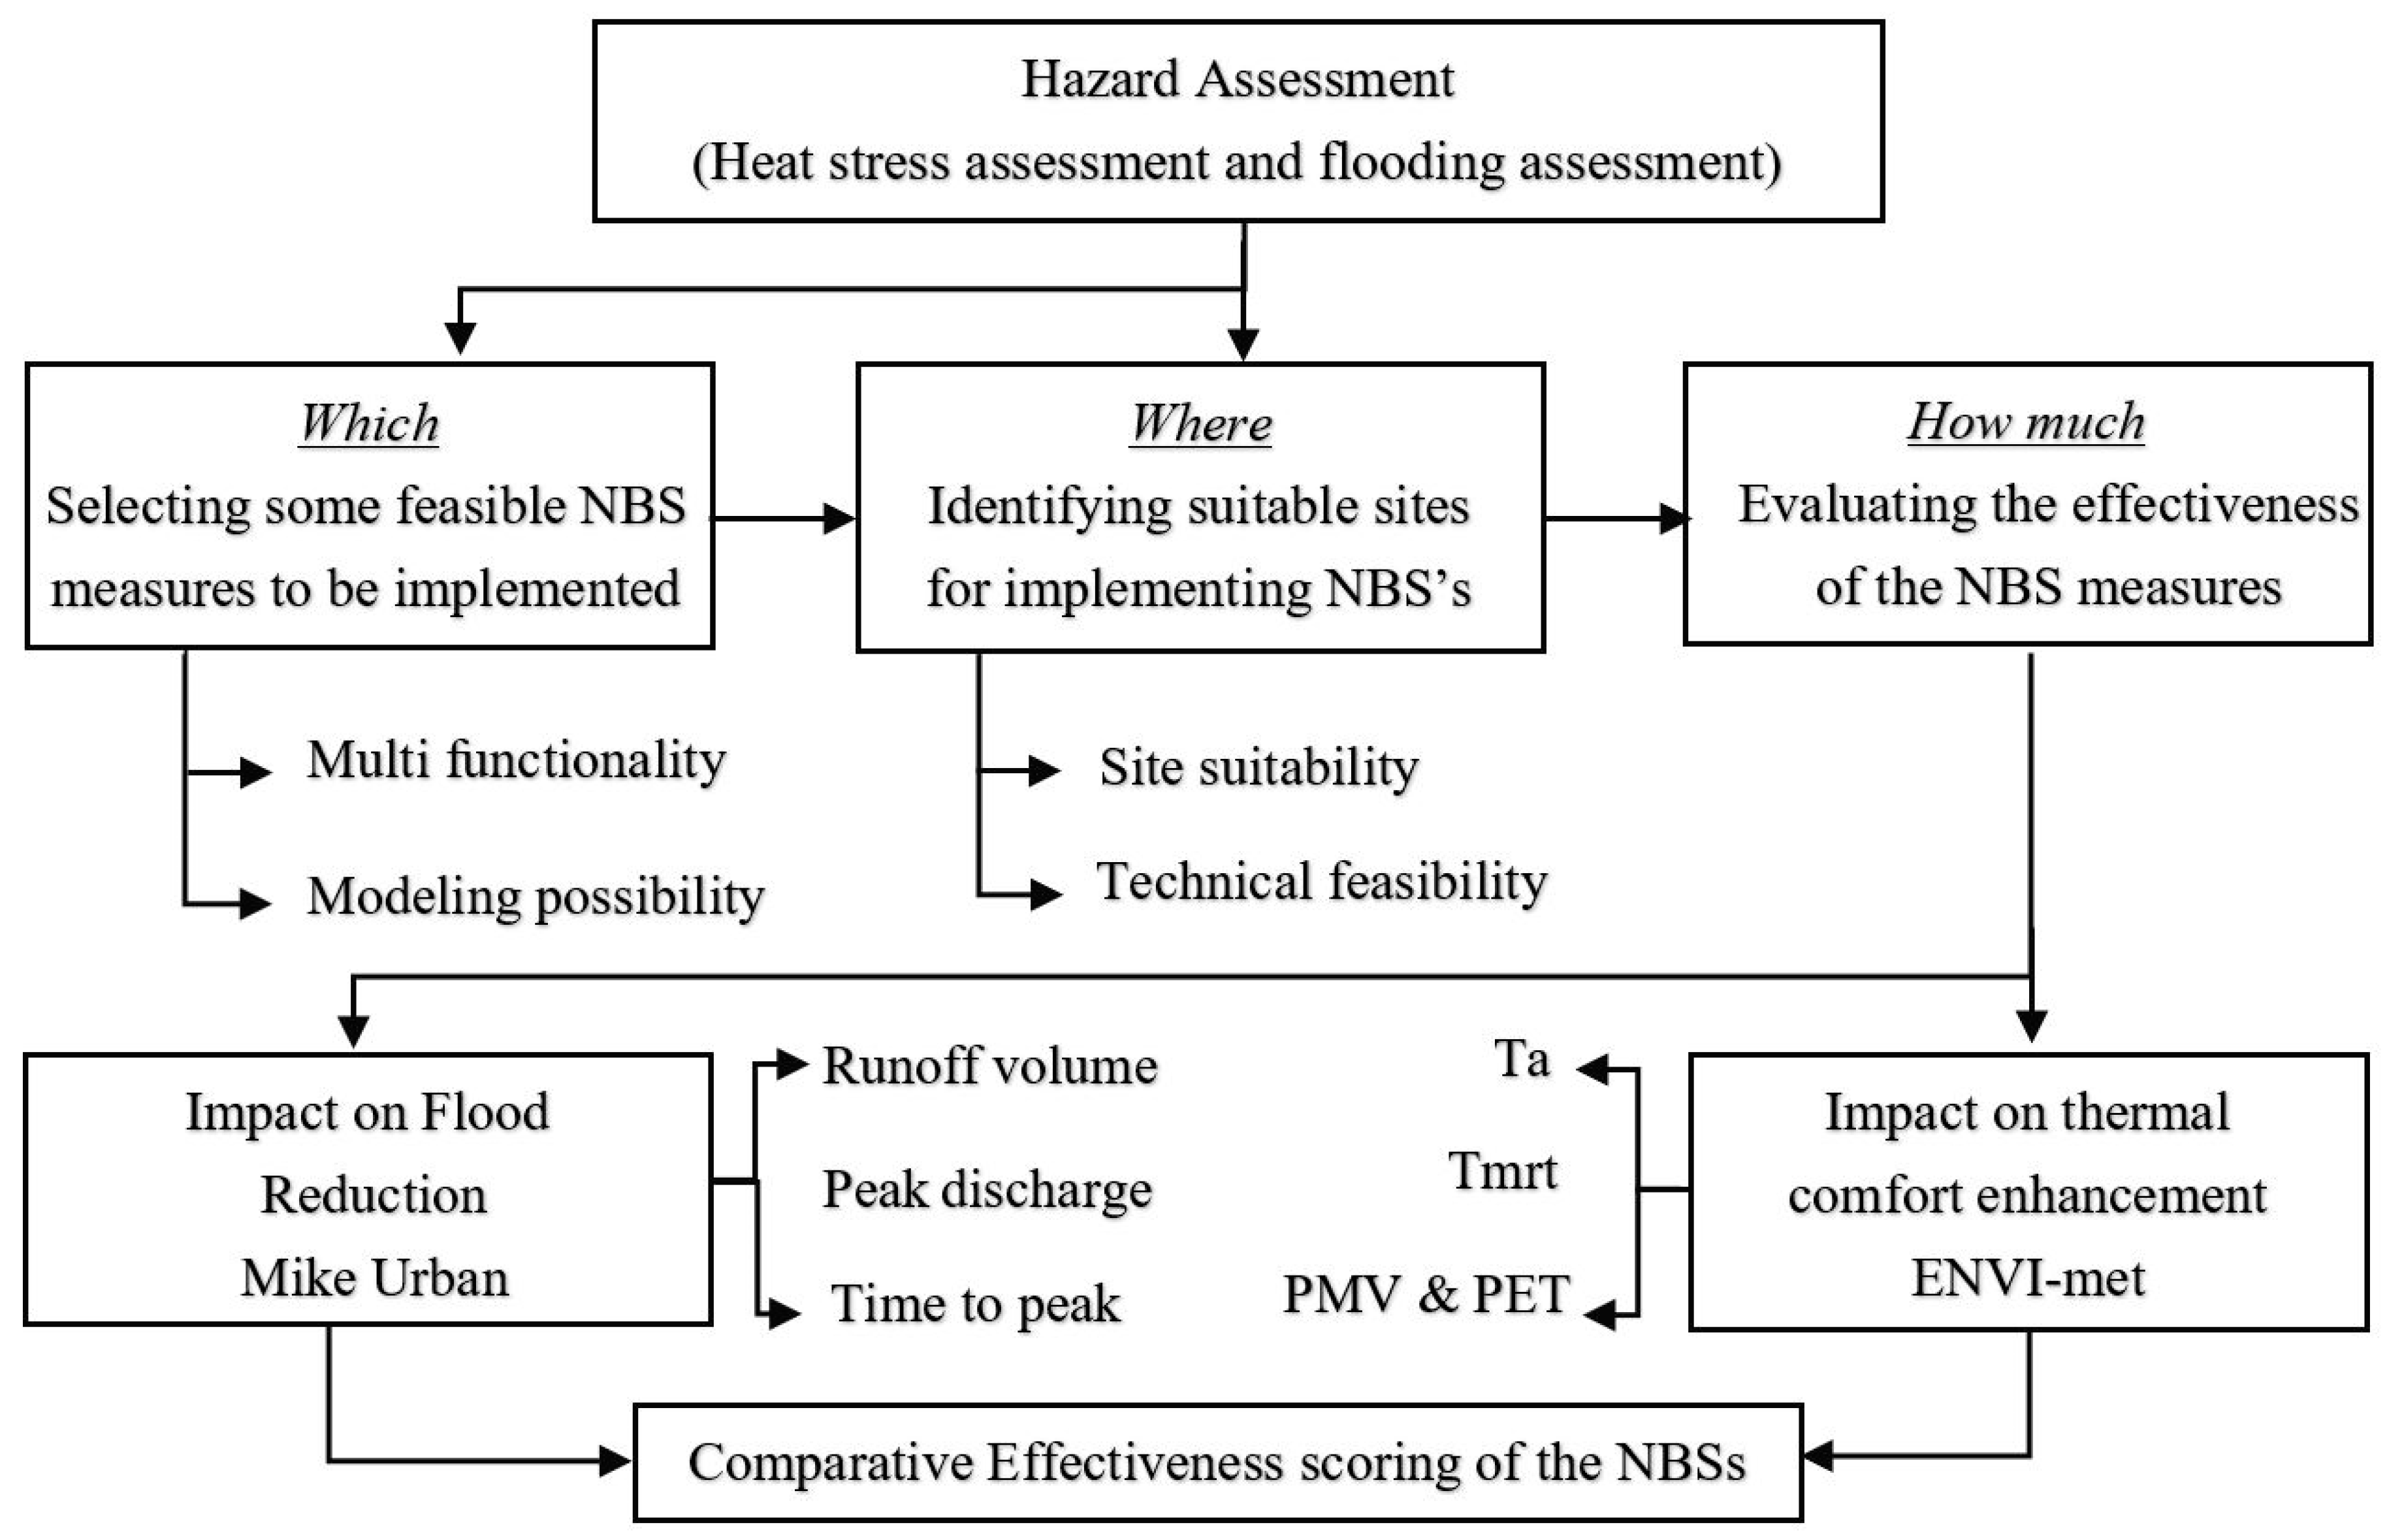
2.1. Framework Description
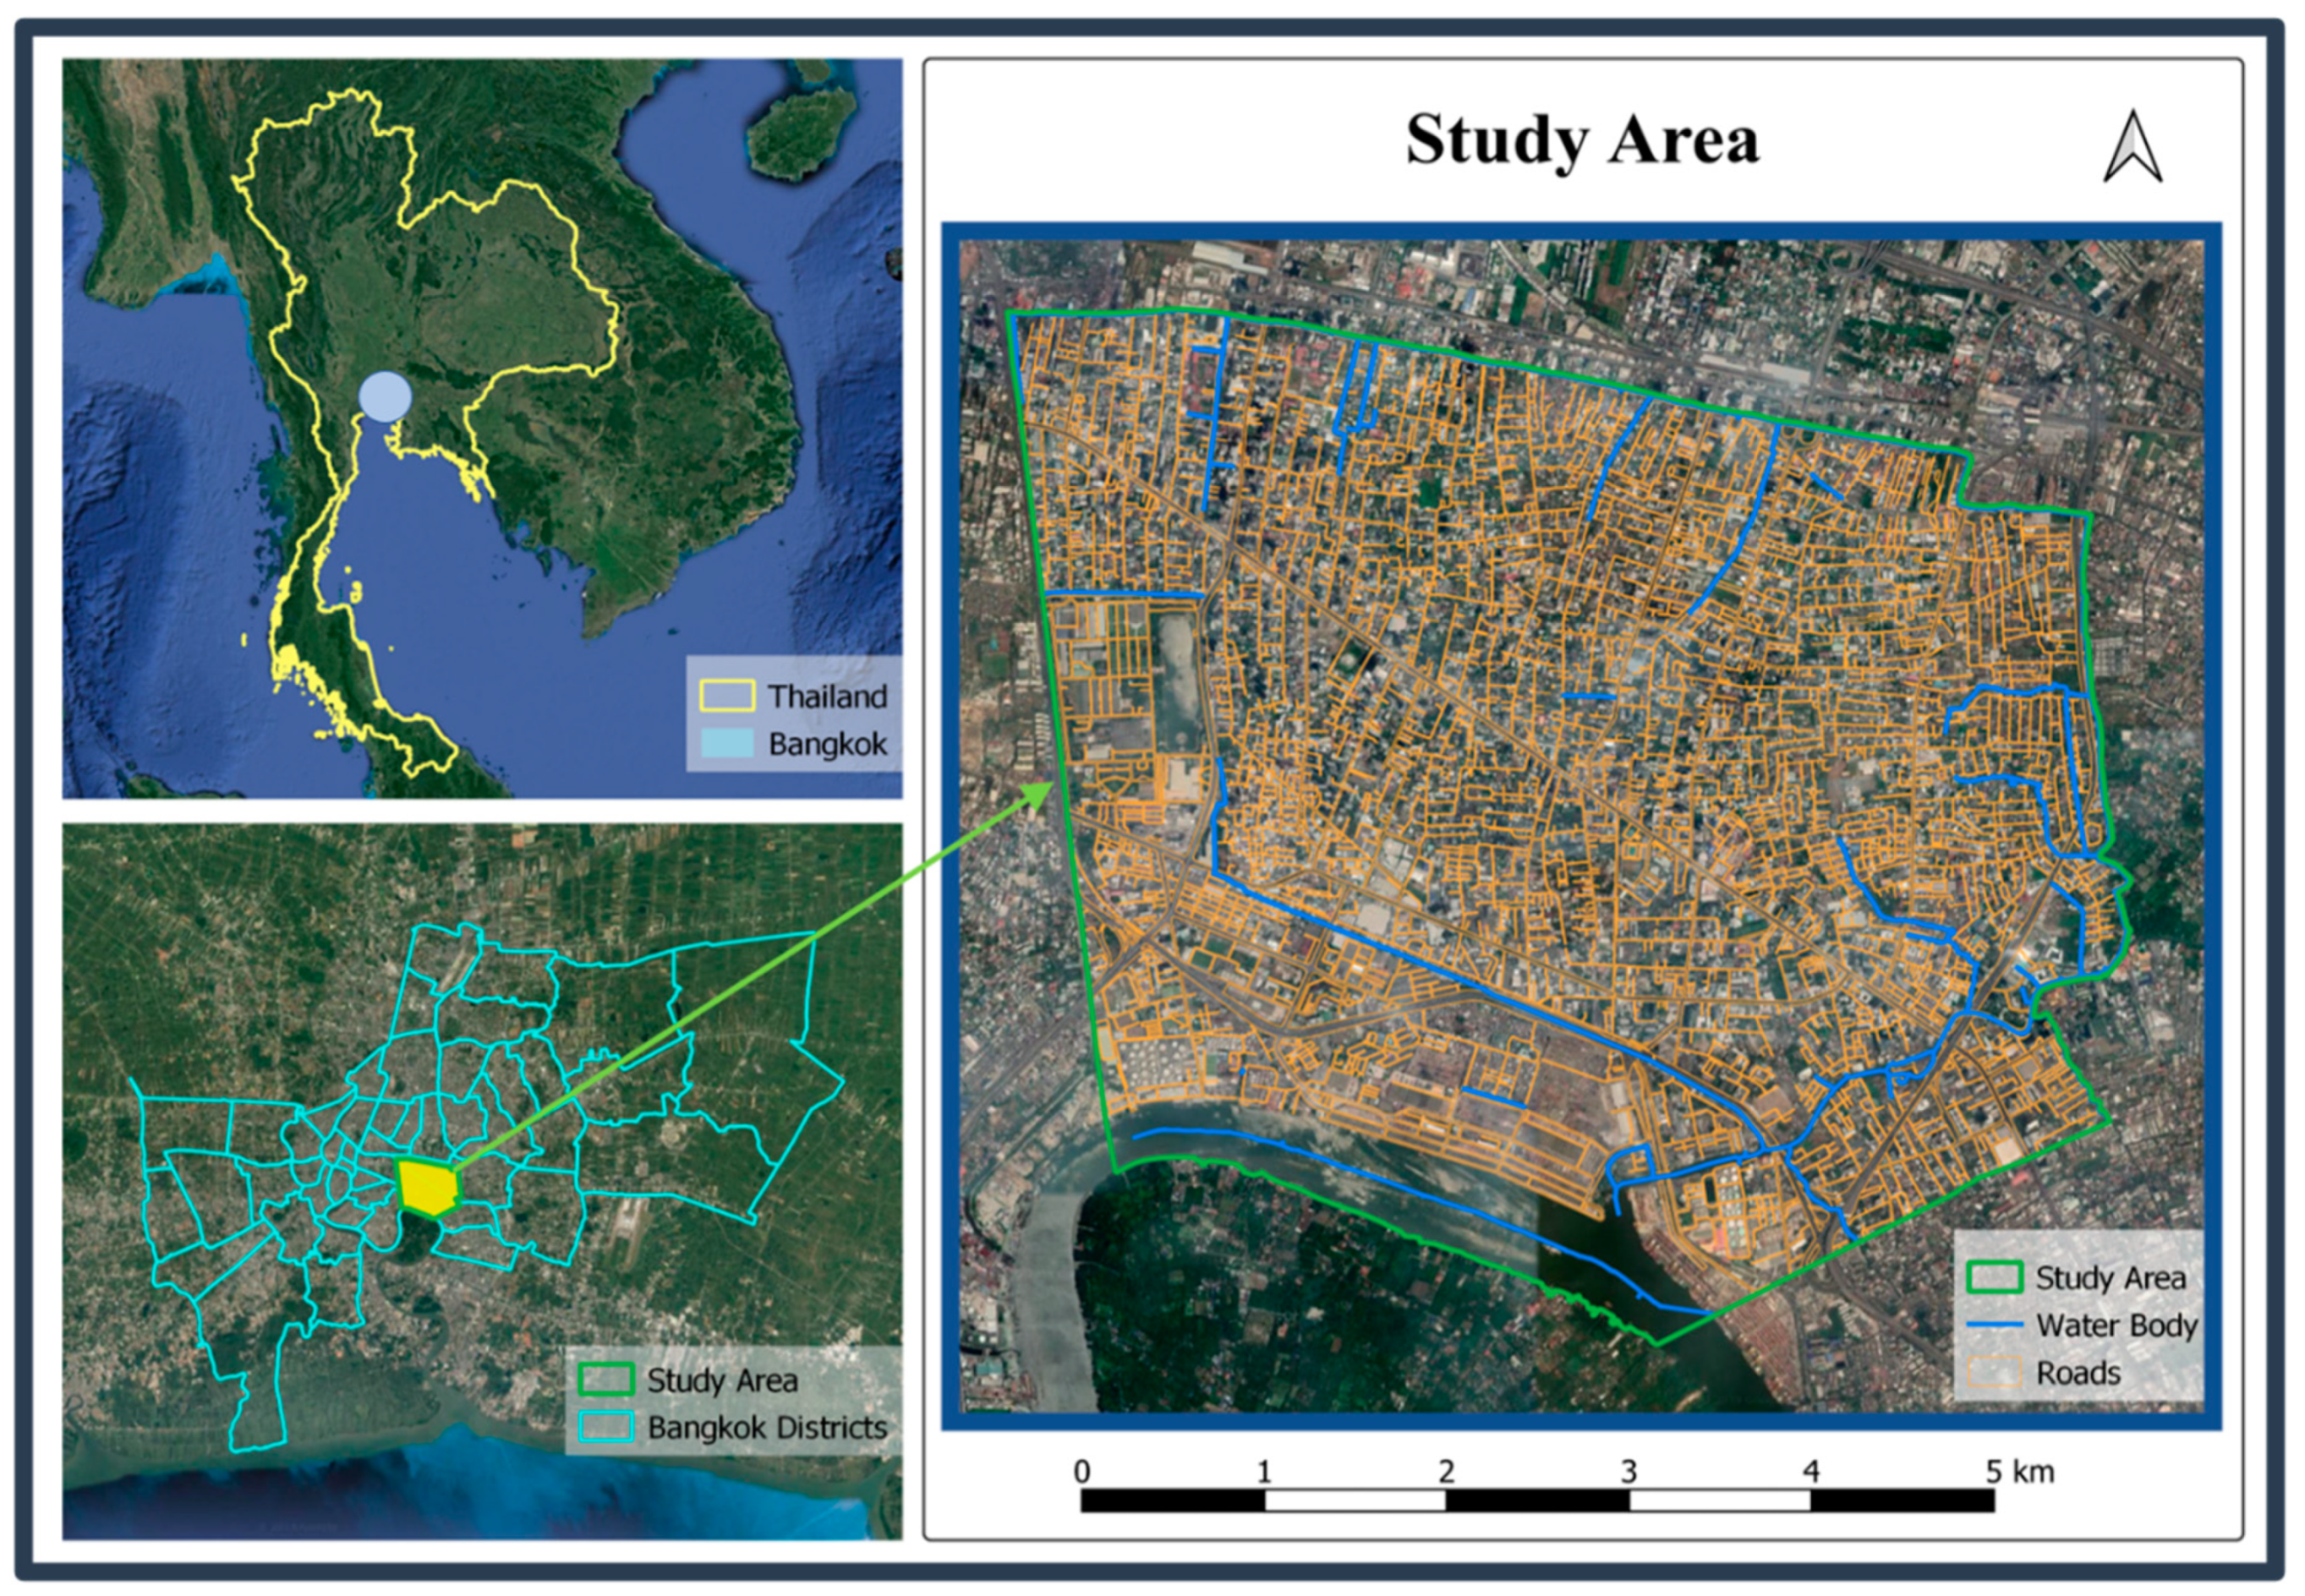
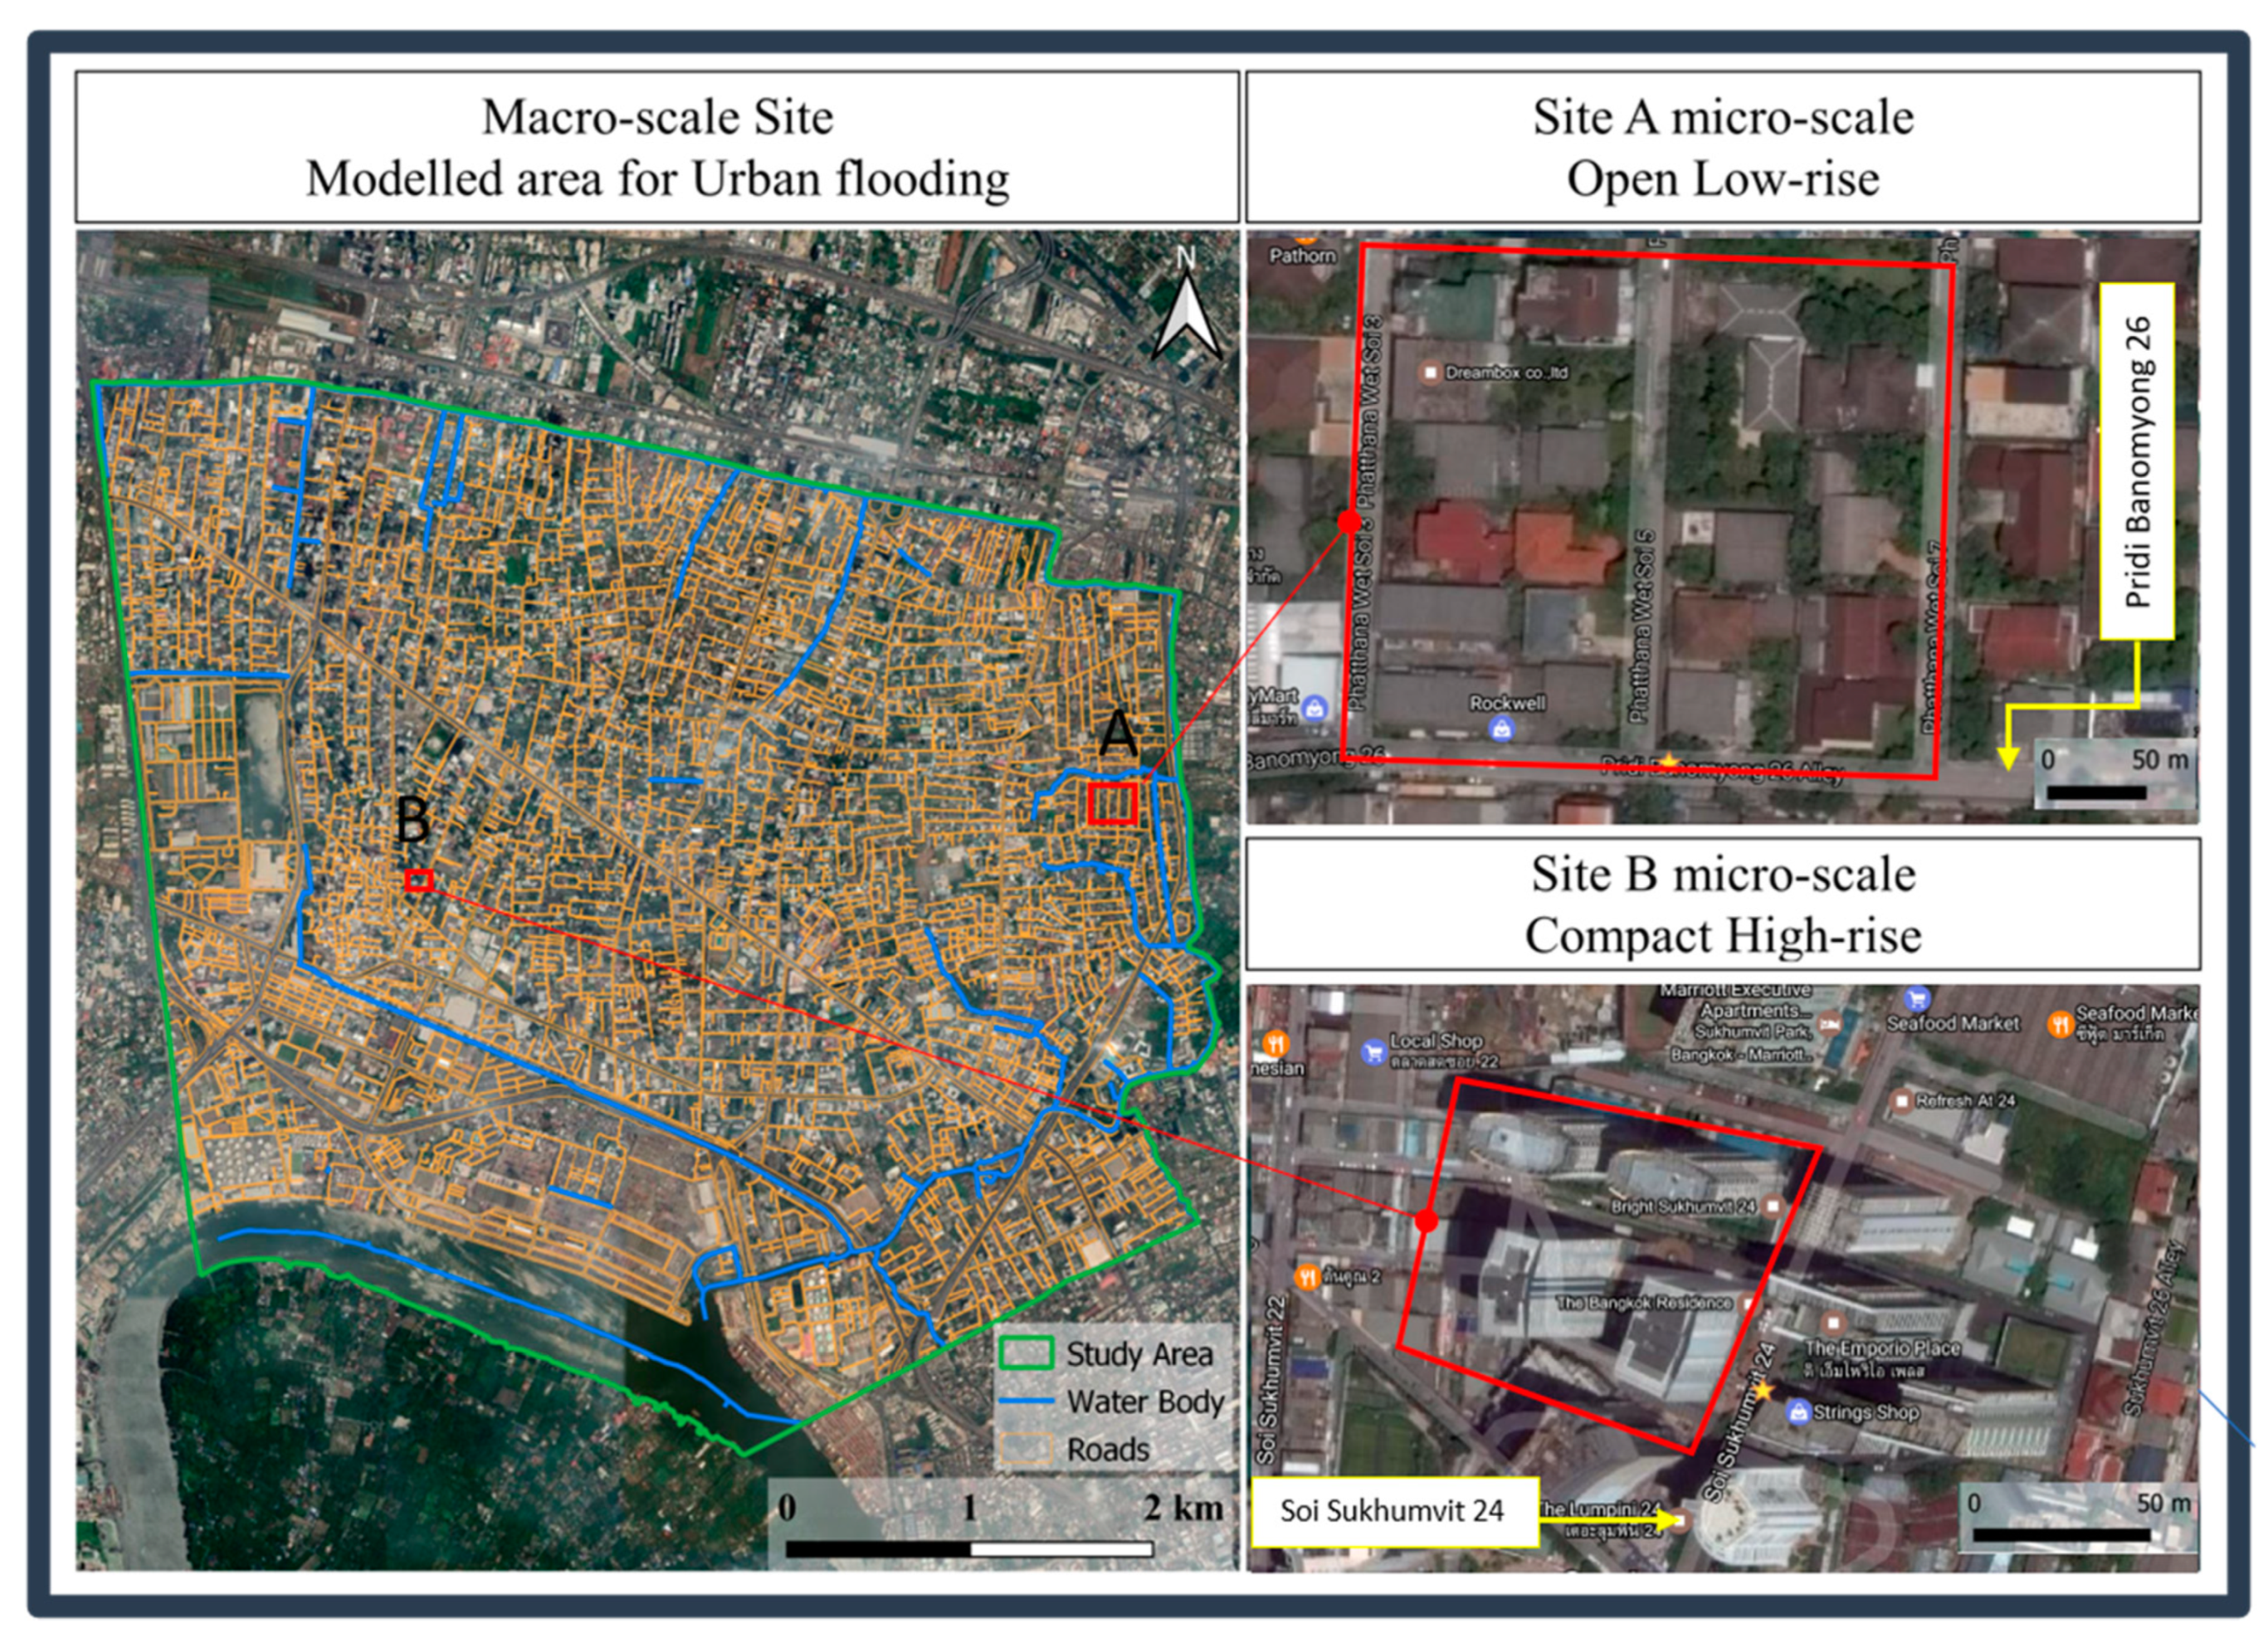
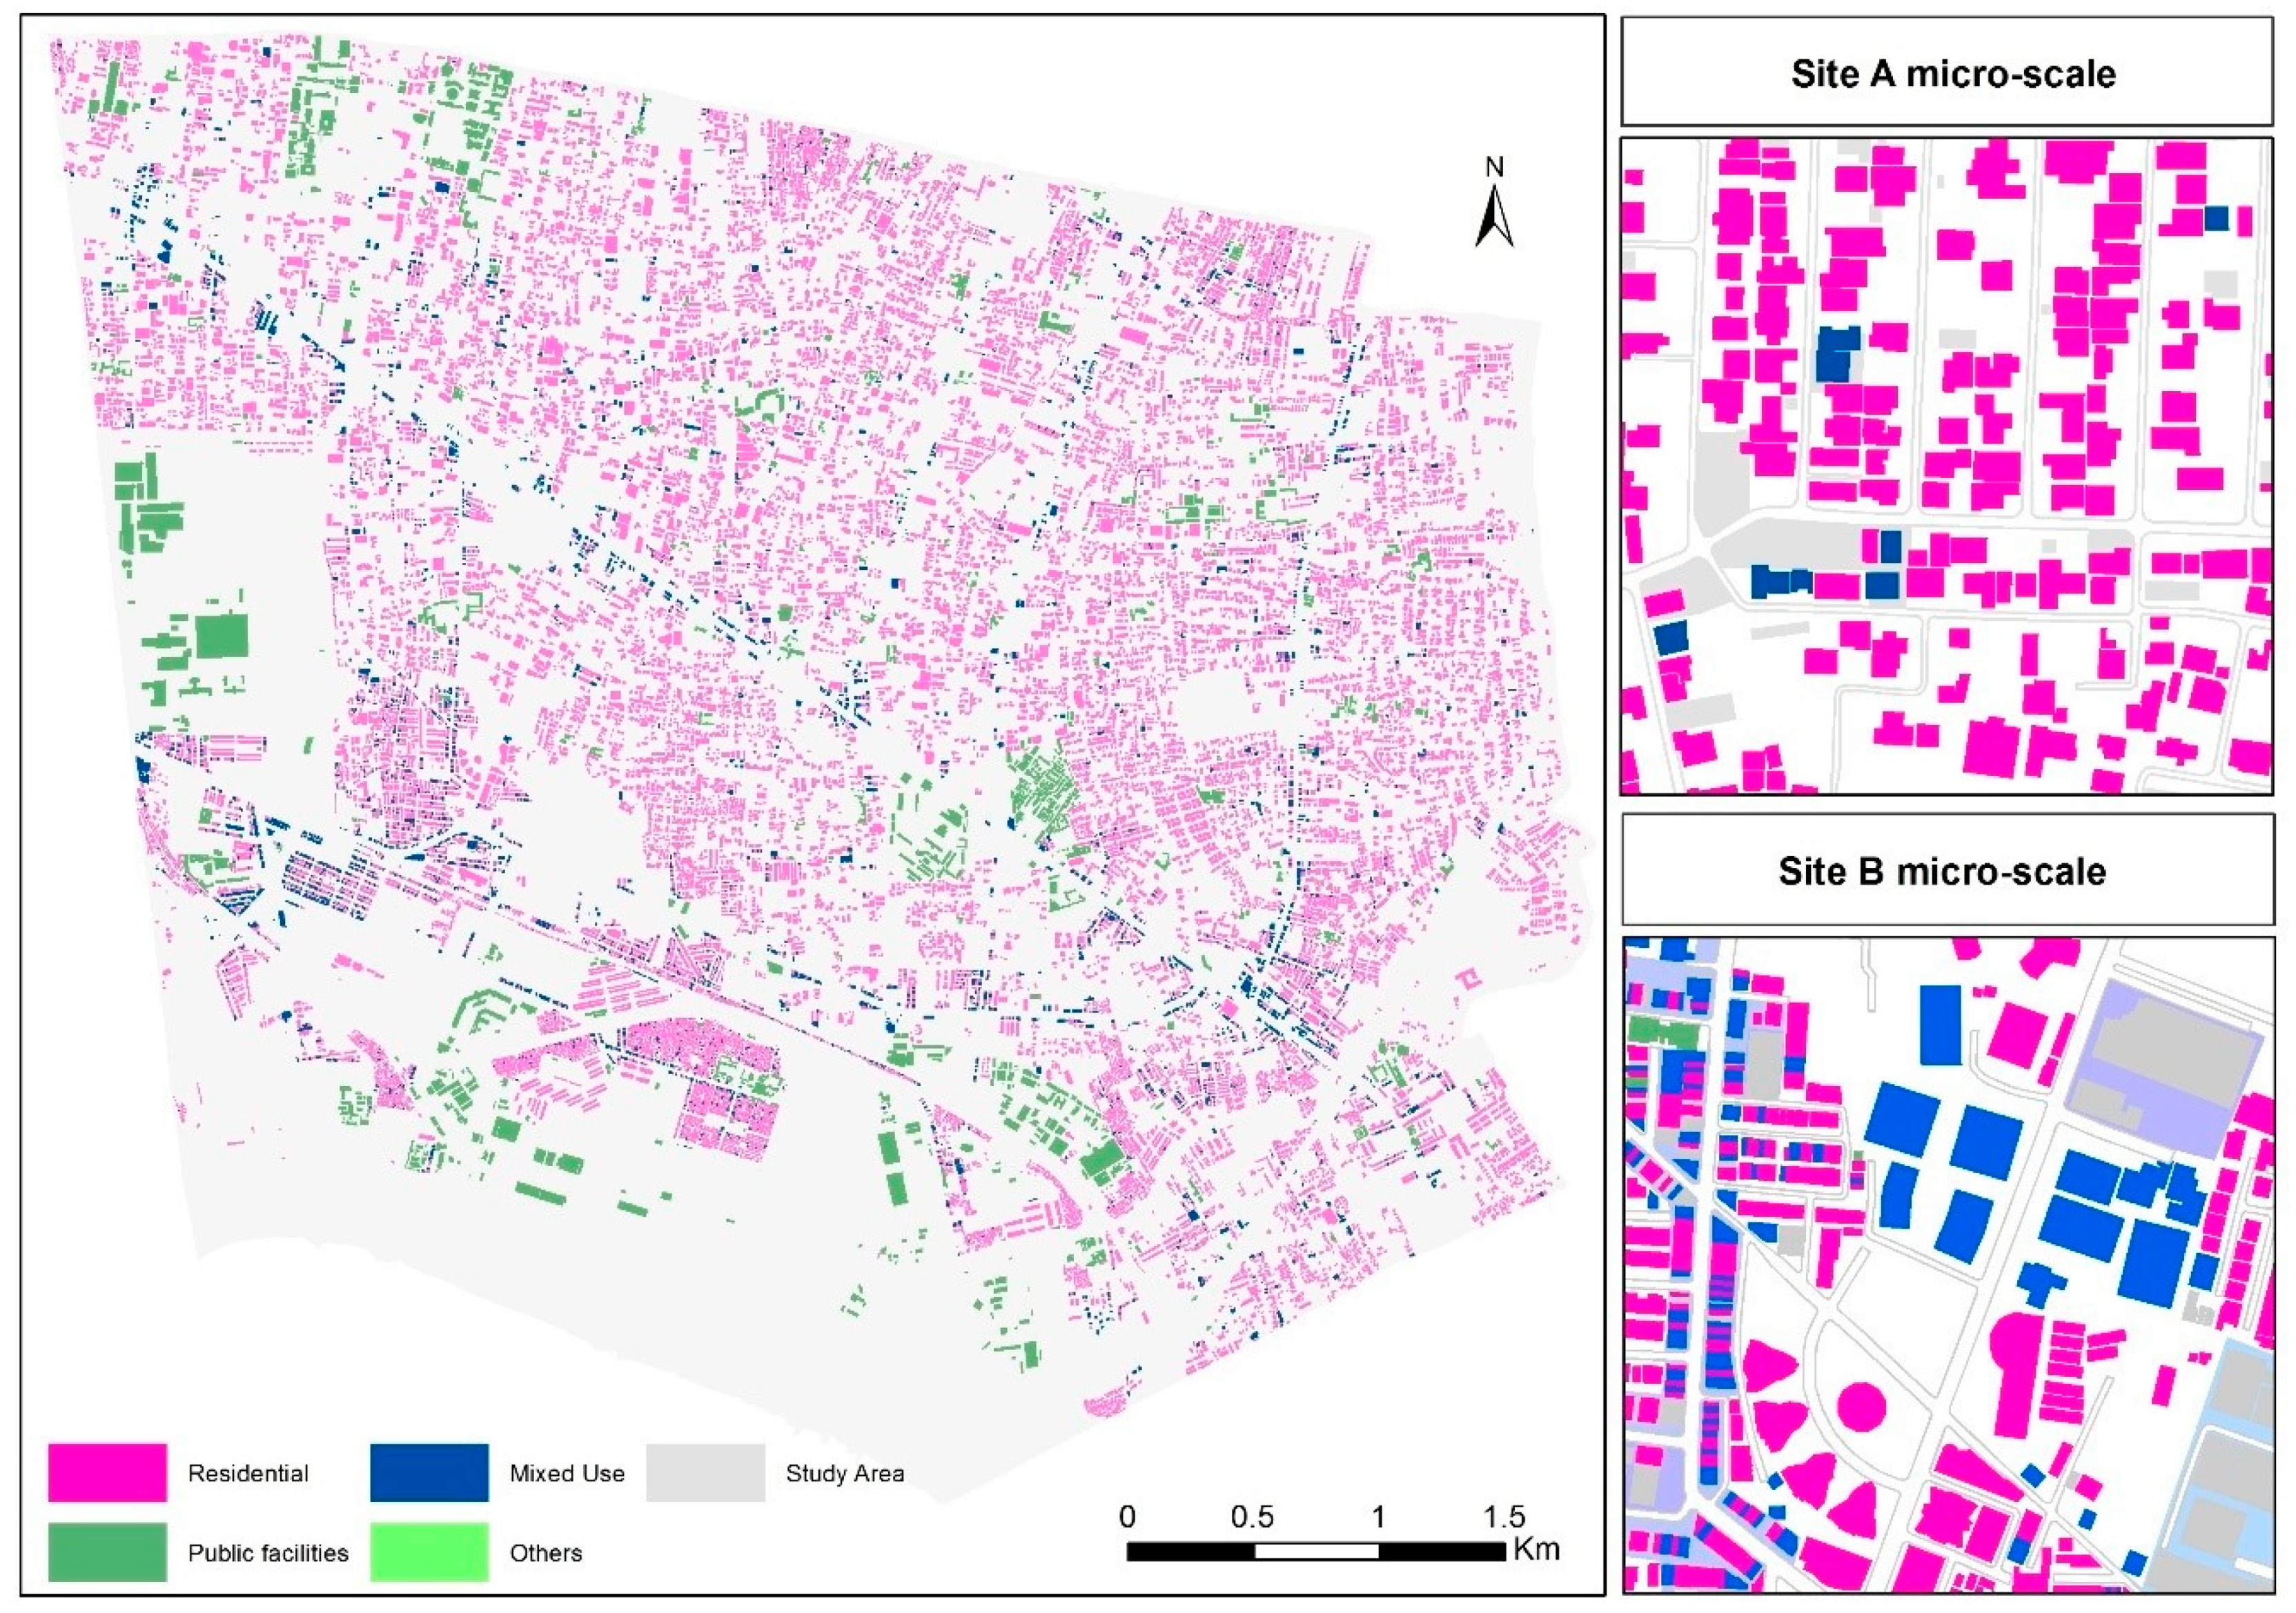
The framework presented in this study includes three parts. The first part evaluates hazards to identify flood and heat stress problems areas. The second part includes site selection and a feasibility analysis of Nature-Based Solutions (NBS) measures, and the third part applies numerical modeling to quantitatively assess the effectiveness of these measures. Figure 1 illustrates different steps of the proposed framework.
The results obtained from hazard assessment are used in the selection of small-scale urban NBS (“Which”) and the identification of suitable areas for their implementation (“Where”). Best management practices (BMP) Sitting and ArcGIS tools are used to identify the locations suitable for the implementation of the selected NBS measures. The last part (“How much”) evaluates the effectiveness of the selected measures for flood reduction and thermal comfort enhancement. Hydrodynamic and microclimatic modeling are used to assess flood and heat stress mitigation effectiveness. The use of micro-climatic models is often used for urban assessments [26,27].
Six parameters are considered for the effectiveness assessment, three related to flood mitigation and three oriented to evaluate heat stress mitigation. Finally, according to the results obtained for these parameters, scores are given to the measures for their comparison. The following sections introduce the case study area framework.

2.2. Study Area

The framework was applied in the Sukhumvit area, located in central Bangkok (Figure 2), which is a highly dense urban area of approximately 23 Km2. According to The World Bank [28], urban growth in Thailand is mostly situated in the Bangkok urban area, which is among the twenty largest cities in Asia in terms of population, approaching 10 million people. Bangkok is a growing city located in a tropical area, and it is facing many extreme climatic conditions, which will also be intensified in the future as a result of climate change [29].
The annual rainfall in the city is 1651 mm, which mainly takes place in the wet season (from May to October). According to Rehan et al. [30] the number of annual rainy days was increased from 90 to 110 days in the last 30 years. Additionally, the study done by Sheikh [31] shows that the average mean temperature in Bangkok was increased by 0.6 °C between 1985 and 2014. Arifwidodo and Tanaka [32] studied the effect of the Urban Heat Island (UHI) in Bangkok, showing that there is a mean maximum of 5 °C UHI intensity (UHII) between semi urban and urban areas, and a mean maximum UHII of 2 °C between dry and in rainy seasons. In addition, there is a maximum night time UHII of 7 °C during January in Bangkok [29,32].
Flooding is also a severe problem in Bangkok, causing important economic and health-related problems. This problem has been aggravated in the last years due to urbanization, which has generated land use changes in the city. According to Srivanit et al. [29] the urban/built-up land in Bangkok and its metropolitan area increased by almost three times between 1994 and 2009, growing from 15% in 1994, to 42% in 2009. In contrast, a pronounced decrease in the vegetated area was observed from 1994 (72%) to 2009 (40%). The land use in the Study Area of Sukhumvit is presented in Appendix A.
Flooding is caused by excessive local rainfalls or by the overtopping of embankments due to a high water level in the Chao Phraya River [4,33]. Even though there are numerous pumping stations inside the city to pump the excess of storm water to the river, the city is still highly vulnerable to flooding. The problem is aggravated by over extraction of ground water, which has caused land subsidence of up to 15 cm in many locations [34].

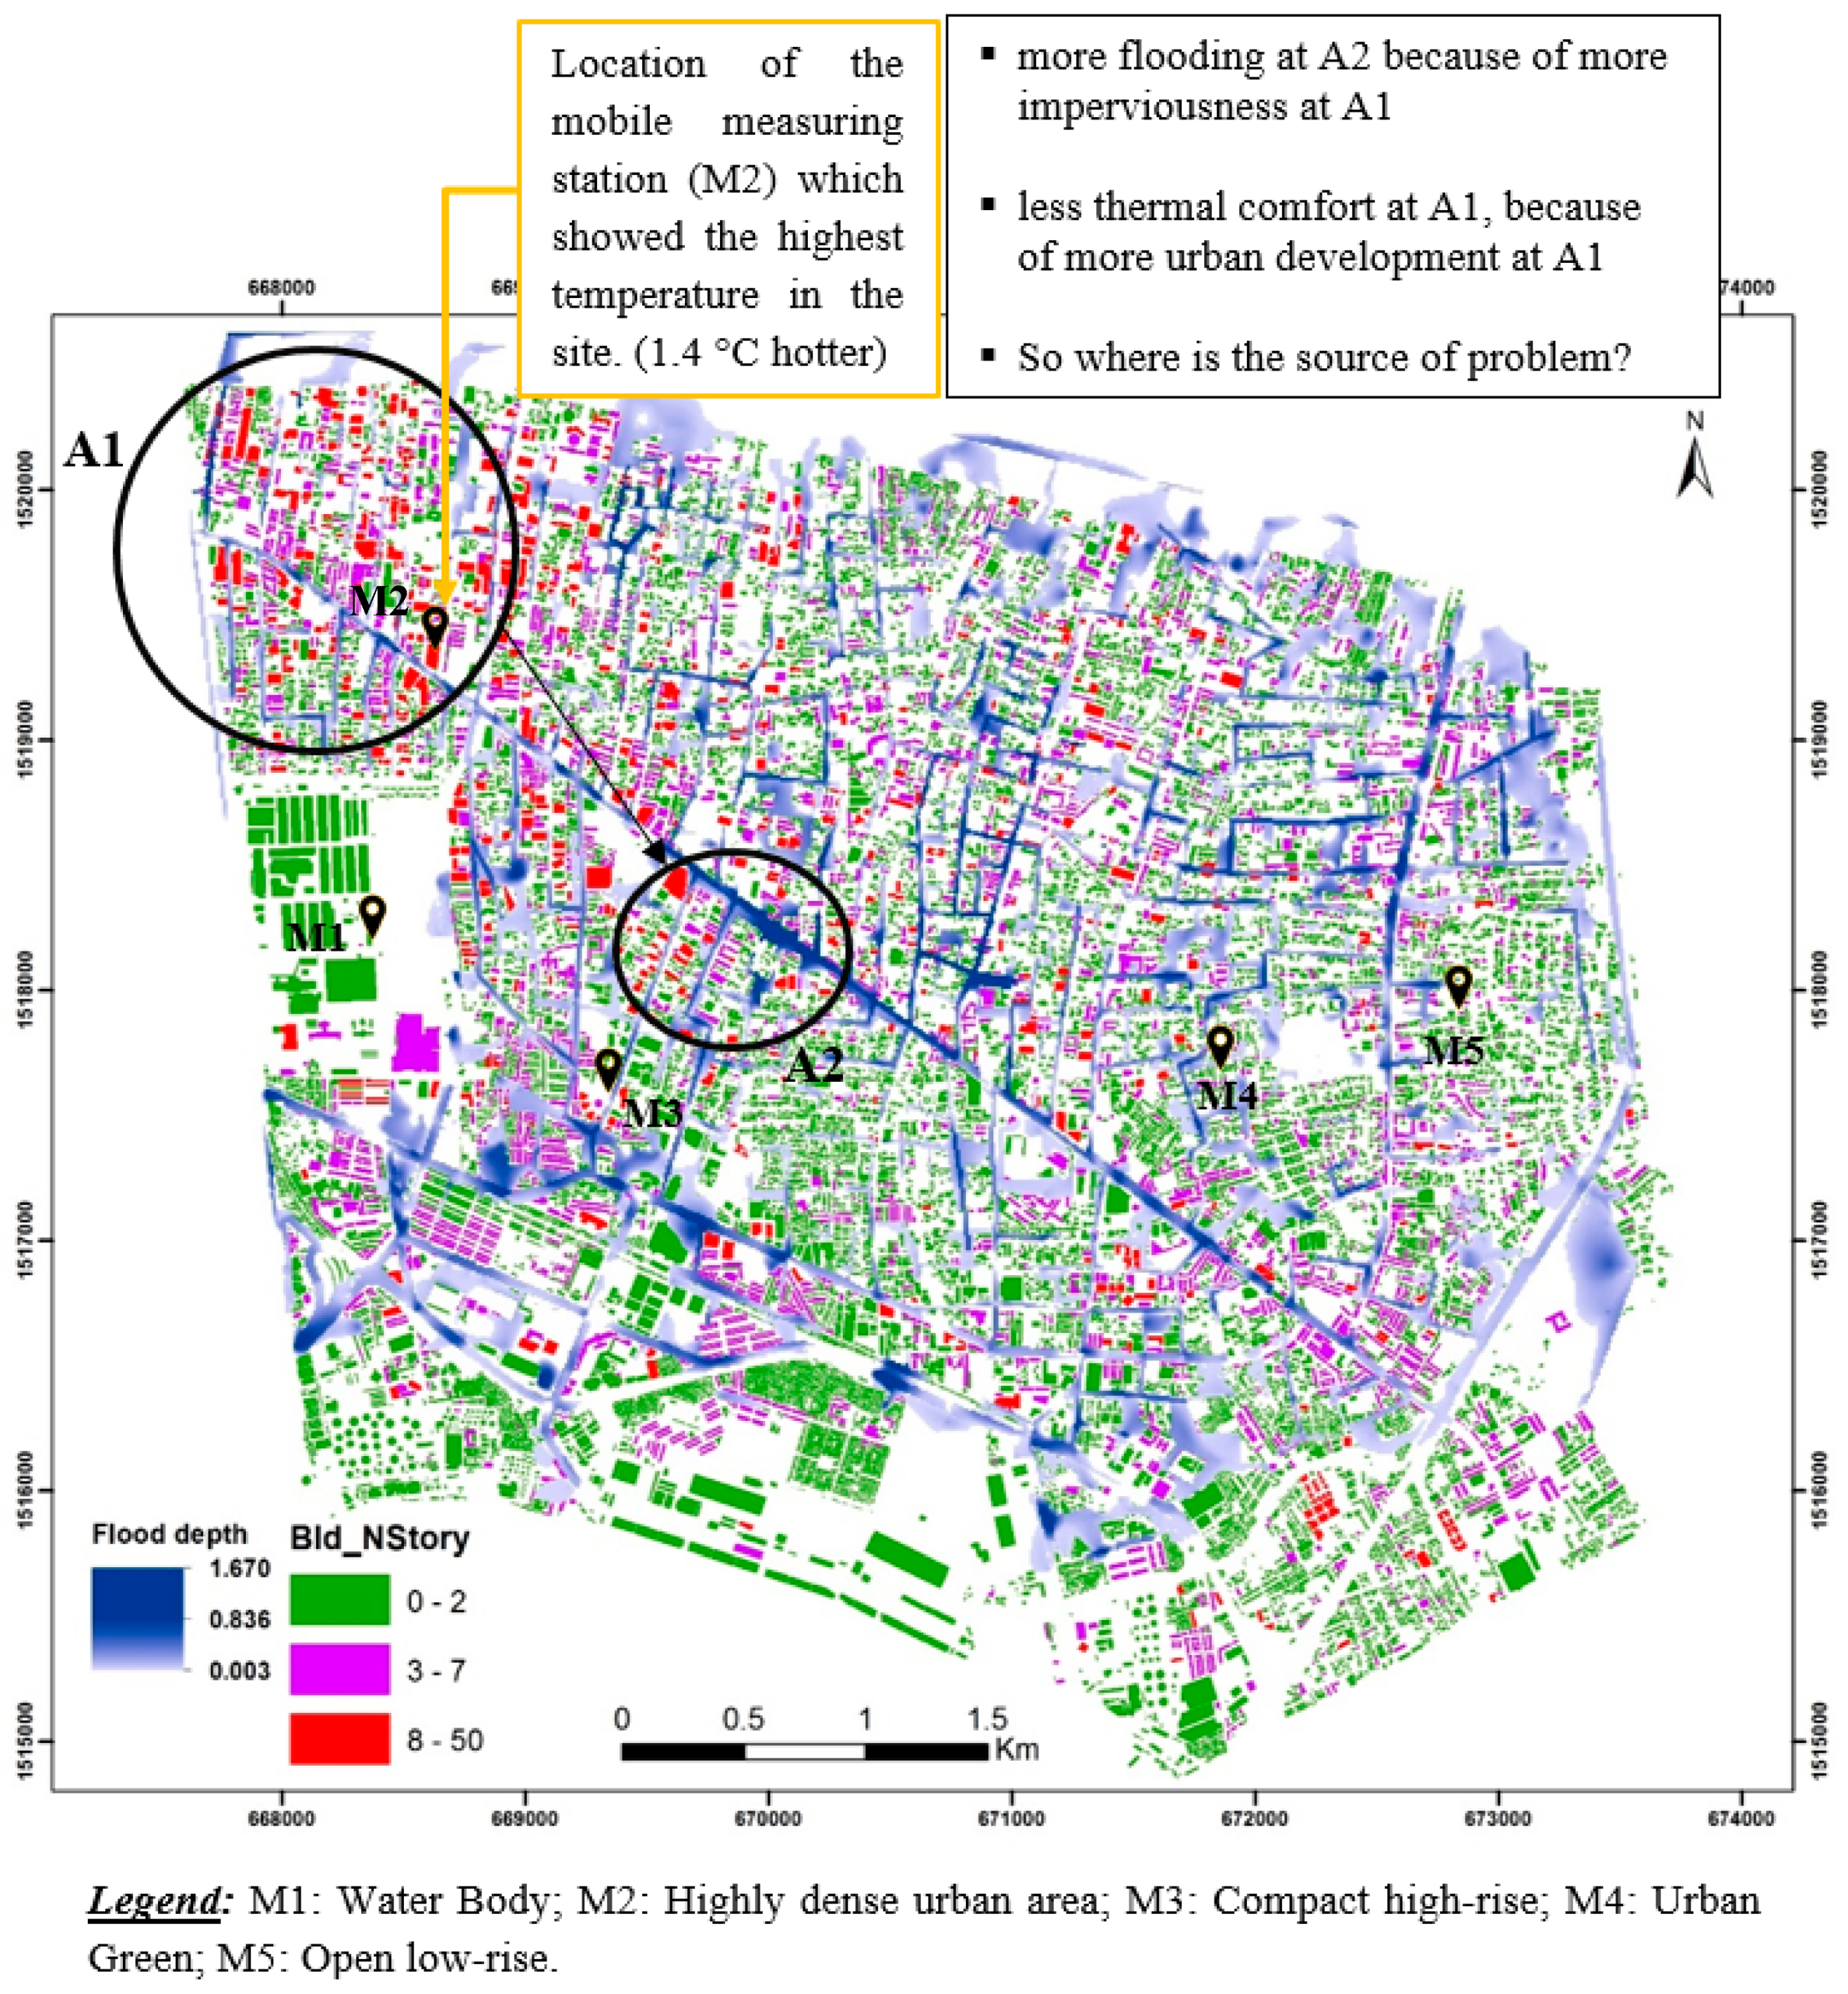
2.3. Hazard Assessment

Hazard assessment was undertaken to gain a better understanding of existing conditions, and to identify locations which are more hazardous in terms of urban flooding and heat stress. The choice to undertake a macro scale approach for urban flood modeling and a micro scale approach for the thermal comfort modeling was based on field observations and relevant literature review.
For assessing urban flood hazards, the existing sewer system was modeled with a hydrodynamic model, considering several scenarios with particular emphasis on areas with a higher frequency of flooding. In terms of hazards due to heat stress, this assessment aimed to identify and evaluate the effects from different urban land uses on heat stress and human thermal comfort. For this purpose, field data was collected from both fixed weather stations and mobile weather measurements (using the instrument Kestrel 5400 Heat Stress Tracker). Five different urban land uses were considered for the heat stress assessment with mobile weather measurements (Table 1), and categorized following the work of Stewart and Oke [35].
The assessment of heat stress variation was based on measurements of different weather parameters taken at five different locations. These weather parameters were: Air temperature (Ta), mean radiant temperature (Tmrt), predicted mean vote (PMV) and physiological equivalent temperature (PET). The rationale behind this assessment was to analyze the effect of different urban land uses on heat stress and thermal comfort.
In terms of the selection of parameters, according to Coccolo et al. [36], “the Tmrt is considered to be as an artificial measure to express the degree of exposure to the environmental radiation. The radiant temperature is related to the amount of radiant heat transferred from a surface, and it depends on the material’s ability to absorb or emit heat, or its emissivity”. As Höppe [37] stated, “PET is defined as the air temperature at which, in a typical indoor setting (without wind and solar radiation), the heat budget of the human body is balanced with the same core and skin temperature as under the complex outdoor conditions to be assessed”. Predicted mean vote (PMV) is one of the most used thermal indices by researchers. It is initially based on Fanger’s heat balance model, and is an index ranging from −3 for cold weather and +3 for hot weather). This index is an outcome of A result of the perceived sensation of the thermal environment of a group of people, and was initially developed for indoor environments [38].

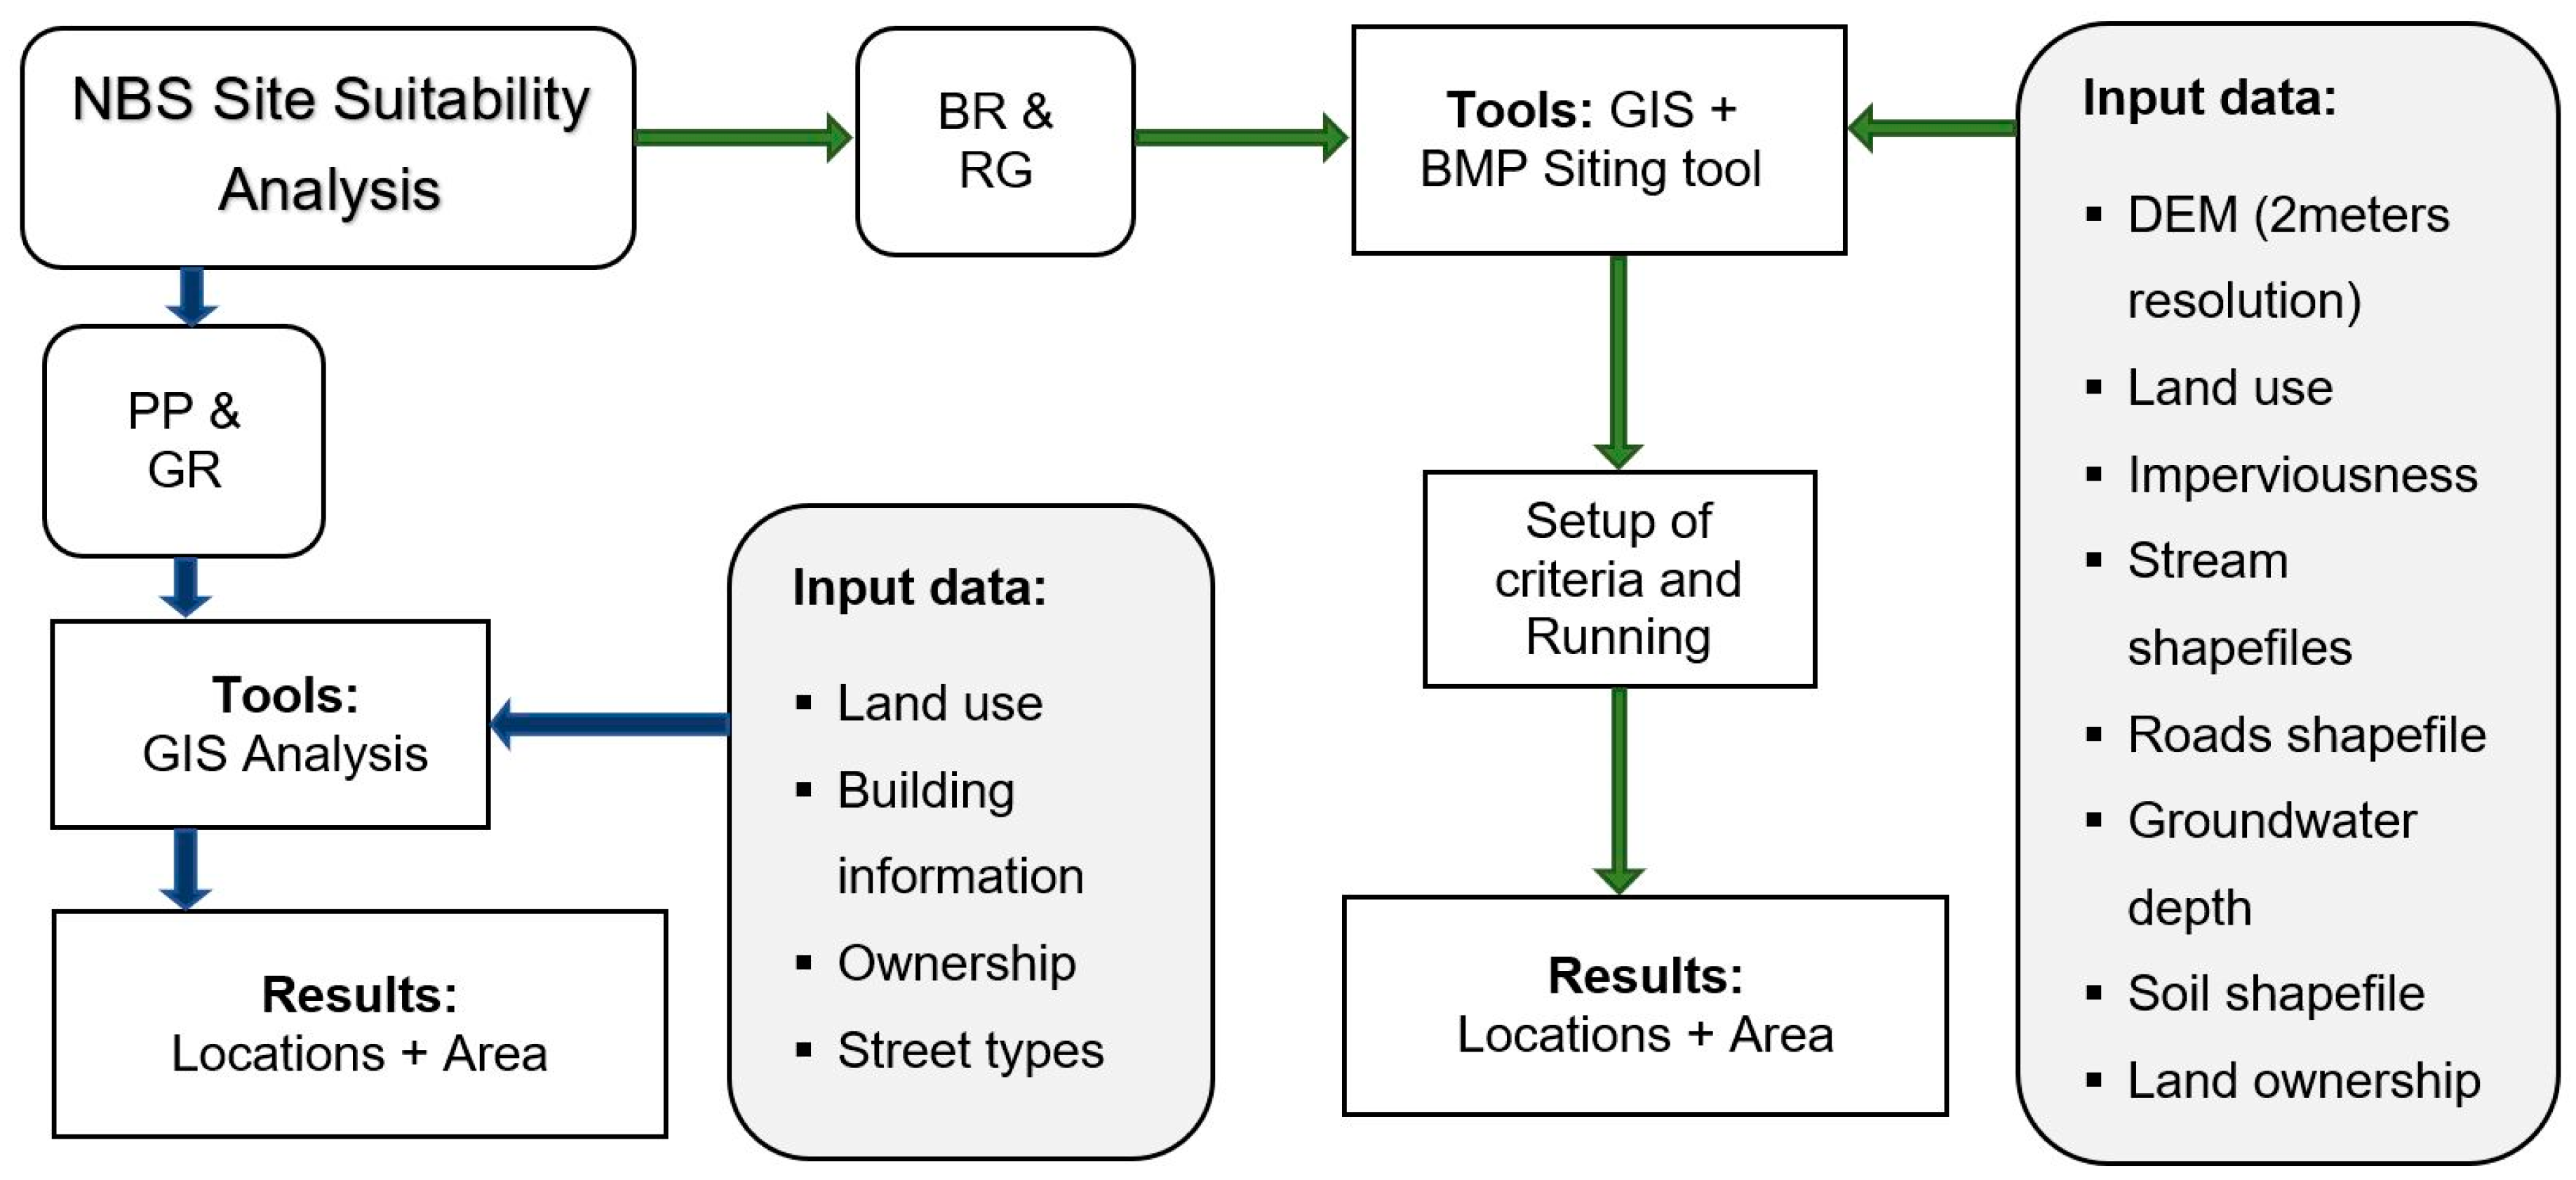
2.4. Selection of NBS Types and Their Suitable Sites: Which and Where

Four measures were selected based on several factors, including: Recommendations in the literature [39,40,41], feasibility of implementation in the case study area and the capability to be modeled in Mike Urban (for urban flood analysis) and the ENVI-met microclimatic simulation model (for thermal comfort analysis). The selected measures are: green roofs, pervious pavements, bio retentions and rain gardens. Details about each measure and the parameters used in the models are provided in Appendix B.
For suitability analysis, these measures were categorized in two groups: Green roof (GR) and pervious pavement (PP) in the first category, and bio-retention (BR) and rain garden (RG) in the second one. The analysis of possible locations and the maximum application of these measures was done using satellite images and the geographic information system (GIS) data. For the second category, the BMP sitting tool Sustain [42] was also used (see Appendix C).
The boundary of the case study area (macro scale) is depicted with a green line in Figure 3 (left). Two distinct locations inside the case study area of Sukhumvit were chosen for microclimatic simulations, and they are shown in Figure 3 (within the red rectangles). These locations were categorized as open low-rise (A) and compact high-rise (B), and are examples of two most common urban configurations in the case study area: A site with low-rise buildings and a site with dense high-rise buildings. This selection was made to achieve a comprehensive analysis of how the measures will be effective in each of these conditions. The two selected micro scale sites represent two different urban configurations for urban climate zones based on the research done by Stewart and Oke [35] (see Appendix D).

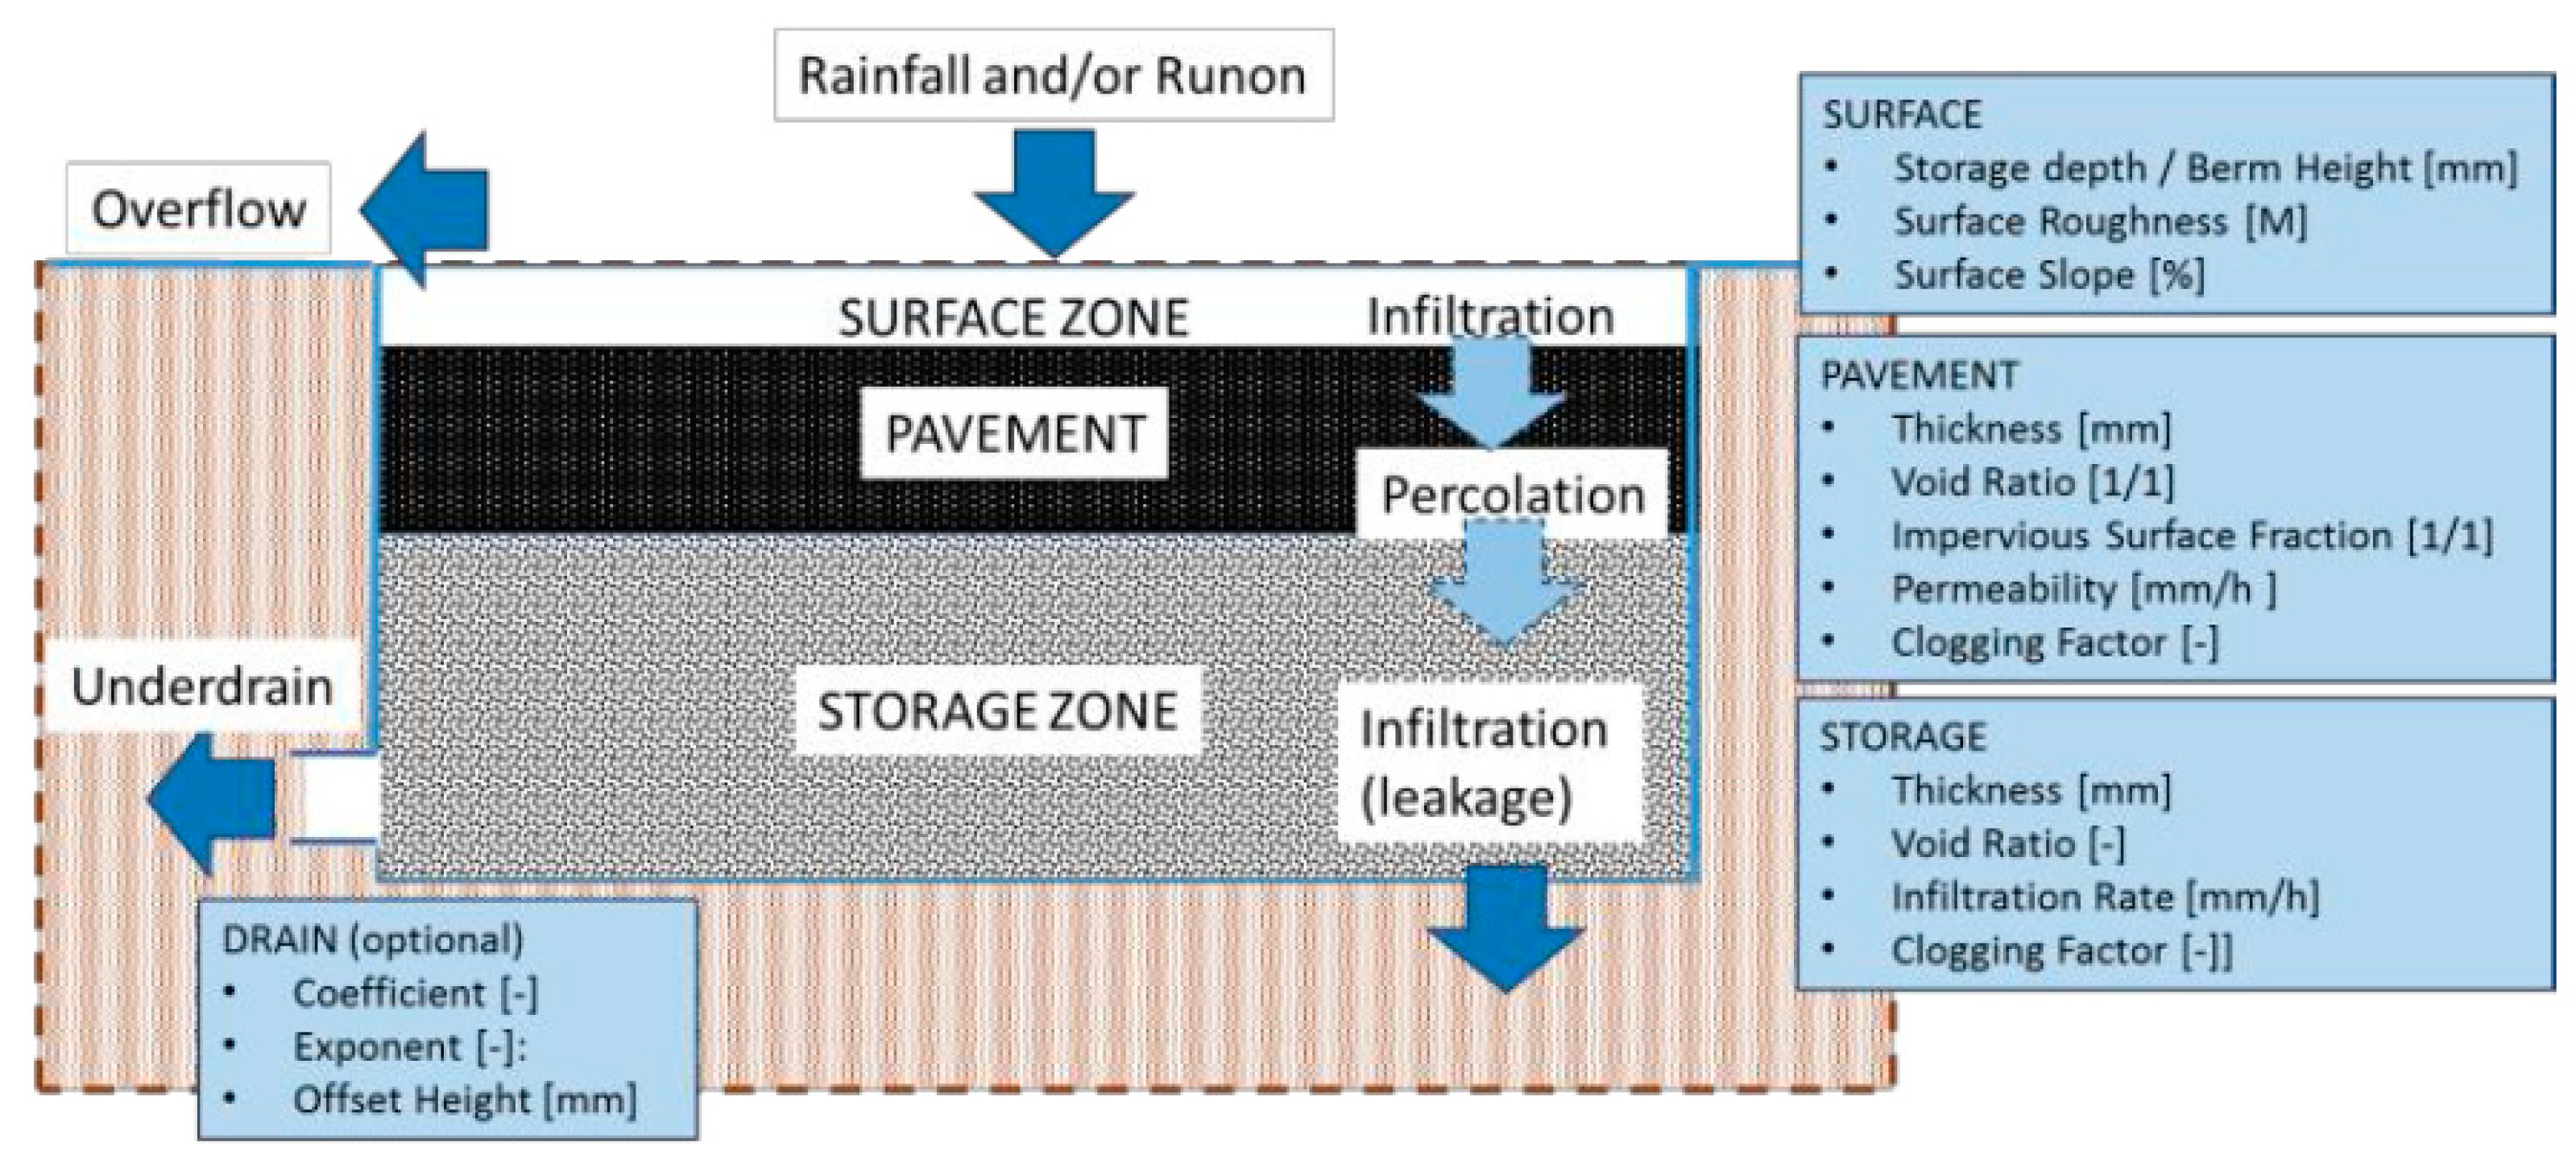
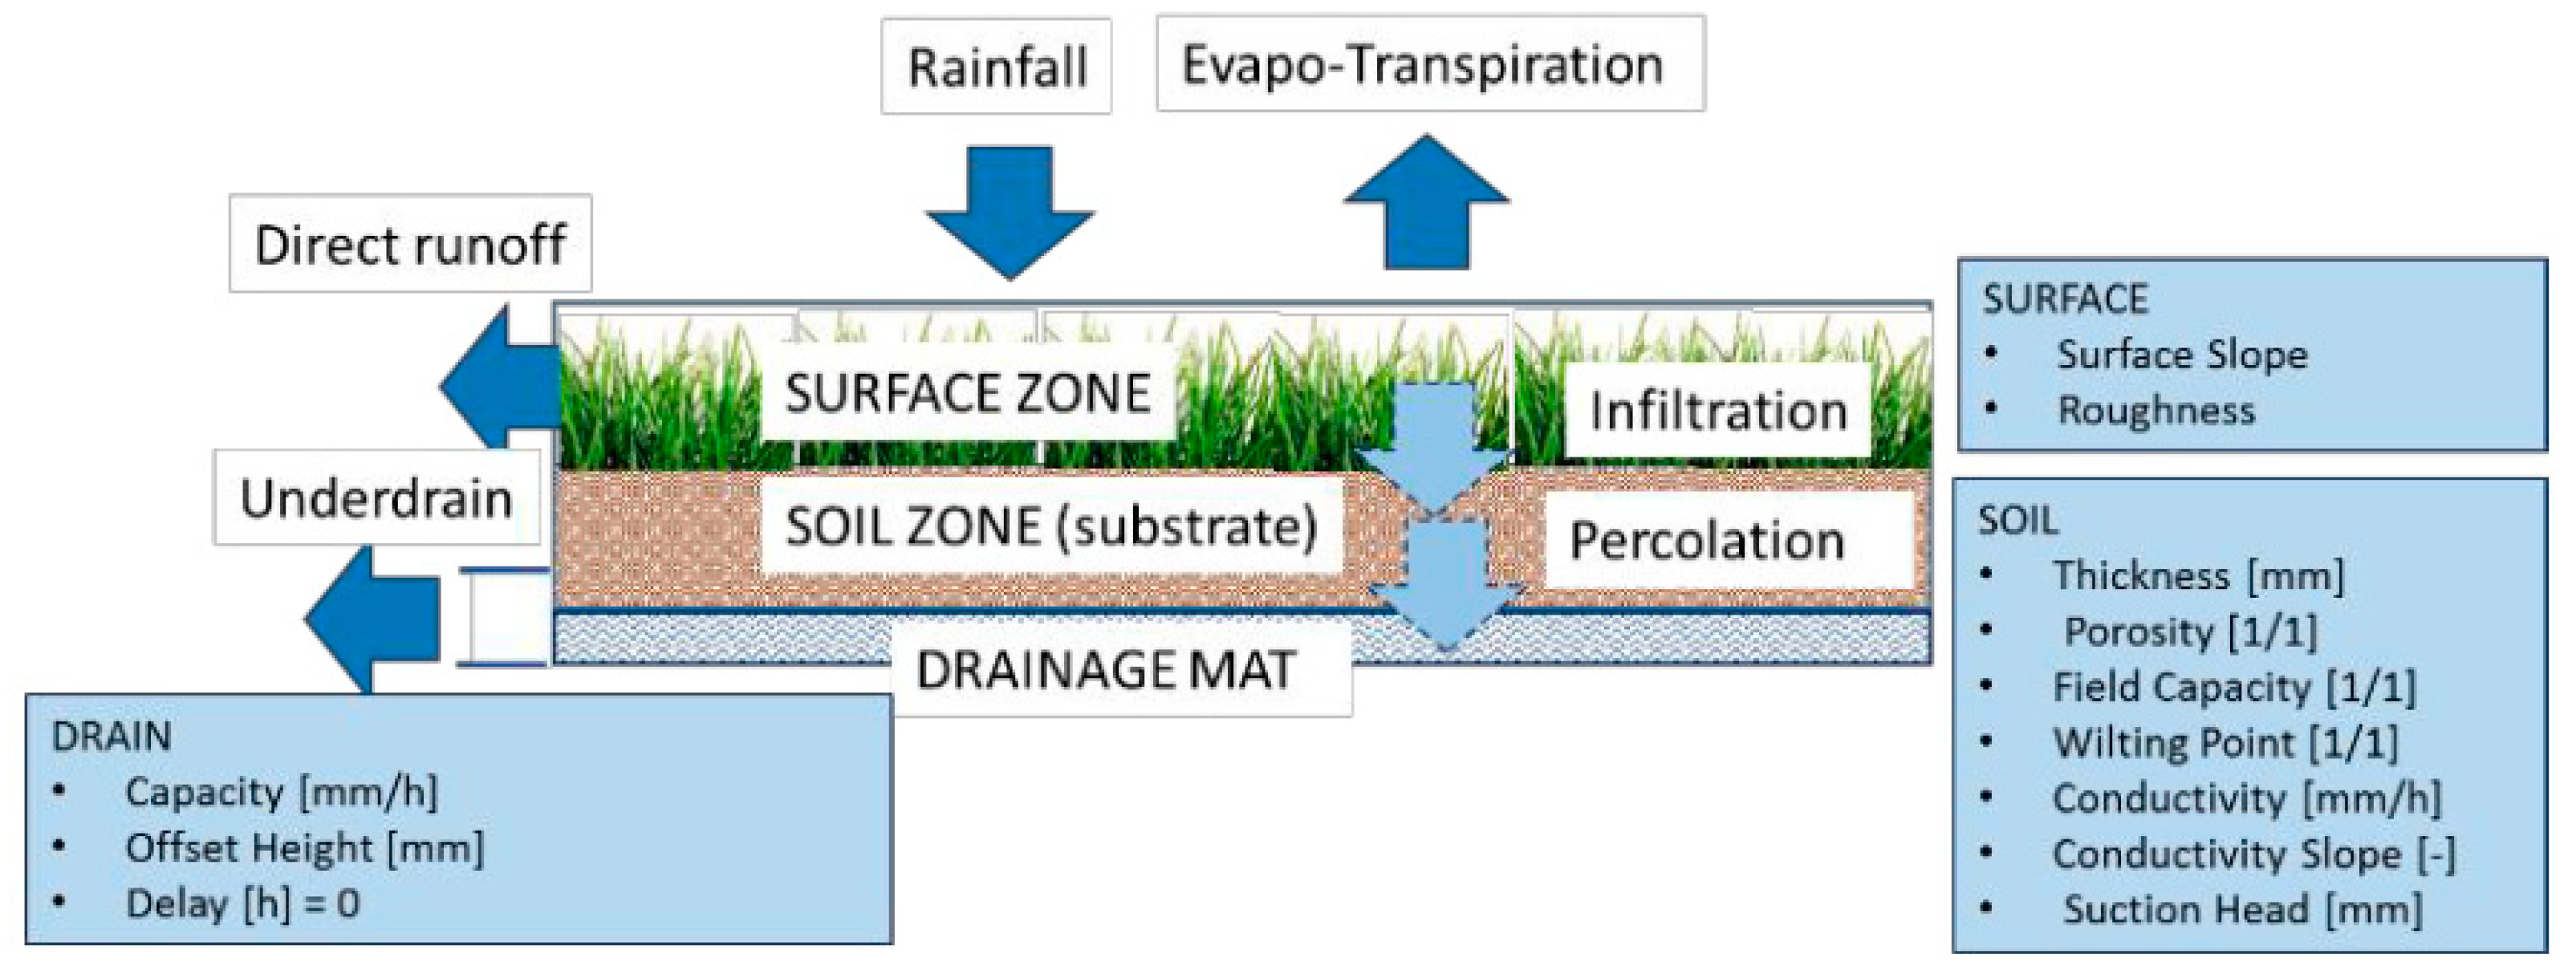
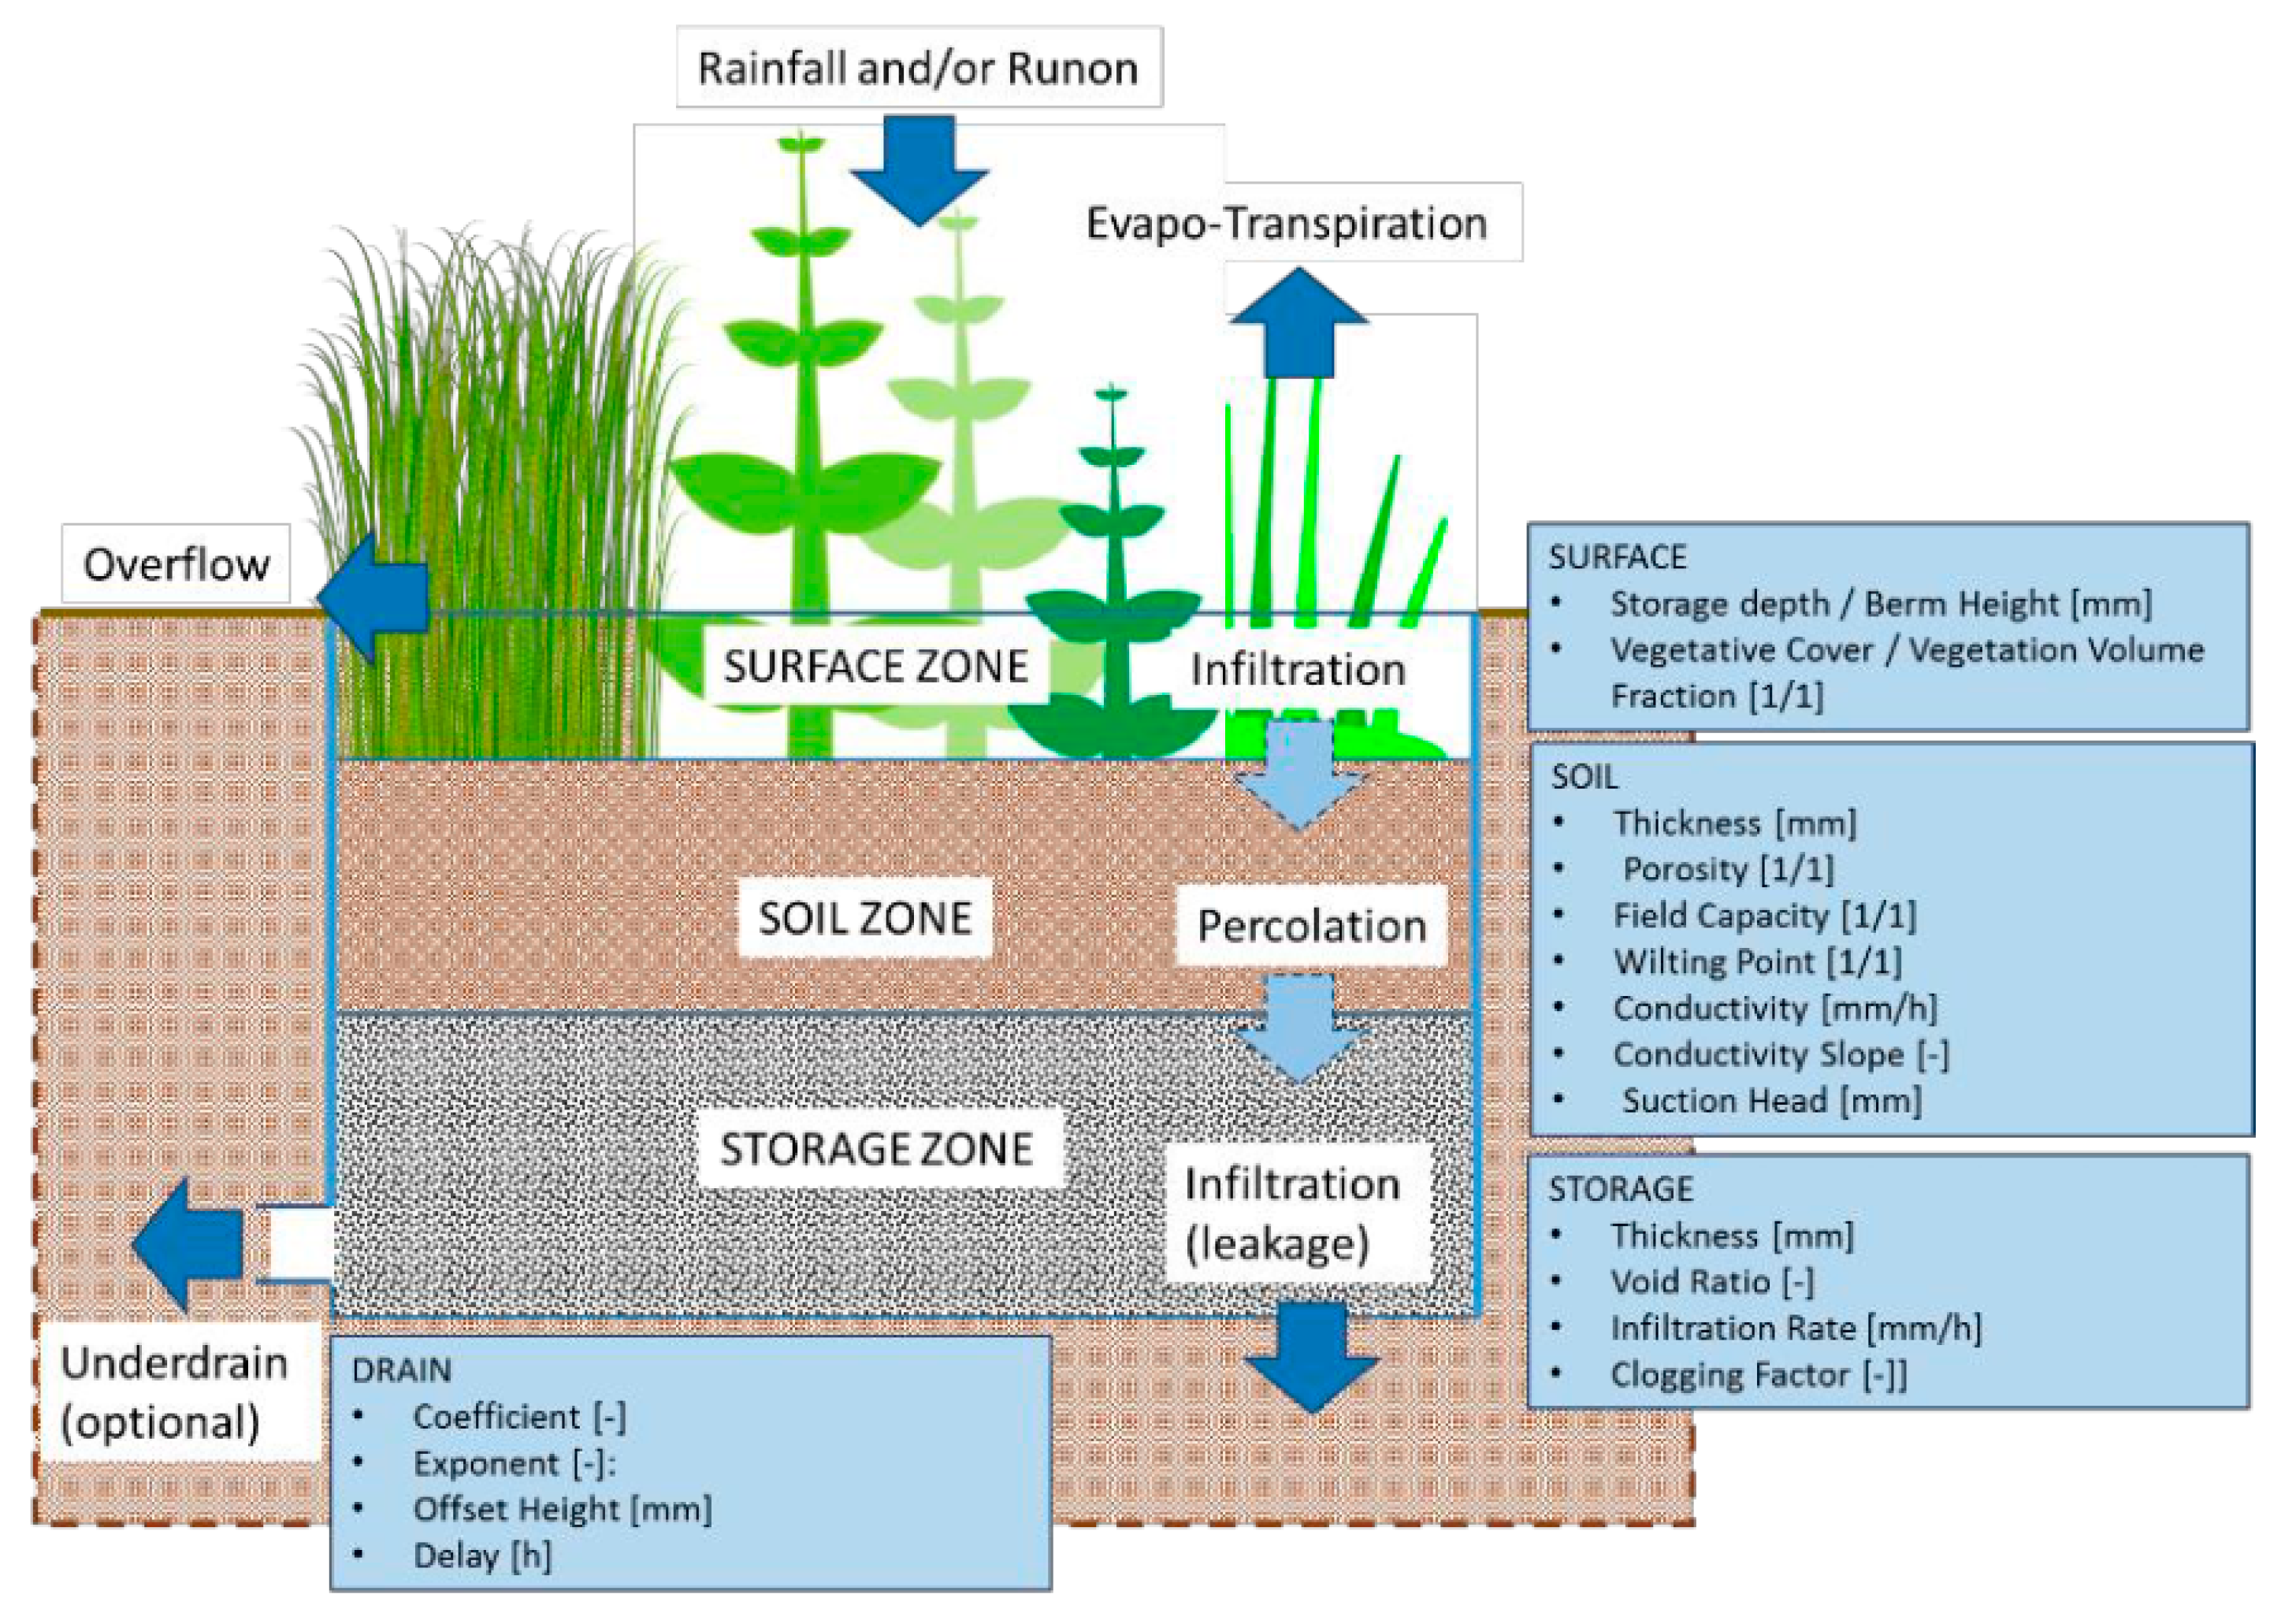
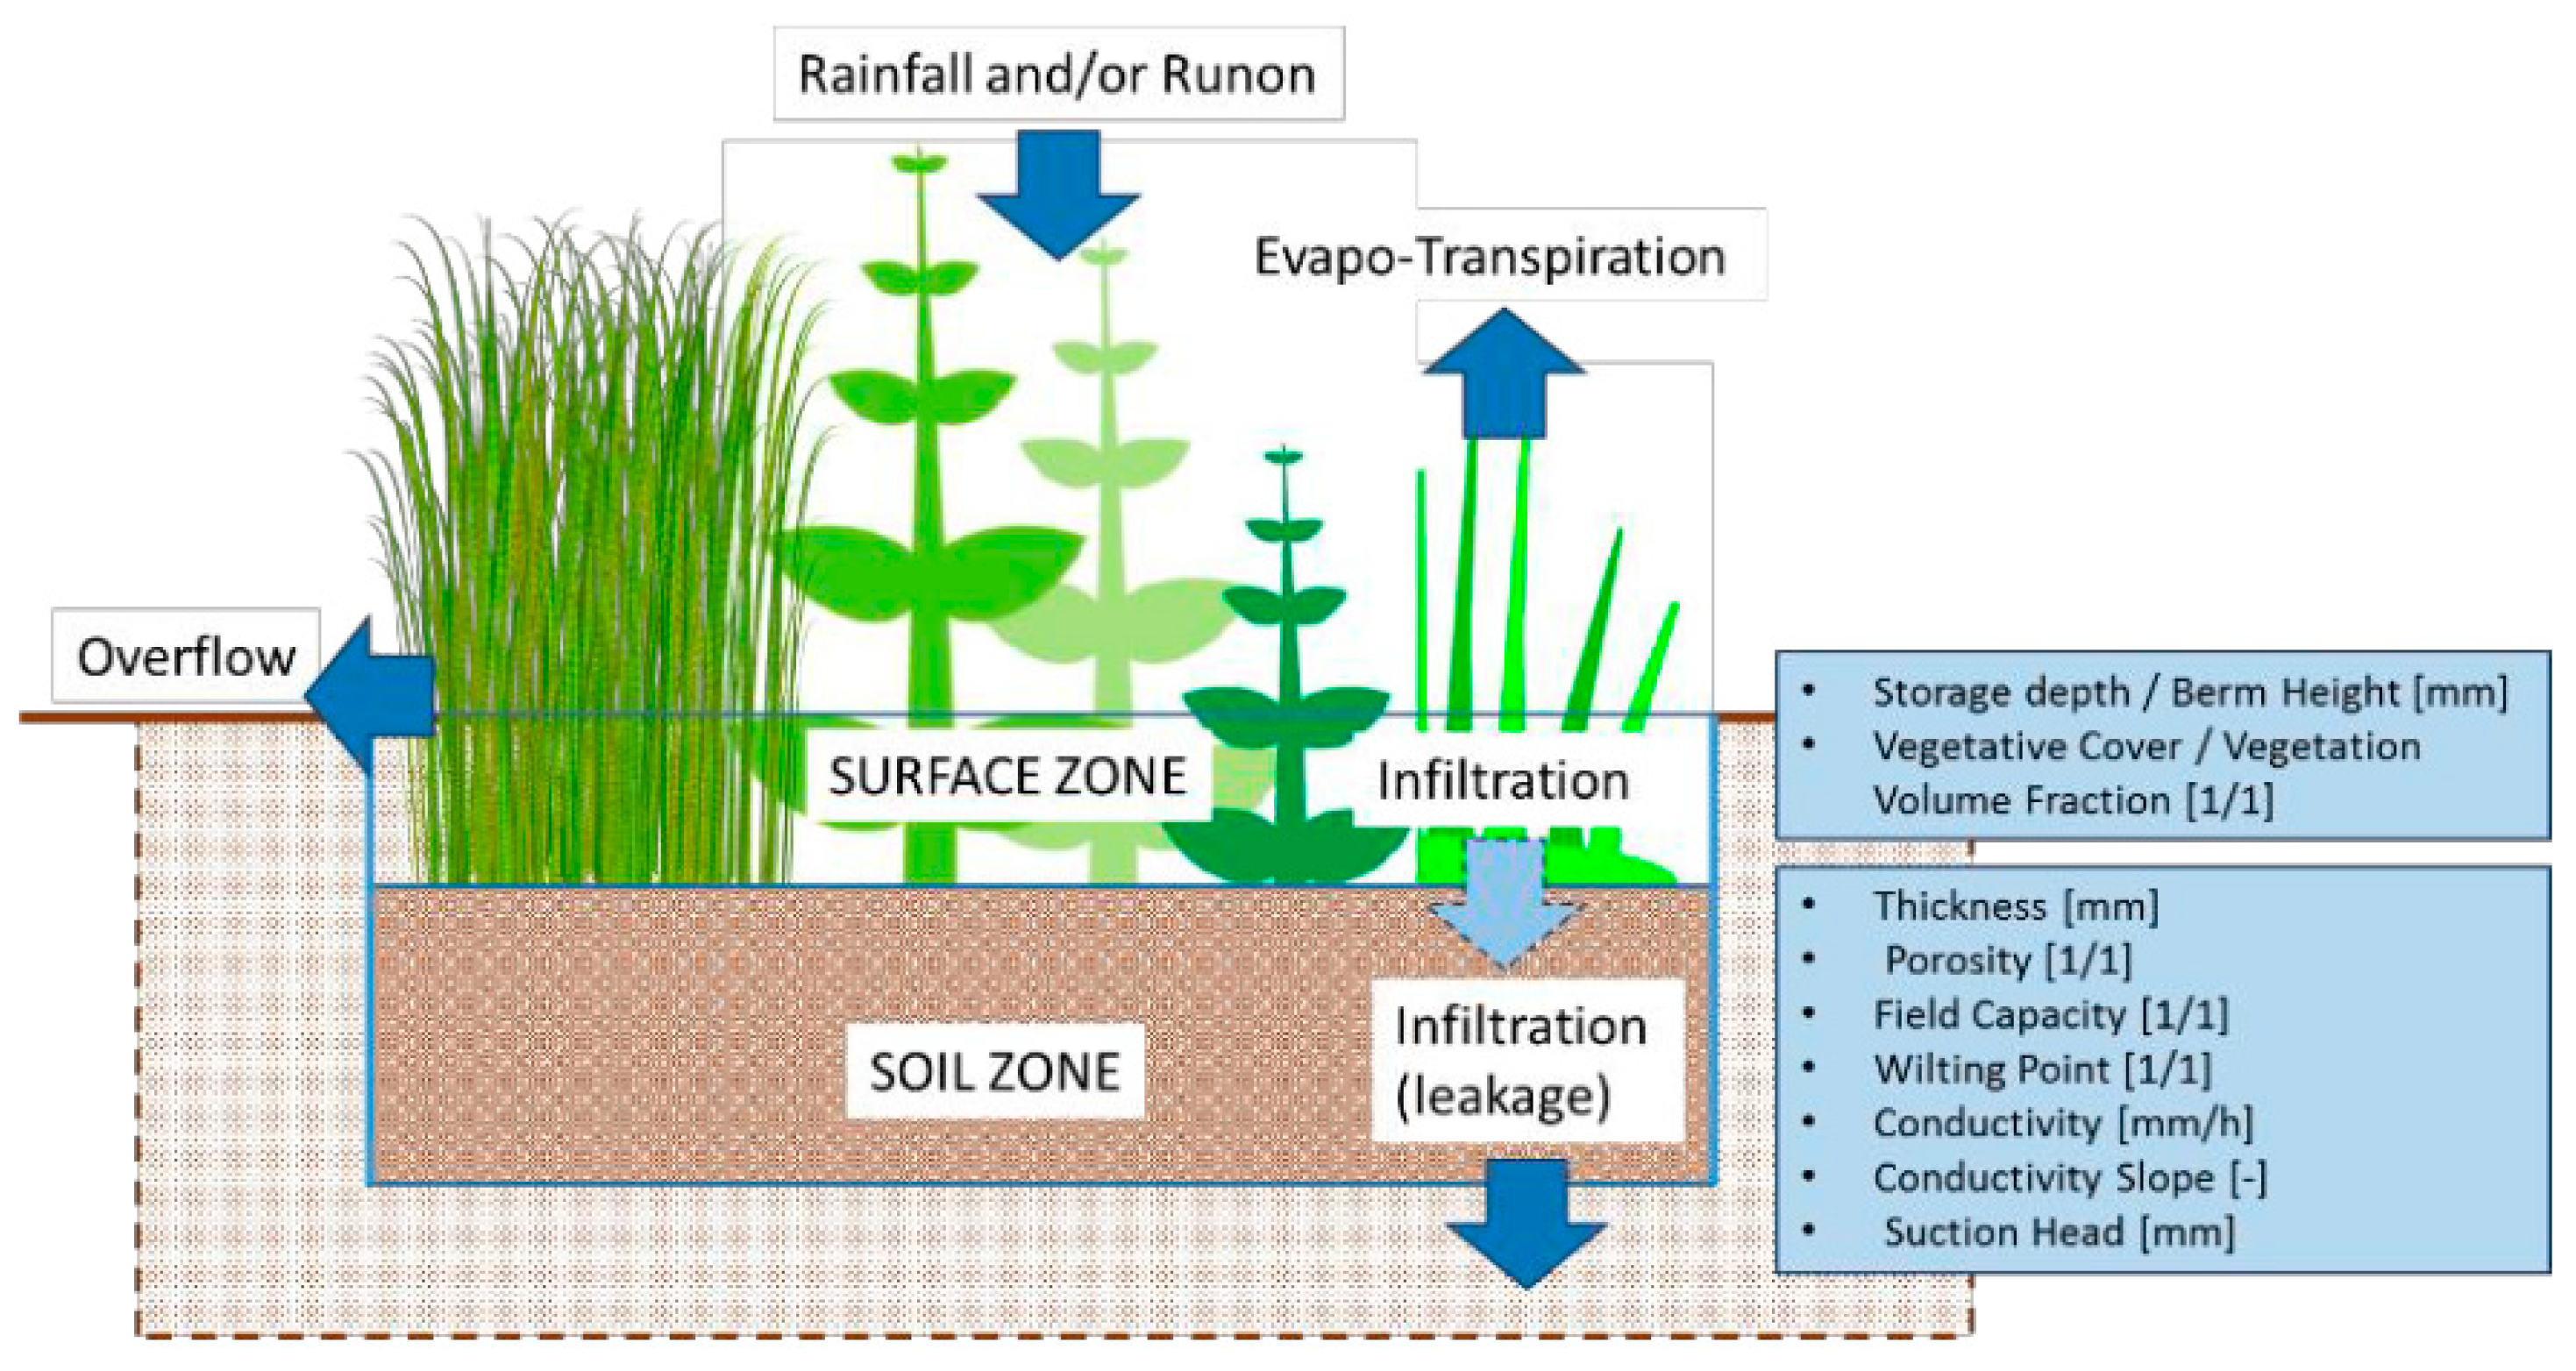
2.5. Evaluating Effectiveness: How Much

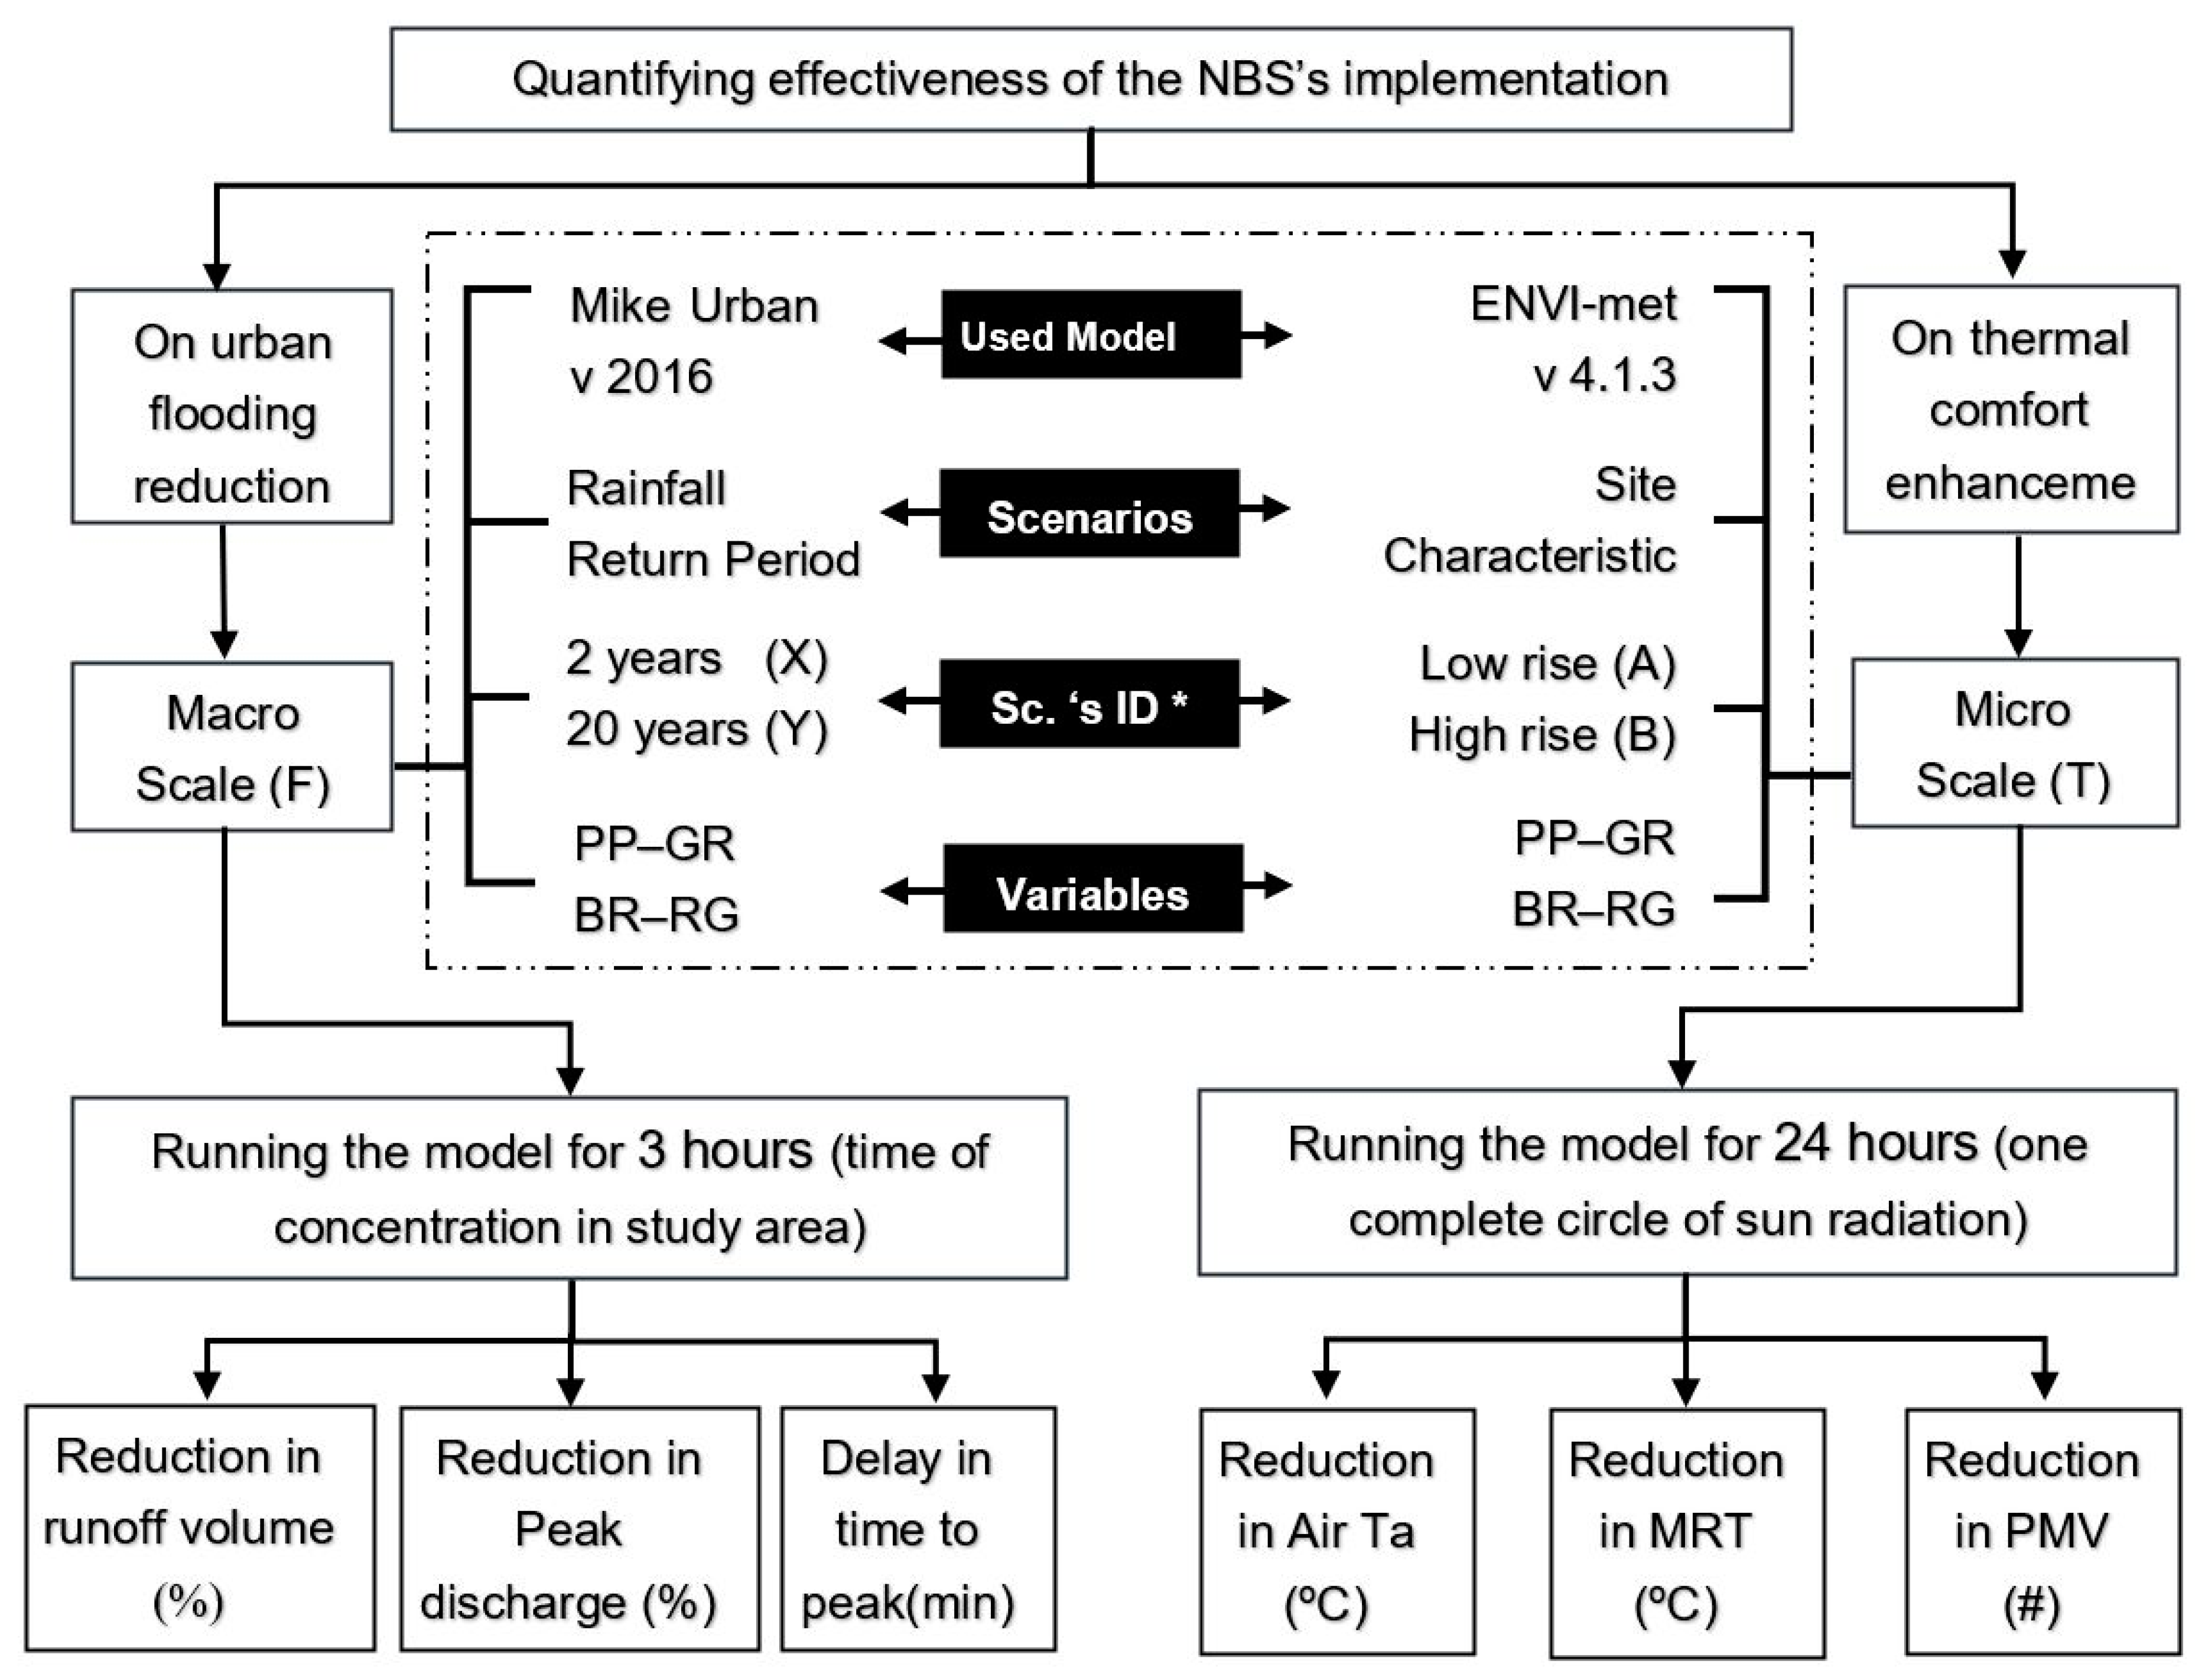
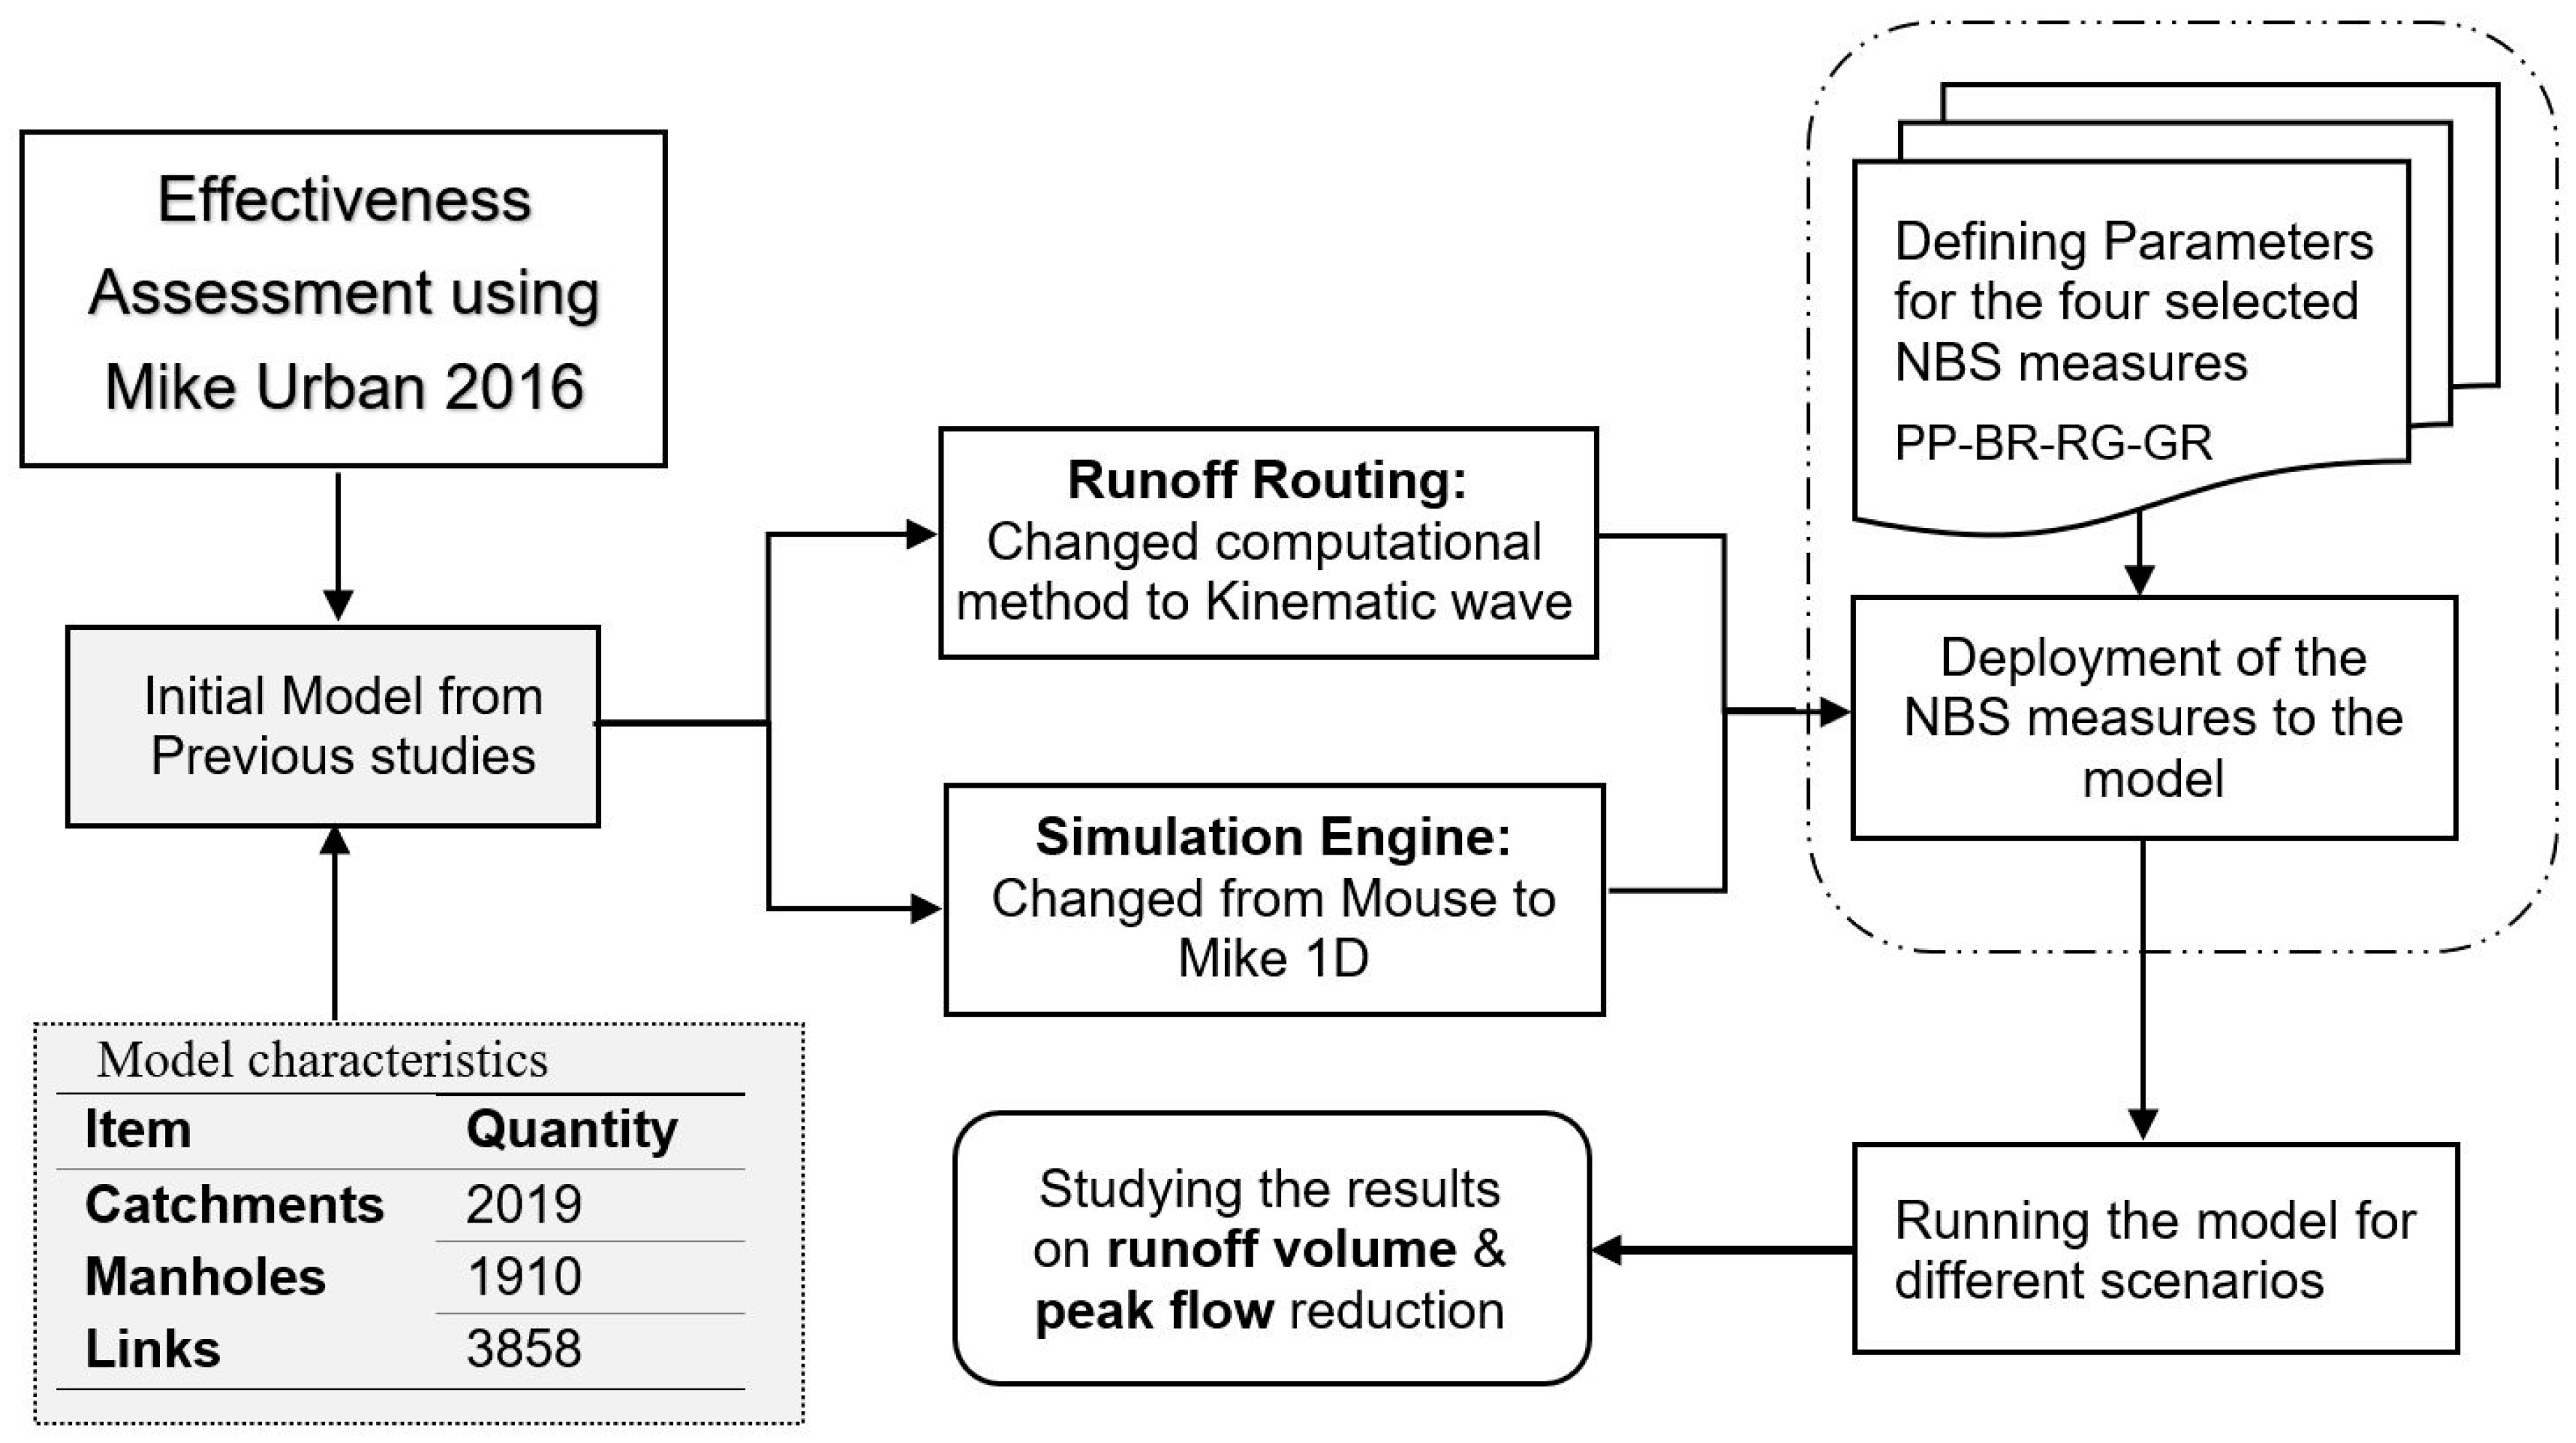
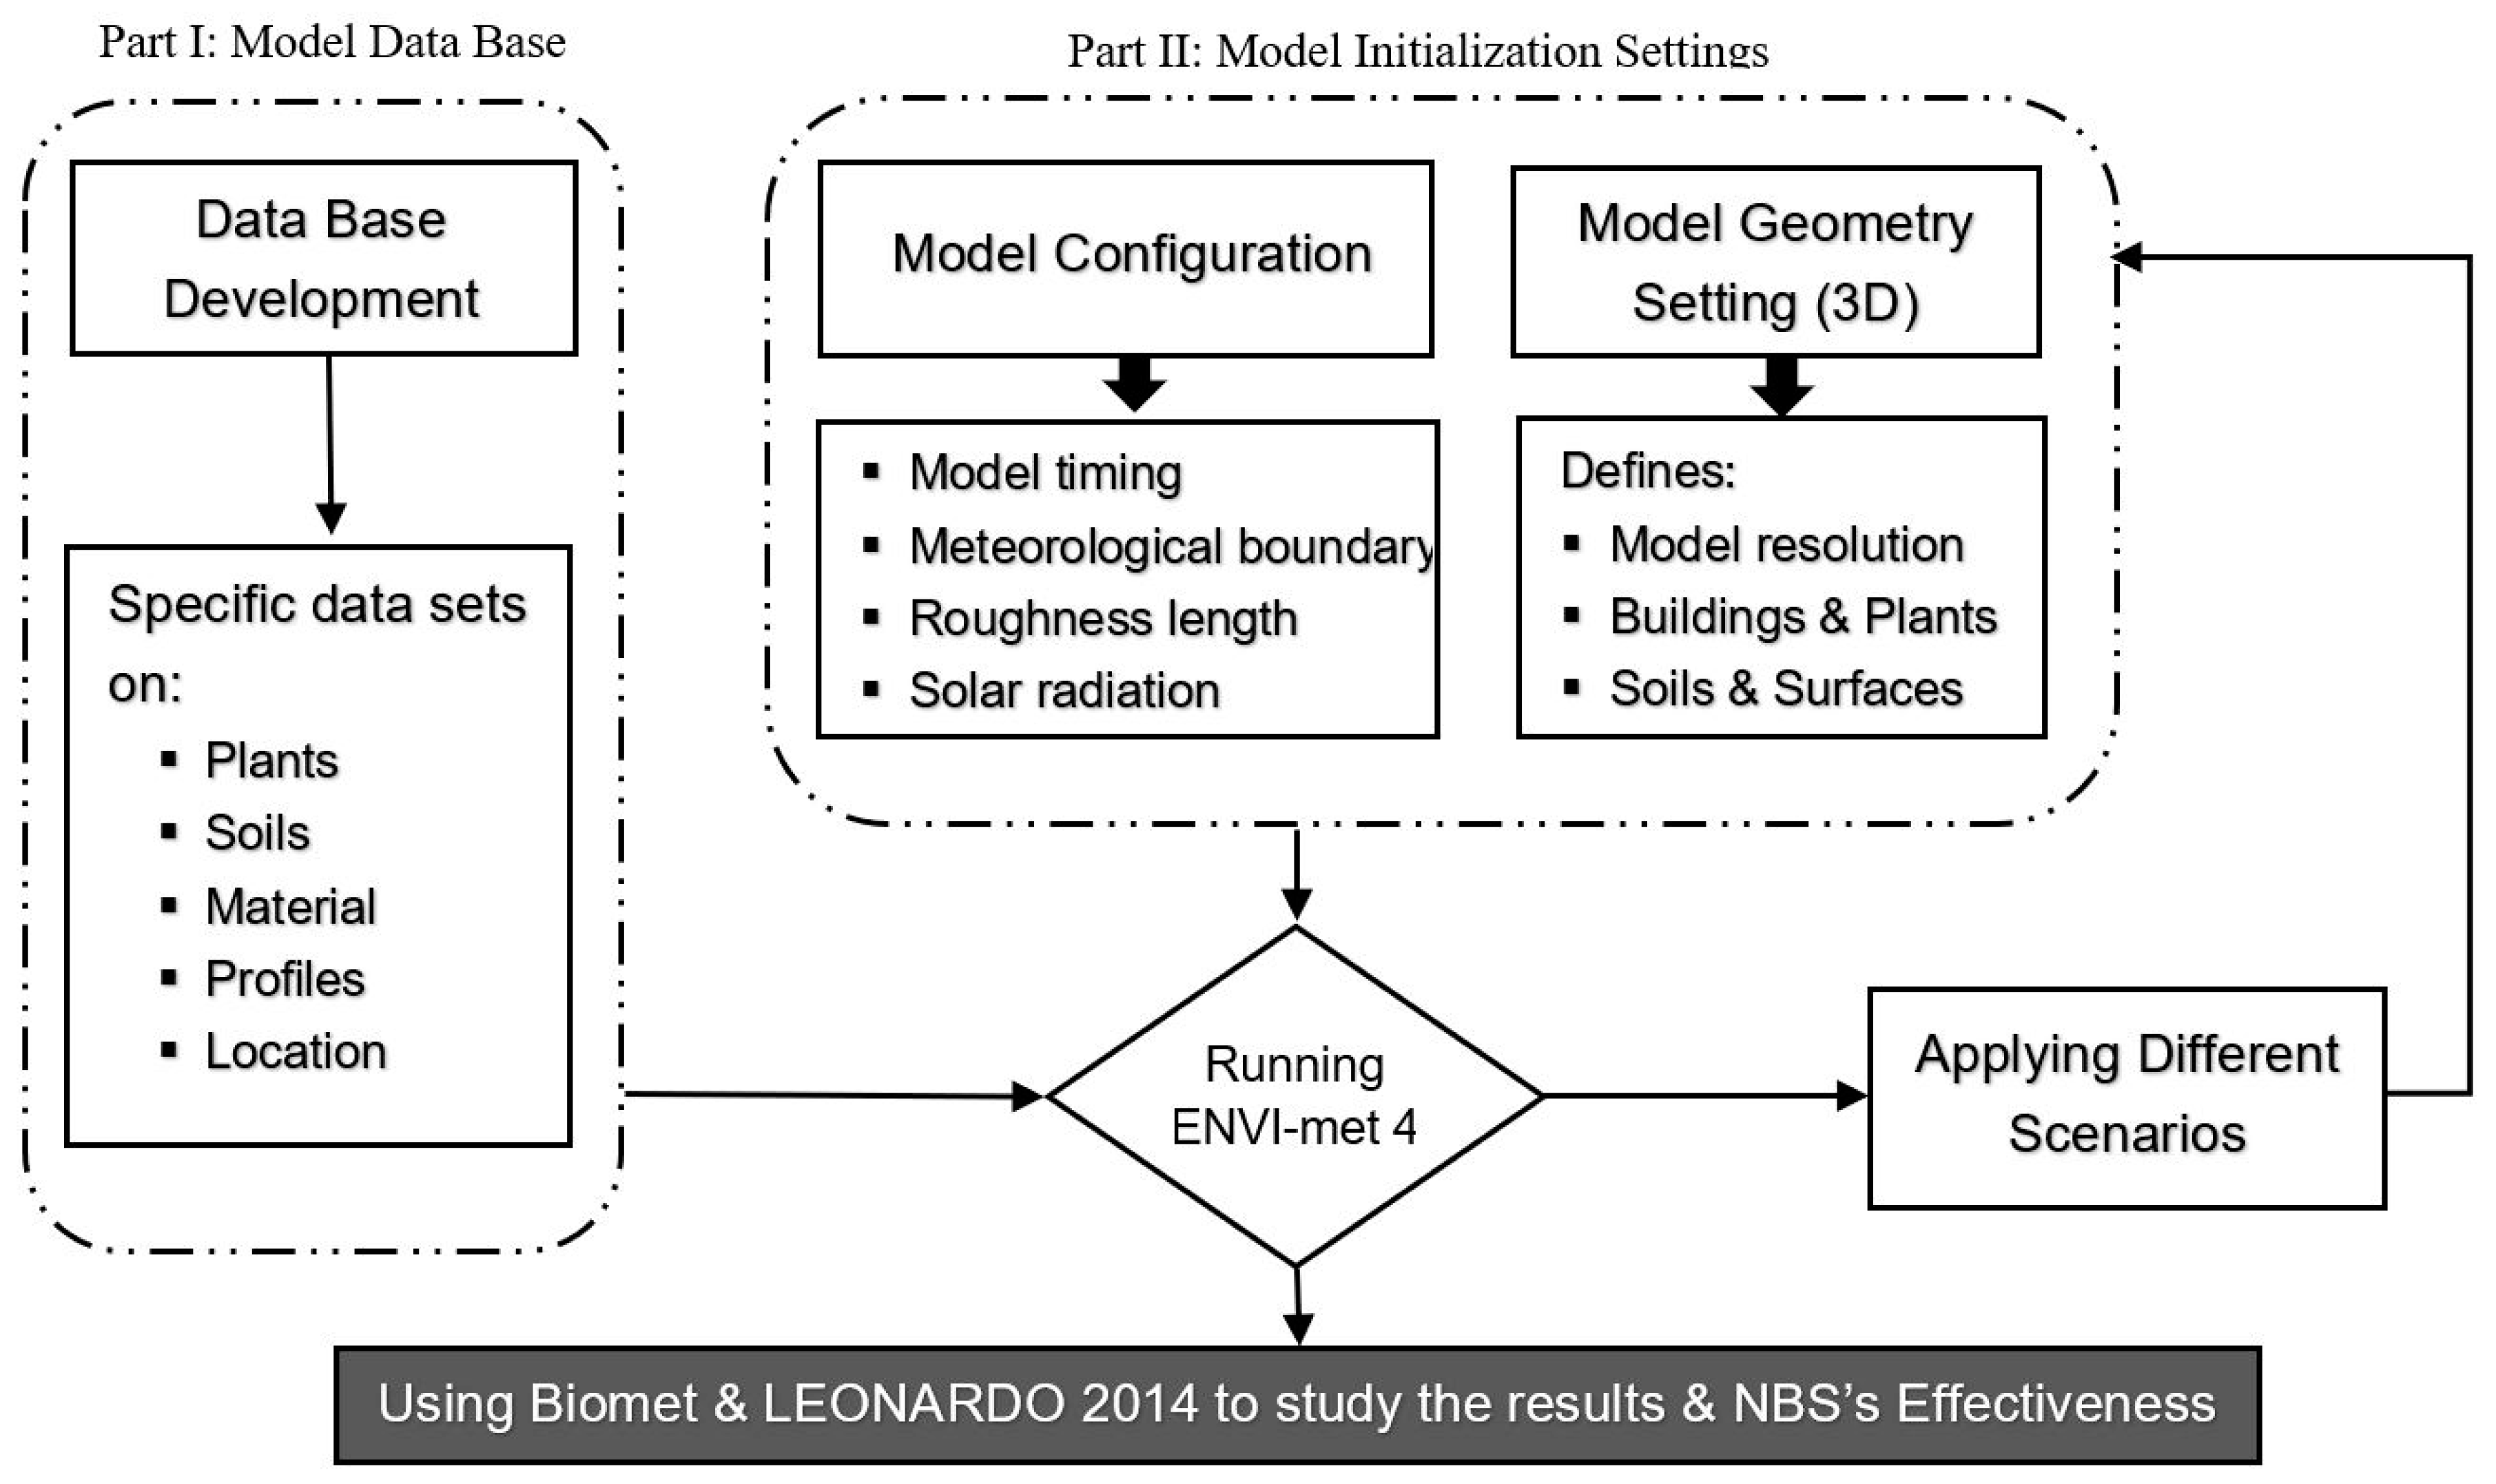
2.5.1. Model Development and Data Analysis

In order to quantify the effectiveness of NBS for urban flood reduction, a flood hazard map was produced by applying a 1D/2D modeling approach within Mike Urban software [43] (see Appendix C), see also Vojinovic and Tutulic [44]. The model was run for different rainfall return periods and different cases of NBS measures applications in the study area. The input data to create the model was collected from the Bangkok Metropolitan Administration office, Hydro and Agro Informatics Institute and the Department of Drainage and Sewerage office in Bangkok. The flooding reduction in the study area was assessed considering storm water runoff reduction, peak flow reduction and time to peak delay.
In terms of the heat stress, the ENVI-met v4.1.3 model [45] was used for assessing the effectiveness of measures in relation to thermal comfort. ENVI-met is a three-dimensional computational fluid dynamics non-hydrostatic S.V.A.T. (soil, vegetation, atmosphere, and transfer) model (Appendix C). This software is commonly used for modeling surface-plant-air interactions in urban environments, and it can also simulate flows around buildings, heat and vapor transfer at urban surfaces, turbulence and exchanges of energy and mass between the vegetation and its surroundings, and simple chemical reactions [46,47,48,49].
The input data and parameters used in each of the models are presented in Table 2. The changes made in each model in order to represent the application of NBS are presented as inputs, while the outputs explain the type of results obtained from each model. The results are compared with the case that no such measures are applied (also referred to as a ‘baseline scenario’ or ‘business as usual’) in order to evaluate the change of conditions obtained from each alternative.

2.5.2. Scenarios Development

Further to the above, ten scenarios were considered in each case, to evaluate urban flooding and thermal comfort (macro and micro scales respectively). Table 3 shows the scenarios for urban flood simulations, which include two different precipitation return periods for each of the four selected NBS, in addition to the baseline scenario.
Table 4 shows scenarios for microclimatic thermal comfort simulations, which include two different site characteristics and the four selected NBS, in addition to the baseline scenario.
Figure 4 shows the overall framework for assessment of effectiveness from NBSs in relation to urban flood and thermal comfort. For each case, the models used, scenarios, variables and outputs, are presented.

2.5.3. Comparative Effectiveness of NBSs

The main purpose of the comparative performance scoring performed here is to identify the most effective measure, taking into consideration all parameters and scenarios. The effectiveness of measures for flooding reduction and thermal comfort enhancement are evaluated using the six parameters shown in Figure 4. According to the results obtained, the measures are scored from 1 to 4 according to the relation to their performance compared with other measures for the same scenario. This implies that the measure with the highest effectiveness will be scored as 4, and the one with the least effectiveness (comparably) will be scored as 1.

3. Results and Discussion

3.1. Hazard Assessment

The initial heat stress assessment was performed from mobile weather measurements. These measurements were performed in five different urban land uses within the case study area (M sites in Figure 5). Values of air temperature, wind speed, glob temperature and humidity were collected; and some thermal comfort indices including PMV and PET were calculated. The Kestrel 5400 Heat Stress Tracker was used for this purpose. This procedure showed that urban parks (M4) and open low-rise sites (M5) can be respectively 1.4 °C and 1.1 °C cooler than a highly dense urban site in the study area (M2 and M3). Furthermore, the results showed that the PMV and PET can be also lower in these two sites compared to highly dense urban sites. Notice that M3 and M5 are the sites chosen to perform the thermal modeling, presented as areas B and A, respectively, in Figure 3.
Additionally, by overlaying the flood hazard map with the buildings data (Figure 5), it was observed that less floods and more heat stress are likely to occur in the highly dense upstream area (A1 in Figure 5), when compared other parts of the study area. However, less urbanized areas (A2) located downstream of this high-rise area present more of the flood-related issues. Since in a highly dense urban area there are more impervious surfaces, it can be expected that this can have a great impact upon flood-related issues in downstream areas.

3.2. NBS Types Selection and Suitability Analysis (Which and Where)

Four different small-scale NBS measures were selected from the analysis of local characteristics, namely the availability of possible locations for green roofs implementation, or low slope and low traffic pavements, which could be changed into pervious pavements:
  • Green roof (GR), with extensive vegetation
  • Pervious pavement (PP), with high albedo construction material
  • Bio-retention (BR), with shrubs as topping vegetation at a height of 1.2 m
  • Rain garden (RG), with street trees and lawn as topping vegetation at the height of 6 m
From the suitability analysis, maximum rates of measures application where obtained. The results of these analysis showed that for the macro scale simulations (urban flooding), green roofs and pervious pavements can be implemented as an average on 27% and 15% of the whole study area, respectively. In addition, bio-retention and rain gardens can both be implemented as an average on 4% of the whole study area. For the micro scale simulations (thermal comfort), green roofs and pervious pavements can be implemented within a maximum of 36% and 27% of the selected micro scale study areas, respectively. While bio-retentions and rain gardens can both be implemented as a maximum of 5% of the selected microscale study area.
The two different results from suitability analysis are due to two different scales used in this study. Urban flood assessment and analysis requires a macro scale simulation study. However, the microclimatic thermal comfort assessment requires a microscale simulation study. The maximum possible application of the measures will be different when studying a macro scale site as a whole, and when studying the selected micro scale sites within the whole.

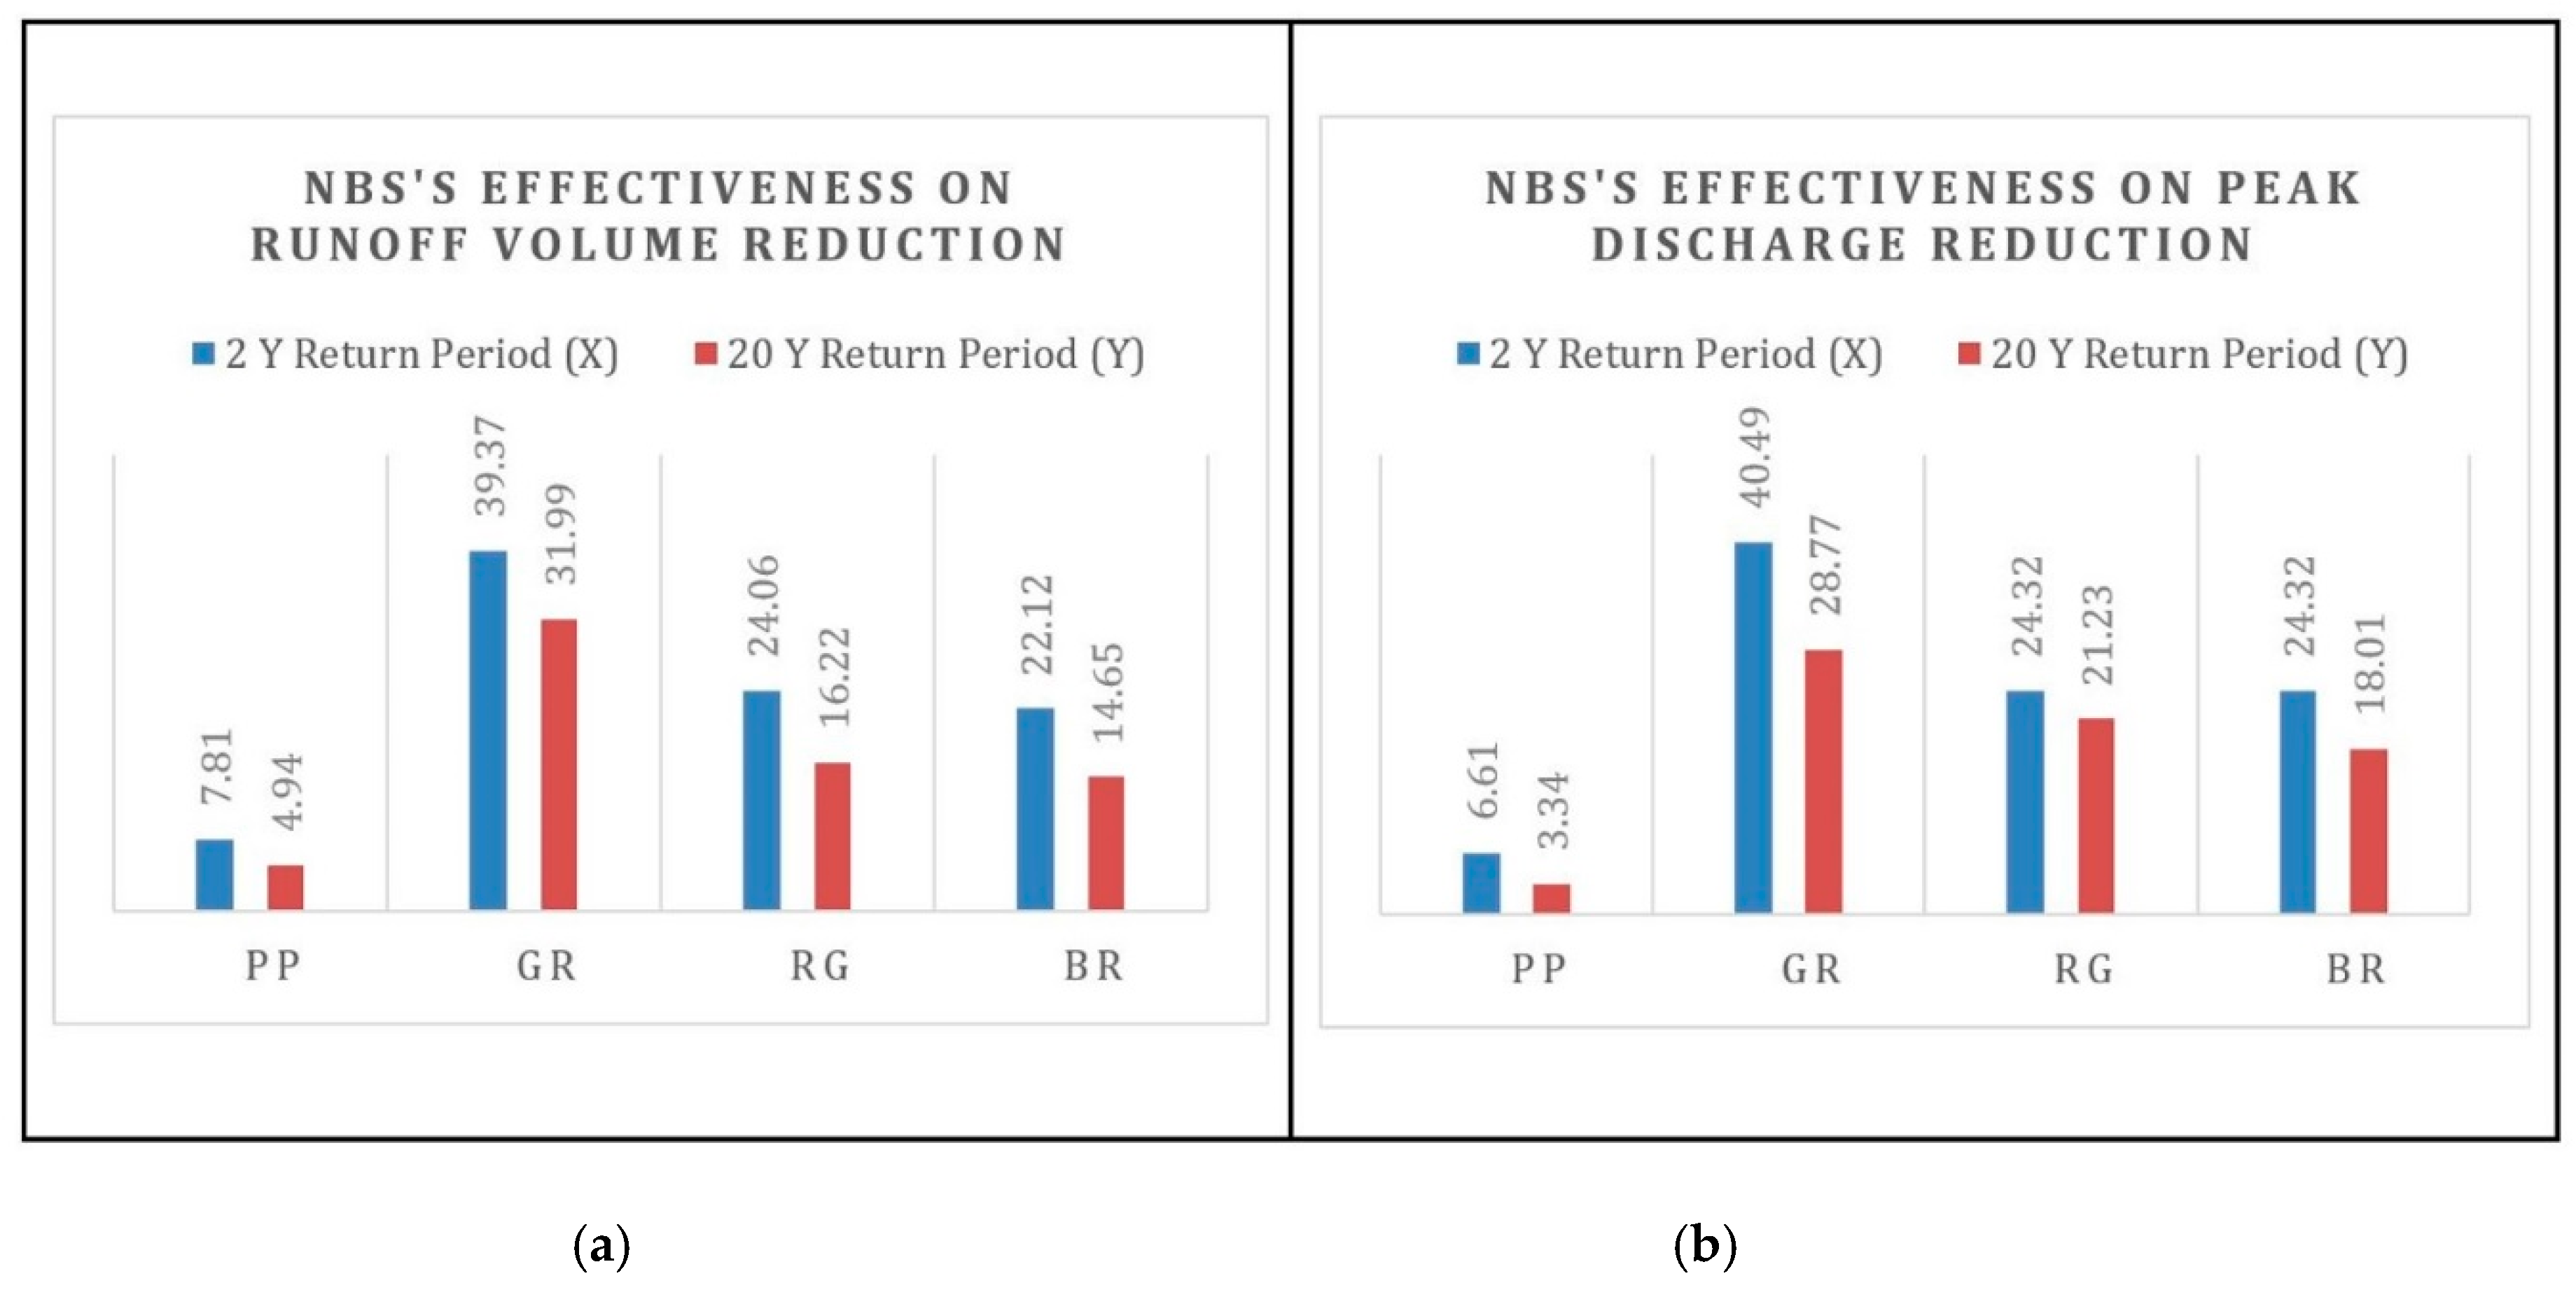
3.3. Effectiveness of NBS’s on Urban Flooding (How Much Impact on Flood Reduction)

Figure 6 shows the effectiveness of each NBS for flood mitigation according to the results obtained from the hydrodynamic model for two rainfall scenarios. The parameters presented are runoff volume reduction (Figure 6a) and peak discharge reduction (Figure 6b). From the analysis of results we can observe that the effectiveness of the measures is reduced when the rainfall return period increases. Additionally, it appears that ‘green roofs’ is the most efficient NBS type for this case study area, having effectiveness of up to 39% and 40% in reduction for total runoff volume and peak discharges, respectively, for a two-year return period rainfall. On the other hand, ‘pervious pavements’ was found to be the least effective NBS type. The main reason for green roofs for being the most effective is the relatively large suitable area for its implementation. According to the suitability analysis, around 27% of the area was considered suitable for implementing green roofs.
The results also show that there was no significant change in the delay for time to peak in most of the cases; thus this result was not plotted in Figure 6. One reason for this could be the existence of numerous small catchments in the case study area.

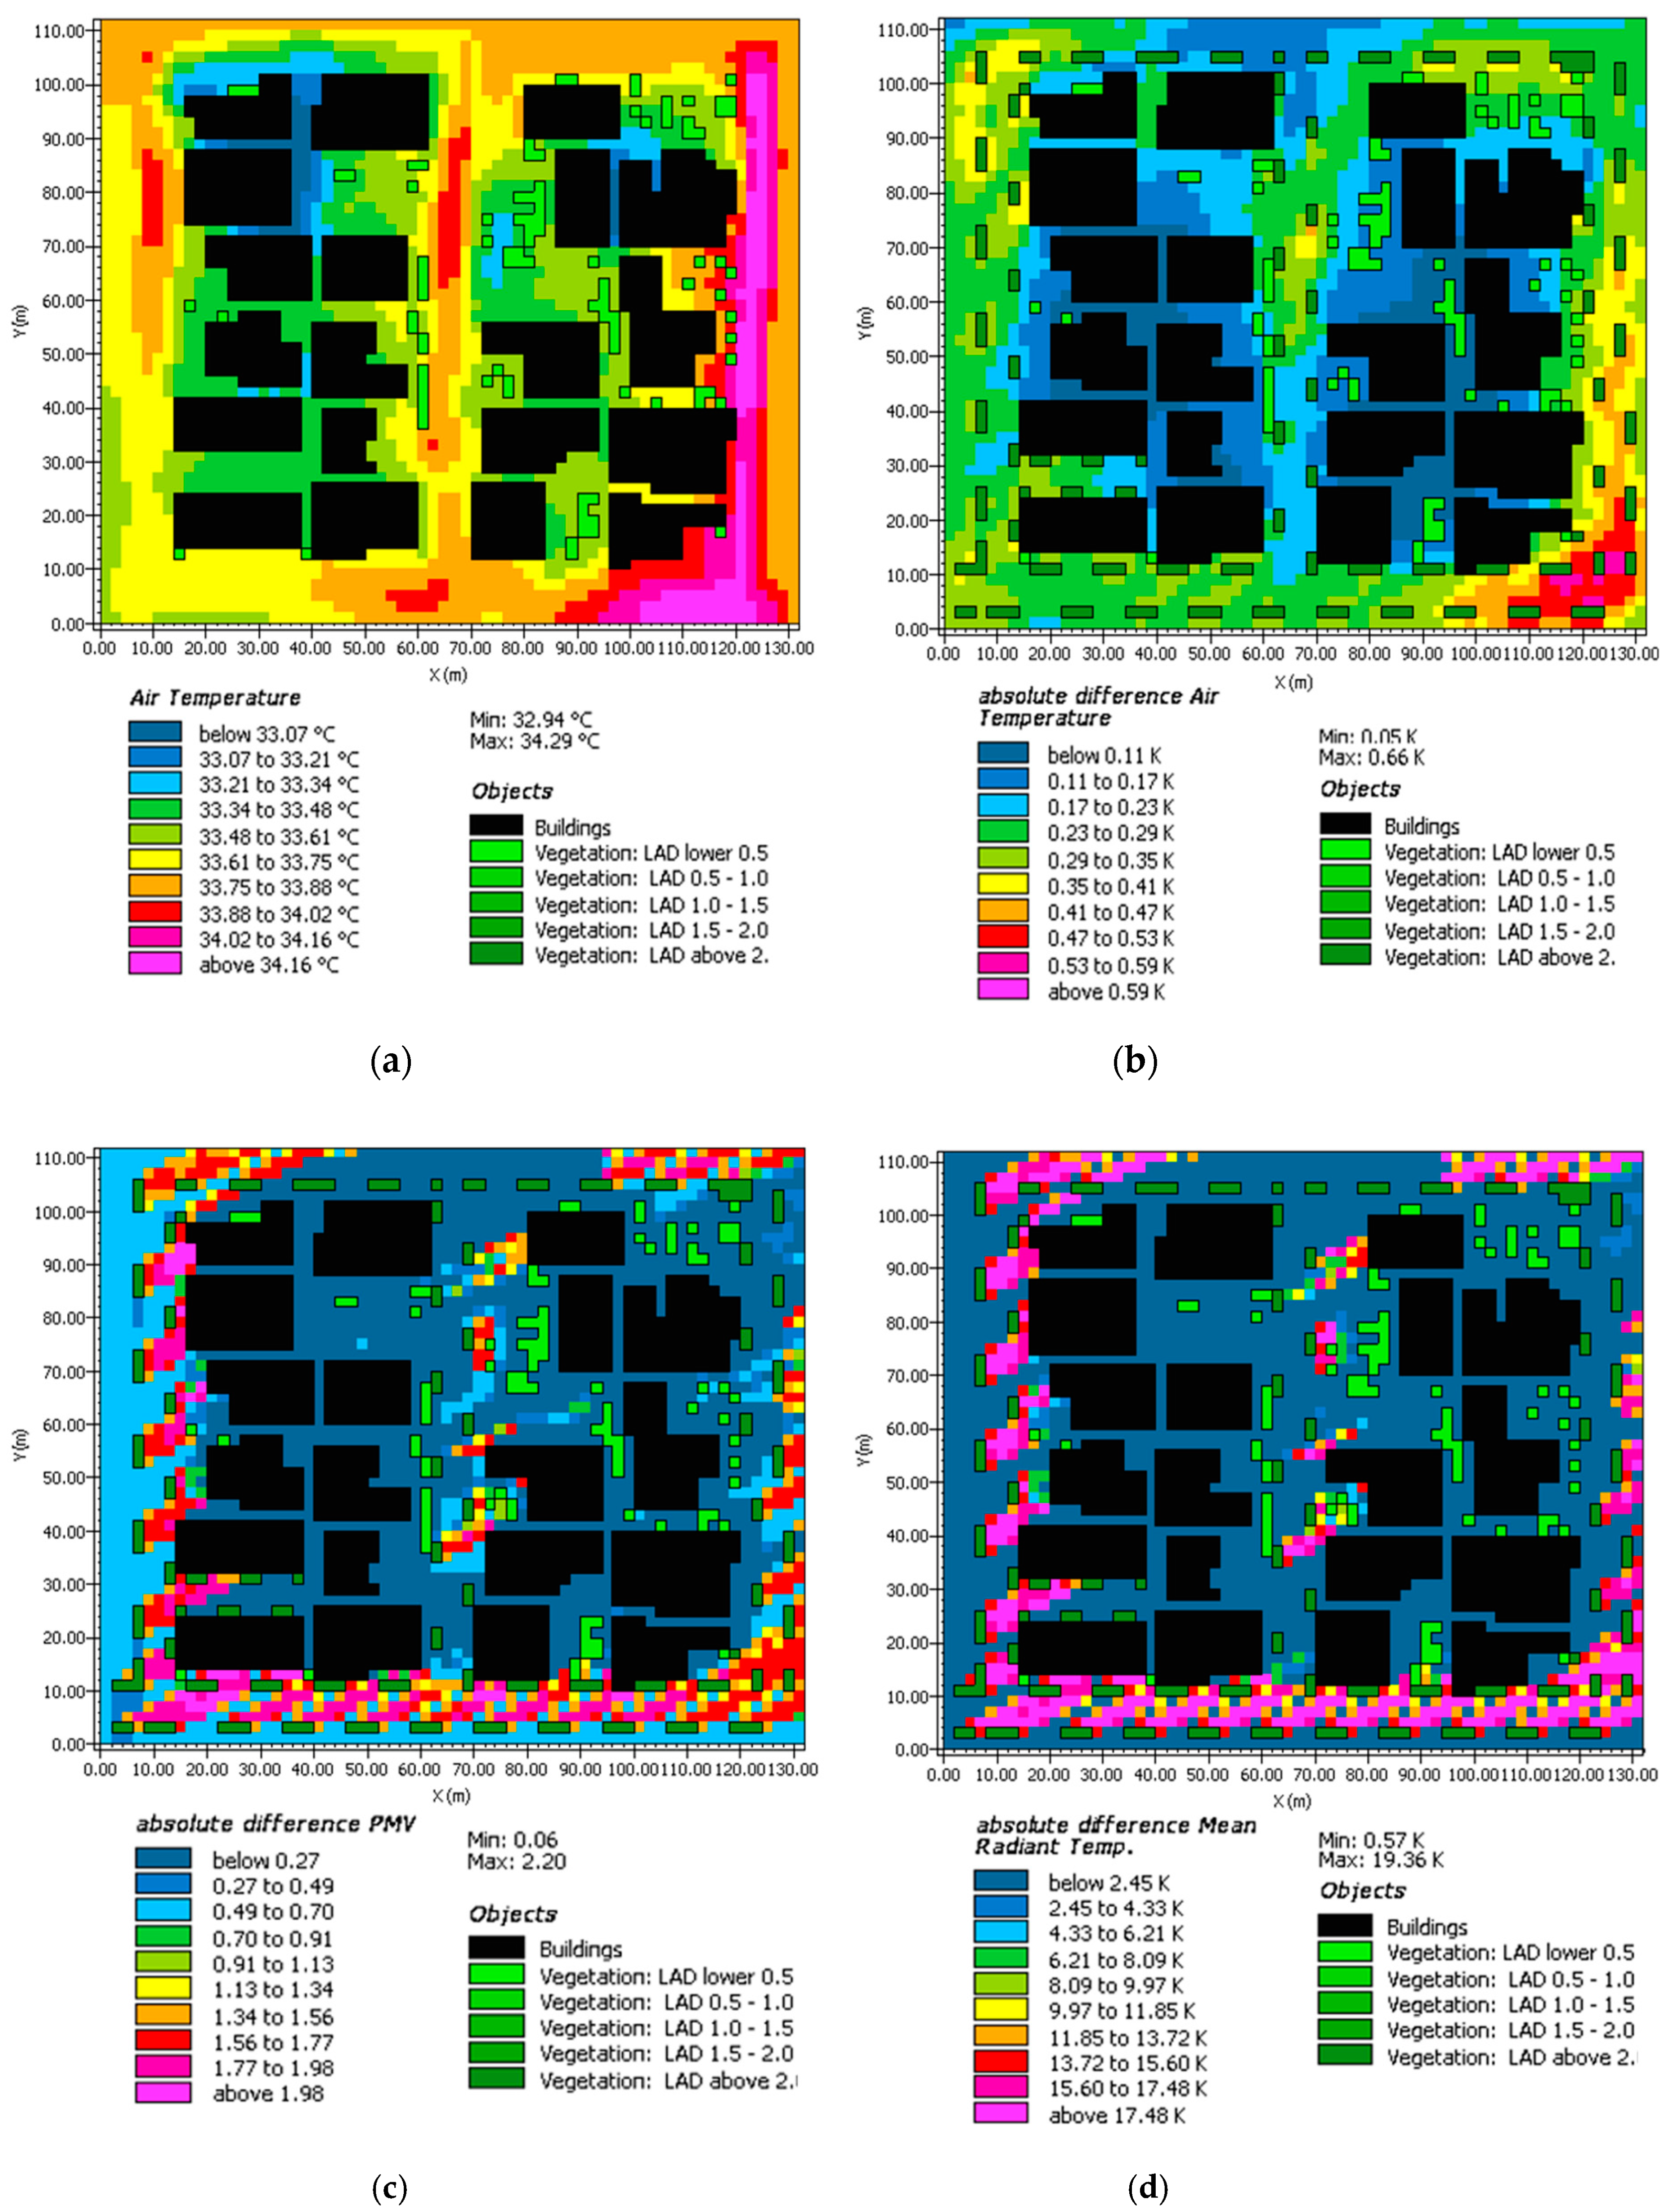
3.4. The Effectiveness of NBS on Thermal Comfort Enhancement (How Much Impact on Thermal Comfort)

Regarding the microclimatic situation, model results for the base case and for the case of implementing rain gardens in open low-rise sites are shown as an example in Figure 7. The effectiveness of NBS was measured by comparing the results of variation in Air temperature (Ta) and Mean radiant temperature (Tmrt) with the base case scenario. In addition, variations of Predicted mean vote (PMV) in relation with the base case scenario were considered. The obtained results show that the cooling effect of trees, which were used in rain gardens, was widely dispersed if we analyze the reduction in air temperature. Whereas, Tmrt and PMV were significantly reduced, but only in the shaded areas of the trees, as a result of the prevention of direct sun radiation.
Figure 7 shows the distribution of the air temperature at 4:00 p.m. and at the height of 1.0 m from the ground. According to the American Society of Heating, Refrigerating and Air-Conditioning Engineers (ASHRAE) [50], the thermal comfort measurements have to be done at the center of the human body, which internationally is established at 1.10 m of height. However, a vertical grid size configuration was used in this model, and the software only provided the vertical elevation data at the height of 1.0 m and 1.4 m. Therefore, the results in this work are presented for an elevation of 1.0 m, which is considered the pedestrian level.
The results from the microclimatic modeling for this case established that ‘rain gardens’ was the most effective measure in the open low-rise buildings (site A), with a maximum reduction of 0.66 °C in air temperature (Ta) (see Table 5). The reason why rain gardens performed best is that trees were considered as vegetation for this measure. Similar studies on the effect of different vegetation on thermal comfort also revealed that ‘trees’ was the most effective measure in providing outdoor thermal comfort, and this effectiveness can be enhanced by increasing the LAD (Leaf Area Density) and height of the trees [51,52,53]. In contrary, in a compact high-rise building (site B) rain gardens did not have the same effect. In site B, even though this measure was still the most effective in air temperature reduction, it had an impact of only 0.25 °C maximum reduction in Ta. This difference on the impact of the same measure in sites A and B is because more paved surfaces were exposed to sunlight in the low-rise site compared to the high-rise site. As a result, the application of trees prevented the sunlight to reach the paved surfaces in site A, which consequently lead to a higher decrease in the sensible heat fluxes. In other words, in site B the shadow provided by the tall buildings did not give the chance for the trees to further decrease the temperature by providing their own shadow.
Regarding bio-retention, this measure was the least effective in the open low-rise building or site A, with a maximum reduction capacity of 0.16 °C. This result confirmed the role of the tree’s height and leaf area density (LAD) upon thermal comfort, since by reducing these parameters for the bio-retention case compared to the rain gardens case, the air temperature reduction was significantly less. On the other hand, pervious pavements had a good impact of 0.41°C on air temperature reduction in the site A. The implementation of pervious pavements in the model was represented by changing the albedo of pavements from 0.4 to 0.8, in order to reduce the absorption of sun short wave radiation. It was observed that this measure had a better performance during the time that the sun was shining almost vertically, around 1:00 p.m. However, the other measures had their highest performance during the heat stress peak daytime, at 4 p.m.
Table 5 also shows that the effectiveness of the measures on Ta reduction was quite different when the site characteristic changed from open low-rise (A) to compact high-rise buildings (B). For instance, ‘green roofs’ had almost no effect on the reduction of Ta in scenario B, at 4:00 p.m. and at the pedestrian level. However, in site A, ‘green roofs’ had an effectiveness of 0.17 °C on reduction of air temperature at the pedestrian level. In fact, as the buildings in site B are very high (around 70 to 104 m), the effect of vegetation on top of such buildings did not reach the pedestrian level. There is previous research that revealed that the green roofs on top of high-rise buildings do not have any significant effect on air temperature for pedestrians [18,54,55,56].
An interesting finding of this research was that in a site of high-rise buildings, tree plantation and vegetation can be more effective during the night time. The results clearly show that both measures, bio-retention and rain gardens at site B, had better effectiveness at 1:00 a.m., with 0.43 °C and 0.15 °C reduction in air temperature, respectively. Therefore, it can be derived that vegetation planting (especially in the high-rise building site) is the best practice for the urban heat island control, which is at its peak during night time. High-rise buildings absorb sun energy during the day and release it during the night. As a result, the temperature does not get reduced enough during the night time in these sites, and it causes an urban heat island (see also [55]), which can be controlled relatively by implementing NBS measures.
Regarding other parameters, the effectiveness of bio-retention and rain gardens on the reduction of Tmrt were almost the same in both site characteristics. The results show that these two measures had a maximum reduction in Tmrt of around 16 °C and 19 °C, respectively (at 4:00 p.m.) in both sites.
Whereas, ‘green roofs’ had also a reasonable contribution to Tmrt reduction in site A (Max 17.81 °C from 51.18 °C), it had a very low effect on Tmrt reduction at pedestrian level at site B (0.10 °C from 52.31 °C), which is logical, according to the previous discussion on the height of the buildings. Similarly, its effect on PMV max reduction was also 0.8 at site A and 0.01 at site B, which again does not show any significant change at site B.
The effect of pervious pavements on reduction of Tmrt is quite controversial. The results show that pervious pavements not only had no contribution in reduction of the Tmrt at any of the study areas, but it even increased slightly the value of Tmrt by 0.6 °C and 0.69 °C at sites A and B, respectively. This result shows that by changing the albedo of the streets from 0.4 to 0.8, the sun radiation was being more reflected to the atmosphere. Therefore, the pedestrians experienced more radiation, which led to a growth in Tmrt. Similarly, the impact on PMV for pervious pavements application at site B was slightly negative. However, there was a positive impact in site A, showing a change of 0.68 from 4.67 on PVM.

3.5. Discussion on NBS’s Performance

In general, the simulations of the base case scenario for both sites (A and B) on thermal comfort show that during the day, and specially in the peak temperature time of the day (4:00 p.m.), site B (compact high-rise) provided a better thermal comfort at the pedestrian level, compared to site A (open low-rise). The main reason for this was related to the shadow provided during the day by the high-rise buildings. On the other hand, during the nights this issue reversed, and the site A had a better thermal comfort, as there was more air ventilation and less structures to release the heat accumulated during the day, to the environment during the night time. A research done by Hedquist and Brazel [57] on a case study of Arizona, U.S.A., presented a similar result.
An overall comparison of the measure’s effectiveness in both scenarios (A and B) interestingly shows that the NBS measures had a better performance in the low-rise buildings (A) site during the daytime and a better performance in the high-rise buildings (B) site during the night time. This is because the more direct sunshine in site A during the day provided a better opportunity for NBS measures to improve the existing thermal comfort of the site. This was achieved by either providing more shadow or reradiating the sun’s shortwaves. However, in site B, the shadow provided by the buildings during the day gave less opportunity for the NBS to show their effectiveness. On the other hand, as during the night, site B was hotter compared to site A, which is a result of the urban heat island [58], the implementation of NBS was more effective at site B during the night, which could contribute to the reduction of urban heat island intensity at these locations.
In conclusion, the effectiveness assessment of NBS measures using a microclimatic modeling clearly showed that the effectiveness of the measures on thermal comfort enhancement depends on several factors. These factors are: The characteristics of the site, the type of NBS, the coverage and location of the measures and the time of the day.

3.6. Comparative Effectiveness Scoring for the NBS

3.6.1. Comparative Effectiveness for Urban Flood Reduction

Analyzing the effectiveness scoring of the measures in relation to urban flood reduction (Table 6), it can be observed that ‘green roofs’ represent the most effective measure for this purpose while ‘pervious pavements’ appears as the least effective measure. This is in line with other studies, e.g., Carpenter and Kaluvakolanu [59] and Berardi et al. [60]. However, this effectiveness scoring does not consider the differences on percentages of implementation area for each measure. It is to be noted that one of the main reasons why ‘green roofs’ is the most effective NBS for control of urban flooding, is the fact that this measure is the most feasible to be implemented at such an urbanized part of the city. Therefore, again it is that site characteristics determine the performance of the measures.

3.6.2. Comparative Effectiveness for Thermal Comfort Enhancement

In relation to thermal control, ‘rain gardens’ is found to be the most effective measure in order to provide more thermal comfort (Table 7). Besides, ‘pervious pavements’ followed by ‘green roofs’ are the least effective measures for providing thermal comfort at the pedestrian level. Similar results were obtained in previous studies [61,62].

3.6.3. Overall Analysis of Effectiveness and Recommendation for NBS Application

From the comparative rankings of the measures for flood reduction and thermal comfort enhancement in the Sukhumvit area in Bangkok (Thailand), it can be observed that ‘rain gardens’ are likely to be the most effective NBS type with respect to both criteria, flood reduction and thermal comfort enhancement (Table 8). It is interesting to observe that trees (with average height of six meters), which were part of the design of rain gardens in this case, represent the most influencing factor for urban microclimate conditions. As such, for this particular case study area this should be maintained in order to achieve better thermal comfort. Furthermore, design of rain gardens also included greater depth of soil zone for infiltration (e.g., 80 cm) purposes and the inclusion of a storage zone (e.g., 18 cm depth), which is likely to contribute towards higher effectiveness in flood volume reduction. For the Sukhumvit area, this measure should play an important role in urban planning activities. Green roofs and rain gardens are found to be as the second and third most effective NBS types, respectively.
Regardless of the overall effectiveness results, it is important to consider that different measures performed best on the two different criteria. As a result, to achieve the best performance in both objectives for the Sukhumvit case study area, it is recommendable to implement a combination of different NBS types.
This is possible, since the NBS types analyzed here do not compete for free spaces. For example, green roofs and rain gardens can be applied in a site simultaneously, since one uses roofs and the other one uses spaces alongside the streets.
Additionally, the location of the site as well as its land use type play a role on the performance of each NBS type, and as such, they should be considered for implementing the right measure. In this case, measures with higher effectiveness in flood reduction should be applied in the high-rise site, since it is at the upstream area, and has higher imperviousness. Reducing runoff through providing more disconnections in this case study area is likely to have a positive impact downstream, where flood impacts are higher. For Sukhumvit, the NBS type which showed best flood reduction performance is ‘green roofs’. This can be explained due to its enhanced suitability that results on increased disconnection area; that leads to a better effectiveness for urban flood reduction when compared to other NBS types. However, this NBS type has low effectiveness on heat stress reduction at this compact high-rise site. Therefore, the best alternative for the site B is the combination of green roofs and rain gardens, which together would have a good performance on both criteria. Moreover, even though green roofs are less effective in relation to outdoor thermal comfort enhancement, their application may have many other benefits, such as energy consumption reduction, air pollution mitigation, storm water management, sound absorption and ecological preservation [63].

4. Conclusions

In this paper, a novel framework that can be used for the selection of small-scale urban nature-based solutions to reduce flooding and enhance human thermal comfort has been presented. The framework has been applied in the Sukhumvit area in Bangkok (Thailand). The obtained results show that the combined implementation of different NBS types is likely to have a good potential to make this area more resilient and sustainable to cope with future challenges related to climate change and the high rate of urbanization. By applying this novel framework, it was possible to identify the most promising NBS types that can be applied in different parts of the area to effectively achieve both objectives at the same time.
Several interesting findings were obtained from the present work. For instance, green roofs are likely to achieve better performance in the reduction of urban flooding when compared to the other NBS types studied. However, this particular NBS type is not effective in thermal comfort enhancement in sites with compact, high-rise buildings. Regarding the effectiveness of the NBS measures for thermal comfort, the results showed that this is mainly related to the provision of shadows from trees. Therefore, rain gardens with street trees as covering vegetation would have the best performance for the open low-rise scenario. Although, the results also showed that the effectiveness of different NBS types changes according to the site characteristics and time of the day. Therefore, a combined application of green roofs and rain gardens is recommended in compact high-rise building areas. We conclude then that this method is very helpful to identify adequate measures according to local characteristics, and to choose a combination of measures that is best for each particular site.
The importance of combing micro scale and macro scale effectiveness assessment of NBS was demonstrated through the present work. The use of microclimatic modeling in this framework showed that the effectiveness of NBS for thermal comfort enhancement depends on several factors. These factors are: The characteristics of the implementation site, the type of NBS, the coverage and location of the measures, and the time of day. Moreover, the results illustrate the usefulness of macro scale urban flood modeling for an assessment of the effectiveness of different NBS types for the reduction of flood impacts. Consequently, the present work proves the effectiveness of different NBS types taken from a micro and macro scale perspectives.
The outcome of the present research aims to provide some additional knowledge to city planners and decision makers in gaining better understanding of the effectiveness of different NBS measures for different sites and local conditions.

Author Contributions

Conceptualization, A.N.M., A.A., Z.V., A.S. and S.W.; Data curation, F.B. and J.K.; Formal analysis, A.N.M., A.A. and A.S.; Funding acquisition, Z.V. and S.W.; Investigation, A.N.M.; Methodology, A.N.M.; Project administration, Z.V.; Supervision, Z.V., S.W., A.S. and A.A.; Validation, F.B. and J.K.; Writing—original draft, A.N.M.; Writing—review & editing, A.A.

Funding

We are thankful to the Canadian Department of Foreign Affairs, Trade and Development, for providing financial support through Asian Development Bank (ADB) for performing this research. Furthermore, this research was also partially supported by the European Union Seventh Framework Programme (FP7/2007–2013) under Grant agreement n° 603,663 for the research project PEARL (Preparing for Extreme And Rare events in coastal regions) and from the European Union’s Horizon 2020 Research and Innovation Programme under grant agreement No 776866 for the research project RECONECT. The study reflects only the authors’ views and the European Union is not liable for any use that may be made of the information contained herein.

Acknowledgments

We thank Wendy Wuyts for improving earlier drafts of this manuscript.

Conflicts of Interest

The authors declare no conflict of interest.

Appendix A

Figure A1. Land use in the study area and details of land use in the two sites chosen to model thermal comfort.
Sustainability 11 06361 g0a1

Appendix B

Pervious Pavements
Figure A2. Schematic view of a pervious pavement system.
Sustainability 11 06361 g0a2
Table A1. PP Input parameters for PP modeling in ENVI-met.
ParameterUnitValue
Z0 Roughnessm0.01
Albedofraction0.8
Emissivityfraction0.9
Surface irrigated-No
Table A2. Input parameters for PP modeling in Mike Urban.
Parameter (Units)ValueSource
Surface
 Storage height (mm)0[43]
 Vegetation volume (fraction)-Assumption
 Surface Roughness (Manning’s m)20[43]
 Surface Slope (%)1[64,65]
Pavement
 Thickness (mm)150[64,65]
 Void Ratio (voids/solids)0.15[64,65]
 Impervious Surface Fraction (fraction)0[64,65]
 Permeability (mm/h)200[64,65]
 Clogging Factor300Formula based
Storage
 Height (mm)300[43,66]
 Porosity (fraction)0.70[64,65]
 Infiltration capacity of surrounding soil (mm/h)10[64,65]
 Clogging Factor0Assumed no clogging
Drain
 Drain Capacity (mm/h)0[43]
 Drain Exponent0.5[64,65]
 Drain Offset Height (mm)0[64,65]
Green roofs
Figure A3. Schematic view of a green roof system.
Sustainability 11 06361 g0a3
Table A3. Input parameters for GR modeling in ENVI-met (The toping grass).
ParameterUnitValue
Leaf Type-Grass
Albedofraction0.2
Plant heightm0.5
Root zone heightm0.5
LAD (Leaf area density) profile-Default
RAD (Root area density) profile-Default
Table A4. Input parameters for GR modeling in Mike Urban.
Parameter (Units)ValueSource
Surface
 Storage Depth (mm)20
 Vegetative Volume (fraction)0.1[65]
 Surface Roughness (Manning’s m)5[65]
 Surface Slope (percent)1[65]
Soil
 Thickness (mm)150[66]
 Porosity (volume fraction)0.5[66]
 Field Capacity (volume fraction)0.20[66]
 Wilting Point (volume fraction)0.1[66]
 Conductivity (mm/h)12.7[66]
 Conductivity Slope10[66]
 Suction Head (mm)88.9[65]
Drainage Mat
 Thickness (mm)25[64,65]
 Void fraction 0.5[64,65]
 Roughness (Manning M)5[64,65]
Bio-retention and Rain garden
Figure A4. Schematic view of a Bio-retention system.
Sustainability 11 06361 g0a4
Figure A5. Schematic view of a Rain Garden system.
Sustainability 11 06361 g0a5
Table A5. Input parameters for BR modeling in ENVI-me.
ParameterUnitValue
Leaf Type-Deciduous
Albedofraction0.2
Plant heightm1.2
Root zone heightm1
LAD (Leaf area density) profile-Default
RAD (Root area density) profile-Default
Table A6. Input parameters for RG modeling in ENVI-met.
ParameterUnitValue
Leaf Type-Deciduous
Albedofraction0.2
Plant heightm6.0
Root zone heightm1
LAD (Leaf area density) profile-Default
RAD (Root area density) profile-Default
Table A7. Input parameters for modeling BR and RG in Mike Urban.
Parameter (Units)(RG) Value(BR) ValueSource
Surface
 Storage Depth (mm)180150[43]
 Vegetative Volume (fraction)0.100.15[64,65]
 Surface Roughness (Manning’s m)52.5[64,65]
 Surface Slope (percent)11[64,65]
Soil
 Thickness (mm)800550[66]
 Porosity (volume fraction)0.50.5[66]
 Field Capacity (volume fraction)0.200.20[66]
 Wilting Point (volume fraction)0.100.10[66]
 Conductivity (mm/h)12.712.7Default; [64]
 Conductivity Slope1010Default; [64]
 Suction Head (mm)88.988.9Default; [64]
Storage
 Height (mm) 250[66]
 Void Ratio (voids/solids) 0.70[66]
 Infiltration capacity of surrounding soil (mm/h) 5[66]
 Clogging Factor 0Assumed no clogging
Underdrain
 Drain Capacity (mm/h) 0Default; [64]
 Drain Exponent 0.5Default; [64]
 Drain Offset Height (mm) 0Default; [64]

Appendix C

Site selection assessment for implementing the measures
A GIS extension tool called the Sustain-BMP siting tool, developed by the United States Environmental Protection Agency (US EPA), was used to analyze possible locations of NBS measures in the area. This tool was used only in the case of BR and RG, because the implementation of these two measures needs more detailed site feasibility assessment than in the case of GR and PP. This tool has been used for similar studies in several previous cases [67,68,69]. Figure A6 shows the overall methodology for the suitability analysis of the four selected NBS measures.
The input data for this tool, such as land use and a two meters’ resolution DEM, were provided for the Bangkok Metropolitan Administration office. Data about soil types, imperviousness and ground water level were obtained from the Department of Drainage and Sewage in Bangkok.
Figure A6. Flow chart for suitability analysis methodology.
Sustainability 11 06361 g0a6
Mike Urban simulation
A 1D/2D modeling simulation for producing the flood hazard map had been run by Mike Urban in different scenarios of implementing the multifunctional measures in the case study area. This is a well-recognized software for hydrodynamic modeling [70,71]. Additionally, the existing sewer network of Sukhumvit was also initially modeled using Mike Urban, which facilitated the building of the model for this study. Two modifications to the previously built model of Sukhumvit were introduced: Change in runoff routing and change in the simulation engine. Figure A7 shows the overall methodology followed in Mike Urban simulations to study the effectiveness of NBS measures on urban flooding.
Figure A7. The Mike Urban simulation methodology.
Sustainability 11 06361 g0a7
ENVI-met microclimatic simulation
ENVI-met is a three-dimensional non-hydrostatic climate model for the simulation of surface-plant-air interactions, especially for conditions inside urban environments. Since the model is designed for the microscale, the resolution output is high, ranging from 0.5 to 10 m horizontally, with a temporal resolution of 10 sec and the ability to simulate timeframes from 24 to 48 h. The model requires the user to input certain parameters, such as defining the model area (area input file) and configuring the initial atmospheric conditions, surfaces (including soils), vegetation, and time intervals [72]. Figure A8 shows the conceptual framework describing the required procedure and steps for running the microclimatic simulations in ENVI-met and visualizing and analyzing the results using LEONARDO 2014 and Biomet, respectively.
Figure A8. Procedures and steps for running the microclimatic simulations.
Sustainability 11 06361 g0a8

Appendix D

The selection of urban climate zones follows the urban climate zone categorization proposed by Stewart and Oke [35]. The zone numbers 1 & 6 of this categorization (see Figure A9) were used as sites B & A in microclimatic simulation.
Figure A9. Characteristics of zones chosen for microclimatic simulation (modified from [35]).
Sustainability 11 06361 g0a9

References

  1. Goonetilleke, A.; Thomas, E.; Ginn, S.; Gilbert, D. Understanding the role of land use in urban stormwater quality management. J. Environ. Manag. 2005, 74, 31–42. [Google Scholar] [CrossRef]
  2. Liu, W.; Chen, W.; Peng, C. Assessing the effectiveness of green infrastructures on urban flooding reduction: A community scale study. Ecol. Model. 2014, 291, 6–14. [Google Scholar] [CrossRef]
  3. Andersson-Sköld, Y.; Thorsson, S.; Rayner, D.; Lindberg, F.; Janhäll, S.; Jonsson, A.; Moback, U.; Bergman, R.; Granberg, M. An integrated method for assessing climate-related risks and adaptation alternatives in urban areas. Clim. Risk Manag. 2015, 7, 31–50. [Google Scholar] [CrossRef]
  4. Hilly, G.; Vojinovic, Z.; Weesakul, S.; Sanchez, A.; Hoang, D.; Djordjevic, S.; Chen, A.; Evans, B. Methodological Framework for Analysing Cascading Effects from Flood Events: The Case of Sukhumvit Area, Bangkok, Thailand. Water 2018, 10, 81. [Google Scholar] [CrossRef]
  5. Kovats, R.S.; Hajat, S. Heat Stress and Public Health: A Critical Review. Annu. Rev. Public Health 2008, 29, 41–55. [Google Scholar] [CrossRef]
  6. Derkzen, M.L.; van Teeffelen, A.J.A.; Verburg, P.H. Green infrastructure for urban climate adaptation: How do residents’ views on climate impacts and green infrastructure shape adaptation preferences? Landsc. Urban Plan. 2017, 157, 106–130. [Google Scholar] [CrossRef]
  7. Jia, Z.; Tang, S.; Luo, W.; Li, S.; Zhou, M. Small scale green infrastructure design to meet different urban hydrological criteria. J. Environ. Manag. 2016, 171, 92–100. [Google Scholar] [CrossRef]
  8. Nesshöver, C.; Assmuth, T.; Irvine, K.N.; Rusch, G.M.; Waylen, K.A.; Delbaere, B.; Haase, D.; Jones-Walters, L.; Keune, H.; Kovacs, E.; et al. The science, policy and practice of nature-based solutions: An interdisciplinary perspective. Sci. Total Environ. 2017, 579, 1215–1227. [Google Scholar] [CrossRef]
  9. Raymond, C.M.; Frantzeskaki, N.; Kabisch, N.; Berry, P.; Breil, M.; Nita, M.R.; Geneletti, D.; Calfapietra, C. A framework for assessing and implementing the co-benefits of nature-based solutions in urban areas. Environ. Sci. Policy 2017, 77, 15–24. [Google Scholar] [CrossRef]
  10. Alves, A.; Gersonius, B.; Sanchez, A.; Vojinovic, Z.; Kapelan, Z. Multi-criteria Approach for Selection of Green and Grey Infrastructure to Reduce Flood Risk and Increase CO-benefits. Water Resour. Manag. 2018, 32, 2505–2522. [Google Scholar] [CrossRef]
  11. Alves, A.; Gómez, J.P.; Vojinovic, Z.; Sánchez, A.; Weesakul, S. Combining Co-Benefits and Stakeholders Perceptions into Green Infrastructure Selection for Flood Risk Reduction. Environments 2018, 5, 29. [Google Scholar] [CrossRef]
  12. Ossa-Moreno, J.; Smith, K.M.; Mijic, A. Economic analysis of wider benefits to facilitate SuDS uptake in London, UK. Sustain. Cities Soc. 2017, 28, 411–419. [Google Scholar] [CrossRef]
  13. Demuzere, M.; Orru, K.; Heidrich, O.; Olazabal, E.; Geneletti, D.; Orru, H.; Bhave, A.G.; Mittal, N.; Feliu, E.; Faehnle, M. Mitigating and adapting to climate change: Multi-functional and multi-scale assessment of green urban infrastructure. J. Environ. Manag. 2014, 146, 107–115. [Google Scholar] [CrossRef] [PubMed]
  14. Ahiablame, L.M.; Engel, B.; Chaubey, I. Effectiveness of low impact development practices in two urbanized watersheds: Retrofitting with rain barrel/cistern and porous pavement. J. Environ. Manag. 2013, 119, 151–161. [Google Scholar] [CrossRef]
  15. Zahmatkesh, Z.; Burian, S.; Karamouz, M.; Tavakol-Davani, H.; Goharian, E. Low-Impact Development practices to mitigate climate change effects on urban stormwater runoff: Case study of New York City. J. Irrig. Drain. Eng. 2015, 141, 04014043. [Google Scholar] [CrossRef]
  16. Garcia-Ayllon, S. Long-term GIS analysis of seaside impacts associated to infrastructures and urbanization and spatial correlation with coastal vulnerability in a mediterranean area. Water (Switzerland) 2018, 10, 1642. [Google Scholar] [CrossRef]
  17. Hendel, M.; Gutierrez, P.; Colombert, M.; Diab, Y.; Royon, L. Measuring the effects of urban heat island mitigation techniques in the field: Application to the case of pavement-watering in Paris. Urban Clim. 2016, 16, 43–58. [Google Scholar] [CrossRef]
  18. Wang, Y.; Berardi, U.; Akbari, H. Comparing the effects of urban heat island mitigation strategies for Toronto, Canada. Energy Build. 2016, 114, 2–19. [Google Scholar] [CrossRef]
  19. Marando, F.; Salvatori, E.; Sebastiani, A.; Fusaro, L.; Manes, F. Regulating Ecosystem Services and Green Infrastructure: Assessment of Urban Heat Island effect mitigation in the municipality of Rome, Italy. Ecol. Model. 2019, 392, 92–102. [Google Scholar] [CrossRef]
  20. Nastran, M.; Kobal, M.; Eler, K. Urban heat islands in relation to green land use in European cities. Urban For. Urban Green. 2019, 37, 33–41. [Google Scholar] [CrossRef]
  21. Coccolo, S.; Pearlmutter, D.; Kaempf, J.; Scartezzini, J.L. Thermal Comfort Maps to estimate the impact of urban greening on the outdoor human comfort. Urban For. Urban Green. 2018, 35, 91–105. [Google Scholar] [CrossRef]
  22. Amani-Beni, M.; Zhang, B.; Xie, G.D.; Shi, Y. Impacts of urban green landscape patterns on land surface temperature: Evidence from the adjacent area of Olympic Forest Park of Beijing, China. Sustainability 2019, 11, 513. [Google Scholar] [CrossRef]
  23. Peng, L.L.H.; Jim, C.Y. Green-roof effects on neighborhood microclimate and human thermal sensation. Energies 2013, 6, 598–618. [Google Scholar] [CrossRef]
  24. Herath, H.M.P.I.K.; Halwatura, R.U.; Jayasinghe, G.Y. Evaluation of green infrastructure effects on tropical Sri Lankan urban context as an urban heat island adaptation strategy. Urban For. Urban Green. 2018, 29, 212–222. [Google Scholar] [CrossRef]
  25. Galagoda, R.U.; Jayasinghe, G.Y.; Halwatura, R.U.; Rupasinghe, H.T. The impact of urban green infrastructure as a sustainable approach towards tropical micro-climatic changes and human thermal comfort. Urban For. Urban Green. 2018, 34, 1–9. [Google Scholar] [CrossRef]
  26. Tsoka, S.; Tsikaloudaki, A.; Theodosiou, T. Analyzing the ENVI-met microclimate model’s performance and assessing cool materials and urban vegetation applications—A review. Sustain. Cities Soc. 2018, 43, 55–76. [Google Scholar] [CrossRef]
  27. Crank, P.J.; Sailor, D.J.; Ban-Weiss, G.; Taleghani, M. Evaluating the ENVI-met microscale model for suitability in analysis of targeted urban heat mitigation strategies. Urban Clim. 2018, 26, 188–197. [Google Scholar] [CrossRef]
  28. World Bank. East Asia’s Changing Urban Landscape: Measuring a Decade of Spatial Growth; World Bank: Washington, DC, USA, 2015. [Google Scholar]
  29. Srivanit, M.; Hokao, K.; Phonekeo, V. Assessing the Impact of Urbanization on Urban Thermal Environment: A Case Study of Bangkok Metropolitan. Int. J. Appl. Sci. Technol. 2012, 2, 243–256. [Google Scholar]
  30. Rehan, M.M.; Weesakul, S.; Chaowiwat, W.; Charoensukrungruang, W. Development of Design Storm Pattern with Climate Change in Monsoon Asia. In Proceedings of the THA 2017 International Conference on “Water Management and Climate Change Towards Asia’s Water-Energy-Food Nexus”, Bangkok, Thailand, 25–27 January 2017. [Google Scholar]
  31. Sheikh, Z.A. Farmer’s Perceived Agricultural Adaptation to Climate Change Impact in Rangsit Canal Area of Nong Sua District, Thailand; Asian Institute of Technology: Bangkok, Thailand, 2016. [Google Scholar]
  32. Arifwidodo, S.D.; Tanaka, T. The Characteristics of Urban Heat Island in Bangkok, Thailand. Procedia-Soc. Behav. Sci. 2015, 195, 423–428. [Google Scholar] [CrossRef]
  33. Mark, O.; Weesakul, S.; Apirumanekul, C.; Aroonnet, S.B.; Djordjević, S. Potential and limitations of 1D modelling of urban flooding. J. Hydrol. 2004, 299, 284–299. [Google Scholar] [CrossRef]
  34. Price, R.K.; Vojinovic, Z. Urban Hydroinformatics: Data, Models and Decision Support for Integrated Urban Water Management, 1st ed.; IWA Publishing: London, UK, 2011. [Google Scholar]
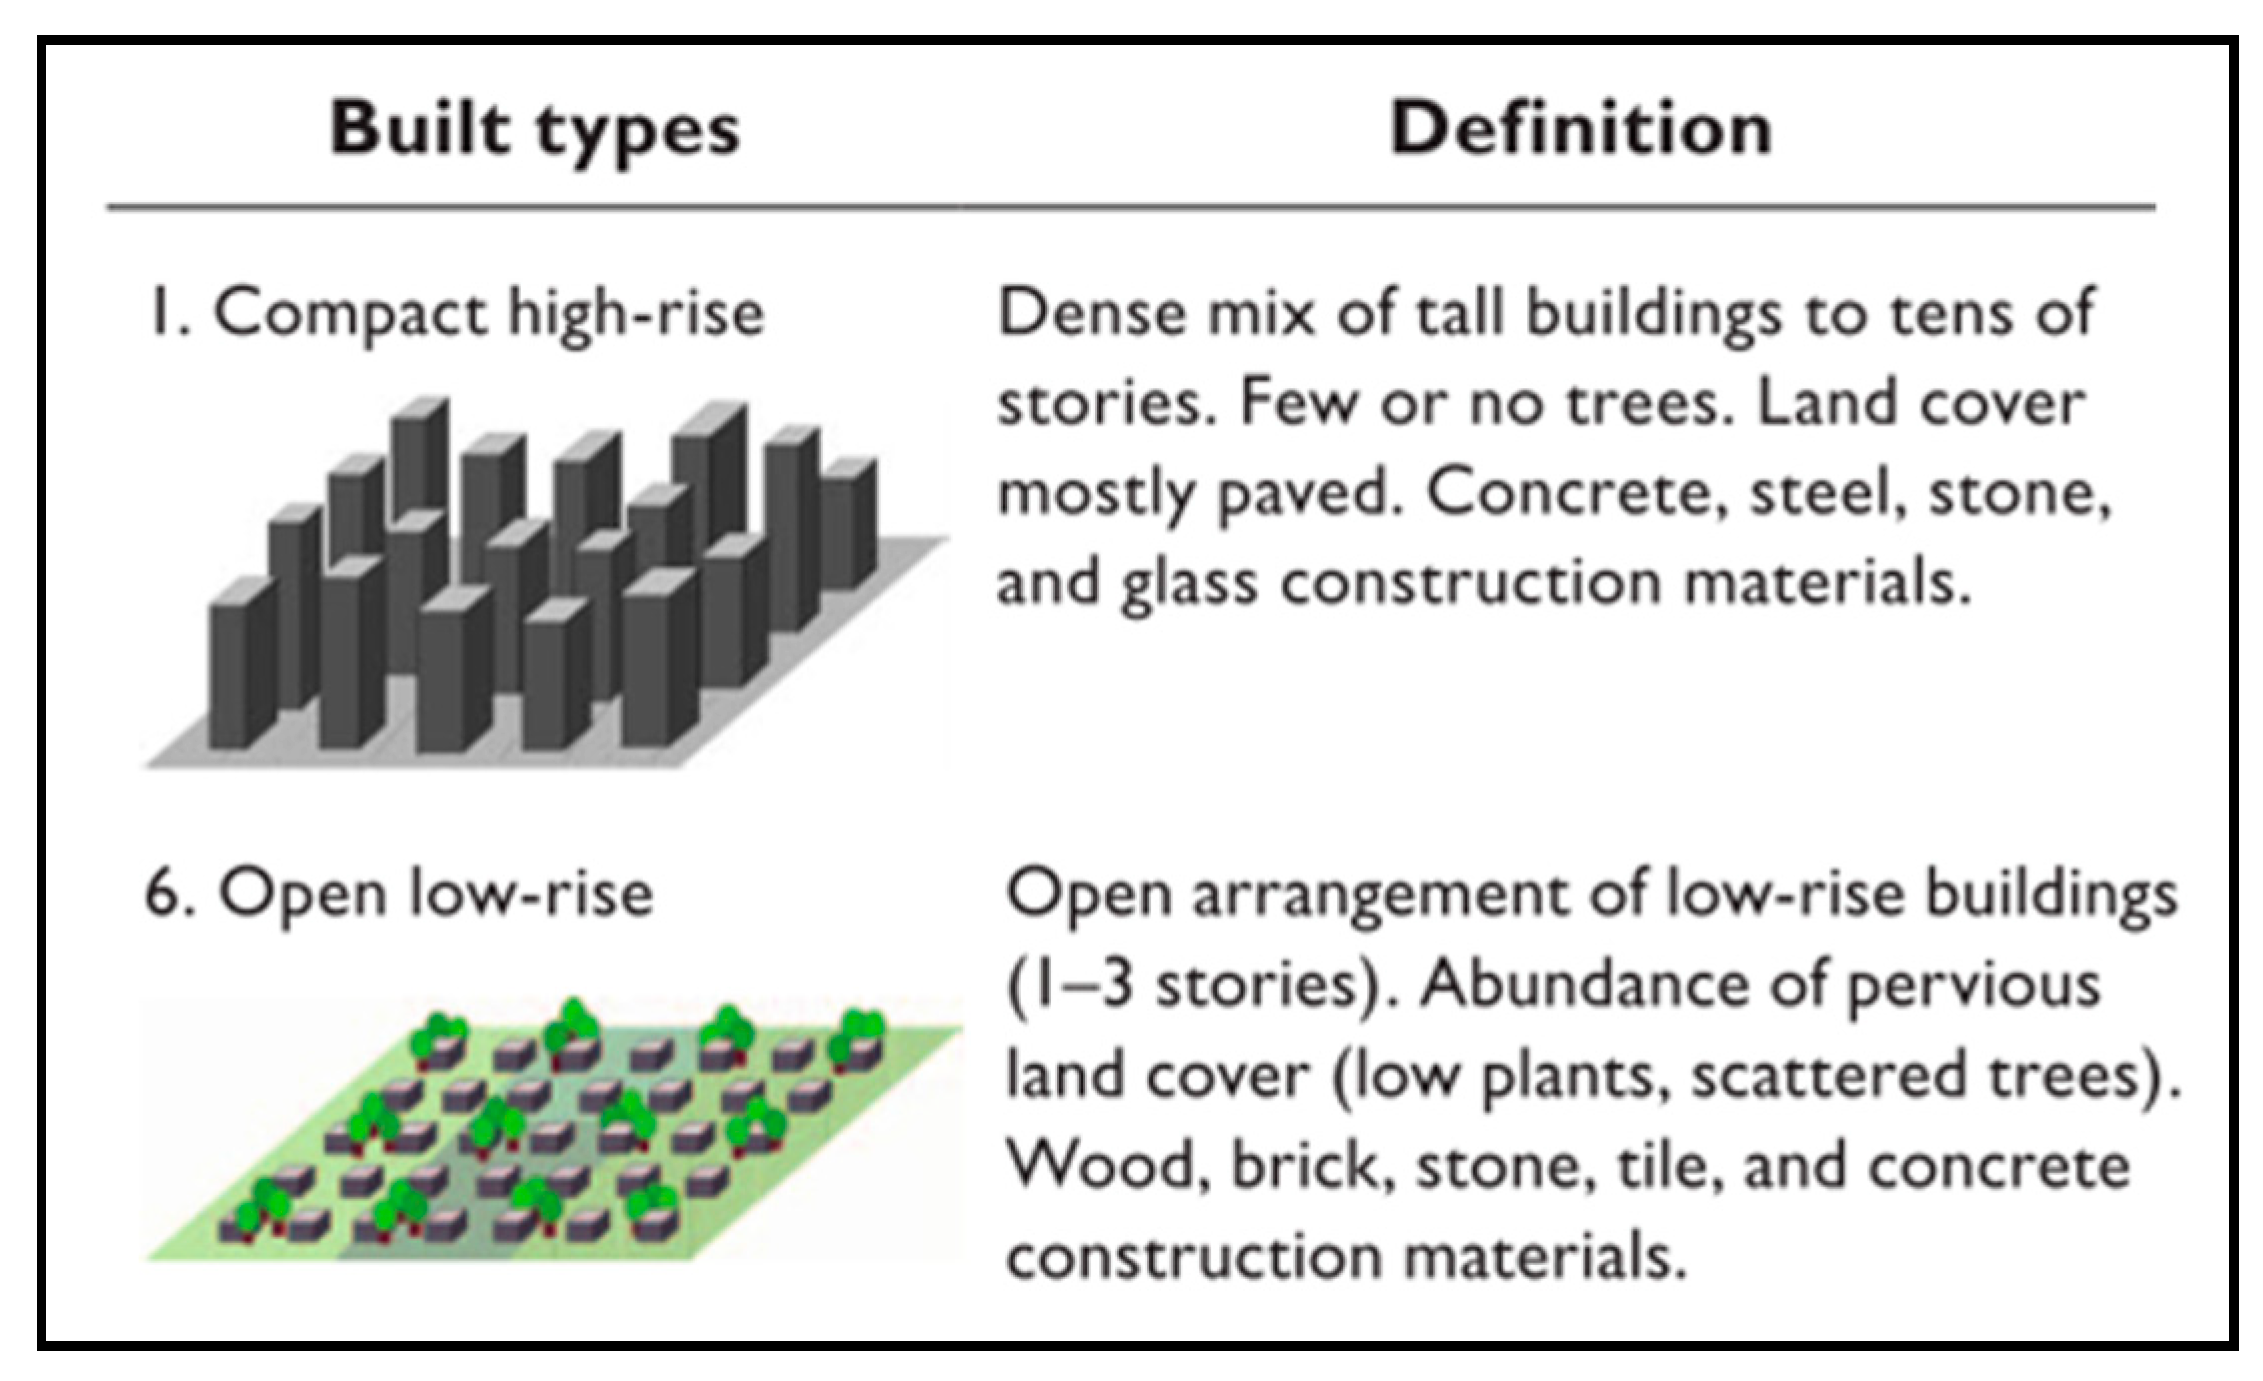
  35. Stewart, I.D.; Oke, T.R. Local climate zones for urban temperature studies. Bull. Am. Meteorol. Soc. 2012, 93, 1879–1900. [Google Scholar] [CrossRef]
  36. Coccolo, S.; Kämpf, J.; Scartezzini, J.L.; Pearlmutter, D. Outdoor human comfort and thermal stress: A comprehensive review on models and standards. Urban Clim. 2016, 18, 33–57. [Google Scholar] [CrossRef]
  37. Hoppe, P. The physiological equivalent temperature—A universal index for the biometeorological assessment of the thermal environment. Int. J. Biometeorol. 1999, 43, 71–75. [Google Scholar] [CrossRef] [PubMed]
  38. ISO 7726. Ergonomics of the Thermal Environment, Instruments of Measuring Physical Quantities; ISO: Geneva, Switzerland, 1998. [Google Scholar]
  39. Ahiablame, L.M.; Engel, B.; Chaubey, I. Effectiveness of Low Impact Development Practices: Literature Review and Suggestions for Future Research. Water Air Soil Pollut. 2012, 223, 4253–4273. [Google Scholar] [CrossRef]
  40. Connop, S.; Vandergert, P.; Eisenberg, B.; Collier, M.J.; Nash, C.; Clough, J.; Newport, D. Renaturing cities using a regionally-focused biodiversity-led multifunctional benefits approach to urban green infrastructure. Environ. Sci. Policy 2015, 62, 99–111. [Google Scholar] [CrossRef] [Green Version]
  41. Sharma, R.; Joshi, P.K. Mapping environmental impacts of rapid urbanization in the National Capital Region of India using remote sensing inputs. Urban Clim. 2016, 15, 70–82. [Google Scholar] [CrossRef]
  42. Tetra Tech. BMP Siting Tool: Step-by-Step Guide; Tetra Tech: Pasadena, CA, USA, 2013. [Google Scholar]
  43. DHI. Storm Water Runoff from Green Urban Areas—Modellers’ Guideline; DHI: Hørsholm, Danmark, 2015. [Google Scholar]
  44. Vojinovic, Z.; Tutulic, D. On the use of 1D and coupled 1D-2D approaches for assessment of flood damages in urban areas. Urban Water J. 2009, 6, 183–199. [Google Scholar] [CrossRef]
  45. ENVI-met. Available online: https://www.envi-met.com/ (accessed on 1 December 2016).
  46. Berardi, U. The outdoor microclimate benefits and energy saving resulting from green roofs retrofits. Energy Build. 2016, 121, 217–229. [Google Scholar] [CrossRef]
  47. Bruse, M. Simulating microscale climate interactions in complex terrain with a high-resolution numerical model: A case study for the Sydney CBD Area (Model Description). In Proceedings of the International Conference on Urban Climatology & International Congress of Biometeorology, Sydney, Australia, 8 November 1999. [Google Scholar]
  48. Salata, F.; Golasi, I.; de Lieto Vollaro, R.; de Lieto Vollaro, A. Urban microclimate and outdoor thermal comfort. A proper procedure to fit ENVI-met simulation outputs to experimental data. Sustain. Cities Soc. 2016, 26, 318–343. [Google Scholar] [CrossRef]
  49. Yang, X.; Zhao, L.; Bruse, M.; Meng, Q. Evaluation of a microclimate model for predicting the thermal behavior of different ground surfaces. Build. Environ. 2013, 60, 93–104. [Google Scholar] [CrossRef]
  50. ASHRAE. Standard 55—Thermal Environmental Conditions for Human Occupacy; ASHRAE: Atlanta, GA, USA, 2013. [Google Scholar]
  51. Lee, H.; Mayer, H.; Chen, L. Contribution of trees and grasslands to the mitigation of human heat stress in a residential district of Freiburg, Southwest Germany. Landsc. Urban Plan. 2016, 148, 37–50. [Google Scholar] [CrossRef]
  52. Perini, K.; Magliocco, A. Effects of vegetation, urban density, building height, and atmospheric conditions on local temperatures and thermal comfort. Urban For. Urban Green. 2014, 13, 495–506. [Google Scholar] [CrossRef]
  53. Vailshery, L.S.; Jaganmohan, M.; Nagendra, H. Effect of street trees on microclimate and air pollution in a tropical city. Urban For. Urban Green. 2013, 12, 408–415. [Google Scholar] [CrossRef]
  54. Jamei, E.; Rajagopalan, P. The effect of green roof on pedestrian level air temperature. In Proceedings of the 14th Conference of International Building Performance Simulation Associatiion, Hyderabad, India, 7–9 December 2015. [Google Scholar]
  55. Lobaccaro, G.; Acero, J.A. Comparative analysis of green actions to improve outdoor thermal comfort inside typical urban street canyons. Urban Clim. 2015, 14, 251–267. [Google Scholar] [CrossRef]
  56. Sharma, A.; Conry, P.; Fernando, H.J.S.; Hamlet, A.F.; Hellmann, J.J.; Chen, F. Green and cool roofs to mitigate urban heat island effects in the Chicago metropolitan area: Evaluation with a regional climate model. Environ. Res. Lett. 2016, 11, 064004. [Google Scholar] [CrossRef]
  57. Hedquist, B.C.; Brazel, A.J. Seasonal variability of temperatures and outdoor human comfort inPhoenix, Arizona, U.S.A. Build. Environ. 2014, 72, 377–388. [Google Scholar] [CrossRef]
  58. Rizwan, A.M.; Dennis, L.Y.C.; Liu, C. A review on the generation, determination and mitigation of Urban Heat Island. J. Environ. Sci. 2008, 20, 120–128. [Google Scholar] [CrossRef]
  59. Carpenter, D.D.; Kaluvakolanu, P. Effect of Roof Surface Type on Storm-Water Runoff from Full-Scale Roofs in a Temperate Climate. J. Irrig. Drain. Eng. 2011, 137, 161–169. [Google Scholar] [CrossRef]
  60. Berardi, U.; GhaffarianHoseini, A.H.; GhaffarianHoseini, A. State-of-the-art analysis of the environmental benefits of green roofs. Appl. Energy 2014, 115, 411–428. [Google Scholar] [CrossRef]
  61. Duarte, D.H.S.; Shinzato, P.; Gusson, C.D.S.; Alves, C.A. The impact of vegetation on urban microclimate to counterbalance built density in a subtropical changing climate. Urban Clim. 2015, 14, 224–239. [Google Scholar] [CrossRef]
  62. Wang, Y.; Akbari, H. The effects of street tree planting on Urban Heat Island mitigation in Montreal. Sustain. Cities Soc. 2016, 27, 122–128. [Google Scholar] [CrossRef]
  63. Vijayaraghavan, K. Green roofs: A critical review on the role of components, benefits, limitations and trends. Renew. Sustain. Energy Rev. 2016, 57, 740–752. [Google Scholar] [CrossRef]
  64. Kjølby, M.J. Modellering af LAR Anlæg Samt Modellering af Stoffjernelse i LAR Anlæg og Bassiner. Available online: http://www.evanet.dk/modellering-af-lar-anlaeg-samt-modellering-af-stoffjernelse-i-lar-anlaeg-og-bassiner/ (accessed on 1 December 2016).
  65. James, W.; Rossman, L.E.; James, R.C. User Guide to SWMM5; CHI Press: Guelph, ON, Canada, 2010. [Google Scholar]
  66. Rossman, L.A. Storm Water Management Model User’s Manual Version 5.1; US EPA: Cincinnati, OH, USA, 2015. [Google Scholar]
  67. Gao, J.; Wang, R.; Huang, J.; Liu, M. Application of BMP to urban runoff control using SUSTAIN model: Case study in an industrial area. Ecol. Model. 2015, 318, 177–183. [Google Scholar] [CrossRef]
  68. Mao, X.; Jia, H.; Yu, S.L. Assessing the ecological benefits of aggregate LID-BMPs through modelling. Ecol. Model. 2016, 353, 139–149. [Google Scholar] [CrossRef]
  69. Maryati, S.; Humaira, A.N.S.; Adianti, P. Green Infrastructure Development in Cisangkuy Subwatershed, Bandung Regency: Potential and Problems. Procedia-Soc. Behav. Sci. 2016, 227, 617–622. [Google Scholar] [CrossRef] [Green Version]
  70. Elliott, A.; Trowsdale, S. A review of models for low impact urban stormwater drainage. Environ. Model. Softw. 2007, 22, 394–405. [Google Scholar] [CrossRef]
  71. Zhou, Q. A review of sustainable urban drainage systems considering the climate change and urbanization impacts. Water 2014, 6, 976–992. [Google Scholar] [CrossRef]
  72. Declet-Barreto, J.; Brazel, A.J.; Martin, C.A.; Chow, W.T.L.; Harlan, S.L. Creating the park cool island in an inner-city neighborhood: Heat mitigation strategy for Phoenix, AZ. Urban Ecosyst. 2013, 16, 617–635. [Google Scholar] [CrossRef]
Figure 1. Methodological framework.
Sustainability 11 06361 g001
Figure 2. Location of the study area.
Sustainability 11 06361 g002
Figure 3. Study area showed as a green boundary on the left image, which was the modeled area for flooding. Two representative urban configurations showed as areas with red boundaries and were used for thermal comfort modeling: Site A: Open low-rise (right up image) & Site B: Compact high-rise (right bottom image).
Sustainability 11 06361 g003
Figure 4. Overall framework for effectiveness assessment of NBSs.
Sustainability 11 06361 g004
Figure 5. Relation of urban flooding with heat stress and urbanization, shown through the overlay of the flood inundation map (for a 20-year return period rainfall) and variation in real estate.
Sustainability 11 06361 g005
Figure 6. (a) NBS effectiveness on runoff volume reduction, (b) NBS effectiveness on peak discharge reduction.
Sustainability 11 06361 g006
Figure 7. (a) Model of the base case scenario in ENVI-met for scenario A-B (see Table 3); (b) Effectiveness of RG implementation on Ta reduction for scenario A-RG; (c) Effectiveness of RG implementation on PMV reduction for scenario A-RG; (d) Effectiveness of RG implementation on Tmrt reduction for scenario A-RG.
Sustainability 11 06361 g007
Table 1. Mobile measurements in five different urban land uses (M1-5 refer to measuring locations).
SnIDInstalled HeightType of MeasurementCharacteristic of the Location
1M11.4 mMobileWater Body
2M21.4 mMobileHighly dense urban area (high vehicle traffic and buildings construction)
3M31.4 mMobileCompact high-rise
4M41.4 mMobileUrban Green (Park)
5M51.4 mMobileOpen low-rise
Table 2. Model input data and parameters.
NBS IDMike Urban Model
(Scenarios X & Y)
ENVI-Met Model
(Scenarios A & B)
InputsOutputsInputsOutputs
PP
(Pervious Pavement)
Surface, Pavement, Storage and Drain parametersThe amount of change in volume, flow and time to peak for each of the X and Y Scenarios and for each of the variables.The surface Albedo and emissivity of the PP is changed from 0.4 to 0.8.The average of change in Ta, MRT and PMV for each of the scenarios A and B and for each of the variables.
GR
(Green Roof)
Surface, Soil and Drainage mat parametersGrass on top of the buildings. The characteristics of the grass are LAD, Albedo, Cell size and intensity.
BR
(Bio-Retention)
Surface, Soil, storage and Underdrain parametersThe Green area percentage is increase by 5%. The inputs are Number of trees, LAD, RAD, plant height, Albedo and Leaf type.
RG
(Rain Garden)
Surface and Soil parametersThe Green area percentage is increase by 5%. The inputs are Number of trees, LAD, RAD, plant height, Albedo and Leaf type.
Table 3. Nature-Based Solutions (NBS) implementation scenarios for urban flood assessment.
Measures and Their Implemented Scenarios for Assessment of Urban Flood Reduction (F)—Macro Scale
Implemented MeasuresDescription of MeasuresScenarios According to Rainfall Return Periods
2 Year20 Year
Business as usualBusiness as usualX-BY-B
PP (all str. and pavements)
(implementing area: 15%)
Pervious Pavements (with high albedo material)X-PPY-PP
GR (all feasible roofs)
(implementing area: 27%)
Green roof (extensive vegetation)X-GRY-GR
BR (alongside the streets)
(implementing area: 4%)
Bio-retention (with shrub/bush)X-BRY-BR
RG (alongside the streets)
(implementing area: 4%)
Rain garden (with street trees)X-RGY-RG
Table 4. NBS implementation scenarios for thermal comfort assessment.
Scenarios for Thermal Comfort Effectiveness Assessment (T)—Micro Scale
Implemented MeasuresDescription of MeasuresScenarios According to Site Characterizes
Low RiseHigh Rise
Business as usualBusiness as usualA-BB-B
PP (all str. and pavements)
(implementing area: 25%)
Changing the albedo from 0.4 to 0.8A-PPB-PP
GR (all feasible roofs)
(implementing area: 35%)
Adding 50 cm height grass on top of the roofsA-GRB-GR
BR (alongside the street)
(implementing area: 5%)
Planting shrubs (1.2 m height) alongside the street edgesA-BRB-BR
RG (alongside the street)
(implementing area: 5%)
Planting trees (6.0 m height) alongside the street edgesA-RGB-RG
Table 5. Effectiveness of the NBS measures on reduction of Ta, Tmrt and PMV.
Simulated Sub-Scenario
(NBS’s Variation)
Description of MeasuresMax Reduction in Ta 4:00 p.m.
(°C)
Max Reduction in Tmrt at 4:00 p.m.
(°C)
Max Reduction in PMV at 4:00 p.m.
(−5 to 5)
Open Low rise buildings (Site A)
A-PPChanging the albedo from 0.4 to 0.80.41−0.6
(from 51.18)
0.68
(from 4.67)
A-GRAdding 50 cm height grass on top of the roofs0.1717.81
(from 51.18)
0.8
(from 4.67)
A-BRPlanting shrubs (1.3 m height) alongside the street edges0.1616.2
(from 51.18)
1.52
(from 4.67)
A-RGPlanting trees (6.0 m height) alongside the street edges0.6619.36
(from 51.18)
2.21
(from 4.67)
Compact high-rise buildings (Site B)
B-PPChanging the albedo from 0.4 to 0.80.10−0.69
(from 52.31)
−0.05
(from 4.09)
B-GRAdding 50 cm height grass on top of the roofs0.000.10
(from 52.31)
0.01
(from 4.09)
B-BRPlanting shrubs (1.3 m height) alongside the street edges0.0715.64
(from 52.31)
1.07
(from 4.09)
B-RGPlanting trees (6.0 m height) alongside the street edges0.2519.26
(from 52.31)
1.52
(from 4.09)
Table 6. Comparative effectiveness scoring of the measures in urban flooding.
Effectiveness AspectScenariosCriteriaComparative Effectiveness Scoring of NBS Measures
PPGRBRRG
Reduction in urban flooding2 years (X)Runoff volume1423
Peak discharge1433
Performance score for scenario (X)2856
20 years (Y)Runoff volume1423
Peak discharge1423
Performance score for scenario (Y)2846
Total comparative performance score416912
Table 7. Comparative effectiveness scoring of the measures on thermal comfort.
Effectiveness AspectScenariosCriteriaComparative Effectiveness Scoring of NBS Measures
PPGRBRRG
Thermal comfort enhancementLow rise (A)Ta3214
Tmrt1324
PMV1234
Performance in scenario (A)57612
High rise (B)Ta3124
Tmrt1234
PMV1234
Performance in scenario (B)55812
Total comparative score 10121424
Table 8. The overall effectiveness scoring of the measures’ performance.
Effectiveness Aspect.ScenariosComparative Effectiveness Scoring for each of the NBS Measures
PPGRBRRG
Reduction in urban flooding (F)2 year (X)2856
20 year (Y)2846
Thermal comfort enhancement (T)Low rise (A)57612
High rise (B)55812
Overall comparative score14282336

