Article

Green Supplier Evaluation and Selection with an Extended MABAC Method Under the Heterogeneous Information Environment

1
School of Management, Shanghai University, Shanghai 200444, China
2
College of Economics and Management, China Jiliang University, Hangzhou 310018, China
3
School of Economics and Management, Tongji University, Shanghai 200092, China
*
Author to whom correspondence should be addressed.
Sustainability 2019, 11(23), 6616; https://doi.org/10.3390/su11236616
Submission received: 17 September 2019 / Revised: 17 November 2019 / Accepted: 20 November 2019 / Published: 22 November 2019

Abstract

:
With the increasing awareness of global environmental protection, green production has become a significant part for enterprises to remain in a competitive position. For a manufacturing company, selecting the most suitable green supplier plays an important role in enhancing its green production performance. In this paper, we develop a new green supplier evaluation and selection model through the combination of heterogeneous criteria information and an extended multi-attributive border approximation area comparison (MABAC) method. Considering the complexity of decision context, heterogeneous information, including real numbers, interval numbers, trapezoidal fuzzy numbers, and linguistic hesitant fuzzy sets, is utilized to evaluate alternative suppliers with respect to the selected criteria. A maximizing consensus approach is constructed to determine the weight of each decision-maker based on incomplete weighting information. Then, the classical MABAC method is modified for ranking candidate green suppliers under the heterogeneous information environment. Finally, the developed green supplier selection model is applied in a case study from the automobile industry to illustrate its practicability and efficiency.

1. Introduction

Due to the aggravation of global warming and climate change, environmental problems have driven more and more concern from people, stakeholders, and governments. To maintain a competitive edge in the global market, most enterprises have begun to incorporate green development concepts into their daily production and operation management [1,2]. In view of this, green supply chain management (GSCM) with environmental protection concept obtains increasing attention from both researchers and practitioners. The GSCM is a strategy which merges environmental consideration with supply chain practices and can efficiently assist companies in improving their commercial benefits and environmental performance [3,4,5,6].
As a significant part of GSCM, green supplier selection is a strategic decision that can enhance the business performance and competitive advantage of a manufacturing firm [7,8,9]. Since raw materials, services, and finished products are provided by suppliers as inputs to supply chains, the performance of manufacturers is directly affected by their suppliers’ performance. Thus, careful supplier evaluation and selection is needed to help organizations improve societal image, business continuity, and reduce costs [10,11]. Through selecting appropriate green suppliers, firms can balance economic-based supplier capabilities, as well as social and environmental capabilities, contributing to their strategic competitive advantages. In this context, a growing number of studies have investigated supplier selection problems incorporating sustainability criteria in recent decades [12,13,14].
In the green supplier evaluation process, different types of performance information (e.g., numerical values, internal values, fuzzy numbers, linguistic terms) may be involved because of the complexity of business context [4,15]. Hence, to reflect the characteristic of each supplier evaluation criterion accurately, the performance evaluation values on different criteria need to be represented in different forms. Trapezoidal fuzzy numbers (TFNs) are a type of fuzzy sets commonly used to describe the vagueness and uncertainty of human preference values. Recently, the concept of linguistic hesitant fuzzy sets (LHFSs) was developed by Meng et al. [16] to address the qualitative evaluations of decision-makers and reflect their hesitancy and inconsistency. The LHFSs consider the possible membership degrees of linguistic terms and can express linguistic decision information more accurately. Based on its advantages, the LHFS method has been utilized in different fields, such as renewable energy selection [17], sustainable healthcare management [18], and intelligent transportation system evaluation [19]. In this paper, the green performance values on different criteria are described by heterogeneous information in the forms of LHFSs, TFNs, interval numbers, and real numbers. Among them, the TFNs, interval numbers, and real numbers are used to represent quantitative criteria, and the LHFSs are adopted to describe qualitative criteria.
Generally, green supplier selection can be regarded as a multi-criteria decision-making (MCDM) problem, where a limited number of alternative suppliers are evaluated against multiple conflicting criteria. As a consequence, a number of MCDM methods have been employed for handling green supplier selection problems [15,20,21,22]. As a new MCDM technique, the multi-attributive border approximation area comparison (MABAC) method was introduced by Pamučar and Ćirović [23] based on the distance of criteria functions from each of the alternative border approximation areas. The idea of the MABAC method is to make the ranking result as accurate as possible through calculating the potential gains and losses values [24]. In addition, the methodology has a relatively simple computation procedure and can acquire a robust solution via in-depth comparison and sensibility analyses [25,26]. Because of its features, the MABAC method has been utilized for many practical decision-making problems, which includes third-party logistics provider assessment [27], collection modes evaluation in reverse logistics [28], sustainable freight transport system assessment [29], failure mode and effect analysis [30,31], healthcare waste treatment technology selection [32,33], and optimization of roadway support schemes [34]. Consequently, it is reasonable to adopt the MABAC method to derive the ranking of green suppliers, including multiple criteria and limited alternatives.
According to the above discussions, we aim to develop an extended MABAC model to determine the best green supplier with heterogeneous criteria information. In this model, LHFSs, TFNs, interval numbers, and real numbers are jointly employed to express the performance evaluations of alternative green suppliers with respect to different criteria. A maximizing consensus technique is constructed to compute the weights of decision-makers in terms of incomplete weighting information. Further, an extended MABAC method is developed for determining the priority of alternative green suppliers within the heterogeneous information environment. For doing so, the remainder of this paper is organized as follows: Section 2 reviews the existing researches on green supplier evaluation and selection and identifies research gaps. Section 3 presents the details of the developed green supplier evaluation and selection model. In Section 4, a case study in the automobile industry is utilized to illustrate the validity of the developed model, which is followed by a discussion of managerial implications in Section 5. Finally, concluding remarks and directions for future research are outlined in Section 6. For the basic concepts of LHFSs, TFNs, and interval numbers, we refer the interested readers to [16,19,35,36], respectively.

2. Literature Review

In recent years, dozens of papers have been published on green supplier selection and evaluation. For example, Alikhani et al. [37] proposed a multi-method approach based on interval type-2 fuzzy sets, the VIKOR (VlseKriterijumska Optimizacija I Kompromisno Resenje) method and super-efficiency data envelopment analysis (DEA) model for strategic supplier selection under sustainability and risk criteria. Bai et al. [10] developed a group decision-support model using grey best–worst method (BWM) and grey TODIM (an acronym in Portuguese for Interactive and Multi-criteria Decision Making) to tackle the social sustainable supplier selection problem. Haeri and Rezaei [38] established a green supplier selection model, in which BWM and fuzzy grey cognitive map were combined for determining the weights of evaluation criteria, and the grey relational analysis (GRA) technique was adopted for ranking alternative green suppliers. dos Santos et al. [12] proposed a decision framework which is composed of fuzzy technique for order preference by similarity to ideal solution (TOPSIS) and Shannon entropy to evaluate and select sustainable suppliers in the Brazilian furniture industry. Duan et al. [13] introduced a green supplier selection and order allocation model by integrating linguistic Z-numbers, an alternative queuing method (AQM) and a multi-objective line programming model. A multi-criteria model was reported in [39] for the performance evaluation of green suppliers using the Copeland method, analytic hierarchy process (AHP), and ELECTRE-TRI method. A hybrid MCDM model was developed in [20] to support the green supplier selection process based on interval-valued intuitionistic uncertain linguistic sets, BWM, and AQM. In [40], fuzzy AHP, cloud model, and possibility degree were integrated to select the optimal green supplier for a straw biomass power plant. Wu et al. [7] provided an integrated method based on BWM and VIKOR techniques to select a long-term green supplier partner for an electronic enterprise under an interval type-2 fuzzy environment. Phochanikorn and Tan [21] developed an integrated MCDM method through the combination of fuzzy decision-making trial and evaluation laboratory (DEMATEL), fuzzy analytic network process (ANP) and prospect theory to select green suppliers in the palm oil products industry. In addition, many single models have been proposed for sustainable supplier selection, which include the rough cloud TOPSIS [14], the interval 2-tuple TODIM [41], the picture fuzzy VIKOR [42] and the intuitionistic fuzzy TOPSIS [43] methods.
According to the review of the related literature, we can see that, although sustainable supplier selection methods using deferent uncertainty theories have been proposed, most of them are based on the settings in which the criteria evaluation values are represented by only one specific type. However, in many practical situations, the performance values on different criteria should be represented in different types of information, owing to the different characteristics of criteria. Besides, it can be found that a variety of MCDM methods have been applied for the ranking of economic-environmental suppliers. However, to the best of our understanding, the MABAC method has not been used in the previous researches of green supplier selection and evaluation. To overcome these gaps, in this paper, we introduced a new green supplier evaluation and selection model based on heterogeneous information and the MABAC method. The proposed model is able to effectively support practitioners and managers in selecting optimal green suppliers in the GSCM practices.

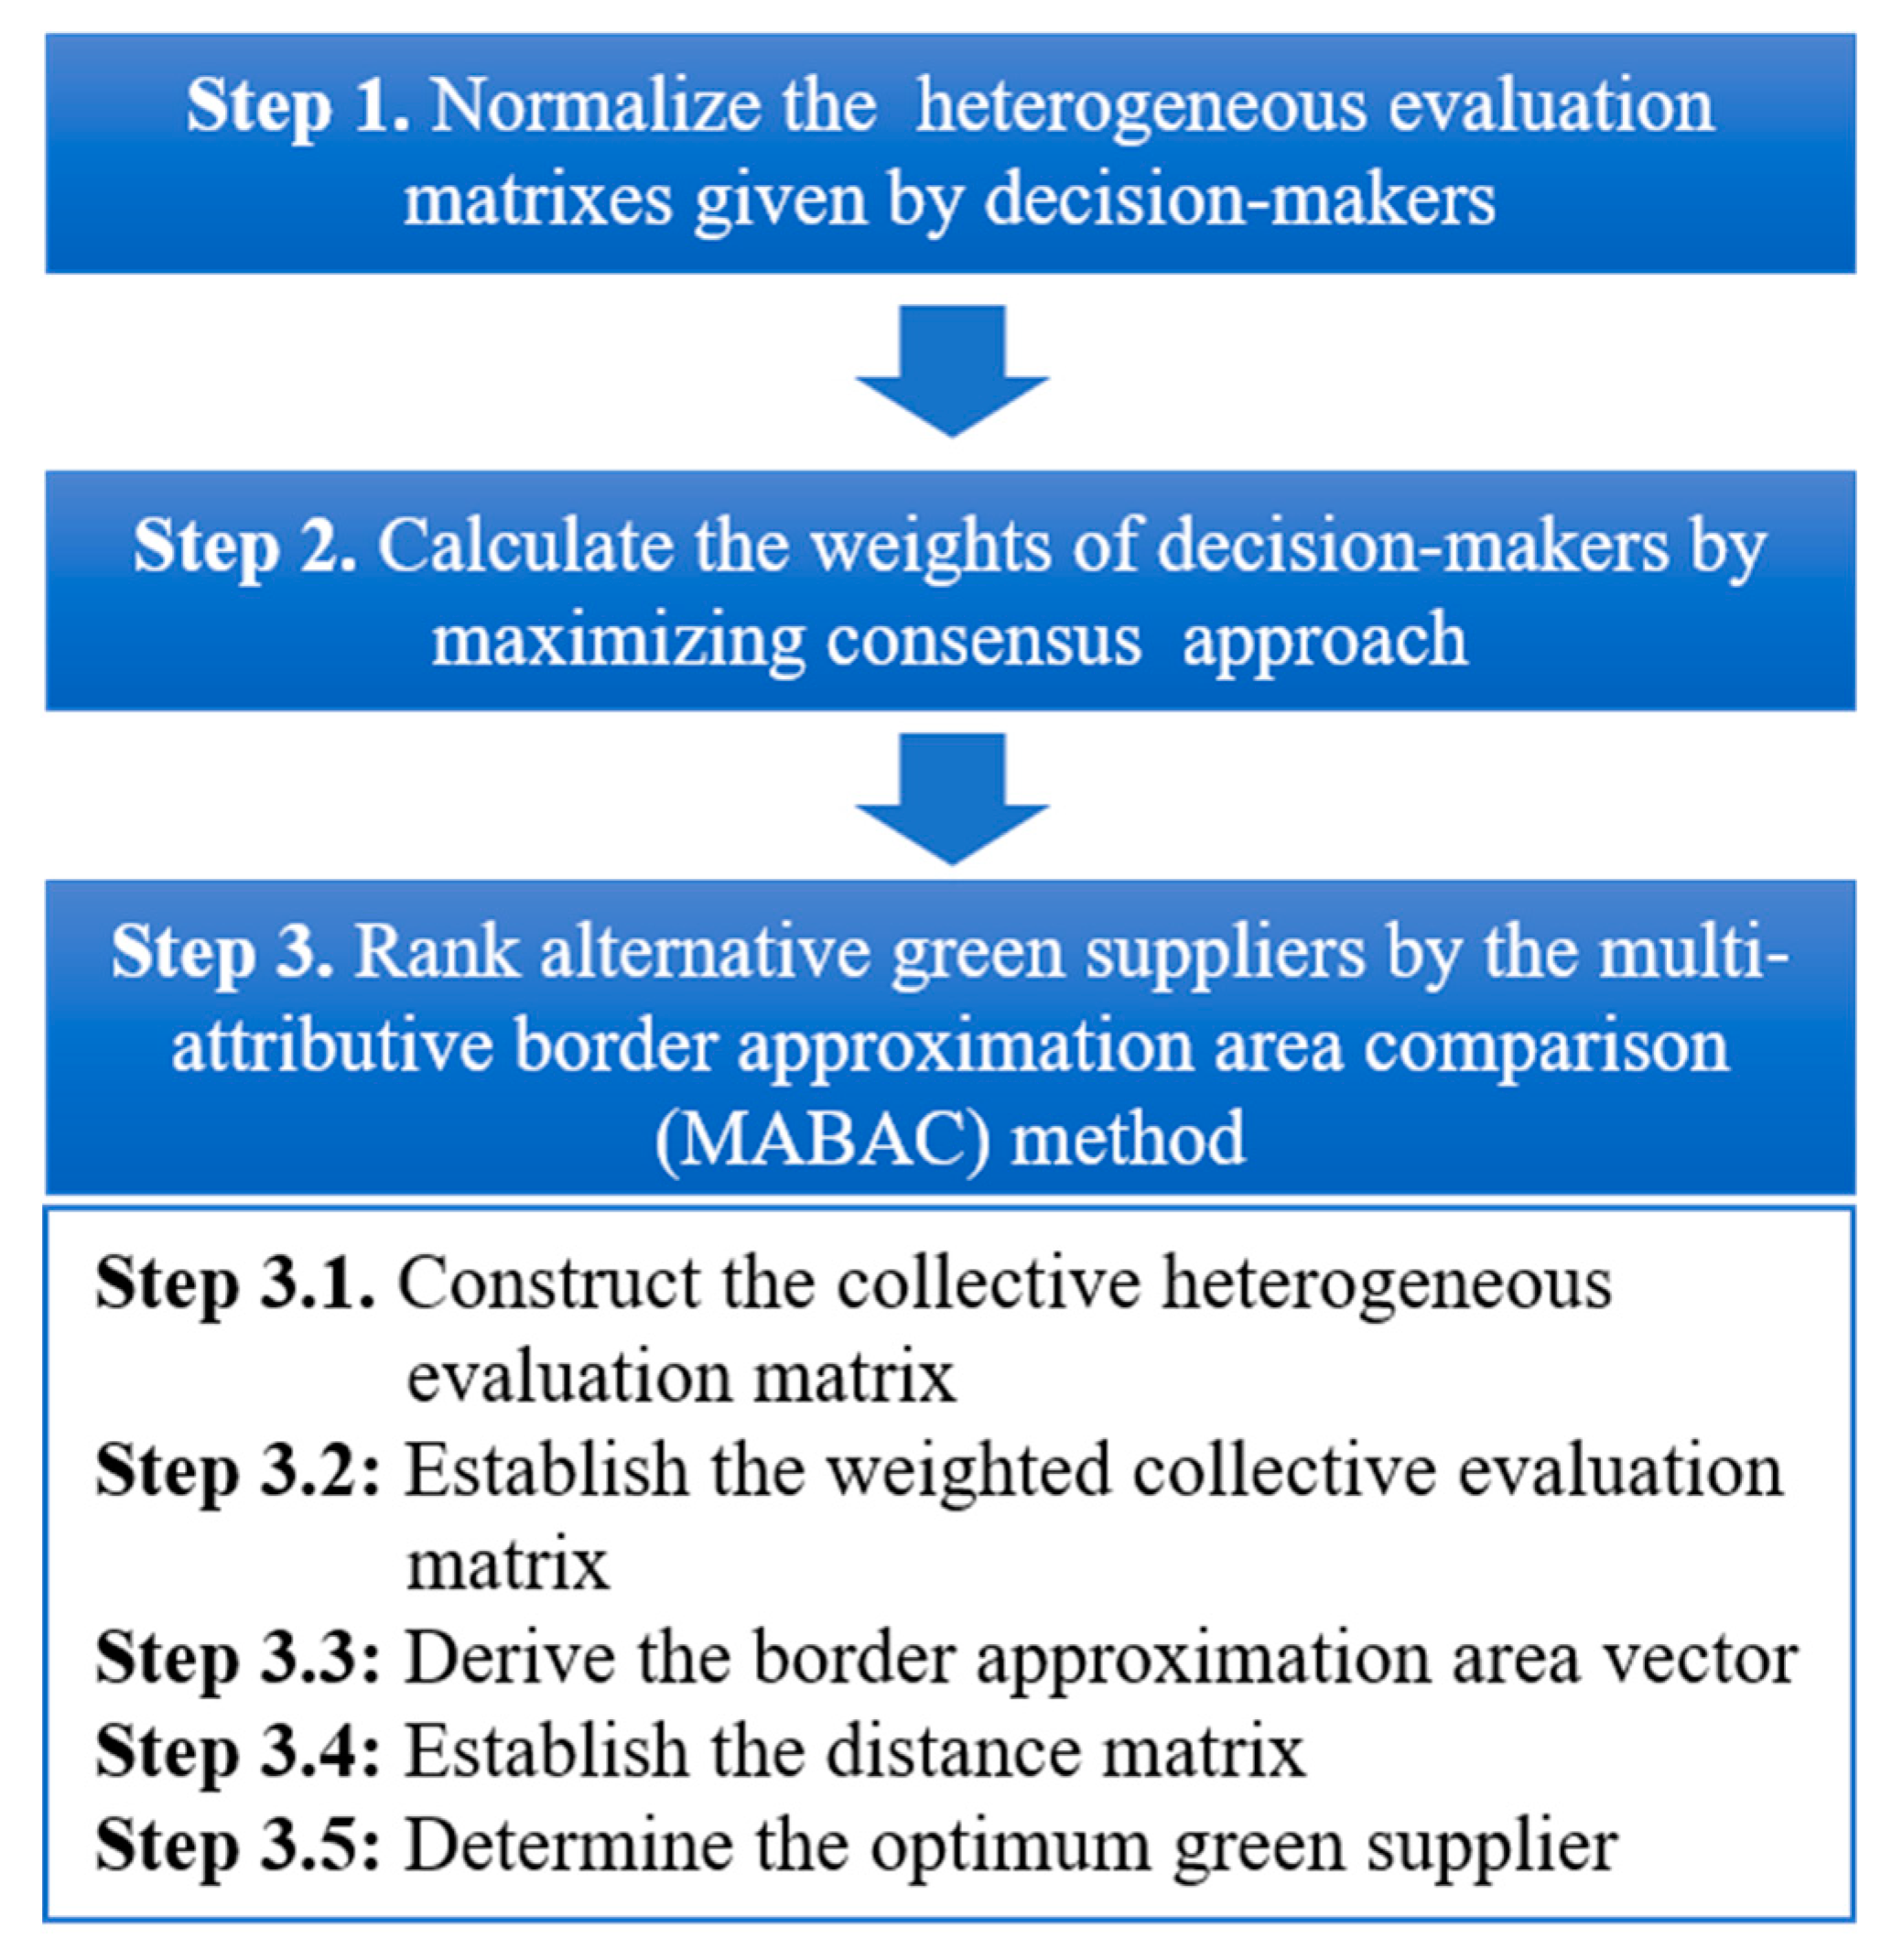
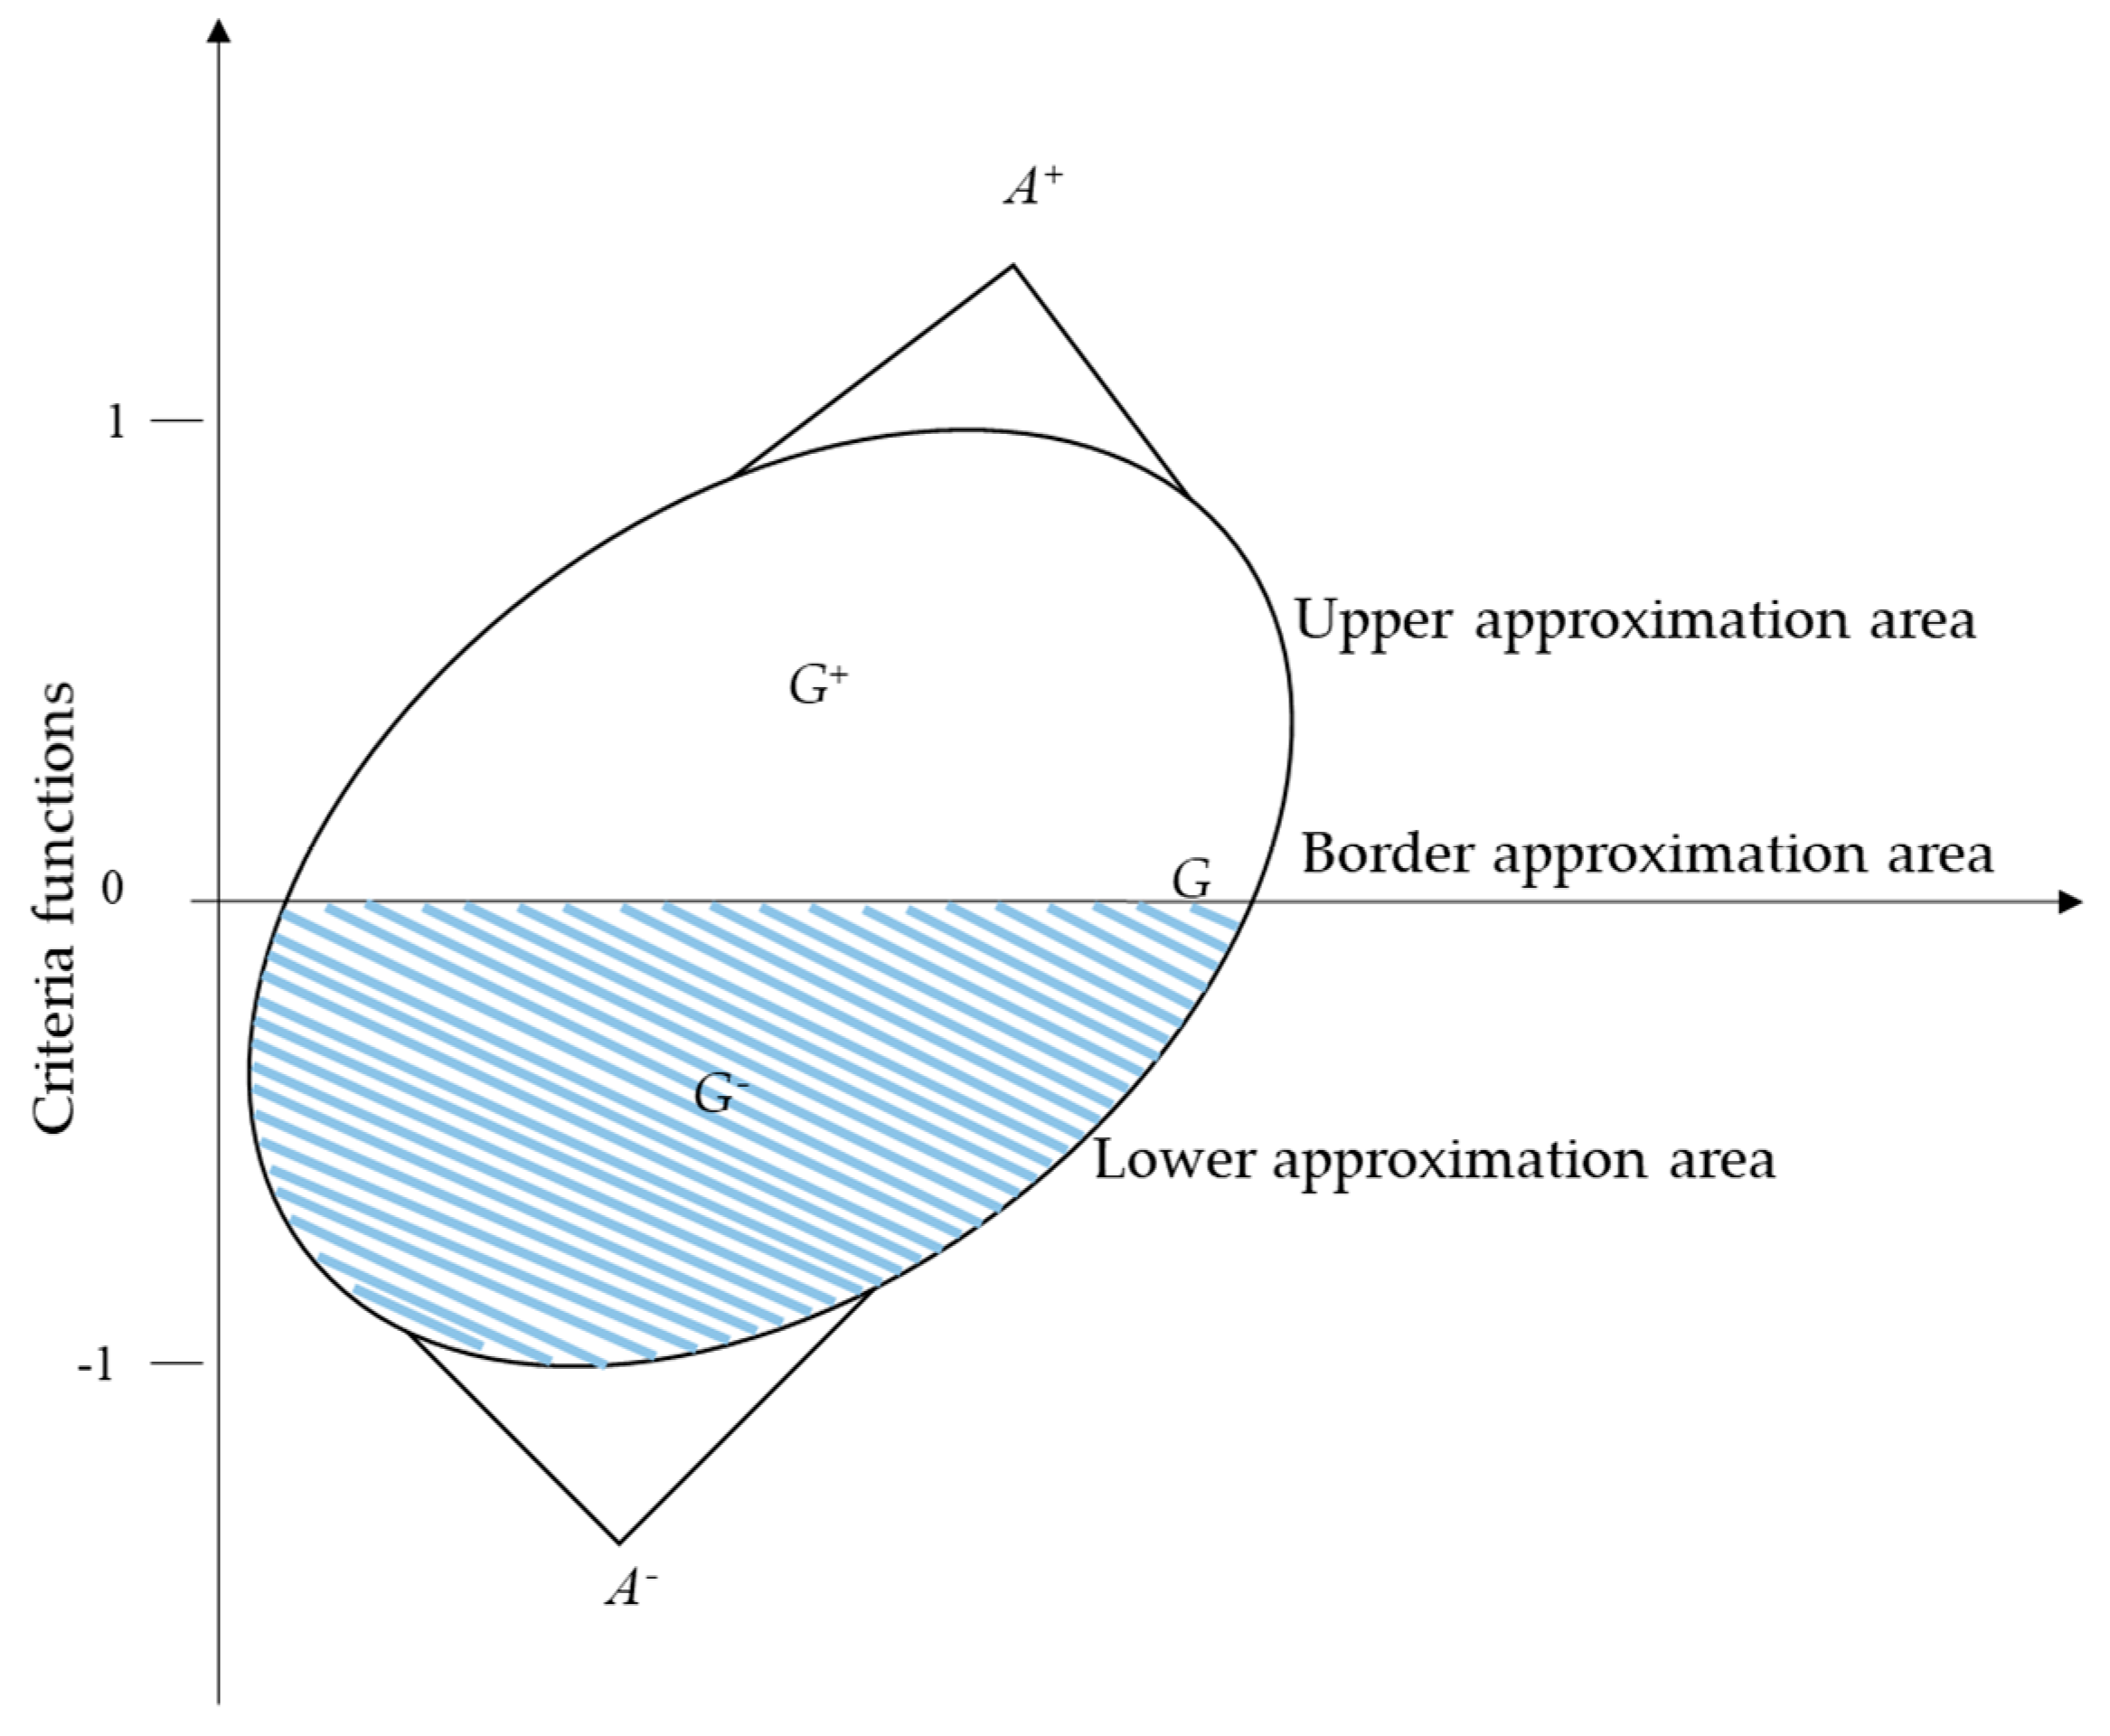
3. The Proposed Green Supplier Selection Model

This section develops an extended MABAC model to evaluate green suppliers and select the optimal one under the heterogeneous information environment. In this model, LHFSs, TFNs, interval numbers, and real numbers are utilized to represent the green performance of alternative suppliers regarding different criteria. A maximizing consensus technique is adopted to determine the weights of decision-makers based on incomplete weighting information. Then, an extended MABAC method is applied to rank candidate green suppliers with heterogeneous evaluation data. The flowchart of the proposed green supplier selection model is displayed in Figure 1.
For a green supplier selection problem, assume that there are m alternatives A i ( i = 1 , 2 , , m ) , n criteria C j ( j = 1 , 2 , , n ) and l decision-makers D M k ( k = 1 , 2 , , l ) . The heterogeneous performance evaluation matrix of alternative suppliers given by decision-maker D M k is denoted as P ^ k = [ p ^ i j k ] m × n , where p ^ i j k is the evaluation of supplier A i for criterion C j provided by decision-maker D M k . The evaluation value p ^ i j k is considered by four different forms of information in this study, i.e., real numbers (N1), interval numbers (N2), TFNs (N3), and LHFSs (N4). In general, the criterion C j is evaluated by using only one of the four distinct information forms. If j N 1 , then p ^ i j k = x i j k is expressed as a real number; if j N 2 , then p ^ i j k = [ a i j k L , a i j k U ] is expressed as an interval number; if j N 3 , then p ^ i j k = [ a i j k , b i j k , c i j k , d i j k ] is expressed as TFNs; if j N 4 , then p ^ i j k = { ( h a i j k , l h a i j k | h a i j k S ) } is expressed as LHFSs. The weight of criterion C j is given as w j , which satisfies w j > 0 and j = 1 n w j = 1 . Then, the proposed green supplier selection model is explained as below.
Step 1. Obtain the normalized heterogeneous evaluation matrixes
Generally, two types of criteria are included in the green supplier selection process, namely, benefit and cost criteria. Therefore, the heterogeneous evaluation matrixes P ^ k ( k = 1 , 2 , , l ) need to be normalized to establish the normalized heterogeneous evaluation matrixes P ¯ k = [ p ¯ i j k ] m × n ( k = 1 , 2 , , l ) , in which:
P ˜ i j k = { x i j k / x max j k i f   j N 1 B 1 x i j k / x max j k i f   j N 1 C [ a i j k L / a max j k U , a i j k U / a max j k U ] i f   j N 2 B [ 1 a i j k L / a max j k U , 1 a i j k U / a max j k U ] i f   j N 2 C ( a i j k / d max j k , b i j k / d max j k , c i j k / d max j k , d i j k / d max j k ) i f   j N 3 B ( 1 d i j k / d max j k , 1 c i j k / d max j k , 1 b i j k / d max j k , 1 a i j k / d max j k ) i f   j N 3 C { ( h a i j k , l h a i j k | h a i j k S ) } i f   j N 4 B ( h a i j k , l h a i j k ) p i j k { ( h ( 2 t + 1 ) f ( h a i j k ) , r i j k l h a i j k ( 1 r i j k ) | h a i j k S ) } i f   j N 4 C
where N q B ( q = 1 , 2 , 3 , 4 ) is a set of benefit criteria and N q C ( q = 1 , 2 , 3 , 4 ) is a set of cost criteria. Besides, x max j k = max i { x i j k } ( j N 1 , k l ) , a max j k U = max i { a i j k U } ( j N 2 , k l ) , and d max j k = max i { d i j k } ( j N 3 , k l ) .
Step 2. Calculate the weights of decision-makers using maximizing consensus approach
The maximizing consensus approach [44] can be used to calculate the weights of decision-makers based on incomplete weighting information. The basic idea of this method is to maximize the consensus level among the individual evaluation matrixes [45]. If the consensus of a decision-maker’s evaluation matrix is considerably greater than the consensus of other decision-makers’ evaluation matrixes, then the decision-maker should be assigned a bigger weight.
According to the maximizing consensus method, we can construct the following programming model for calculating the weights of decision-makers λ k ( k = 1 , 2 , , l ) :
max F ( λ k ) = k = 1 l ( 1 n × m × ( l 1 ) u = 1 , u k l i = 1 m j = 1 n ( 1 1 2 d ( p ¯ i j k , p ¯ i j u ) ) ) λ k s . t . { k = 1 l λ k = 1 , λ k W , λ k 0 .
where p ¯ i j k and p ¯ i j u are the elements of the normalized heterogeneous evaluation matrixes P ¯ k and P ¯ u , respectively, and W is the partial weight information given by decision-makers. Then, the solution set of the programming goal model is the relative weights of the l decision-makers.
Step 3. Rank alternative green suppliers by the MABAC method
In this step, the MABAC method is extended and utilized to derive the ranking of all the evaluation alternatives with heterogeneous information. The procedural steps of the MABAC approach are depicted as follows.
Step 3.1. Construct the collective heterogeneous evaluation matrix P ˜
Based on the weighted averaging operators of LHFSs, TFNs, interval numbers, and real numbers, we can aggregate the normalized heterogeneous evaluation matrixes P ¯ k ( k = 1 , 2 , , l ) to construct the collective heterogeneous evaluation matrix P ˜ = [ p ˜ i j ] m × n . For example, the collective evaluation values of LHFSs can be computed by
p ˜ i j = k = 1 l λ k p ¯ i j k .  
Step 3.2: Establish the weighted collective evaluation matrix P ^
Based on the weights of the evaluation criteria, the weighted collective evaluation matrix P ˜ = [ p ˜ i j ] m × n is established by
p ˜ i j = w j p ˜ i j .
Step 3.3: Derive the border approximation area vector G ˜
The border approximation area for the jth criterion can be determined through the following formula:
g ˜ j = i = 1 m ( p ˜ i j ) 1 / m ,   j = 1 , 2 , , n .
Based on the values g ˜ j ( j = 1 , 2 , , n ) of all the evaluation criteria, the border approximation area vector can be established as G ˜ = [ g ˜ 1 , g ˜ 2 , , g ˜ n ] .
Step 3.4: Establish the distance matrix D
By calculating the distance between each of the m alternatives and the border approximation area, we can obtain the distance matrix D = [ d i j ] m × n . That is,
d i j = { d ( p ˜ i j , g ˜ j ) i f         p ˜ i j g ˜ j , d ( p ˜ i j , g ˜ j ) i f         p ˜ i j < g ˜ j .
Based on the distances d i j , the belonging of alternative A i to the approximation area is obtained as below:
A i { G + i f         d i j > 0 , G i f         d i j = 0 , G i f         d i j < 0 .
Then, the area containing the ideal green suppliers ( A + ) is defined as the upper approximation area ( G + ), while the area containing the anti-ideal green suppliers ( A ) is defined as the lower approximation area ( G ) (see Figure 2).
Step 3.5: Determine the optimum green supplier
If the candidate green supplier A i belongs to G + , then it is close or equal to the ideal green supplier. In contrast, if the candidate green supplier A i belongs to G , it is close or equal to the anti-ideal green supplier. Thus, the values of the criteria functions for all the green suppliers can be computed by adding the distances between the candidate suppliers and the border approximation areas.
Through computing the sum of the row elements of the distance matrix D, the priority values of the alternative green suppliers can be obtained as:
P V i = j = 1 n d i j ,           i = 1 , 2 , , m .
The bigger the value of PVi, the better the green supplier Ai. Consequently, we can obtain the ranking of the considered m alternative green suppliers based on the descending order of their priority values P V i ( i = 1 , 2 , , m ) . The largest S i corresponds to the best green supplier.

4. Case Study

4.1. Implementation

In this section, the developed green supplier selection model is applied in an automobile manufacturing company located in Shanghai, China, to illustrate its applicability and efficacy. Under the green development concept, the company insisted on manufacturing green and environmentally friendly products. The transmission is one of the most important parts of a car, which affects its driving experience and fuel consumption. This company needs to select a suitable green supplier for purchasing transmissions to increase its economic and environmental performance.
In this case, five potential suppliers ( A i , i = 1 , 2 , , 5 ) were considered as alternatives for further assessment and selection. Three decision-makers ( D M k ,   k = 1 , 2 , 3 ) were invited to evaluate each green supplier with eight criteria ( C j , j = 1 , 2 , , 8 ) , including product quality (C1), technological level (C2), flexibility (C3), delivery time (C4), and price (C5), financial situation (C6), innovation ability (C7), and environmental performance (C8). Among them, criterion C5 is a cost criterion and the other seven criteria are benefit criteria. The linguistic term set S defined below is used for describing the evaluation information from decision-makers using LHFSs.
S = { s 1 = V e r y   p o o r , s 2 = P o o r , s 3 = S l i g h t l y   p o o r , s 4 = F a i r , s 5 = S l i g h t l y   g o o d , s 6 = G o o d , s 7 = V e r y   g o o d } .
The weight vector of the eight evaluation criteria is given as w = (0.1,0.2,0.1,0.1,0.15,0.15,0.1,0.1). To accurately and flexibly evaluate the alternative suppliers, four forms of information, including LHFSs, TFNs, interval numbers, and real numbers, were adopted to assess the candidate suppliers according to the characteristics of the eight evaluation criteria. Specifically, the evaluations of green suppliers on the three qualitative criteria C1, C3, and C8 are represented by LHFSs due to the uncertainty of the production process. For the criteria C2 and C7, the decision-makers tend to provide the lower and upper limits and the most possible values; thus, their assessments are represented by TFNs. Because C4 and C6 are quantitative criteria, we use interval numbers to express them. The assessments for the criterion C5 can be represented by real numbers. The heterogeneous evaluation information of candidate green suppliers from the three decision-makers is shown in Table 1.
In what follows, the sustainability ranking of the five green suppliers is determined with the aid of our proposed green supplier selection approach.
Step 1. According to the heterogeneous evaluation information of Table 1, the normalized heterogeneous evaluation matrices P ¯ k = [ p ¯ i j k ] 5 × 8 ( k = 1 , 2 , 3 ) are constructed using Equation (1) and represented in Table 2.
Step 2. In this case study, the information about decision-makers’ weights is assumed to be incompletely known, and the known weight information is given as: λ = { 0.25 λ 1 0.40 , 0.20 λ 2 0.35 , λ 3 λ 2 λ 1 } . Based on Equation (2), we can establish the following linear programming model:
max F ( λ k ) = 0.95 λ 1 + 0.94 λ 2 + 0.94 λ 3 s . t . { 0.25 λ 1 0.40 0.2 λ 2 0.35 λ 2 λ 1 λ 3 λ 2 λ 1 + λ 2 + λ 3 = 1
By solving the above model, the weight vector of the three decision-makers is obtained as λ = ( 0.4 , 0.3 , 0.3 ) .
Step 3. In this step, the alternative green suppliers are ranked by using the MABAC method.
Step 3.1. According to corresponding weighted averaging operators, the collective heterogeneous evaluation matrix P ˜ = [ p ˜ i j ] 5 × 8 is established as shown in Table 3.
Step 3.2. Using Equation (4), the weighted collective evaluation matrix P ˜ = [ p ˜ i j ] 5 × 8 is constructed and represented in Table 4.
Step 3.3. By Equation (5), the border approximation areas of the eight evaluation criteria are calculated to construct the border approximation area vector G ˜ as follows:
G ˜ = [ { ( S 0.40 , 0.084 , 0.088 , 0.091 , 0.094 ) , ( S 0.42 , 0.078 , 0.080 , 0.086 ) } , ( 0.130   0.163   0.178   0 . 190 ) ,   { ( S 0.406 , 0.068 , 0.700 , 0.073 , 0.076 , 0.078 , 0.079 , 0.081 ) } ,   [ 0.077   0.090 ] ,   0.000 ,   [ 0.130   0.144 ] ,   ( 0.043   0.055   0.066   0.077 ) ,     { ( S 0.410 , 0.058 , 0.063 , 0.066 ) , ( S 0.429 , 0.054 , 0.058 , 0.061 ) } ]
Step 3.4. The distances between the five green suppliers and the border approximation vector G ˜ are computed through Equation (6). Then, the distance matrix D = [ d i j ] 5 × 8 is established and displayed in Table 5.
Step 3.5. The priority value for each green supplier P V i ( 1 = 1 , 2 , 5 ) is obtained by using Equation (8). The computation results are also displayed in Table 5. Based on the descending sequence of the priority values P V i ( 1 = 1 , 2 , 5 ) , the ranking result of the five green suppliers is obtained as: A 5 > A 1 > A 4 > A 3 > A 2 . Thus, the green supplier A5 is the most desirable green supplier for the given case study.

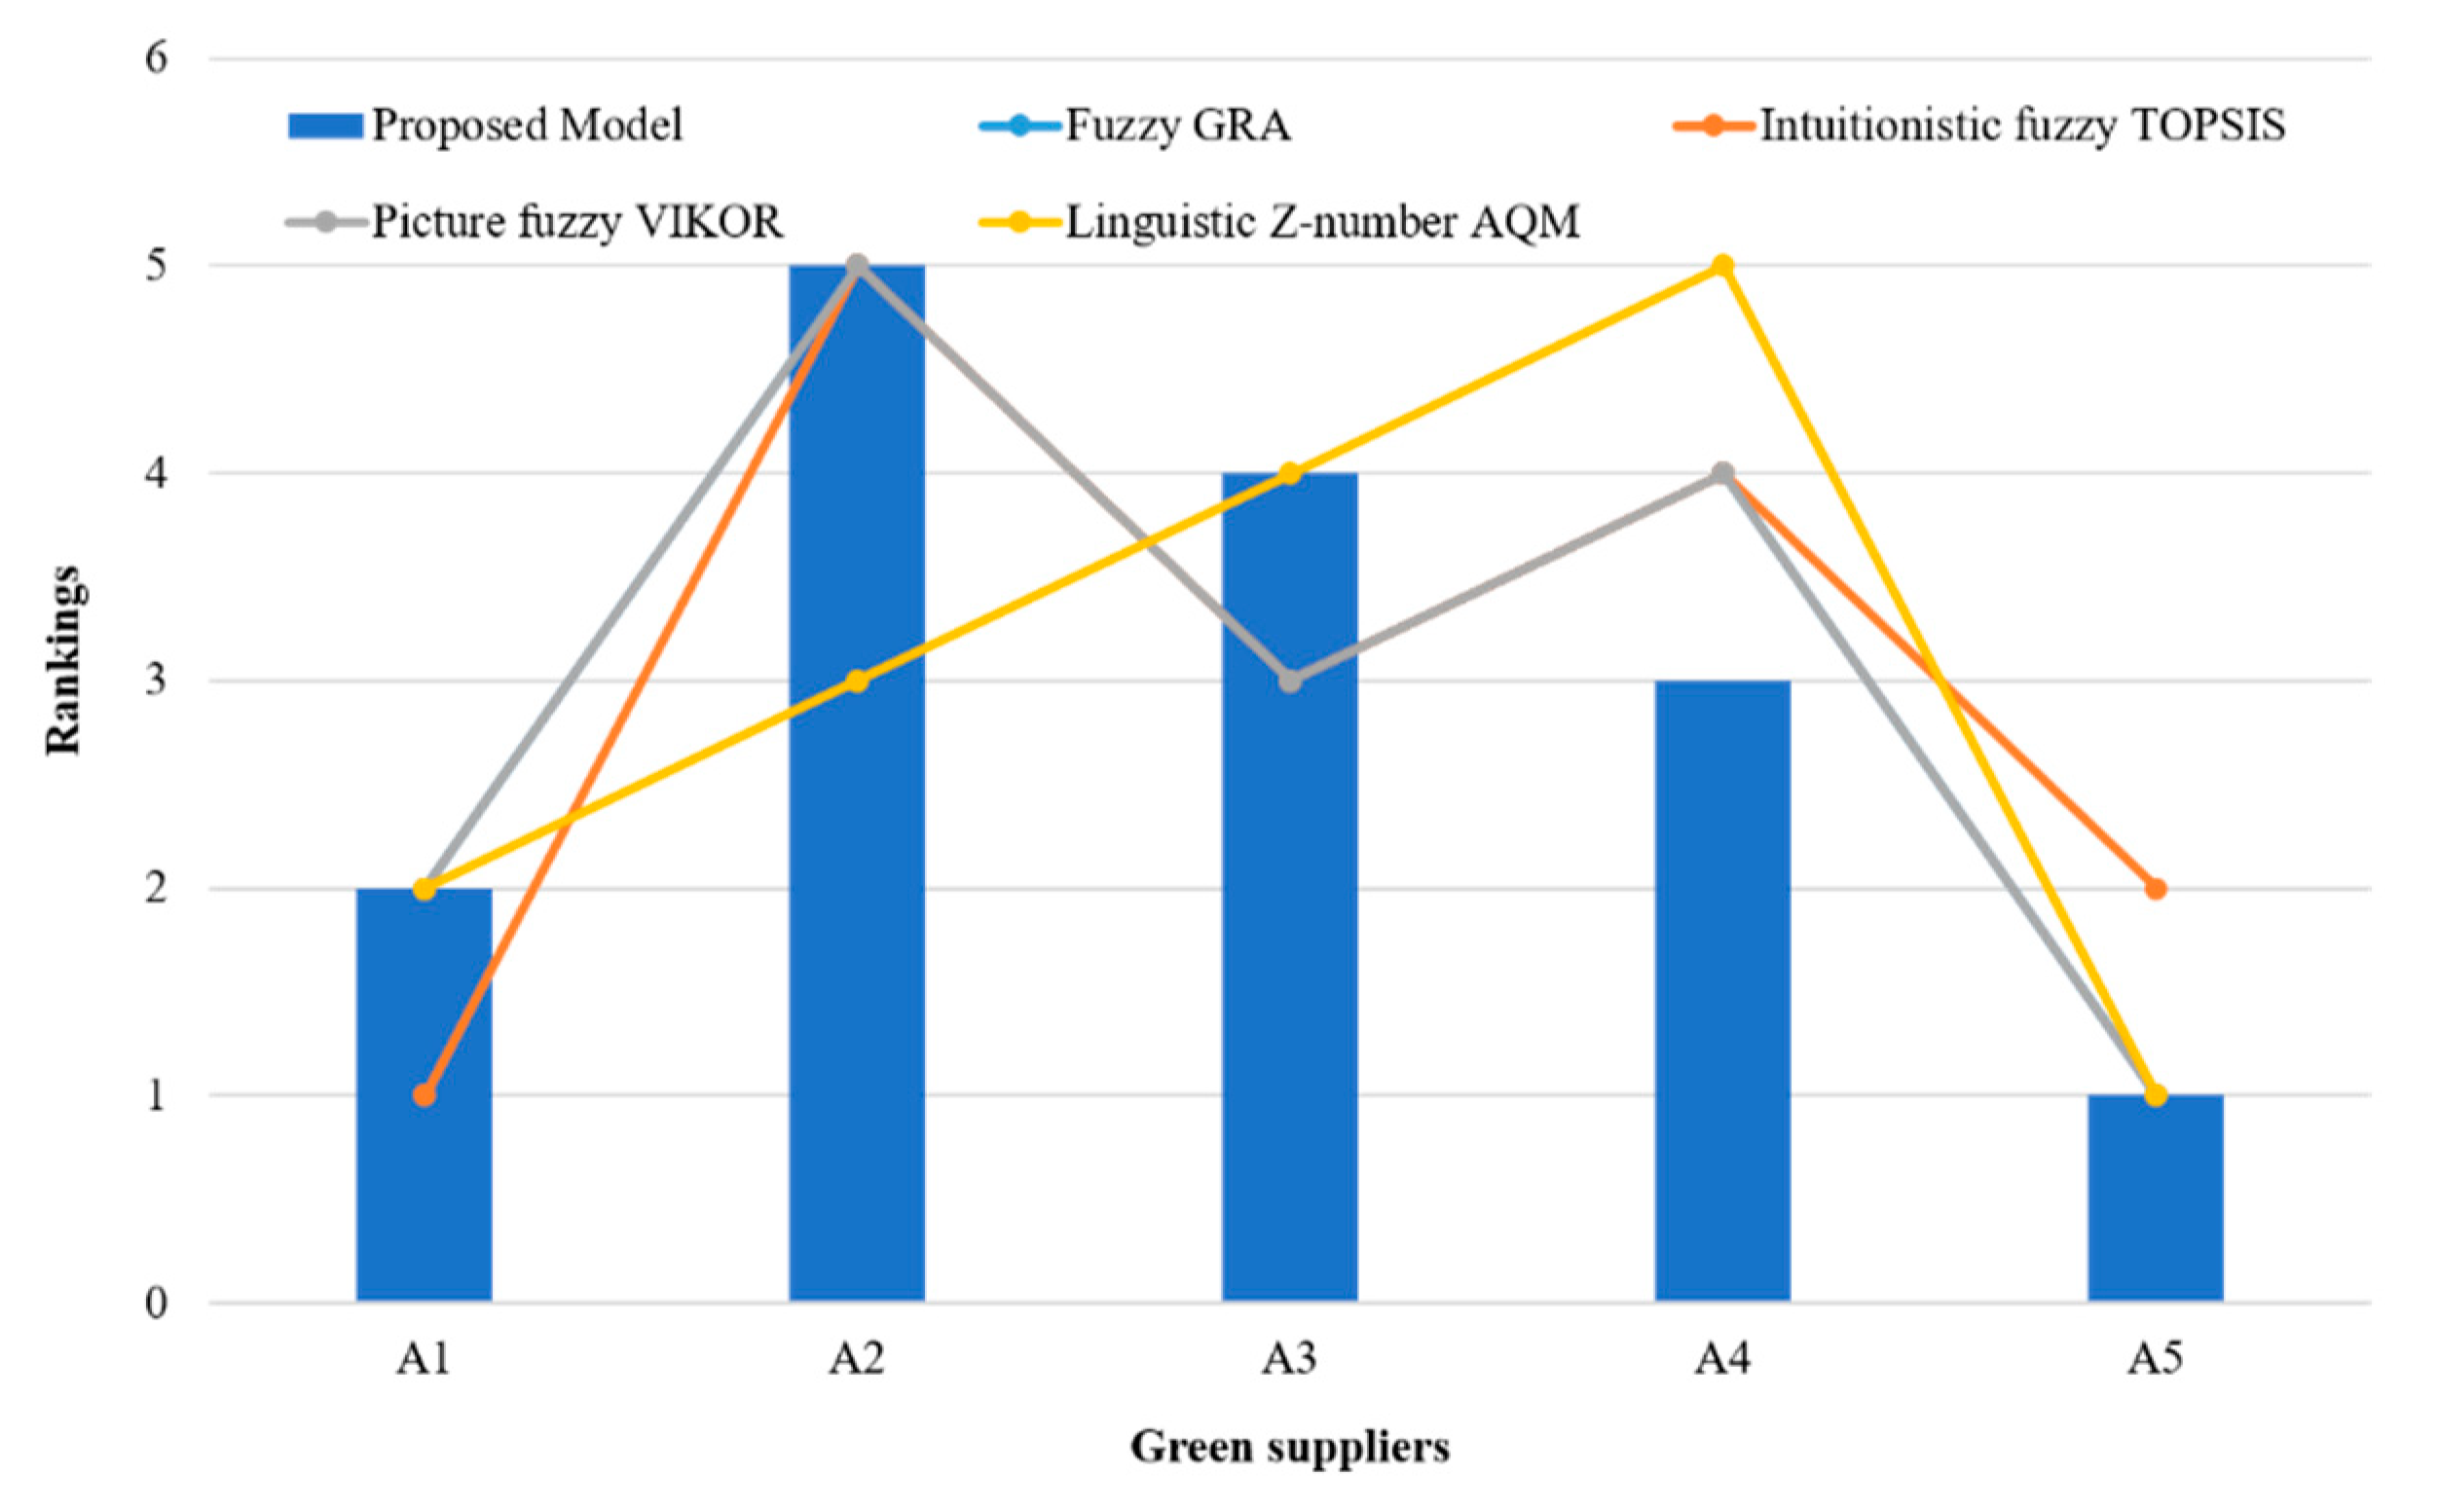
4.2. Comparisons and Discussion

To illustrate the effectiveness and usefulness of the proposed green supplier selection model, a comparison analysis with the fuzzy GRA [46], the intuitionistic fuzzy TOPSIS [43], the picture fuzzy VIKOR [42], and the linguistic Z-number AQM [13] methods is performed in this part. The sorting results of the five green suppliers obtained by the selected methods are shown in Figure 3.
As visualized in Figure 3, the top two green suppliers derived by the proposed model, the fuzzy GRA, the picture fuzzy VIKOR and the linguistic Z-number AQM are identical. Besides, the ranking order of A2 obtained by the proposed model, the fuzzy GRA, the intuitionistic fuzzy TOPSIS, and the picture fuzzy VIKOR are exactly the same. Therefore, the effectiveness of our developed model for dealing with the green supplier selection problem can be demonstrated.
On the other hand, there are some differences in the rankings derived by the proposed model and the four compared methods. By comparing with the fuzzy GRA and the picture fuzzy VIKOR, we can find that A4 is ranked before A3 in the proposed model; the fuzzy GRA and the picture fuzzy VIKOR give an opposite ranking. According to the proposed model, A4 ranks third and A2 ranks fifth; but the linguistic Z-number AQM gives an inverse result. What is more, the results obtained by the proposed model and the intuitionistic fuzzy TOPSIS are quite different. For the proposed model, the optimal green supplier is A5, while the best green supplier obtained by the intuitionistic fuzzy TOPSIS is A1. The reasons for the inconsistent ranking orders can be summarized below: Firstly, in the four listed methods, the alternative suppliers are evaluated by only one type of information, whereas the evaluations of green suppliers in our proposed model are described by different forms of information based on the characteristics of evaluation criteria. In addition, the proposed model adopted the LHFSs to express decision-makers’ hesitancy, inconsistency, and uncertainty in the supplier evaluation process. Secondly, the weights of decision-makers are not considered or given subjectively in the four compared methods. This may cause the loss of information in the aggregation process of decision-makers’ judgments. Thirdly, the priority determination mechanisms of the five methods are different. In the compared methods, the GRA, the TOPSIS, the VIKOR, and the AQM methods are used, respectively, for evaluating and selecting the best green supplier. In contrast, the MABAC method is modified to derive the ranking of the evaluation alternatives, which determines the ranking result of green suppliers through calculating the potential gains and losses values.
The comparative analysis above shows that a more accurate and reasonable ranking of green suppliers can be obtained by using the proposed green supplier selection model. To further verify the proposed approach, we gathered managers of the automobile manufacturing company to check the ranking results derived in this study. According to their opinions, the proposed model is highly suitable for the green supplier selection problem examined and can effectively determine the best supplier in the green supply chain.

5. Managerial Implications

This study has some managerial and theoretical implications for both researchers and practitioners in the field of GSCM. The empirical results of the case example by the proposed green supplier selection model are summarized in Table 5. These results give the priority values of the five considered suppliers, along with their respective rankings. Supplier A5 was ranked as the top supplier with a priority value of 0.132. Suppliers A1, A4, A3, and A4 follow, respectively. Even though A5 is selected as the optimal supplier amongst the candidate group, and is recommended for contracting by the automobile manufacturer, there are some evaluation criteria that had low ratings for the supplier. The results for the suppliers’ evaluation can be used by the company to improve the performance of their suppliers. The automobile manufacturer may require specific post-selection negotiations with the selected supplier for possible improvements in these lower-rated performance criteria using the other suppliers as benchmarks.
From the theoretical point of view, the green supplier selection model being developed in this study contributes the following advantages. First, the evaluation values on different criteria with different features are handled by heterogeneous information. This is more suitable to complex green supplier selection features and also allows decision-makers to express their judgments flexibly in the types of information they prefer. Second, a maximizing consensus approach based on an optimization model is proposed to determine the weight of each decision-maker. It can deal with the situations in which the information about expert weights is incompletely known a priori. Third, an extended MABAC method is employed to rank and select the most preferred green supplier. As depicted in the comparison analysis, the proposed green supplier selection approach does not require considerable computations but still yields a reasonable and credible solution result.

6. Conclusions

Adopting sustainable practices in supply chains for both focal companies and its suppliers has become a matter of growing concern in recent years. Thus, green supplier selection plays a pivotal role for organizations to maintain their strategic competitiveness. The present paper proposes a novel approach based on the MABAC method for managers to select suppliers within the heterogeneous information environment. In this model, the evaluation values of candidate suppliers with respect to different criteria were represented in four types of information, including LHFSs, TFNs, interval numbers, and real numbers. Then, the classical MABAC method was extended and integrated with the maximizing consensus approach to rank the candidate suppliers. To demonstrate the efficiency of our proposed green supplier selection model, an empirical example from the automobile industry was provided together with a comparison analysis with the extent methods. The results show that the underlying principle behind the proposed model is acceptable to the managers and decision-makers, which is more suitable to reflect the decision features and more in line with the expert’s preferences in the real sustainable supplier selection process.
Nonetheless, this study has some limitations that need to be addressed in future studies. First, precise weights are used to represent the relative importance of criteria in this study. However, in some situations, the weight elicitation is a hard task and imprecise information, such as weight intervals, fuzzy weights, or ordinal information, may be involved in the green suppler selection problem. Thus, it is suggested to evaluate criteria weights using heterogeneous information in future research. Second, the evaluation criteria are assumed to be independent in our proposed model. This is not always the case when solving with practical problems. Therefore, how to incorporate the relationships among criteria into the decision process of green supplier selection is another future research work. In addition, the developed green supplier selection model is only illustrated via an instance of the problem. For future research, a numerical experiment with a great number of instances could be carried out to future validate the applicability and effectiveness of the proposed green supplier selection method.

Author Contributions

The individual contribution and responsibilities of the authors were as follows: X.-G.X. and L.-J.Z. together designed the research; H.S. and H.-C.L. provided extensive advice throughout the study regarding the abstract, introduction, research design, research methodology, findings, and revised the manuscript. The discussion was a team task. All authors have read and approved the final manuscript.

Funding

This work was partially supported by the National Natural Science Foundation of China (Nos. 61773250 and 71701153) and the Shanghai Youth Top-Notch Talent Development Program.

Acknowledgments

The authors are very grateful to the editor and reviewers for their insightful and constructive comments and suggestions, which are very helpful in improving the quality of the paper.

Conflicts of Interest

The authors declare no conflict of interest.

References

  1. Mirzaee, H.; Naderi, B.; Pasandideh, S.H.R. A preemptive fuzzy goal programming model for generalized supplier selection and order allocation with incremental discount. Comput. Ind. Eng. 2018, 122, 292–302. [Google Scholar] [CrossRef]
  2. Chen, C.H. A new multi-criteria assessment model combining GRA techniques with intuitionistic fuzzy entropy-based TOPSIS method for sustainable building materials supplier selection. Sustainability 2019, 11, 2265. [Google Scholar] [CrossRef]
  3. Mishra, A.R.; Rani, P.; Pardasani, K.R.; Mardani, A. A novel hesitant fuzzy WASPAS method for assessment of green supplier problem based on exponential information measures. J. Clean. Prod. 2019, 238, 117901. [Google Scholar] [CrossRef]
  4. Wang, X.; Cai, J.; Xiao, J. A novel decision-making framework for sustainable supplier selection considering interaction among criteria with heterogeneous information. Sustainability 2019, 11, 2820. [Google Scholar] [CrossRef]
  5. Liu, A.; Xiao, Y.; Ji, X.; Wang, K.; Tsai, S.B.; Lu, H.; Cheng, J.; Lai, X.; Wang, J. A novel two-stage integrated model for supplier selection of green fresh product. Sustainability 2018, 10, 2371. [Google Scholar] [CrossRef]
  6. Quan, M.; Wang, Z.; Liu, H.; Shi, H. A hybrid MCDM approach for large group green supplier selection with uncertain linguistic information. IEEE Access 2018, 6, 50372–50383. [Google Scholar] [CrossRef]
  7. Wu, Q.; Zhou, L.; Chen, Y.; Chen, H. An integrated approach to green supplier selection based on the interval type-2 fuzzy best-worst and extended VIKOR methods. Inf. Sci. 2019, 502, 394–417. [Google Scholar] [CrossRef]
  8. Van, L.H.; Yu, V.F.; Dat, L.Q.; Dung, C.C.; Chou, S.Y.; Loc, N.V. New integrated quality function deployment approach based on interval neutrosophic set for green supplier evaluation and selection. Sustainability 2018, 10, 838. [Google Scholar] [CrossRef]
  9. Shi, H.; Quan, M.Y.; Liu, H.C.; Duan, C.Y. A novel integrated approach for green supplier selection with interval-valued intuitionistic uncertain linguistic information: A case study in the agri-food industry. Sustainability 2018, 10, 733. [Google Scholar] [CrossRef]
  10. Bai, C.; Kusi-Sarpong, S.; Badri Ahmadi, H.; Sarkis, J. Social sustainable supplier evaluation and selection: A group decision-support approach. Int. J. Prod. Res. 2019, 57, 7046–7067. [Google Scholar] [CrossRef]
  11. Awasthi, A.; Govindan, K.; Gold, S. Multi-tier sustainable global supplier selection using a fuzzy AHP-VIKOR based approach. Int. J. Prod. Econ. 2018, 195, 106–117. [Google Scholar] [CrossRef]
  12. Dos Santos, B.M.; Godoy, L.P.; Campos, L.M.S. Performance evaluation of green suppliers using entropy-TOPSIS-F. J. Clean. Prod. 2019, 207, 498–509. [Google Scholar] [CrossRef]
  13. Duan, C.Y.; Liu, H.C.; Zhang, L.J.; Shi, H. An extended alternative queuing method with linguistic Z-numbers and its application for green supplier selection and order allocation. Int. J. Fuzzy Syst. 2019, 21, 2510–2523. [Google Scholar] [CrossRef]
  14. Li, J.; Fang, H.; Song, W. Sustainable supplier selection based on SSCM practices: A rough cloud TOPSIS approach. J. Clean. Prod. 2019, 222, 606–621. [Google Scholar] [CrossRef]
  15. Mao, R.J.; You, J.X.; Duan, C.Y.; Shao, L.N. A heterogeneous MCDM framework for sustainable supplier evaluation and selection based on the IVIF-TODIM method. Sustainability 2019, 11, 5057. [Google Scholar] [CrossRef]
  16. Meng, F.; Chen, X.; Zhang, Q. Multi-attribute decision analysis under a linguistic hesitant fuzzy environment. Inf. Sci. 2014, 267, 287–305. [Google Scholar] [CrossRef]
  17. Yuan, J.; Li, C.; Li, W.; Liu, D.; Li, X. Linguistic hesitant fuzzy multi-criterion decision-making for renewable energy: A case study in Jilin. J. Clean. Prod. 2018, 172, 3201–3214. [Google Scholar] [CrossRef]
  18. Krishankumar, R.; Ravichandran, K.S.; Premaladha, J.; Kar, S.; Zavadskas, E.K.; Antucheviciene, J. A decision framework under a linguistic hesitant fuzzy set for solving multi-criteria group decision making problems. Sustainability 2018, 10, 2608. [Google Scholar] [CrossRef]
  19. Dong, J.Y.; Yuan, F.F.; Wan, S.P. Extended VIKOR method for multiple criteria decision-making with linguistic hesitant fuzzy information. Comput. Ind. Eng. 2017, 112, 305–319. [Google Scholar] [CrossRef]
  20. Liu, H.C.; Quan, M.Y.; Li, Z.; Wang, Z.L. A new integrated MCDM model for sustainable supplier selection under interval-valued intuitionistic uncertain linguistic environment. Inf. Sci. 2019, 486, 254–270. [Google Scholar] [CrossRef]
  21. Phochanikorn, P.; Tan, C. An integrated multi-criteria decision-making model based on prospect theory for green supplier selection under uncertain environment: A case study of the Thailand palm oil products industry. Sustainability 2019, 11, 1872. [Google Scholar] [CrossRef]
  22. Lu, H.; Jiang, S.; Song, W.; Ming, X. A rough multi-criteria decision-making approach for sustainable supplier selection under vague environment. Sustainability 2018, 10, 2622. [Google Scholar] [CrossRef]
  23. Pamučar, D.; Ćirović, G. The selection of transport and handling resources in logistics centers using Multi-Attributive Border Approximation area Comparison (MABAC). Expert Syst. Appl. 2015, 42, 3016–3028. [Google Scholar] [CrossRef]
  24. Liang, R.X.; He, S.S.; Wang, J.Q.; Chen, K.; Li, L. An extended MABAC method for multi-criteria group decision-making problems based on correlative inputs of intuitionistic fuzzy information. Comput. Appl. Math. 2019, 38, 112. [Google Scholar] [CrossRef]
  25. Xue, Y.X.; You, J.X.; Lai, X.D.; Liu, H.C. An interval-valued intuitionistic fuzzy MABAC approach for material selection with incomplete weight information. Appl. Soft Comput. 2016, 38, 703–713. [Google Scholar] [CrossRef]
  26. Pamučar, D.; Stević, Ž.; Zavadskas, E.K. Integration of interval rough AHP and interval rough MABAC methods for evaluating university web pages. Appl. Soft Comput. J. 2018, 67, 141–163. [Google Scholar] [CrossRef]
  27. Pamucar, D.; Chatterjee, K.; Zavadskas, E.K. Assessment of third-party logistics provider using multi-criteria decision-making approach based on interval rough numbers. Comput. Ind. Eng. 2019, 127, 383–407. [Google Scholar] [CrossRef]
  28. Wang, H.; Jiang, Z.; Zhang, H.; Wang, Y.; Yang, Y.; Li, Y. An integrated MCDM approach considering demands-matching for reverse logistics. J. Clean. Prod. 2019, 208, 199–210. [Google Scholar] [CrossRef]
  29. Yazdani, M.; Pamucar, D.; Chatterjee, P.; Chakraborty, S. Development of a decision support framework for sustainable freight transport system evaluation using rough numbers. Int. J. Prod. Res. 2019. [Google Scholar] [CrossRef]
  30. Liu, H.C.; You, J.X.; Duan, C.Y. An integrated approach for failure mode and effect analysis under interval-valued intuitionistic fuzzy environment. Int. J. Prod. Econ. 2019, 207, 163–172. [Google Scholar] [CrossRef]
  31. Mahmoudi, M.; Amoozad Mahdiraji, H.; Jafarnejad, A.; Safari, H. Dynamic prioritization of equipment and critical failure modes: An interval-valued intuitionistic fuzzy condition-based model. Kybernetes 2019, 48, 1913–1941. [Google Scholar] [CrossRef]
  32. Adar, T.; Delice, E.K. New integrated approaches based on MC-HFLTS for healthcare waste treatment technology selection. J. Enterp. Inf. Manag. 2019, 32, 688–711. [Google Scholar] [CrossRef]
  33. Shi, H.; Liu, H.C.; Li, P.; Xu, X.G. An integrated decision making approach for assessing healthcare waste treatment technologies from a multiple stakeholder. Waste Manag. 2017, 59, 508–517. [Google Scholar] [CrossRef] [PubMed]
  34. Luo, S.Z.; Liang, W.Z. Optimization of roadway support schemes with likelihood-based MABAC method. Appl. Soft Comput. 2019, 80, 80–92. [Google Scholar] [CrossRef]
  35. Dubois, D.; Prade, H. Operations on fuzzy numbers. Int. J. Syst. Sci. 1978, 9, 613–626. [Google Scholar] [CrossRef]
  36. Yue, Z. An extended TOPSIS for determining weights of decision makers with interval numbers. Knowl. Based Syst. 2011, 24, 146–153. [Google Scholar] [CrossRef]
  37. Alikhani, R.; Torabi, S.A.; Altay, N. Strategic supplier selection under sustainability and risk criteria. Int. J. Prod. Econ. 2019, 208, 69–82. [Google Scholar] [CrossRef] [Green Version]
  38. Haeri, S.A.S.; Rezaei, J. A grey-based green supplier selection model for uncertain environments. J. Clean. Prod. 2019, 221, 768–784. [Google Scholar] [CrossRef]
  39. Guarnieri, P.; Trojan, F. Decision making on supplier selection based on social, ethical, and environmental criteria: A study in the textile industry. Resour. Conserv. Recycl. 2019, 141, 347–361. [Google Scholar] [CrossRef]
  40. Lu, Z.; Sun, X.; Wang, Y.; Xu, C. Green supplier selection in straw biomass industry based on cloud model and possibility degree. J. Clean. Prod. 2019, 209, 995–1005. [Google Scholar] [CrossRef]
  41. Liang, Y.; Liu, J.; Qin, J.; Tu, Y. An improved multi-granularity interval 2-tuple TODIM approach and its application to green supplier selection. Int. J. Fuzzy Syst. 2019, 21, 129–144. [Google Scholar] [CrossRef]
  42. Meksavang, P.; Shi, H.; Lin, S.M.; Liu, H.C. An extended picture fuzzy VIKOR approach for sustainable supplier management and its application in the beef industry. Symmetry 2019, 11, 468. [Google Scholar] [CrossRef] [Green Version]
  43. Memari, A.; Dargi, A.; Akbari Jokar, M.R.; Ahmad, R.; Abdul Rahim, A.R. Sustainable supplier selection: A multi-criteria intuitionistic fuzzy TOPSIS method. J. Manuf. Syst. 2019, 50, 9–24. [Google Scholar] [CrossRef]
  44. Xu, J.; Wu, Z. A maximizing consensus approach for alternative selection based on uncertain linguistic preference relations. Comput. Ind. Eng. 2013, 64, 999–1008. [Google Scholar] [CrossRef]
  45. Zhang, X.; Xu, Z. Soft computing based on maximizing consensus and fuzzy TOPSIS approach to interval-valued intuitionistic fuzzy group decision making. Appl. Soft Comput. 2015, 26, 42–56. [Google Scholar] [CrossRef]
  46. Banaeian, N.; Mobli, H.; Fahimnia, B.; Nielsen, I.E.; Omid, M. Green supplier selection using fuzzy group decision making methods: A case study from the agri-food industry. Comput. Oper. Res. 2018, 89, 337–347. [Google Scholar] [CrossRef]
Figure 1. Flowchart of the proposed green supplier selection model.
Sustainability 11 06616 g001
Figure 2. Upper (G+), lower (G) and border (G) approximation areas.
Sustainability 11 06616 g002
Figure 3. Ranking result of green suppliers by different methods. Note: Abbreviations are defined in Section 2.
Sustainability 11 06616 g003
Table 1. Heterogeneous evaluation of green suppliers given by decision-makers.
Decision-MakersCriteriaGreen Suppliers
A1A2A3A4A5
DM1 C1 { ( S 4 , 0.5 ) , ( S 5 , 0.3 ) } { ( S 6 , 0.4 , 0.6 ) } { ( S 5 , 0.6 ) } { ( S 2 , 0.6 ) , ( S 3 , 0.5 ) } { ( S 3 , 0.7 ) }
C2(70,90,91,92)(30,80,85,90)(50,60,75,85)(75,80,85,95)(80,85,90,95)
C3 { ( S 4 , 0.7 ) } { ( S 5 , 0.6 ) } { ( S 4 , 0.3 , 0.7 ) } { ( S 5 , 0.4 ) } { ( S 3 , 0.2 , 0.5 ) }
C4[65,88][87,90][45,58][70,90][92,95]
C5118116120115110
C6[0.81,0.90][0.76,0.83][0.74,0.85][0.74,0.82][0.79,0.85]
C7(3,4,5,6)(6,7,8,9)(5,6,7,8)(1,2,3,4)(5,6,7,8)
C8 { ( S 4 , 0.6 ) , ( S 5 , 0.4 ) } { ( S 4 , 0.3 ) } { ( S 3 , 0.4 , 0.6 ) } { ( S 4 , 0.3 ) } { ( S 5 , 0.6 ) , ( S 6 , 0.4 ) }
DM2C1 { ( S 5 , 0.8 ) } { ( S 3 , 0.6 ) , ( S 4 , 0.3 ) } { ( S 4 , 0.7 ) } { ( S 2 , 0.4 , 0.6 ) } { ( S 6 , 0.8 ) }
C2(80,85,90,95)(50,60,75,85)(30,80,85,90)(75,80,85,95)(70,90,91,92)
C3 { ( S 3 , 0.6 ) } { ( S 4 , 0.3 , 0.5 ) } { ( S 2 , 0.4 ) } { ( S 5 , 0.6 , 0.8 ) } { ( S 6 , 0.8 ) }
C4[75,88][87,90][45,58][66,87][89,95]
C5118116120115110
C6[0.78,0.86][0.74,0.82][0.72,0.83][0.76,0.81][0.78,0.85]
C7(5,6,7,8)(2,3,4,5)(3,4,5,6)(2,3,4,5)(6,7,8,9)
C8 { ( S 5 , 0.6 ) } { ( S 4 , 0.5 ) , ( S 5 , 0.4 ) } { ( S 4 , 0.3 ) } { ( S 3 , 0.3 ) } { ( S 6 , 0.7 ) }
DM3C1 { ( S 5 , 0.3 , 0.6 ) } { ( S 4 , 0.4 ) } { ( S 4 , 0.8 ) } { ( S 5 , 0.5 ) , ( S 6 , 0.2 ) } { ( S 3 , 0.4 ) }
C2(72,80,90,95)(50,60,75,85)(74,80,82,85)(65,70,78,81)(82,84,89,92)
C3 { ( S 4 , 0.3 ) } { ( S 4 , 0.2 ) } { ( S 5 , 0.4 ) } { ( S 4 , 0.8 ) } { ( S 3 , 0.7 ) }
C4[75,89][82,90][78,86][66,78][65,90]
C5118116120115110
C6[0.79,0.88][0.76,0.85][0.73,0.84][0.75,0.82][0.80,0.86]
C7(5,6,7,8)(3,5,6,7)(4,5,6,7)(4,5,6,7)(6,7,8,9)
C8 { ( S 6 , 0.4 ) } { ( S 4 , 0.3 , 0.6 ) } { ( S 3 , 0.4 ) } { ( S 3 , 0.5 ) } { ( S 5 , 0.6 ) }
Table 2. Normalized heterogeneous evaluation of green suppliers.
Decision-MakersCriteriaGreen Suppliers
A1A2A3A4A5
DM1 C1 { ( S 4 , 0.5 ) , ( S 5 , 0.3 ) } { ( S 6 , 0.4 , 0.6 ) } { ( S 5 , 0.6 ) } { ( S 2 , 0.6 ) , ( S 3 , 0.5 ) } { ( S 3 , 0.7 ) }
C2(0.74,0.95,0.96,0.97)(0.32,0.84,0.90,0.95)(0.53,0.63,0.79,0.90)(0.79,0.84,0.90,1.00)(0.84,0.90,0.95,1.00)
C3 { ( S 4 , 0.7 ) } { ( S 5 , 0.6 ) } { ( S 4 , 0.3 , 0.7 ) } { ( S 5 , 0.4 ) } { ( S 3 , 0.2 , 0.5 ) }
C4[0.68,0.93][0.92,0.95][0.47,0.61][0.74,0.95][0.97,1.00]
C50.020.030.000.040.08
C6[0.90,1.00][0.84,0.92][0.82,0.94][0.82,0.91][0.88,0.94]
C7(0.33,0.44,0.56,0.67)(0.67,0.78,0.89,1.00)(0.56,0.67,0.78,0.89)(0.11,0.33,0.33,0.44)(0.56,0.67,0.78,0.89)
C8 { ( S 4 , 0.6 ) , ( S 5 , 0.4 ) } { ( S 4 , 0.3 ) } { ( S 3 , 0.4 , 0.6 ) } { ( S 4 , 0.3 ) } { ( S 5 , 0.6 ) , ( S 6 , 0.4 ) }
DM2C1 { ( S 5 , 0.8 ) } { ( S 3 , 0.6 ) , ( S 4 , 0.3 ) } { ( S 4 , 0.7 ) } { ( S 2 , 0.4 , 0.6 ) } { ( S 6 , 0.8 ) }
C2(0.84,0.90,0.95,1.00)(0.53,0.63,0.79,0.90)(0.32,0.84,0.90,0.95)(0.79,0.84,0.90,1.00)(0.84,0.90,0.95,1.00)
C3 { ( S 3 , 0.6 ) } { ( S 4 , 0.3 , 0.5 ) } { ( S 2 , 0.4 ) } { ( S 5 , 0.6 , 0.8 ) } { ( S 6 , 0.8 ) }
C4[0.79,0.93][0.92,0.95][0.47,0.61][0.69,0.92][0.94,1.00]
C50.020.030.000.040.08
C6[0.91,1.00][0.86,0.95][0.84,0.97][0.88,0.94][0.91,0.99]
C7(0.56,0.67,0.78,0.89)(0.22,0.33,0.44,0.56)(0.33,0.44,0.56,0.67)(0.22,0.33,0.44,0.56)(0.67,0.78,0.89,1.00)
C8 { ( S 5 , 0.6 ) } { ( S 4 , 0.5 ) , ( S 5 , 0.4 ) } { ( S 4 , 0.3 ) } { ( S 3 , 0.3 ) } { ( S 6 , 0.7 ) }
DM3C1 { ( S 5 , 0.3 , 0.6 ) } { ( S 4 , 0.4 ) } { ( S 4 , 0.8 ) } { ( S 5 , 0.5 ) } { ( S 3 , 0.4 ) }
C2(0.76,0.84,0.95,1.00)(0.53,0.63,0.79,0.89)(0.78,0.84,0.86,0.89)(0.68,0.74,0.82,0.85)(0.86,0.88,0.94,0.97)
C3 { ( S 4 , 0.3 ) } { ( S 4 , 0.2 ) } { ( S 5 , 0.4 ) } { ( S 4 , 0.8 ) } { ( S 3 , 0.7 ) }
C4[0.83,0.99][0.91,1.00][0.87,0.96][0.73,0.87][0.72,1.00]
C50.020.030.000.040.08
C6[0.90,1.00][0.86,0.97][0.83,0.95][0.85,0.93][0.91,0.98]
C7(0.56,0.67,0.78,0.89)(0.33,0.56,0.67,0.78)(0.44,0.56,0.67,0.78)(0.44,0.56,0.67,0.78)(0.67,0.78,0.89,1.00)
C8 { ( S 6 , 0.4 ) } { ( S 4 , 0.3 , 0.6 ) } { ( S 3 , 0.4 ) } { ( S 3 , 0.5 ) } { ( S 5 , 0.6 ) }
Table 3. Collective heterogeneous evaluation matrix.
CriteriaGreen Suppliers
A1A2A3A4A5
C1 { ( S 4.60 , 0.58 , 0.64 ) , ( S 5 , 0.52 , 0.59 ) } { ( S 4.5 , 0.47 , 0.55 ) , ( S 4.8 , 0.37 , 0.47 ) } { ( S 4.4 , 0.70 ) } { ( S 2.90 , 0.52 , 0.57 ) , ( S 3.3 , 0.47 , 0.53 ) } { ( S 3.9 , 0.67 ) }
C2(0.77,0.90,0.95,0.99)(0.44,0.72,0.83,0.92)(0.54,0.76,0.84,0.91)(0.76,0.81,0.87,0.96)(0.82,0.91,0.95,0.98)
C3 { ( S 3.7 , 0.58 ) } { ( S 4.4 , 0.42 , 0.47 ) } { ( S 3.7 , 0.36 , 0.55 ) } { ( S 4.7 , 0.59 ) } { ( S 3.9 , 0.61 , 0.67 ) }
C4[0.76,0.95][0.91,0.96][0.59,0.71][0.72,0.91][0.89,1.00]
C50.0200.0300.0000.0400.080
C6[0.90,1.00][0.86,0.94][0.83,0.95][0.85,0.93][0.90,0.97]
C7(0.47,0.58,0.69,0.80)(0.43,0.58,0.69,0.80)(0.46,0.57,0.68,0.79)(0.24,0.36,0.47,0.58)(0.62,0.73,0.84,0.96)
C8 { ( S 4.9 , 0.53 ) , ( S 5.3 , 0.47 ) } { ( S 4.0 , 0.37 , 0.49 ) , ( S 4.3 , 0.33 , 0.47 ) } { ( S 3.3 , 0.37 , 0.44 ) } { ( S 3.4 , 0.39 ) } { ( S 5.3 , 0.63 ) , ( S 5.7 , 0.59 ) }
Table 4. Weighted collective evaluation matrix.
CriteriaGreen Suppliers
A1A2A3A4A5
C1 { ( S 0.46 , 0.083 , 0.098 ) ,     ( S 0.5 , 0.071 , 0.086 ) } { ( S 0.45 , 0.061 , 0.076 ) ,     ( S 0.48 , 0.045 , 0.061 ) } { ( S 0.44 , 0.114 ) } { ( S 0.29 , 0.070 , 0.081 ) ,     ( S 0.33 , 0.062 , 0.073 ) } { ( S 0.39 , 0.106 ) }
C2(0.155,0.180,0.190,0.197)(0.088,0.143,0.166,0.183)(0.108,0.152,0.169,0.182)(0.152,0.162,0.175,0.191)(0.163,0.181,0.189,0.196)
C3 { ( S 0.37 , 0.083 ) } { ( S 0.44 , 0.053 , 0.062 ) } { ( S 0.37 , 0.044 , 0.076 ) } { ( S 0.47 , 0.086 ) } { ( S 0.39 , 0.089 , 0.106 ) }
C4[0.076,0.095][0.091,0.096][0.059,0.071][0.072,0.091][0.089,0.100]
C50.0030.0050.0000.0060.012
C6[0.135,0.150][0.128,0.142][0.124,0.143][0.127,0.139][0.134,0.145]
C7(0.047,0.058,0.069,0.080)(0.043,0.058,0.069,0.080)(0.046,0.057,0.068,0.079)(0.024,0.036,0.047,0.058)(0.062,0.073,0.084,0.096)
C8 { ( S 0.49 , 0.073 ) , ( S 0.53 , 0.061 ) } { ( S 0.40 , 0.045 , 0.066 ) , ( S 0.43 , 0.039 , 0.061 ) } { ( S 0.33 , 0.045 , 0.057 ) } { ( S 0.34 , 0.048 ) } { ( S 0.53 , 0.095 ) , ( S 0.57 , 0.084 ) }
Table 5. Distance matrix D and the ranking of green suppliers.
Green SuppliersC1C2C3C4C5C6C7C8PViRanking
A10.0080.0170.024−0.0030.0030.0060.0030.0180.0762
A20.004−0.024−0.0190.0110.005−0.0020.002−0.002−0.0255
A30.035−0.014−0.017−0.0180.000−0.0040.002−0.002−0.0164
A4−0.0010.0110.033−0.0030.006−0.004−0.019−0.0040.0173
A50.0260.0200.0130.0110.0120.0030.0190.0290.1321

