Efficiency Analysis of Zinc Refining Companies


Abstract
1. Introduction
2. DEA Model
3. Data Collection and Variable Selection
3.1. Data
3.2. Variable Selection
3.3. DEA Models
3.4. Regression Model
3.5. Propensity Scores
4. Results
4.1. Efficiency Scores
4.2. Propagation of Knowledge from the Primary to the Secondary Level Refineries
4.2.1. Efficiency
4.2.2. Bonus Zn
4.2.3. Location
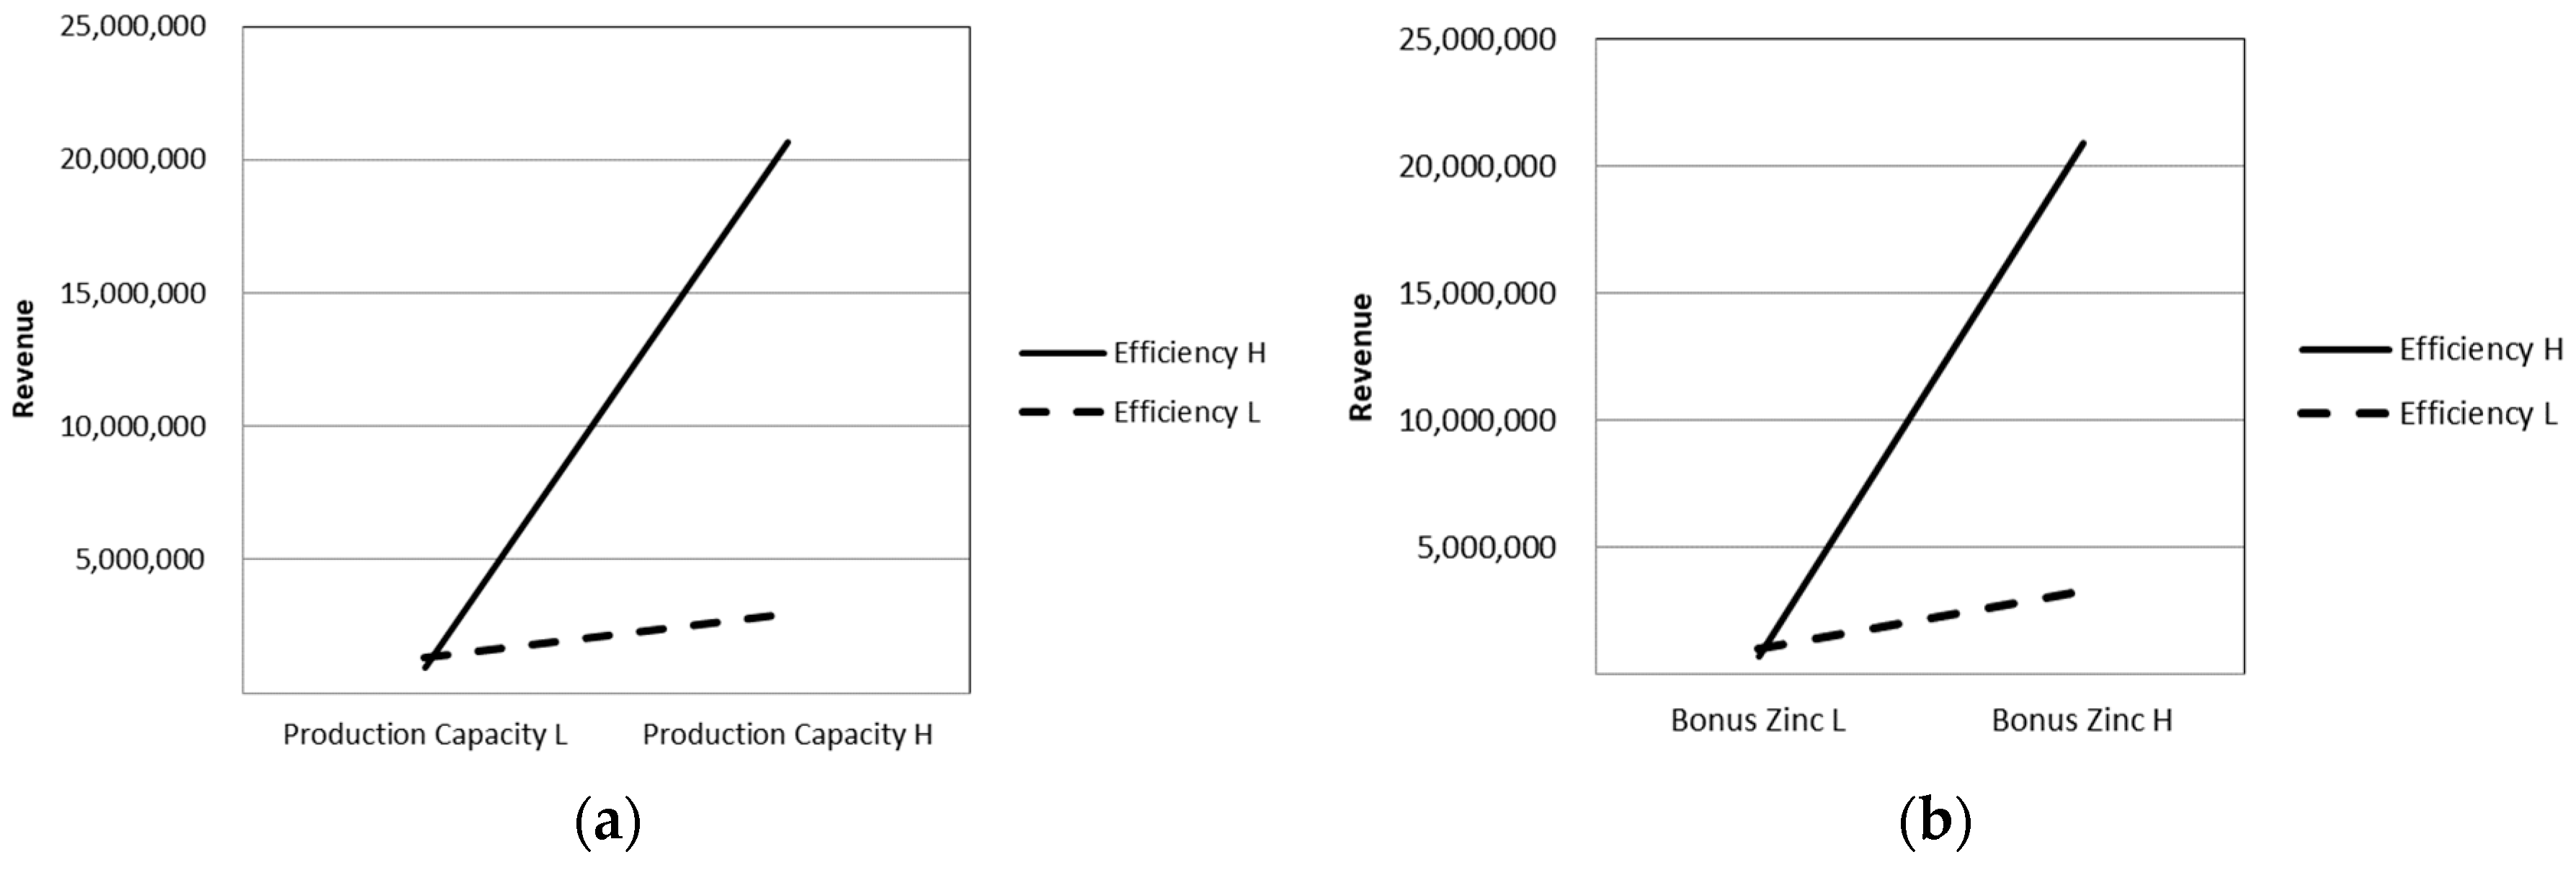
4.3. Relationship between Revenue and Efficiency with Respect to Production Capacity or Bonus Zn
5. Conclusions
Author Contributions
Funding
Conflicts of Interest
References
- Kim, D.H. 2016 Industry Risk Rating—Nonferrous Metal. Available online: http://www.nicerating.com/common/pdfViewer.do?docId=1L5TH2jcsqQ (accessed on 16 November 2018).
- Yun, J.J. How do we conquer the growth limits of capitalism? Schumpeterian Dynamics of Open Innovation. J. Open Innov. Technol. Mark. Complex. 2015, 1, 17–20. [Google Scholar] [CrossRef]
- Park, H.S.; Kim, D.C. Efficiency Analysis of East Asian Zinc Smelters and Effects of Capacity and Bonus Zn on Efficiency. J. Open Innov. Technol. Mark. Complex. 2019, 5, 4. [Google Scholar] [CrossRef]
- Borza, M. The Connection between Efficiency and Sustainability—A Theoretical Approach. Procedia Econ. Finance 2014, 15, 1355–1363. [Google Scholar] [CrossRef]
- Carley, M.; Spapens, P. Condividere il Mondo: Equità e Sviluppo Sostenibile nel Ventunesimo Secolo; Edizione Ambiente: Milano, Italy, 1999; p. 90. [Google Scholar]
- Ehrenfeld, J.R. Eco-efficiency: Philosophy, Theory, and Tools. J. Ind. Ecol. 2005, 9, 6–8. [Google Scholar] [CrossRef]
- Yadong, Y. Eco-efficiency trends in China, 1978–2010: Decoupling environmental pressure from economic growth. Ecol. Indic. 2013, 24, 177–184. [Google Scholar]
- Lee, H.S.; Kim, K.S. Measuring efficiency of Korean steel industry employing DEA. J. Korea Contents Assoc. 2007, 7, 195–205. [Google Scholar] [CrossRef]
- Cho, B.; Bae, G.H. Efficiency and Total Factor Productivity of North-East Asian Countries’ Steel Industries; The Northeast Asia Economic Association of Korea: Seoul, Korea, 2008; Vol. 20, pp. 1–24. [Google Scholar]
- Shin, Y.S. The efficiency analysis of export-oriented steel companies using DEA model. J. Int. Trade Commer. 2012, 8, 119–137. [Google Scholar] [CrossRef]
- Choi, S.B.; Ha, G.R. A study on the management efficiency with technological innovation factors: An comparative analysis of Korean, Japanese and Chinese steel industry firms. KJBA 2013, 26, 1887–1908. [Google Scholar]
- Debbath, R.M.; Sebastian, V.J. Efficiency in the Indian iron and steel industry—An application of data envelopment analysis. JAMR 2014, 11, 4–19. [Google Scholar]
- Suh, E.K.; Lee, S.C.; Koo, J. The Strategic M&A Approach based on the Leading SME (Small-Medium Enterprise)’s PMI (Post-Merger Integration) Failure Case. J. Strateg. Manag. 2014, 17, 51–69. [Google Scholar]
- Chang, Y.K.; Song, I.M. An Empirical Study of Merger Motives in Korea. Korean Manag. Rev. 1991, 20, 1–37. [Google Scholar]
- Kim, K.Y.; Cho, H.S. An Empirical Study on the Corporate Merger Effects in Korea. Korean J. Financ. Stud. 1996, 19, 1–26. [Google Scholar]
- Rhee, Y.P. Post Merger Integration Key Success Factor: PEF (Private Equity Fund) Cross border M&A Cases. Korean Manag. Cons. Rev. 2016, 16, 203–212. [Google Scholar]
- Cusatis, P. Why can’t we predict Merger and Acquisition Success? An Analysis and Preliminary Test of a New Approach. SBEJ 2009, 32, 79–112. [Google Scholar]
- Kowalska-Styczeń, A.; Malarz, K.; Paradowski, K. Model of Knowledge Transfer Within an Organisation. J. Artif. Soc. Soc. Simul. 2018, 21, 1–28. [Google Scholar] [CrossRef]
- Szulanski, G. Exploring internal stickiness: Impediments to the transfer of best practice within the firm. Strat. Manag. J. 1996, 17, 27–43. [Google Scholar] [CrossRef]
- Tang, F. Knowledge transfer in intra-organization networks. Syst. Res. Behav. Sci. 2011, 28, 270–282. [Google Scholar] [CrossRef]
- Takii, S. Productivity spillovers and characteristics of foreign multinational plants in Indonesian manufacturing 1990–1995. J. Dev. Econ. 2005, 76, 521–542. [Google Scholar] [CrossRef]
- Zaidman, N. Cultural codes and language strategies in business communication interactions between Israeli and Indian businesspeople. MCQ 2001, 14, 408–441. [Google Scholar]
- Zaidman, N.; Brock, D.M. Knowledge transfer within multinationals and their foreign subsidiaries: A culture-context approach. Group Organ. Manag. 2009, 34, 297–329. [Google Scholar] [CrossRef]
- Farrell, M.J. The Measurement of Productive Efficiency. J. R. Stat. Soc. Ser. A (General) 1957, 120, 253. [Google Scholar] [CrossRef]
- Shephard, R. Theory of Cost and Production Function; Princeton University Press: Princeton, NJ, USA, 1970; pp. 64–78. [Google Scholar]
- Charnes, A.; Cooper, W.; Rhodes, E. Measuring the efficiency of decision making units. Eur. J. Oper. Res. 1978, 2, 429–444. [Google Scholar] [CrossRef]
- Banker, R.D.; Charnes, A.; Cooper, W.W. Some Models for Estimating Technical and Scale Inefficiencies in Data Envelopment Analysis. Manag. Sci. 1984, 30, 1078–1092. [Google Scholar] [CrossRef]
- Tone, K. A slacks-based measure of efficiency in data envelopment analysis. Eur. J. Oper. Res. 2001, 130, 498–509. [Google Scholar] [CrossRef]
- Ko, K.; Kim, D. The Analyses of the Operational Efficiency and Efficiency Factors of Retail Stores Using DEA Model. Korean Manag. Sci. Rev. 2014, 31, 135–150. [Google Scholar] [CrossRef]
- Donthu, N.; Yoo, B. Retail productivity assessment using data envelopment analysis. J. Retail. 1998, 74, 89–105. [Google Scholar] [CrossRef]
- Shao, L.; He, Y.; Feng, C.; Zhang, S. An empirical analysis of total-factor productivity in 30 sub-sub-sectors of China’s nonferrous metal industry. Resour. Policy 2016, 50, 264–269. [Google Scholar] [CrossRef]
- Shao, Y.; Wang, S. Productivity growth and environmental efficiency of the nonferrous metals industry: An empirical study of China. J. Clean. Prod. 2016, 137, 1663–1671. [Google Scholar] [CrossRef]
- Tobin, J. Estimation of Relationships for Limited Dependent Variables. Econometrica 1958, 26, 24–36. [Google Scholar] [CrossRef]
- Puig-Junoy, J. Partitioning input cost efficiency into its allocative and technical components: An empirical DEA application to hospitals. Socio-Economic Plan. Sci. 2000, 34, 199–218. [Google Scholar] [CrossRef]
- Hochberg, Y.V.; Sapienza, P.; Vissing-Jørgensen, A.; Vissing-Jørgensen, A. A Lobbying Approach to Evaluating the Sarbanes-Oxley Act of 2002. J. Account. Res. 2009, 47, 519–583. [Google Scholar] [CrossRef]
- Wei, P.; Tang, H.-Q.; Chen, Y.; Chen, X.-H. Measuring technical efficiency of Chinese nonferrous metals enterprises on a background of industry consolidation. Trans. Nonferrous Met. Soc. China 2013, 23, 2797–2806. [Google Scholar] [CrossRef]
- Leydesdorff, L.; Ivanova, I. “Open innovation” and “triple helix” models of innovation: Can synergy in innovation systems be measured? J. Open Innov. Technol. Mark. Complex. 2016, 2, 11–12. [Google Scholar] [CrossRef]
- Schiuma, G.; Lerro, A. The business model prism: Managing and innovating business models of arts and cultural organization. J. Open Innov. Technol. Mark. Complex. 2017, 3, 13. [Google Scholar] [CrossRef]


| Input Variables | Output Variables | Capacity | ||||||
|---|---|---|---|---|---|---|---|---|
| Labor | Energy | Maintenance | Raw Material | Sales Revenue | Production Volume | Primary | Second Level | |
| 000 U$ | 000 U$ | 000 U$ | 000 U$ | 000 U$ | kt | kt | kt | |
| Max. | 1,098,137 | 1,629,518 | 326,822 | 6,783,104 | 5,243,147 | 1119 | 560 | 360 |
| Min. | 2759 | 4304 | 540 | 12,730 | 13,225 | 12 | 100 | 20 |
| Mean. | 112,361 | 213,205 | 44,310 | 913,304 | 700,736 | 269 | 281.40 | 143.63 |
| Standard Deviation | 228,456 | 377,415 | 77,064 | 1,666,122 | 1,304,119 | 294 | 151.75 | 80.20 |
| DMU | CCR | BCC | Scale | Cause of Inefficiency | RTS | SBM | |
|---|---|---|---|---|---|---|---|
| TE | PTE | SE (TE/PTE) | PTE | SE | |||
| 1 | 0.675 | 0.678 | 0.996 | ● | Decreasing | 0.574 | |
| 2 | 0.655 | 0.678 | 0.967 | ● | Increasing | 0.524 | |
| 3 | 0.672 | 0.730 | 0.921 | ● | Decreasing | 0.498 | |
| 4 | 0.174 | 0.488 | 0.356 | ● | Decreasing | 0.035 | |
| 5 | 0.490 | 0.637 | 0.770 | ● | Decreasing | 0.132 | |
| 6 | 0.476 | 0.488 | 0.975 | ● | Decreasing | 0.239 | |
| 7 | 0.471 | 0.489 | 0.964 | ● | Increasing | 0.330 | |
| 8 | 0.383 | 0.562 | 0.680 | ● | Decreasing | 0.119 | |
| 9 | 0.481 | 0.612 | 0.786 | ● | Decreasing | 0.250 | |
| 10 | 0.498 | 0.638 | 0.780 | ● | Decreasing | 0.273 | |
| 11 | 0.464 | 0.564 | 0.822 | ● | Decreasing | 0.246 | |
| 12 | 1.000 | 1.000 | 1.000 | Constant | 1.000 | ||
| 13 | 0.708 | 1.000 | 0.708 | ● | Increasing | 1.000 | |
| 14 | 0.321 | 0.623 | 0.515 | ● | Decreasing | 0.122 | |
| 15 | 0.714 | 0.741 | 0.963 | ● | Increasing | 0.233 | |
| 16 | 0.741 | 0.821 | 0.902 | ● | Increasing | 0.658 | |
| 17 | 0.682 | 1.000 | 0.682 | ● | Increasing | 1.000 | |
| 18 | 0.555 | 0.747 | 0.743 | ● | Decreasing | 0.163 | |
| 19 | 0.374 | 0.453 | 0.825 | ● | Decreasing | 0.044 | |
| 20 | 0.443 | 0.524 | 0.845 | ● | Decreasing | 0.265 | |
| 21 | 0.409 | 0.595 | 0.686 | ● | Decreasing | 0.090 | |
| 22 | 0.216 | 0.444 | 0.486 | ● | Decreasing | 0.120 | |
| 23 | 1.000 | 1.000 | 1.000 | Constant | 1.000 | ||
| 24 | 0.894 | 1.000 | 0.894 | ● | Increasing | 1.000 | |
| 25 | 0.485 | 0.540 | 0.898 | ● | Decreasing | 0.406 | |
| 26 | 0.598 | 0.774 | 0.773 | ● | Decreasing | 0.178 | |
| 27 | 0.516 | 0.560 | 0.921 | ● | Decreasing | 0.193 | |
| 28 | 0.758 | 1.000 | 0.758 | ● | Increasing | 1.000 | |
| 29 | 0.650 | 0.716 | 0.907 | ● | Decreasing | 0.373 | |
| 30 | 0.616 | 0.672 | 0.916 | ● | Decreasing | 0.532 | |
| 31 | 0.700 | 0.703 | 0.996 | ● | Increasing | 0.553 | |
| 32 | 0.589 | 0.611 | 0.964 | ● | Decreasing | 0.299 | |
| 33 | 0.487 | 0.583 | 0.836 | ● | Decreasing | 0.412 | |
| 34 | 0.822 | 1.000 | 0.822 | ● | Increasing | 1.000 | |
| 35 | 0.731 | 1.000 | 0.731 | ● | Increasing | 1.000 | |
| 36 | 0.796 | 0.796 | 0.999 | ● | Increasing | 0.445 | |
| 37 | 0.432 | 0.576 | 0.751 | ● | Decreasing | 0.132 | |
| 38 | 0.724 | 0.808 | 0.896 | ● | Decreasing | 0.666 | |
| 39 | 0.260 | 0.497 | 0.524 | ● | Decreasing | 0.148 | |
| 40 | 0.935 | 1.000 | 0.935 | ● | Increasing | 1.000 | |
| 41 | 0.489 | 0.544 | 0.899 | ● | Decreasing | 0.212 | |
| 42 | 0.479 | 0.581 | 0.825 | ● | Decreasing | 0.155 | |
| Mean | 0.585 | 0.702 | 0.824 | Primary: 0.62 | 0.440 | ||
| Second level: 0.27 | |||||||
| Before Matching | After Matching | |||||||
|---|---|---|---|---|---|---|---|---|
| Average | p-Value | Standardized Difference | Average | p-Value | Standardized Difference | |||
| Control Group (n = 23) | Treatment Group (n = 19) | Control Group (n = 11) | Treatment Group (n = 19) | |||||
| Capacity | 148.826 | 246.737 | 0.014 | 0.006853 | 178.000 | 246.737 | 0.179 | 0.004119 |
| Revenue | 43.174 | 41.842 | 0.601 | −0.020423 | 41.364 | 41.842 | 0.871 | 0.007667 |
| S eff | 0.283 | 0.637 | 0.001 | 0.246 | 0.637 | 0.000 | ||
| Average | Standard Deviation | t | p-Value | |||
|---|---|---|---|---|---|---|
| Control Group (n = 11) | Treatment Group (n = 19) | Control Group (n = 11) | Treatment Group (n = 19) | |||
| S eff | 0.246 | 0.637 | 0.164 | 0.352 | 4.133 | 0.000 |
| Before Matching | After Matching | |||||||
|---|---|---|---|---|---|---|---|---|
| Average | p-Value | Standardized Difference | Average | p-Value | Standardized Difference | |||
| Control Group (n = 24) | Treatment Group (n = 18) | Control Group (n = 11) | Treatment Group) (n = 18) | |||||
| Capacity | 176.000 | 215.944 | 0.316 | 0.002437 | 190.273 | 215.944 | 0.626 | 0.001417 |
| Revenue | 40.792 | 44.944 | 0.100 | 0.066209 | 40.545 | 44.944 | 0.200 | 0.054340 |
| Bonus Zn | 12.458 | 15.389 | 0.002 | 11.545 | 15.389 | 0.002 | ||
| Average | Standard Deviation | t | p-Value | |||
|---|---|---|---|---|---|---|
| Control Group (n = 11) | Treatment Group (n = 18) | Control Group (n = 11) | Treatment Group (n = 18) | |||
| Bonus Zn | 11.55 | 15.39 | 1.864 | 3.483 | 3.361 | 0.002 |
| B | Standard Error | Standardized | t | p-Value | |
|---|---|---|---|---|---|
| (intercept) | −0.275 | 0.223 | −1.234 | 0.225 | |
| P eff | 0.745 | 0.15 | 0.689 | 4.951 | 0 |
| 1 Loc | 0.205 | 0.153 | 0.311 | 1.997 | 0.053 |
© 2019 by the authors. Licensee MDPI, Basel, Switzerland. This article is an open access article distributed under the terms and conditions of the Creative Commons Attribution (CC BY) license (http://creativecommons.org/licenses/by/4.0/).
Share and Cite
Park, H.S.; Kim, T.Y.; Kim, D. Efficiency Analysis of Zinc Refining Companies. Sustainability 2019, 11, 6528. https://doi.org/10.3390/su11226528
Park HS, Kim TY, Kim D. Efficiency Analysis of Zinc Refining Companies. Sustainability. 2019; 11(22):6528. https://doi.org/10.3390/su11226528
Chicago/Turabian StylePark, Ha Sung, Tae Youn Kim, and Daecheol Kim. 2019. "Efficiency Analysis of Zinc Refining Companies" Sustainability 11, no. 22: 6528. https://doi.org/10.3390/su11226528
APA StylePark, H. S., Kim, T. Y., & Kim, D. (2019). Efficiency Analysis of Zinc Refining Companies. Sustainability, 11(22), 6528. https://doi.org/10.3390/su11226528