Probabilistic Health Risk Assessment of Vehicular Emissions as an Urban Health Indicator in Dhaka City


Abstract
:1. Introduction
2. Methodology
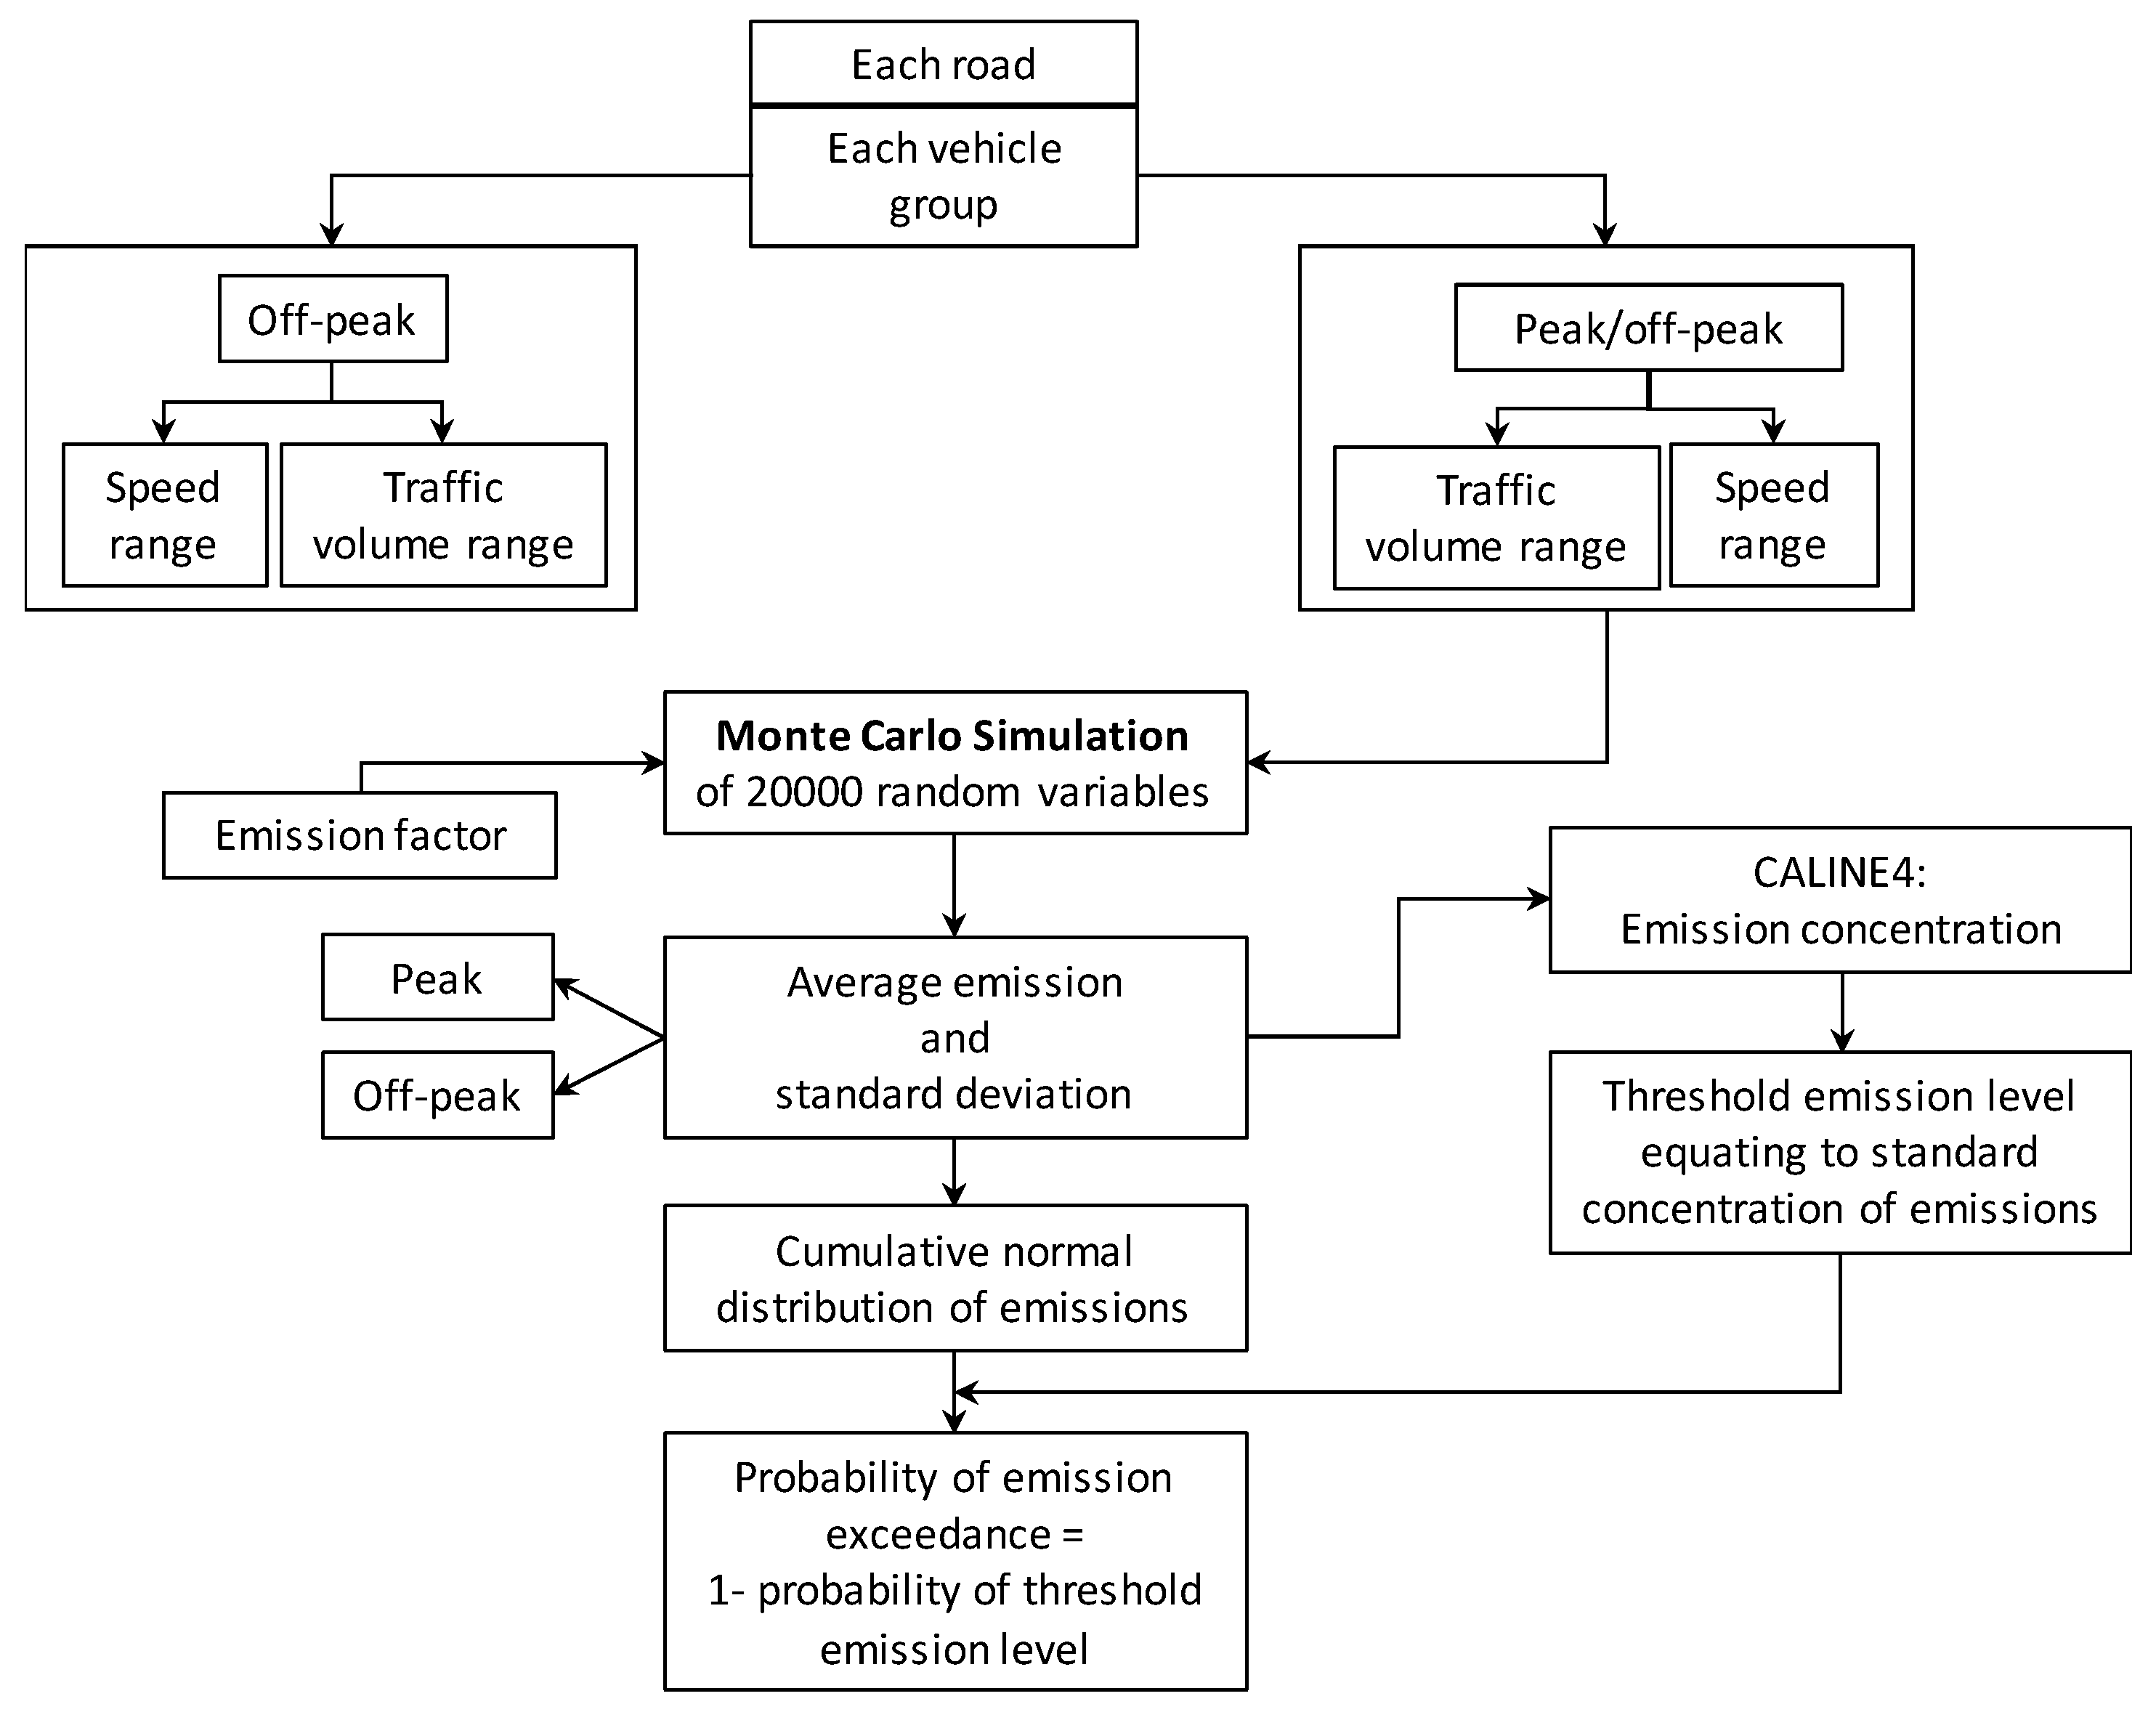
2.1. Probabilistic Emissions Inventory
- i = all vehicle types being considered (e.g., private car, taxi, bus, truck);
- j = all fuel types being considered (petrol, diesel, Compressed Natural Gas- CNG);
- k = the road link of interest for emissions calculations;
- AADT = average annual daily traffic (number) along road link of vehicle type i and fuel type j; and EFij = base emissions factor for vehicle type i and fuel type j (gm/km).
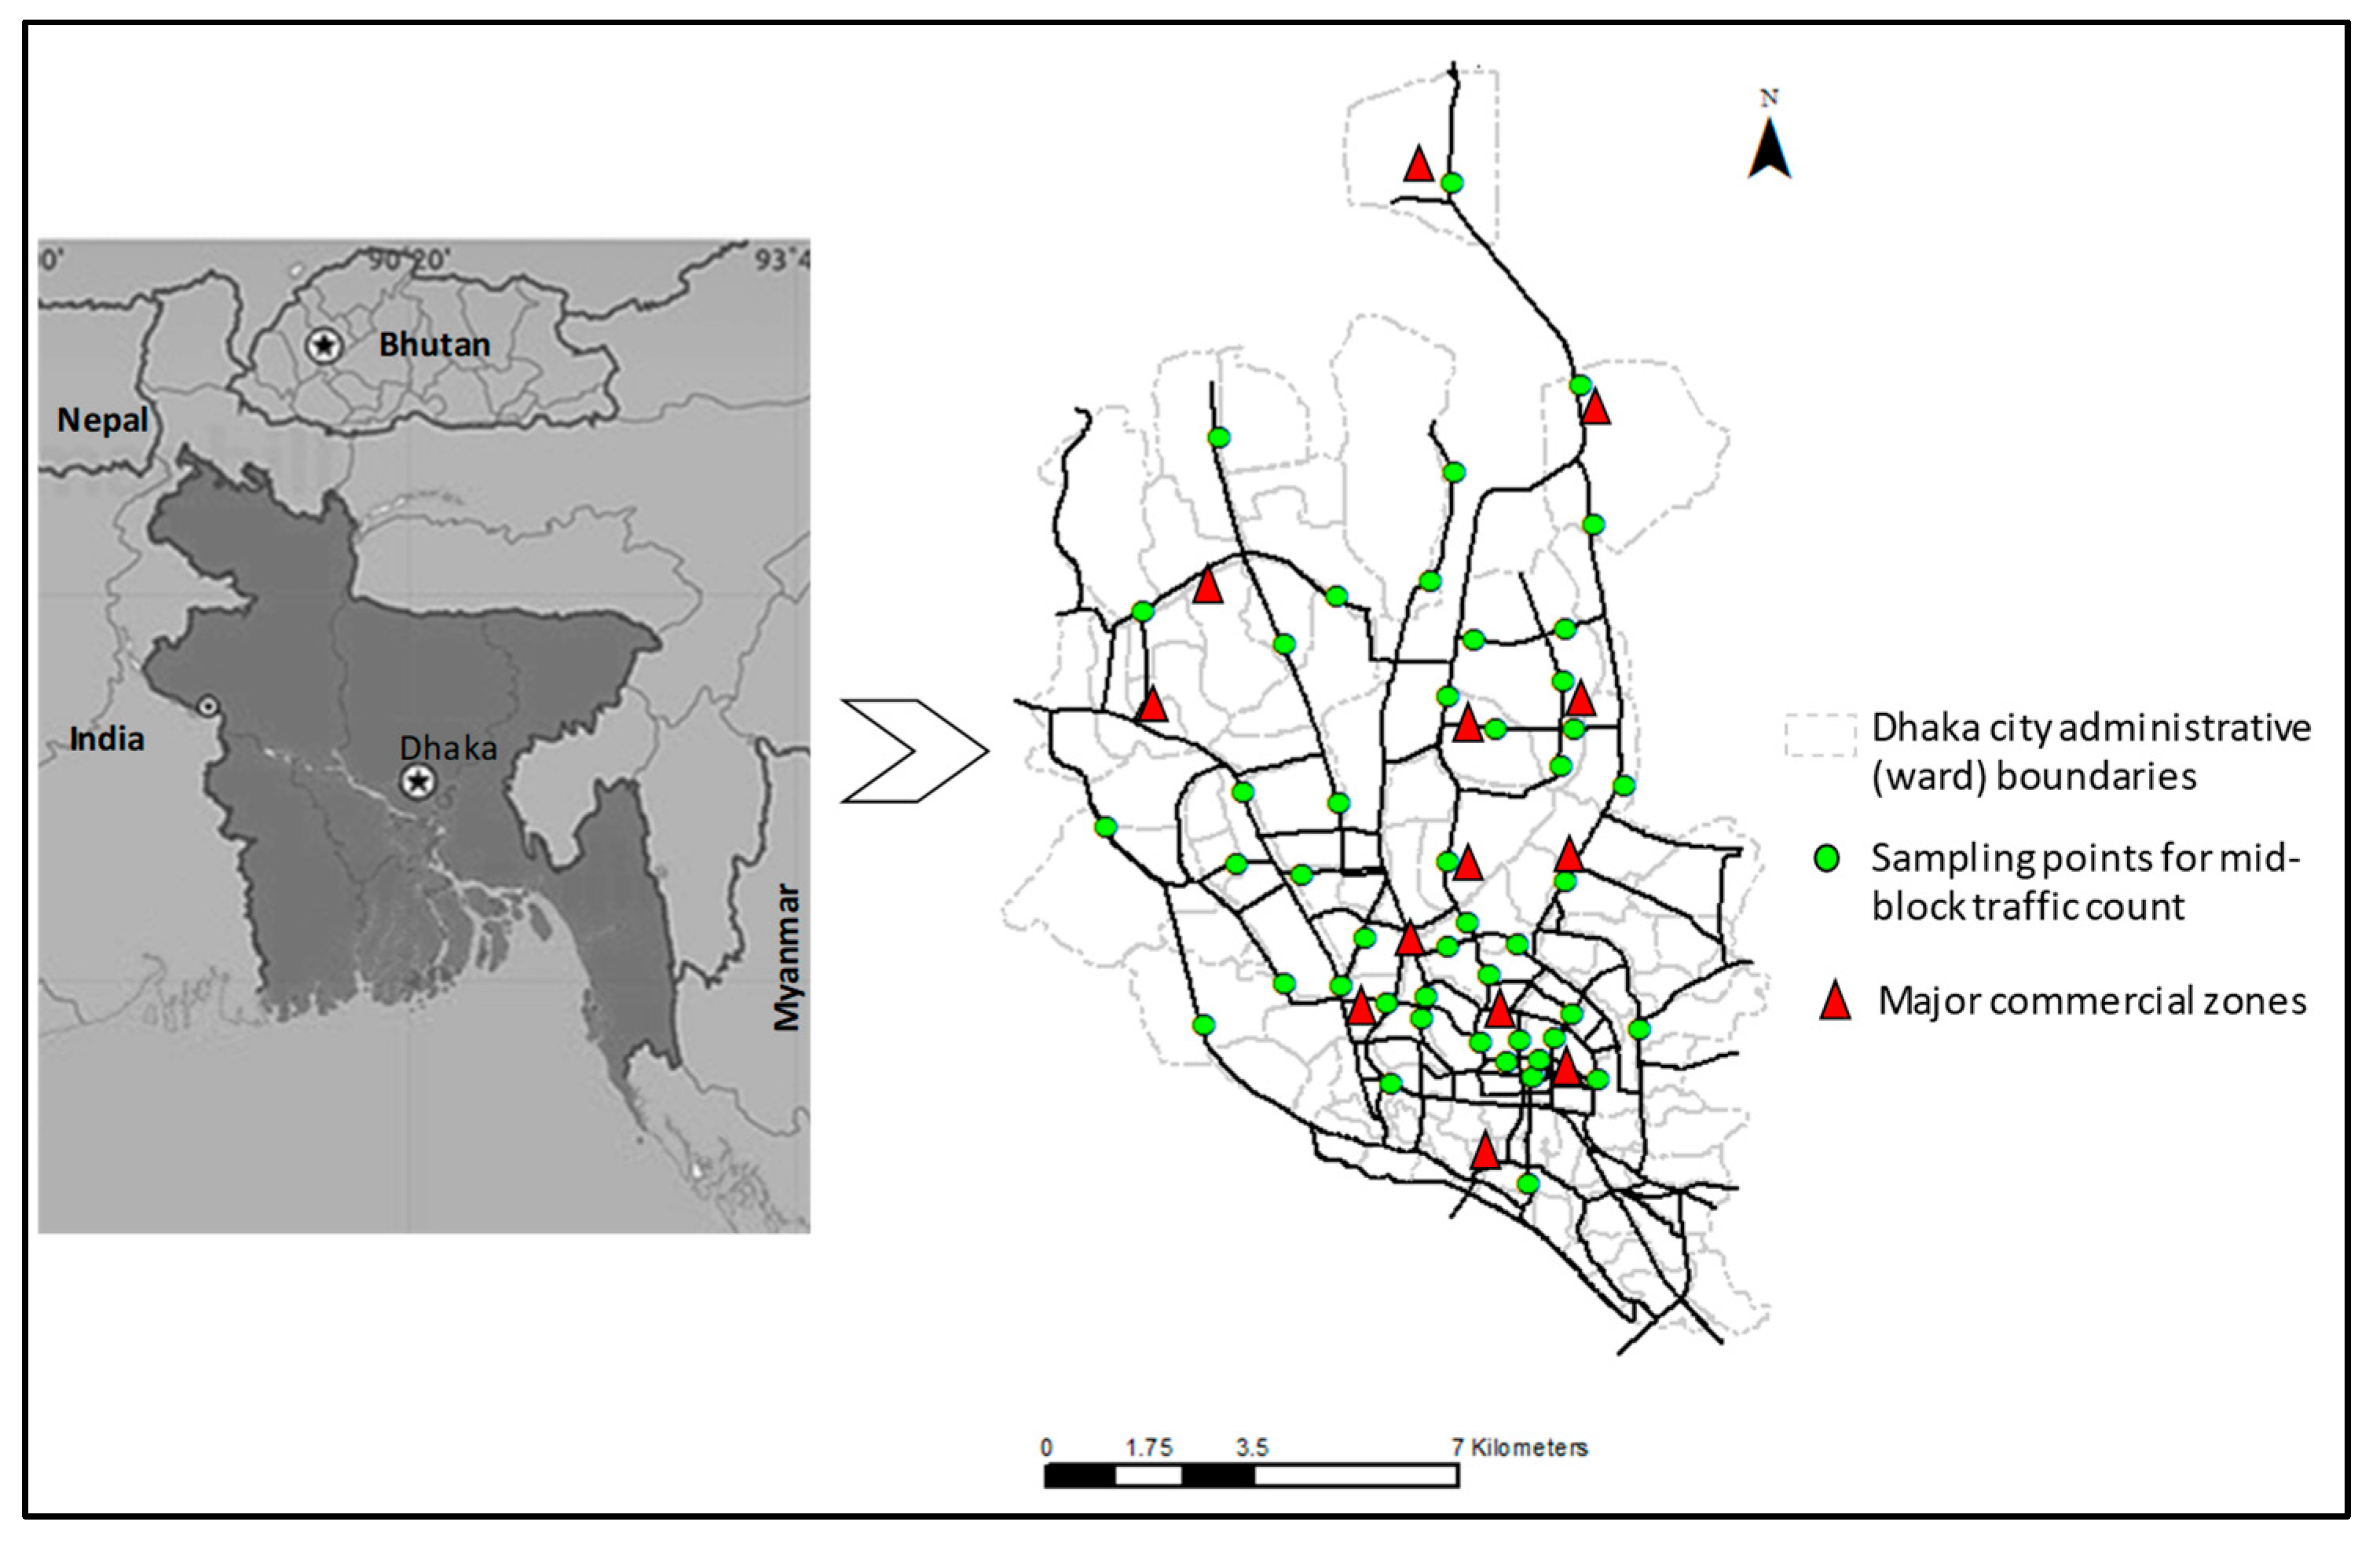
2.1.1. Data for Analysis
- v = vehicle average speed (km/h);
- Ce = car equivalent of vehicles running on the road (equivalent number of cars that can be substituted tentatively for the length of different categories of vehicles running on the road in Dhaka City, i.e., bus = 2.5 Ce, truck= 2 Ce and MC = 0.4 Ce) [23].
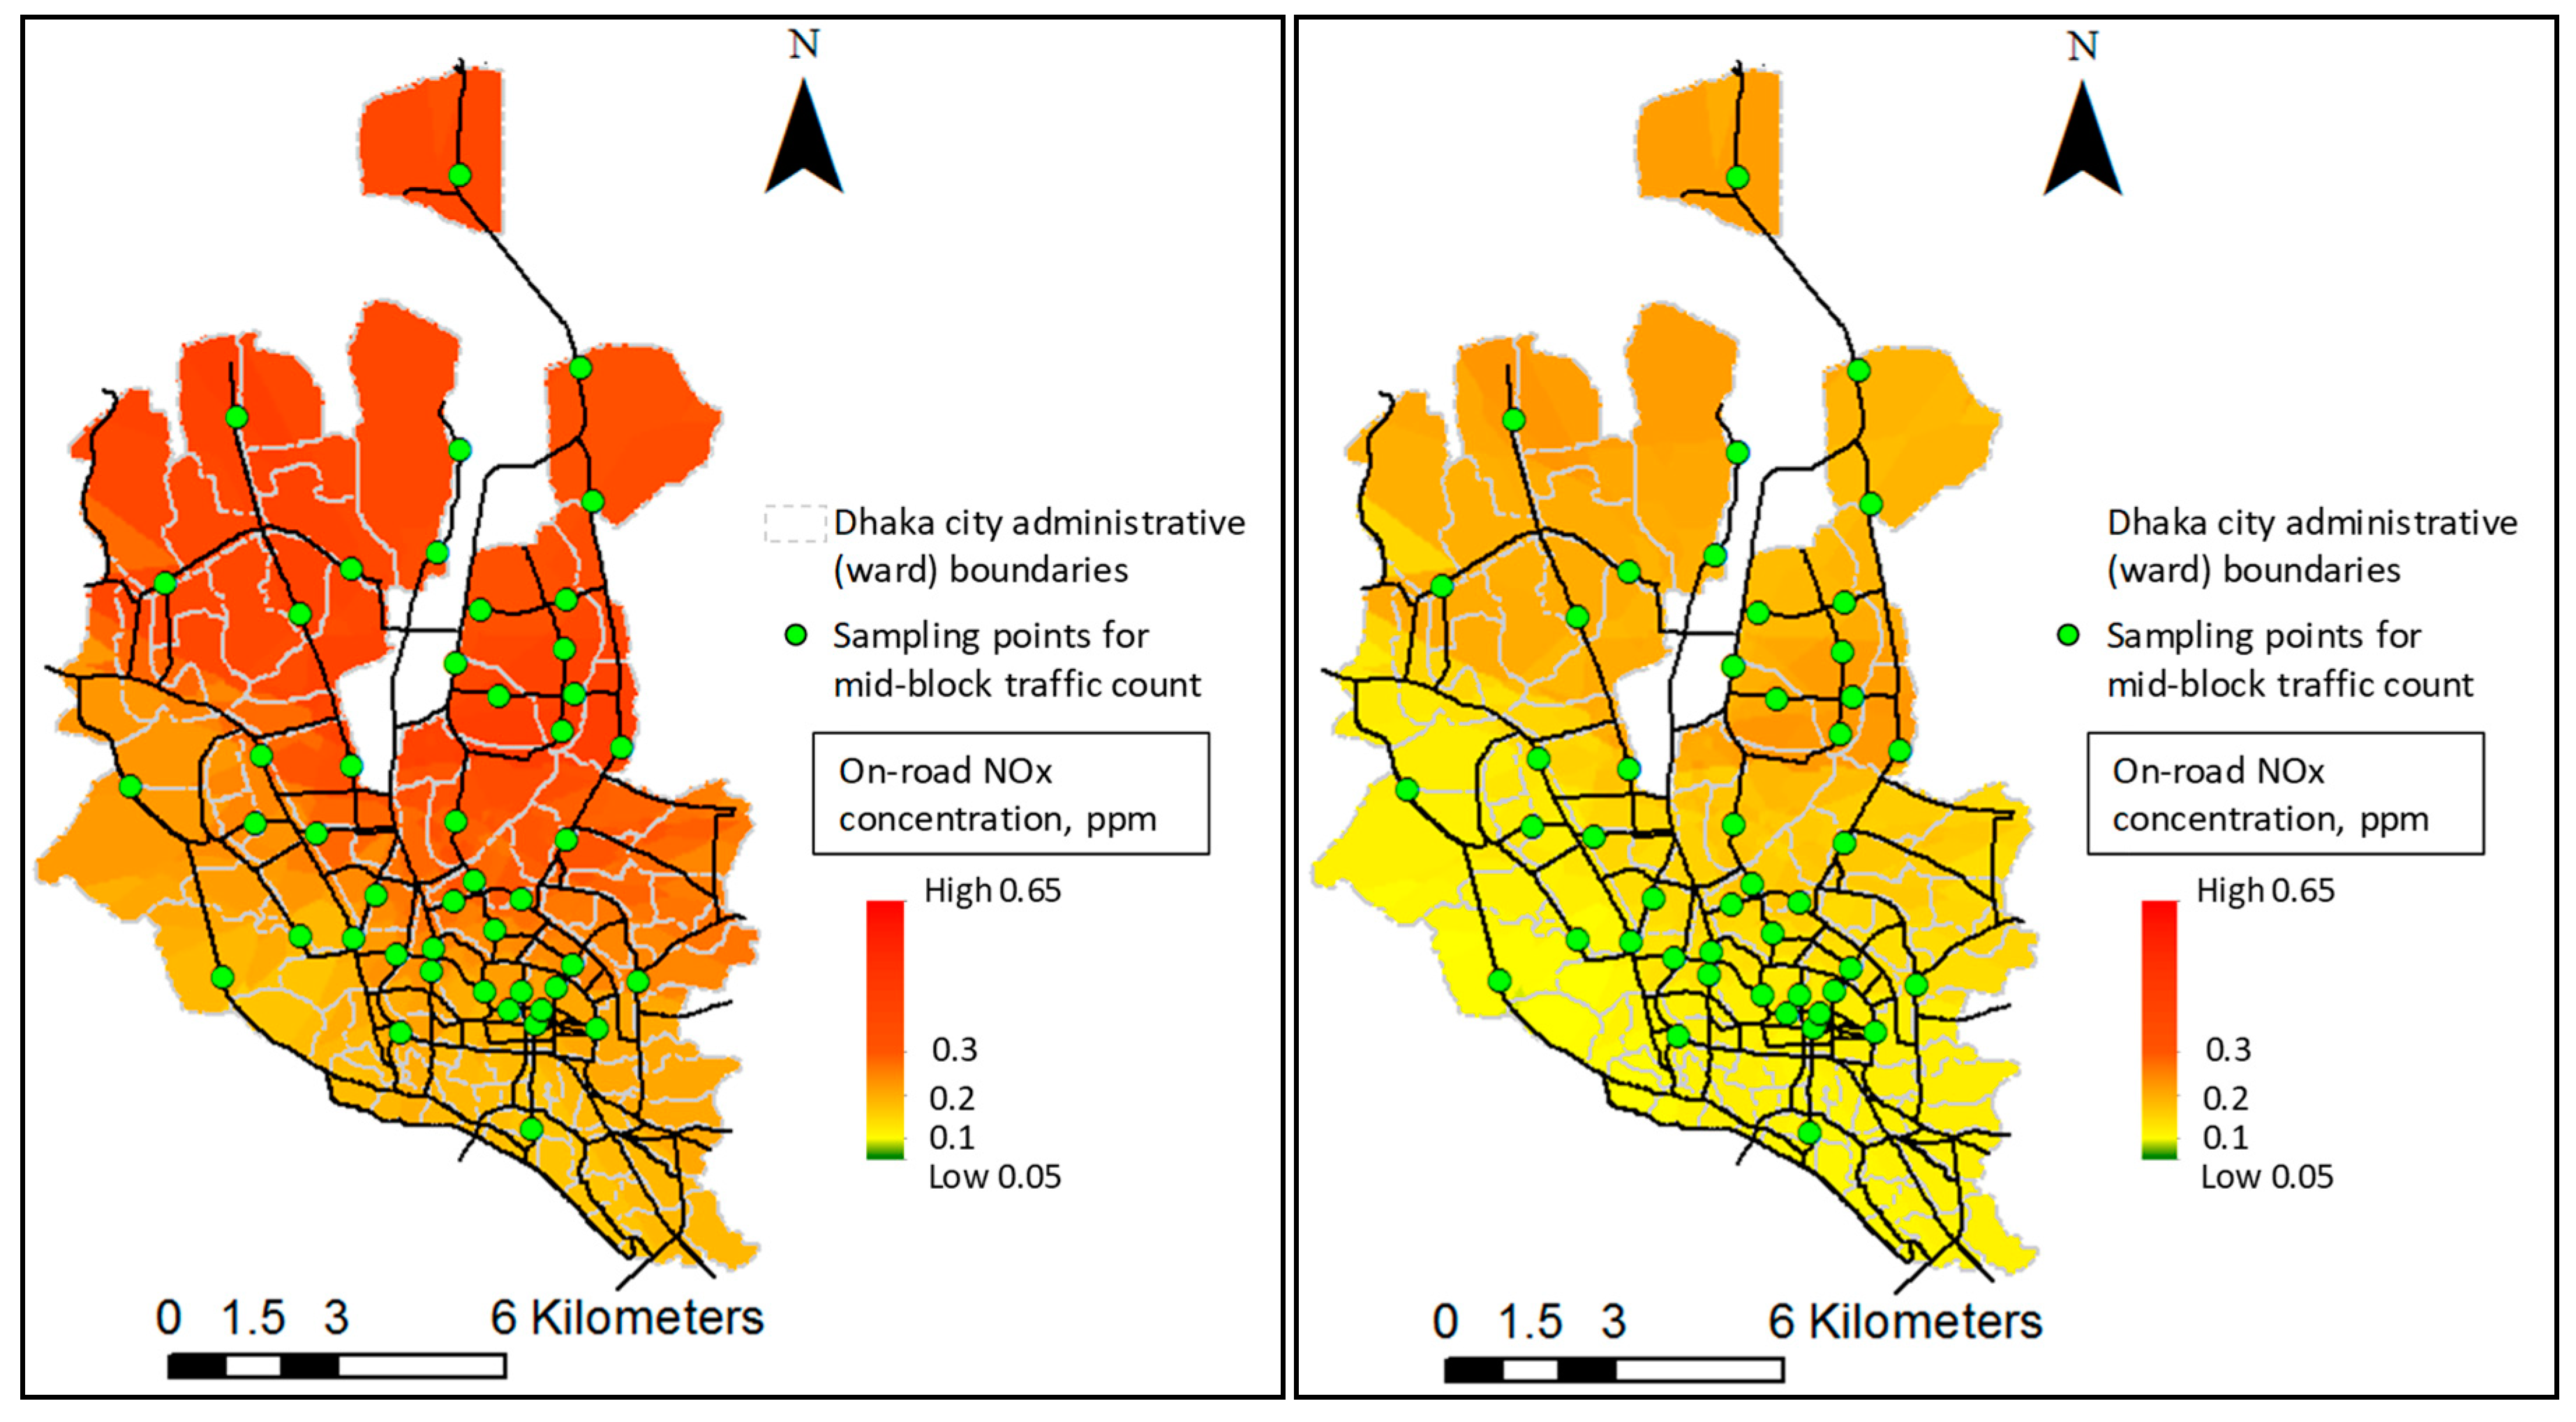
2.1.2. Estimating On-Road NOx Concentrations
- ○
- CALINE4 is recommended by the US EPA (Environment Protection Authority) for use in urban areas with simple terrain and transport distances of less than 50 km [25], while the pollutants are inert gases;
- ○
- Data for wind speed, wind direction, wind direction standard deviation, atmospheric stability class, mixing height and temperature were collected from the Bangladesh Bureau of Meteorology [26];
- ○
- The model was run for 1 h (average concentration), which provided a 24-h average concentration of running the model for peak and offpeak periods;
- ○
- It is important to note that NOx is converted to O3 in the presence of sunlight, which might show a reduced ambient NOx concentration on a sunny day. In Bangladesh, generally May to September of each year is a period with a very low count of sunny days [27]. However, a constant conversion of NOx to O3 throughout the year was considered for this research (rate as suggested by CALINE4) irrespective of the number of sunny days. Although considering a constant rate of conversion might not be an accurate approach, applying it prevented an overestimation of the NOx concentration in an overall scenario analysis;
- ○
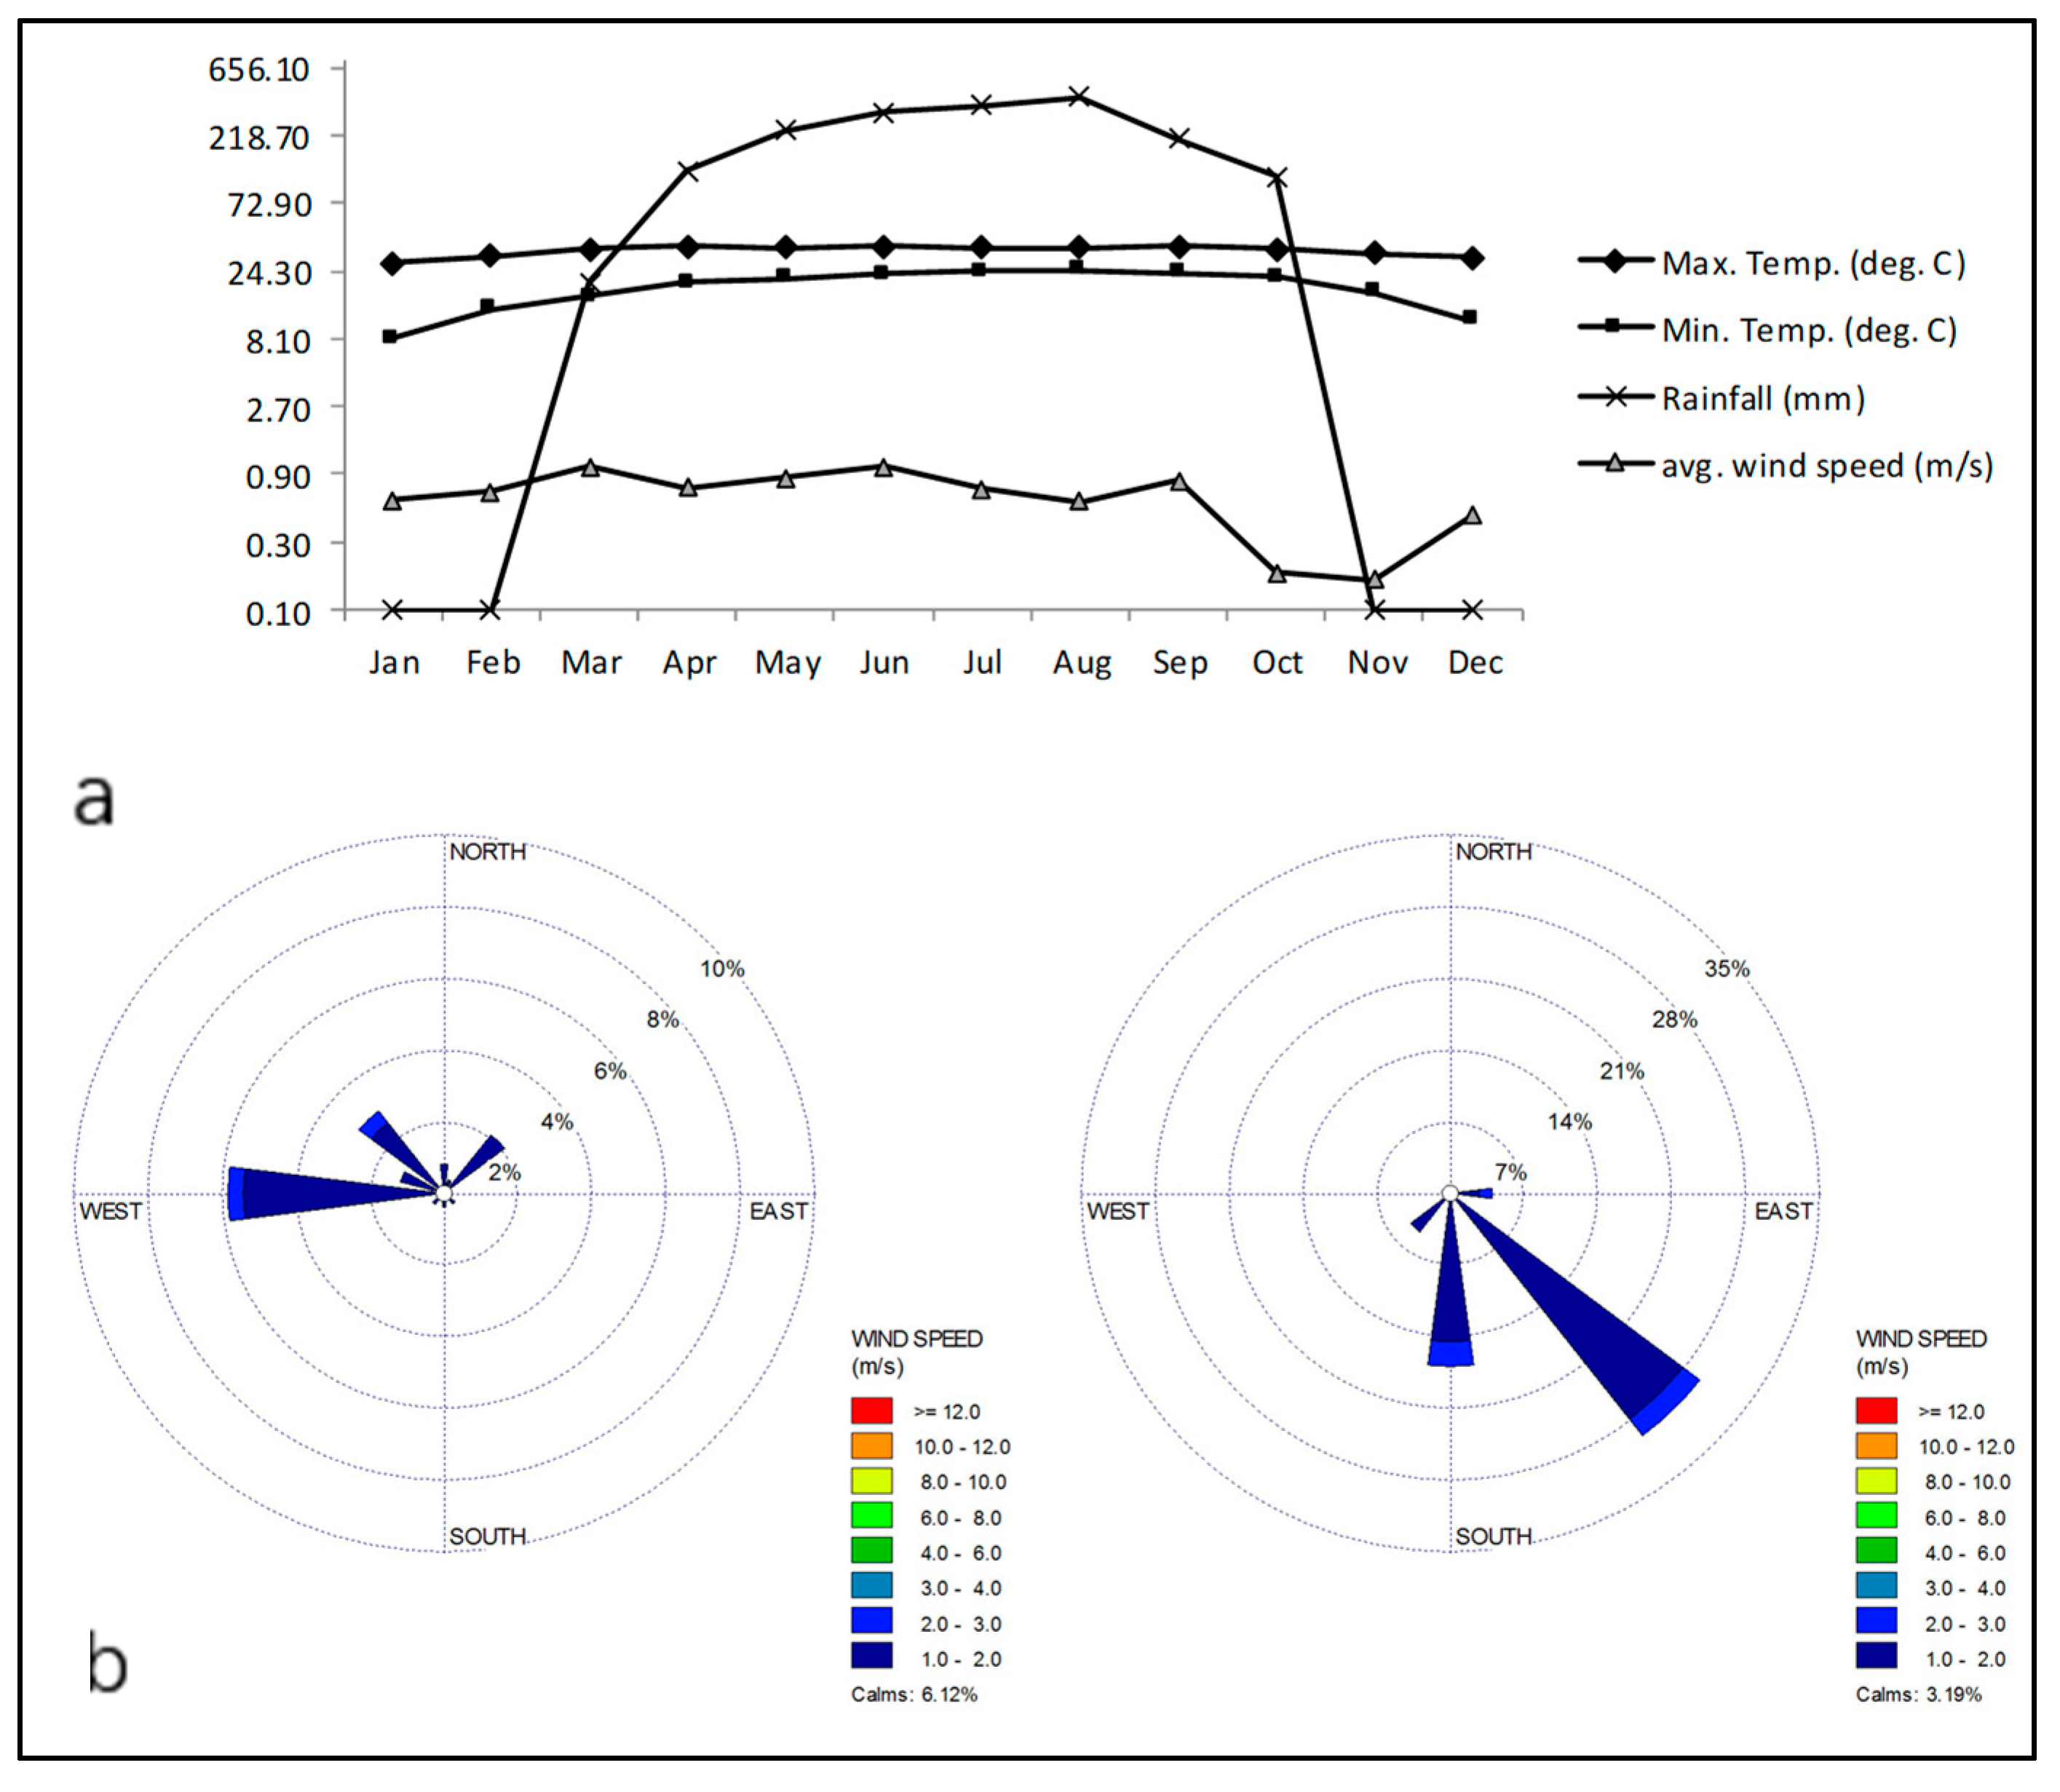
- CALINE4 was run for two different meteorological conditions in a year. The variation in meteorological data is provided in Figure 5, showing distinct wind speed and direction differences during wet and dry months. Therefore, the model was run considering the meteorological conditions of November and July and was assumed to be applicable for November–March (dry months) and April–October (wet months), respectively. The average hourly concentration for these two periods was considered to be the average concentration for the year;
- ○
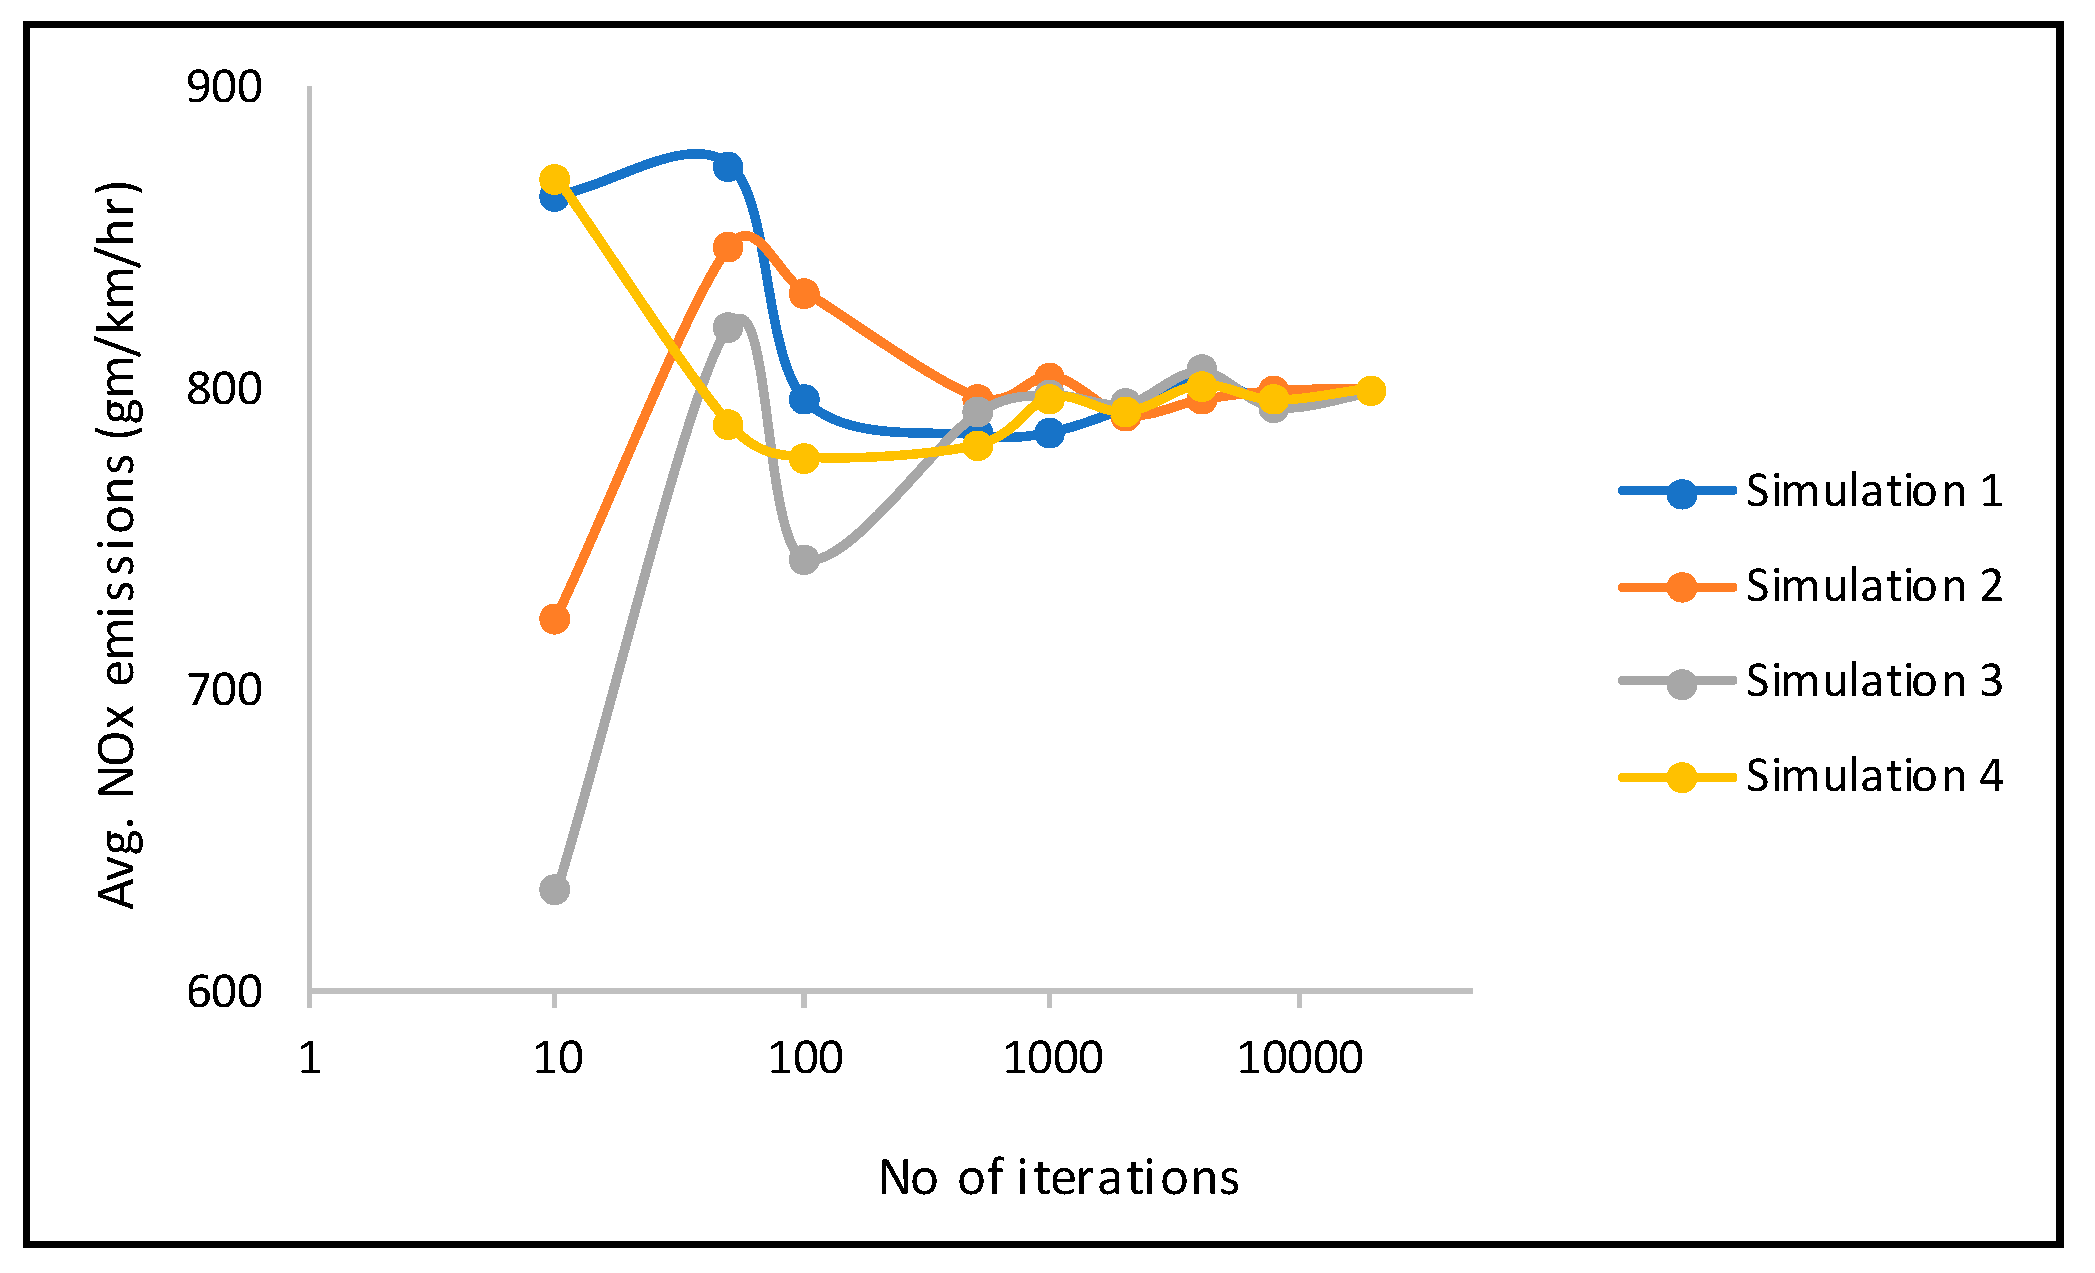
2.2. Probability Function and Distribution
2.3. Risk Analysis
- The severity here was associated with the standard level of emissions and was scaled to the magnitude of emissions, as classified below. The National Ambient Air Quality Standard of Bangladesh for NOx is 0.1 ppm and 0.053 ppm for the hourly and yearly average, respectively [30,31]:
- ○
- Severe-4: hourly emissions concentration >0.25 ppm = WHO guideline value for acute health effects [31] or 24-h concentration >200% of annual standard;
- ○
- Critical-3: emissions concentration >150% of the standard;
- ○
- Marginal-2: emissions concentration at the level of the standard;
- ○
- Negligible-1: emissions concentration below the level of the standard;
- Probability indicated the likelihood of generating the severity and was scaled based on its percentage of occurring, as follows. There is no standard method for scaling probability; however, the probability of risk is scaled in project management practices [32,33] and was used as a reference for scaling the probability in this research. This is an evenly distributed scale for higher ranges that is capable of distinguishing between the occurrences of emissions scenarios:
- ○
- Strong-5: probability ≥80%;
- ○
- High-4: probability ≥60%–<80%;
- ○
- Medium-3: probability ≥40%–<60%;
- ○
- Low-2: probability ≥10%–<40%;
- ○
- Improbable-1: probability <10%;
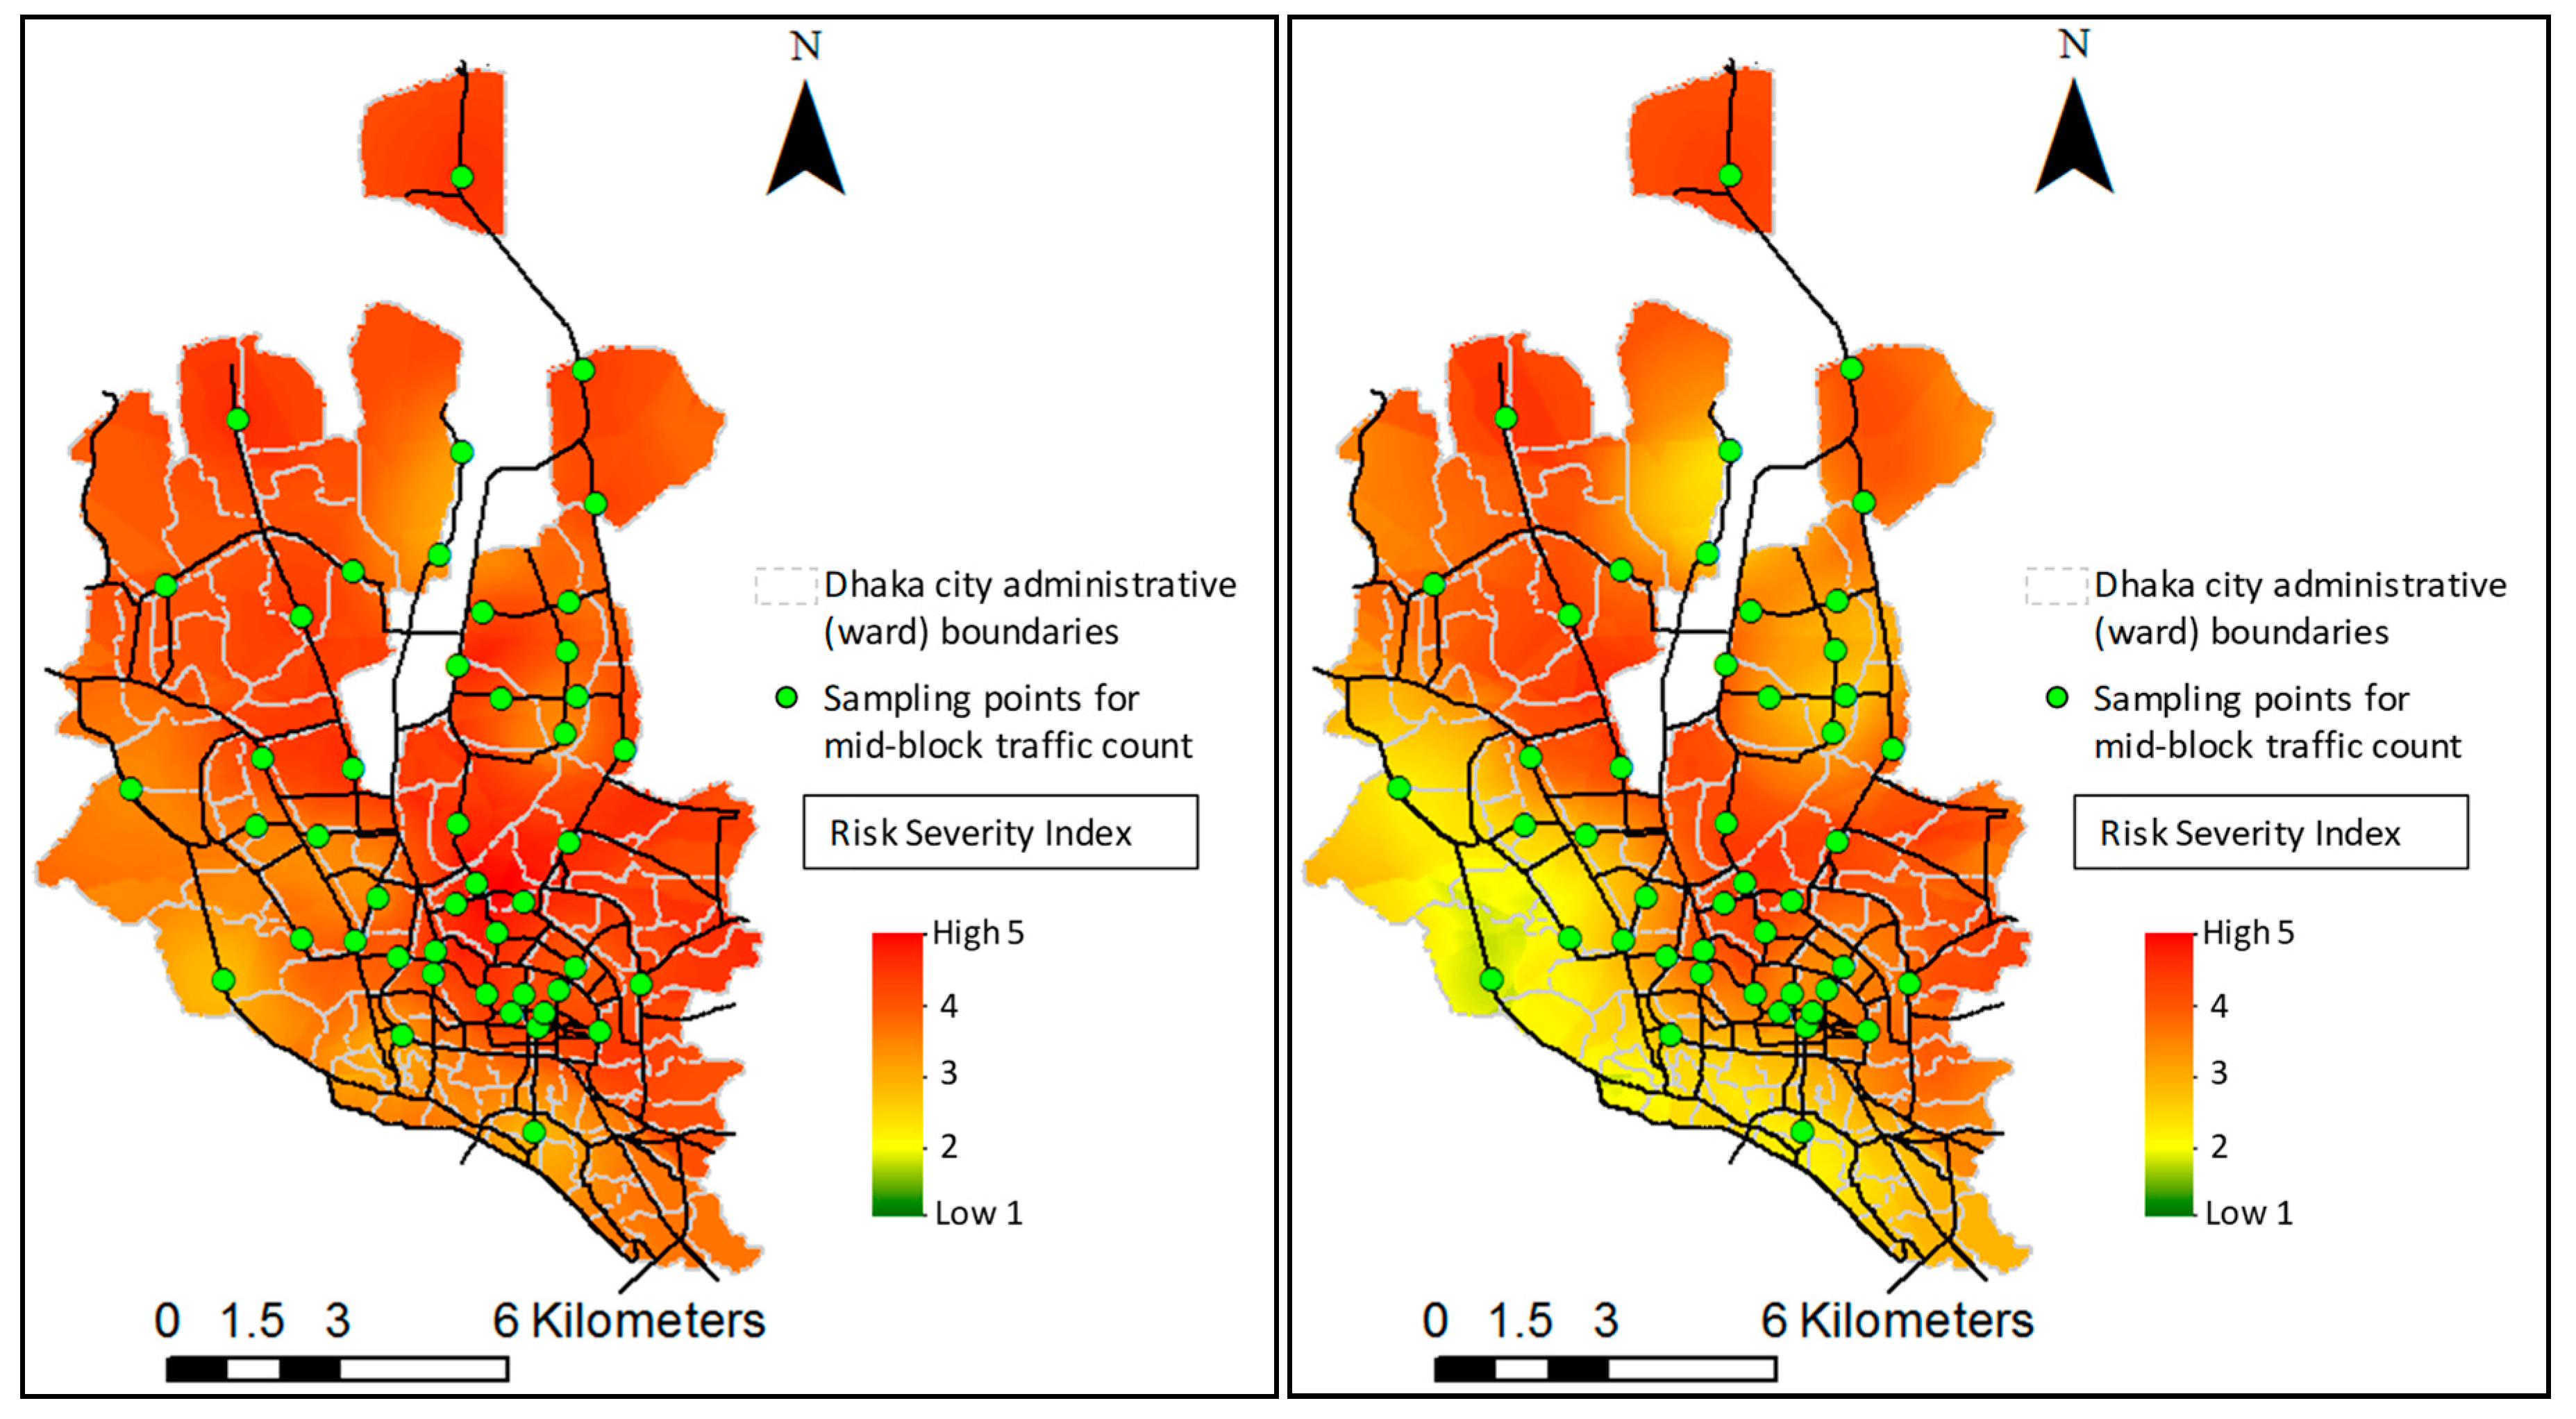
- Considering the severity and probability of emissions, a risk analysis matrix was generated (Table 2) that showed risk indexes for various scenarios. The risk index values were the product of probability and severity, and on the basis of that, the risk of NOx emissions from vehicular sources was categorized into five indexes: extreme, acute, major, moderate and minor.
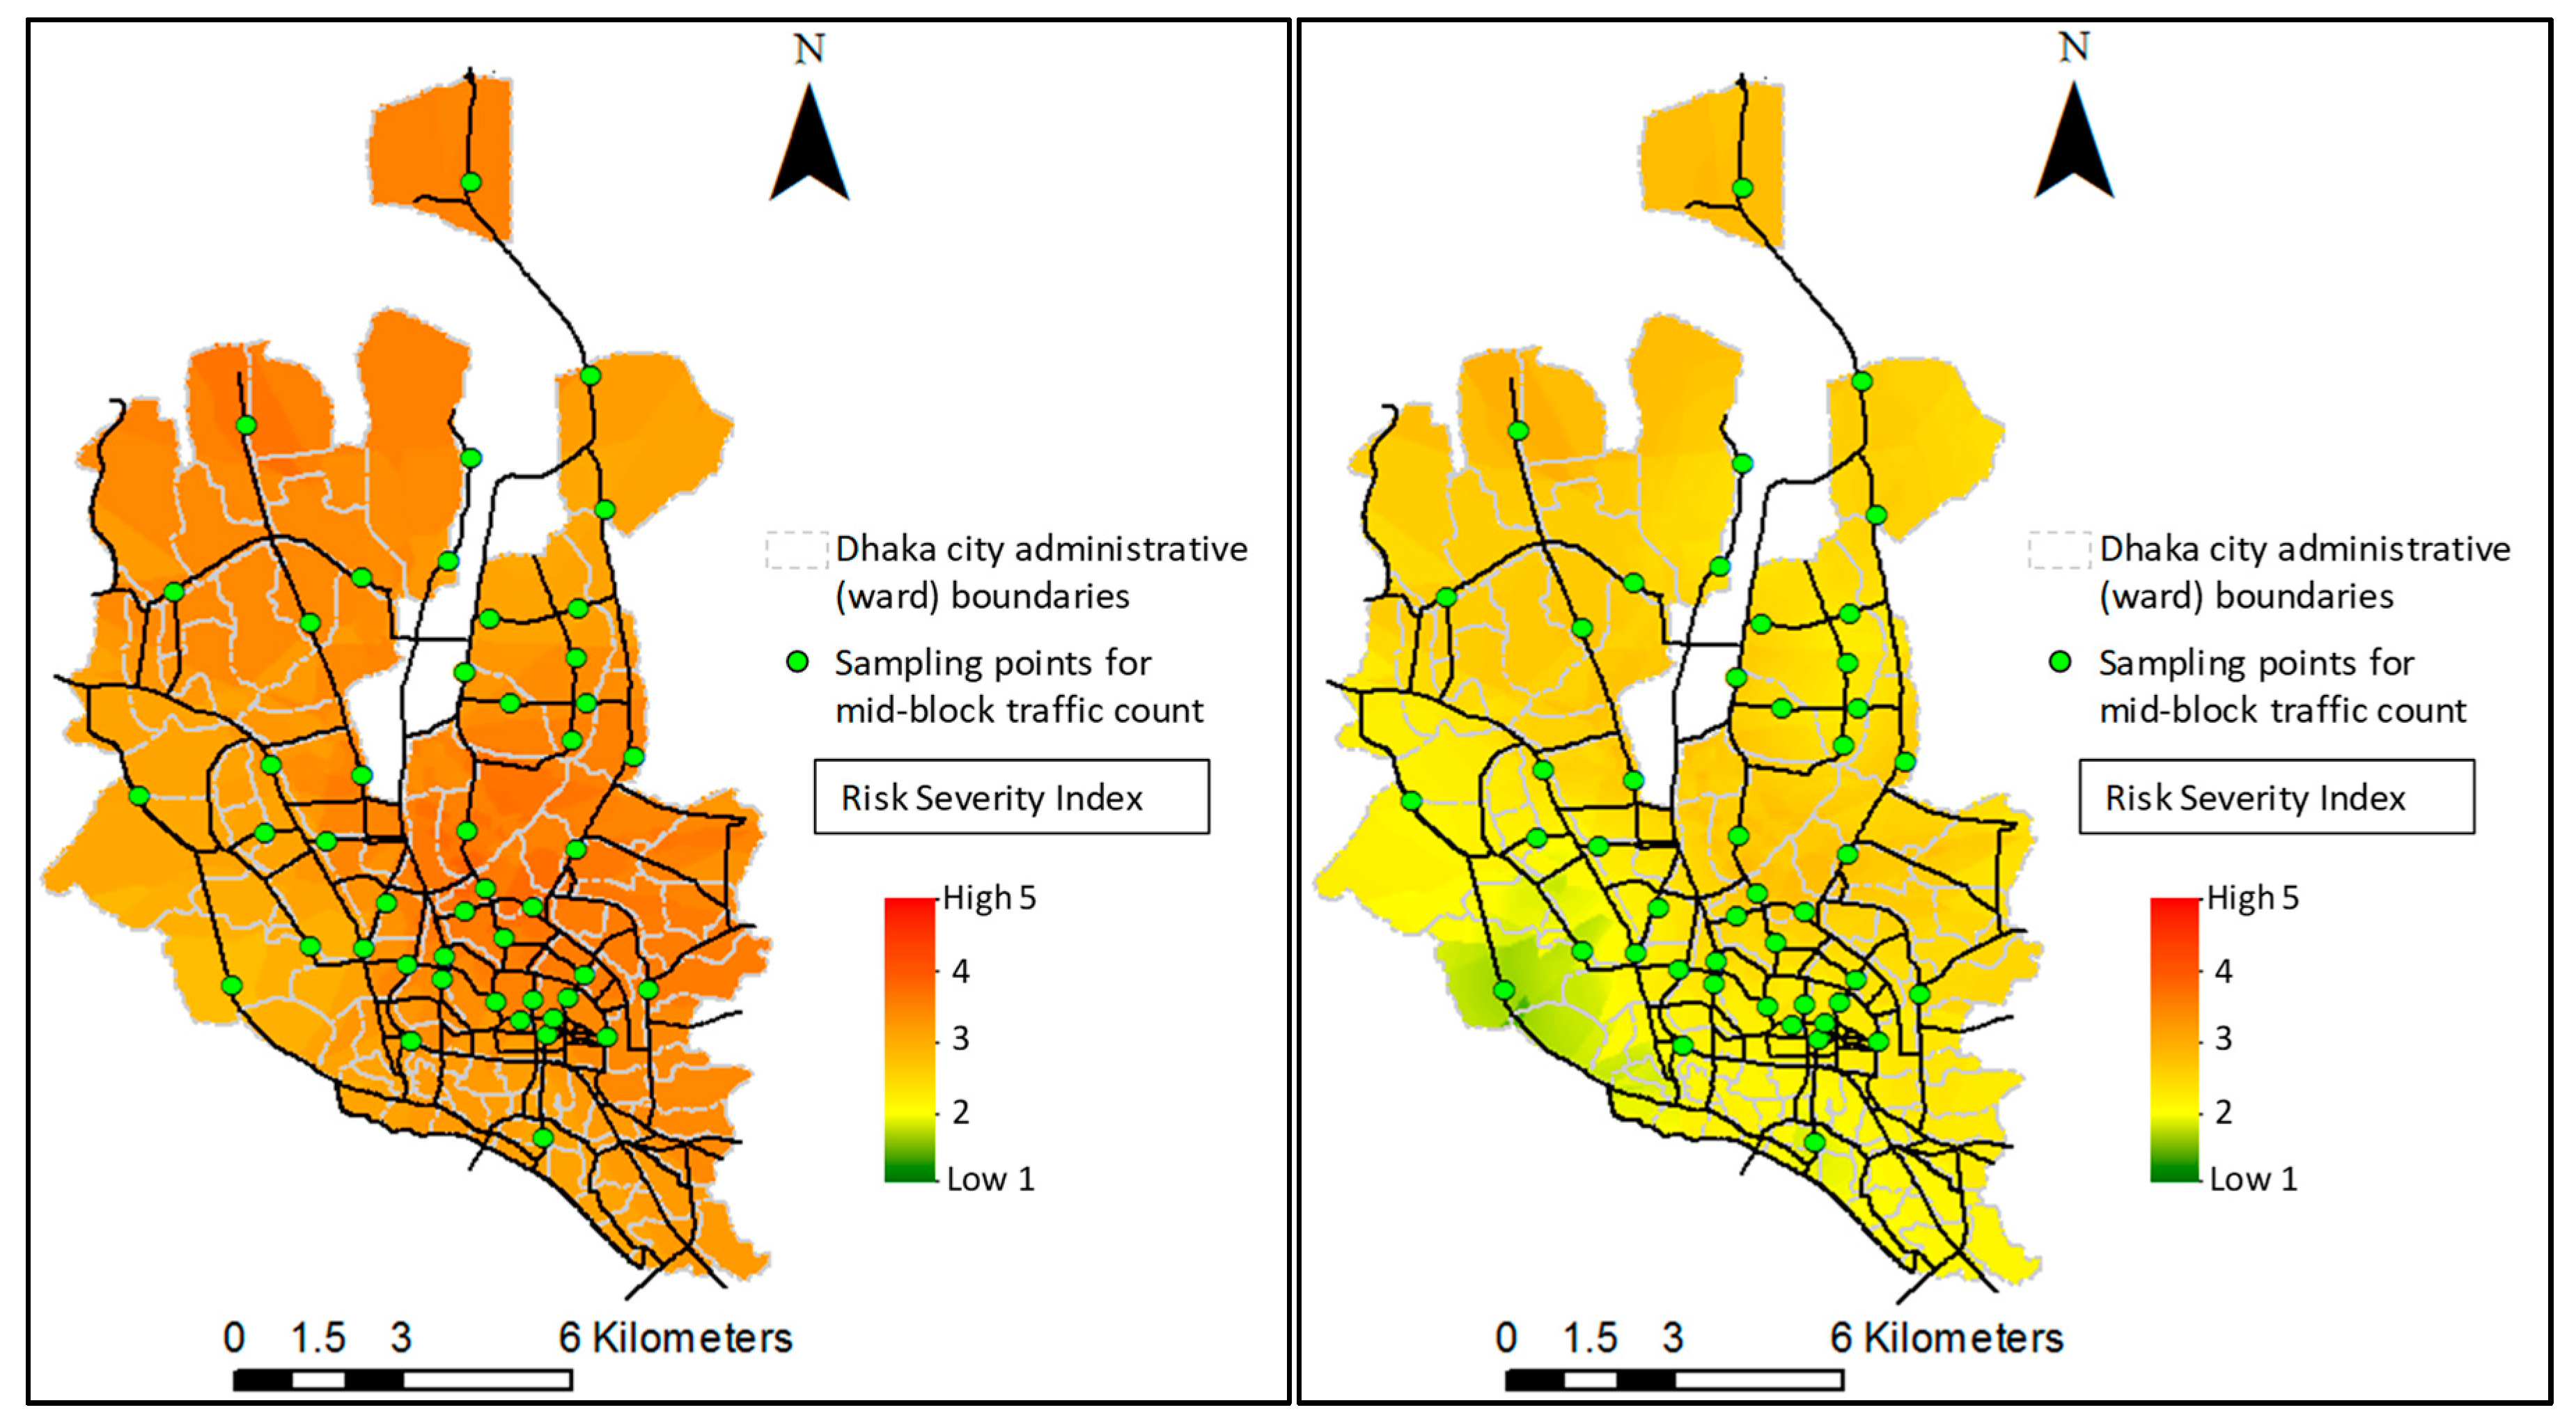
2.4. Probabilistic Spatial Distribution
3. Results and Discussions
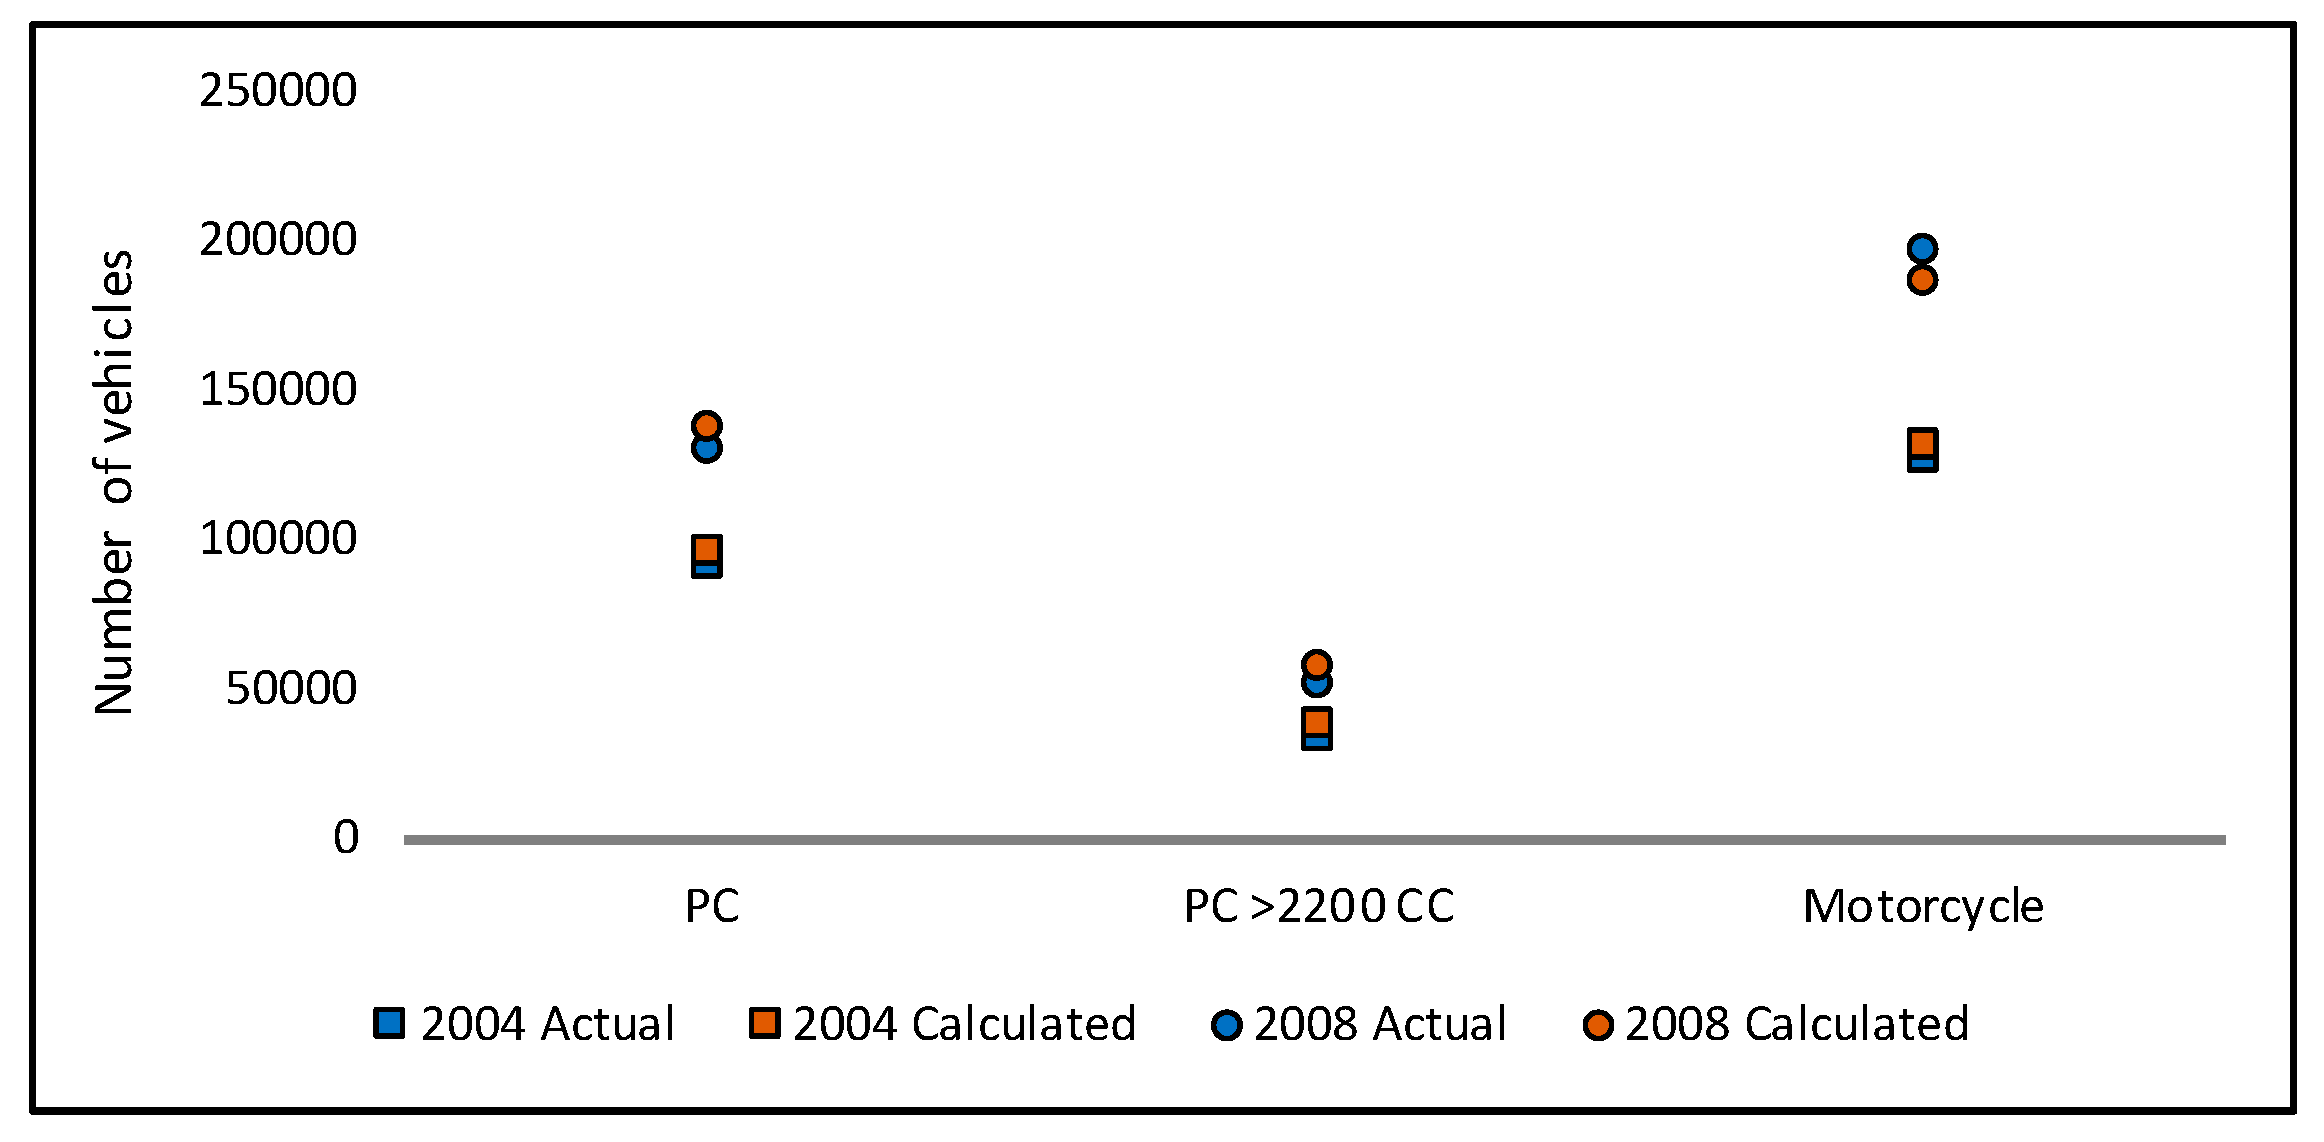
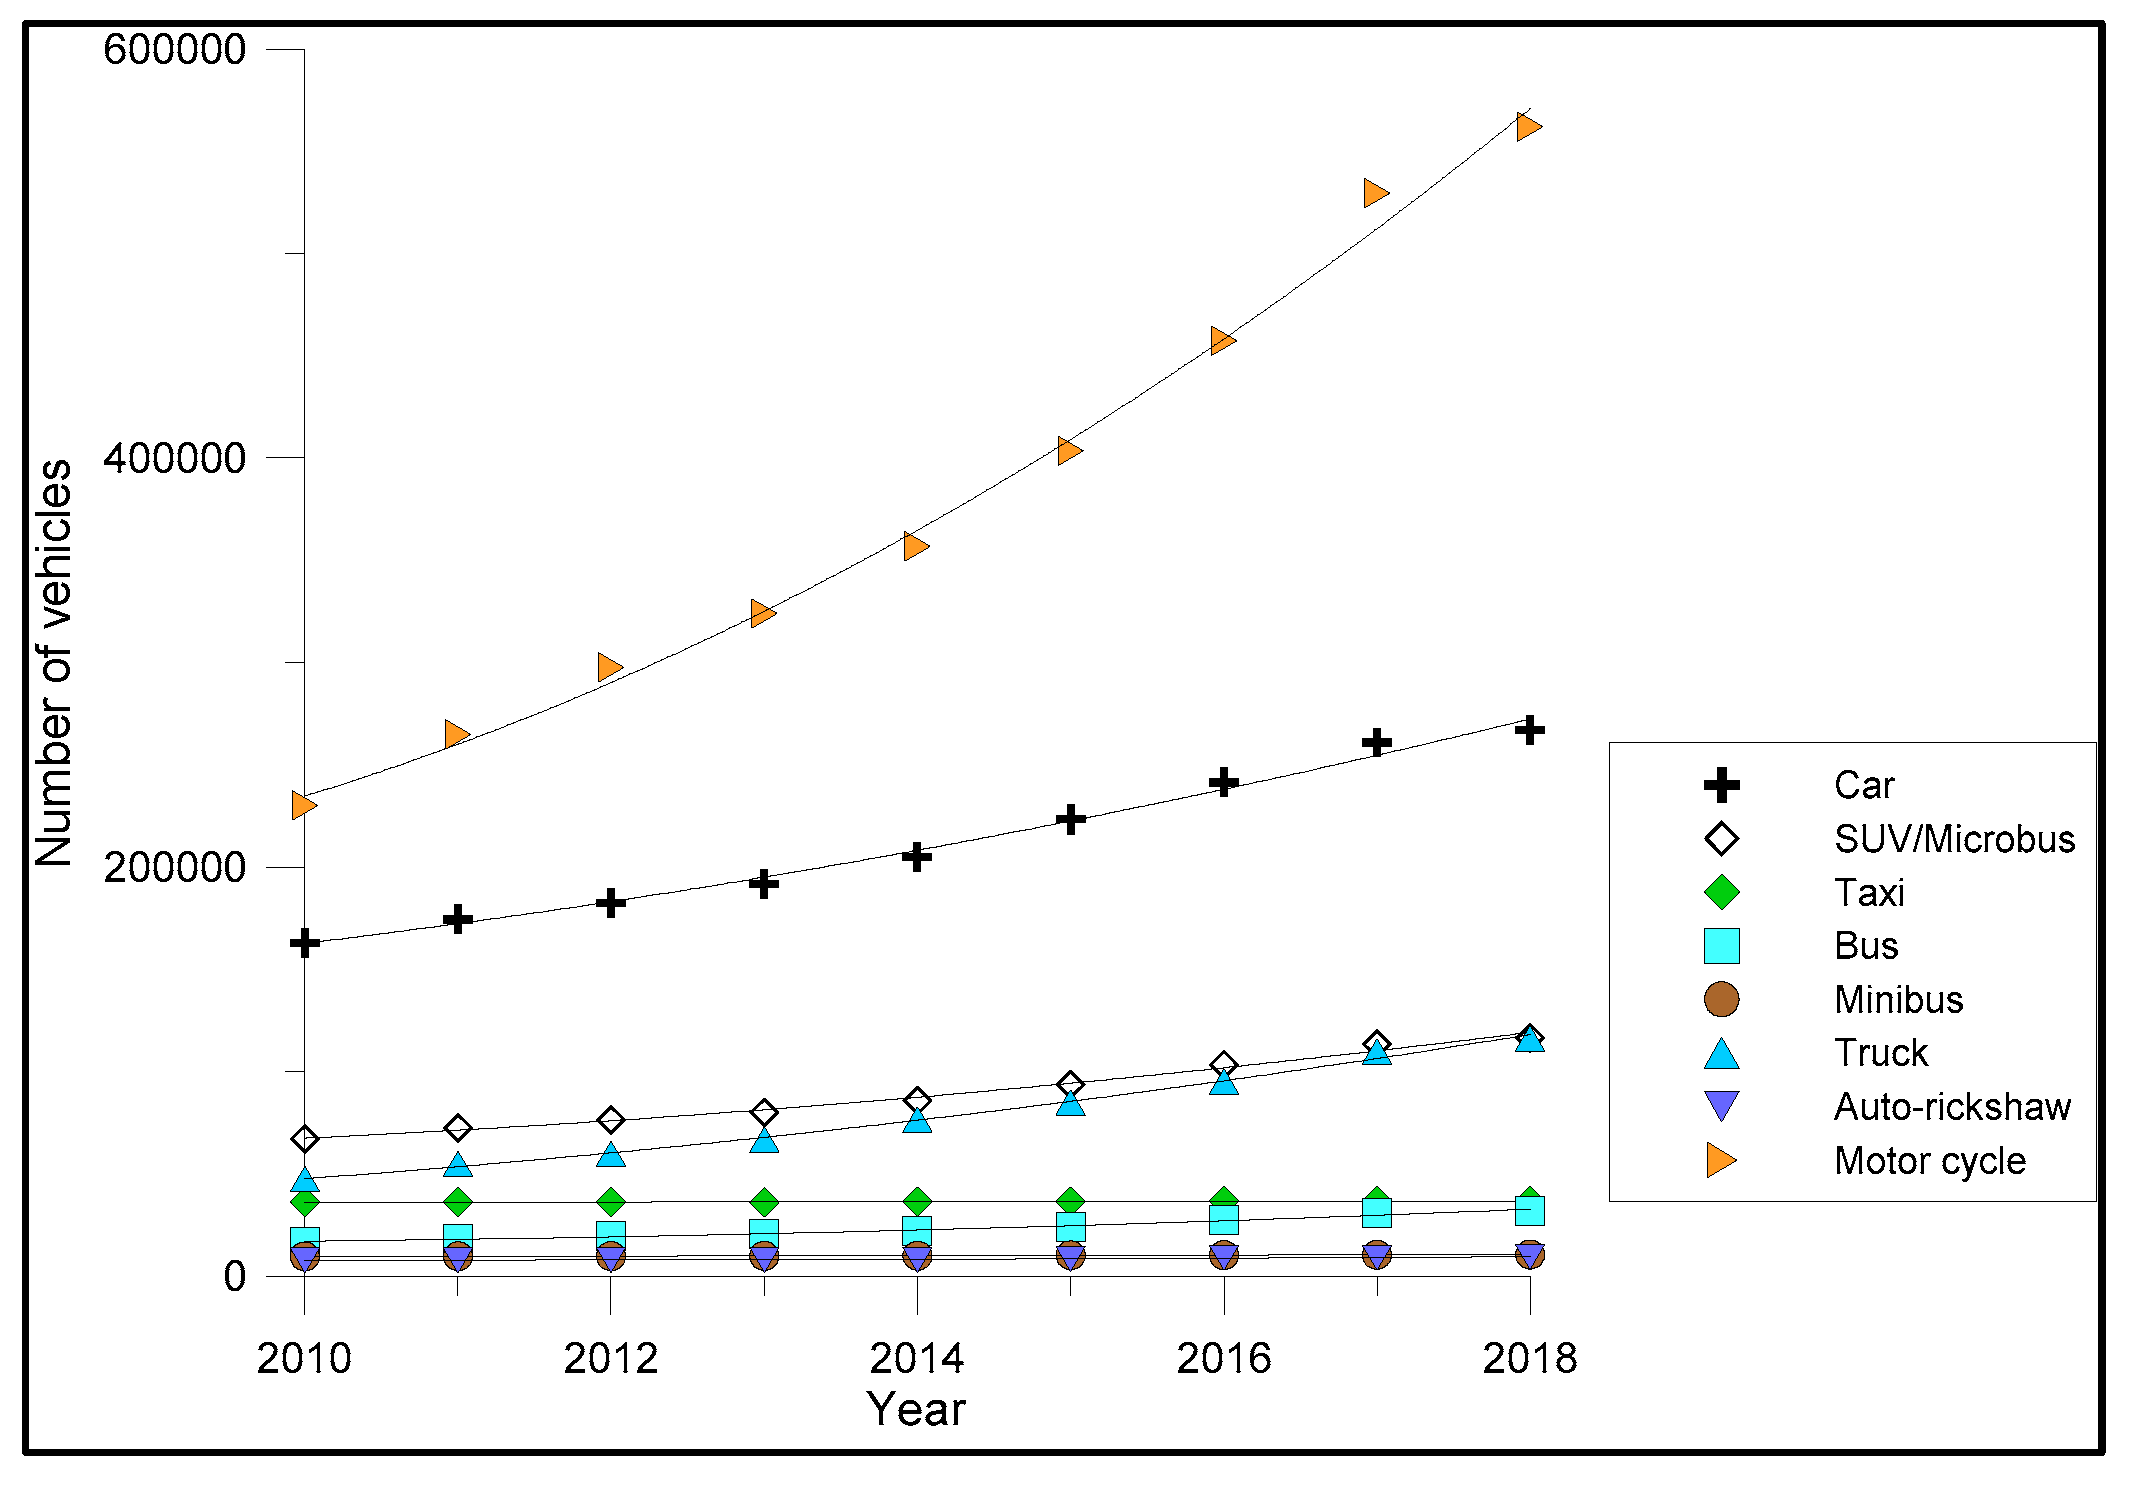
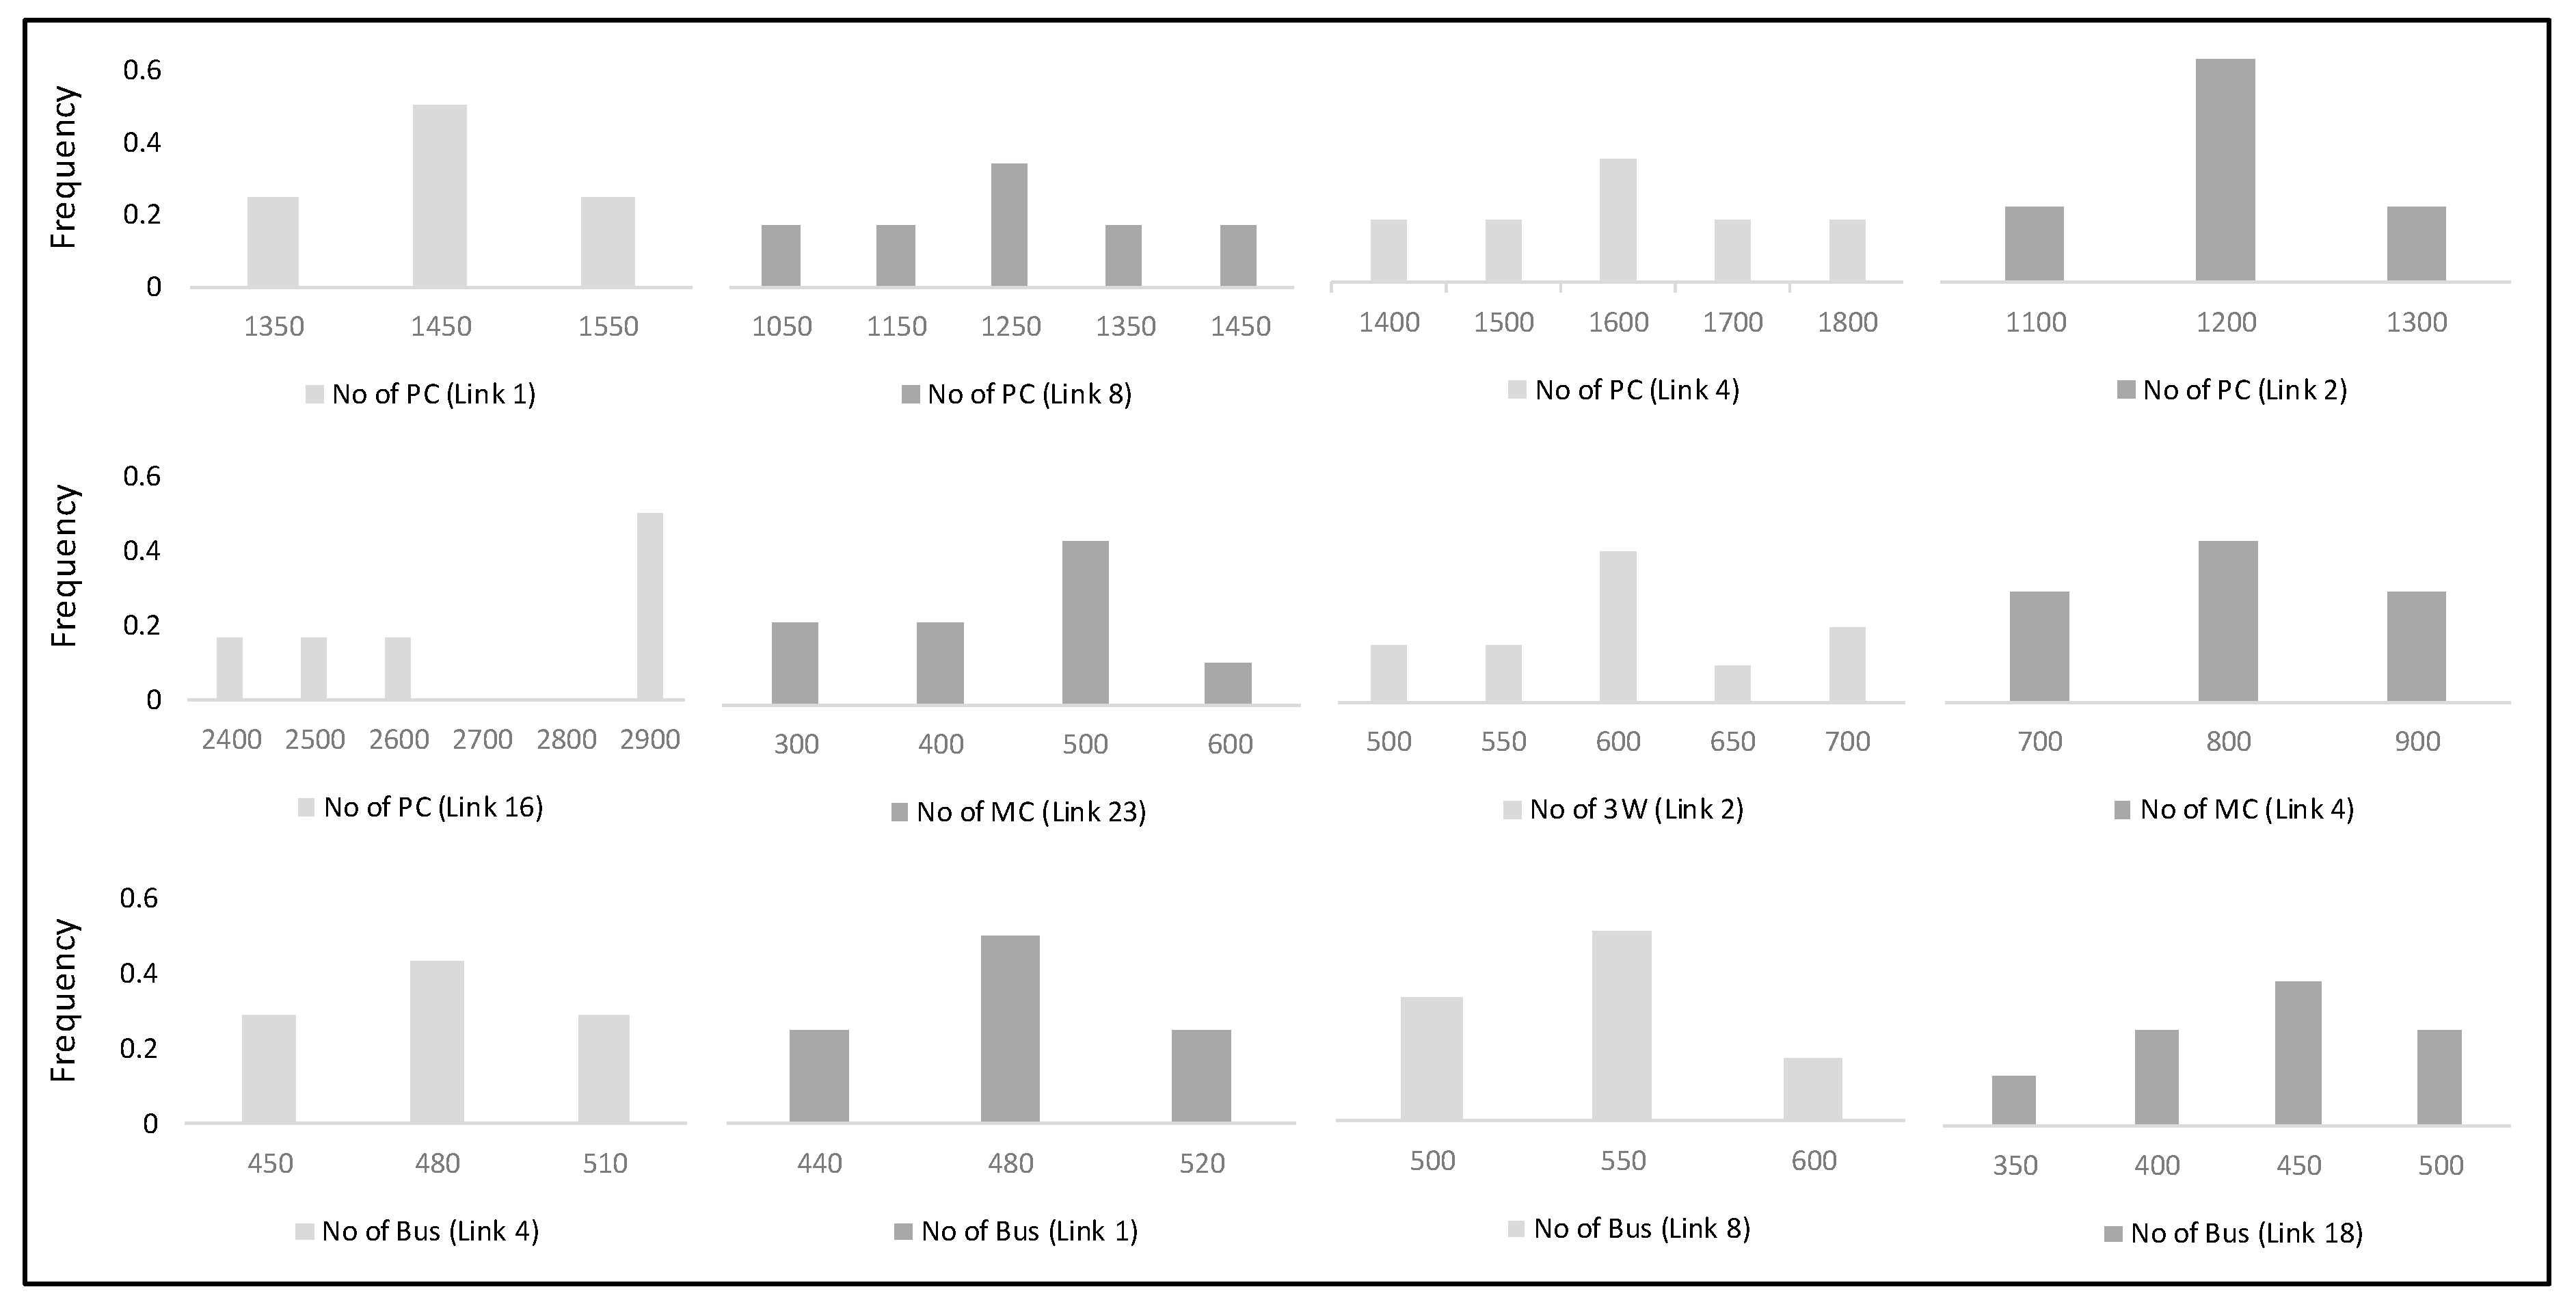
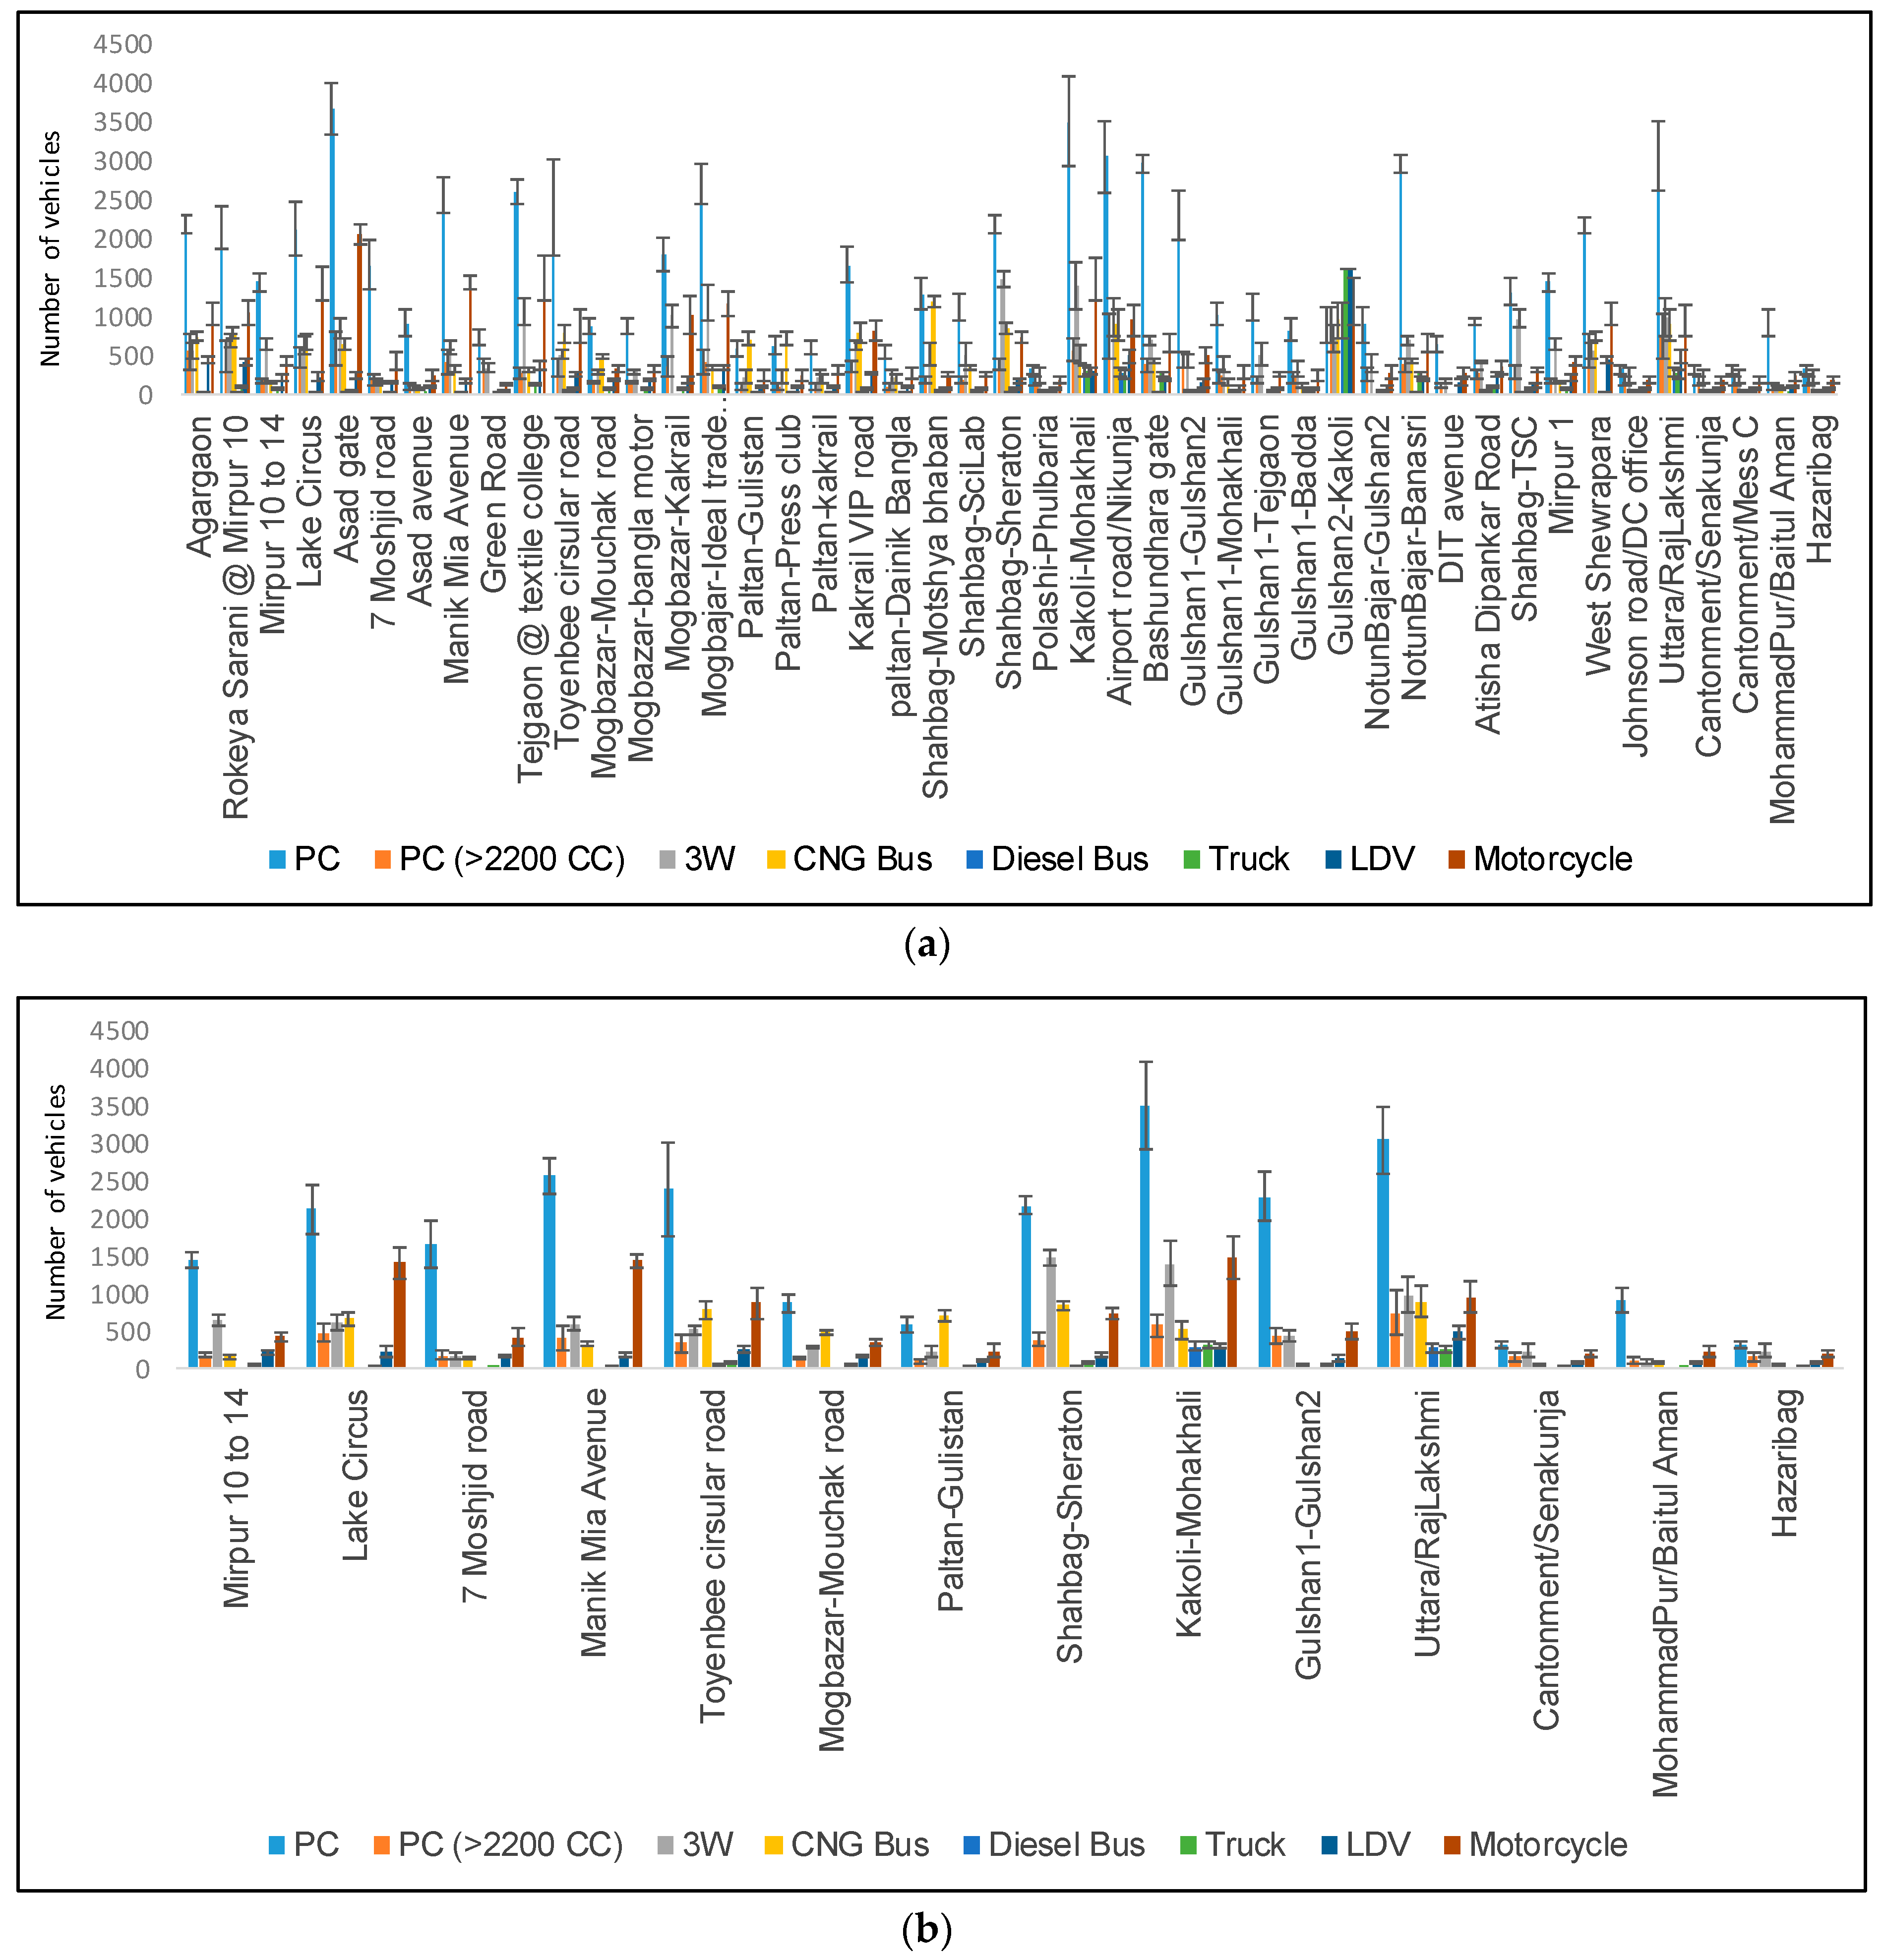
3.1. Characteristics of Traffic Volumes
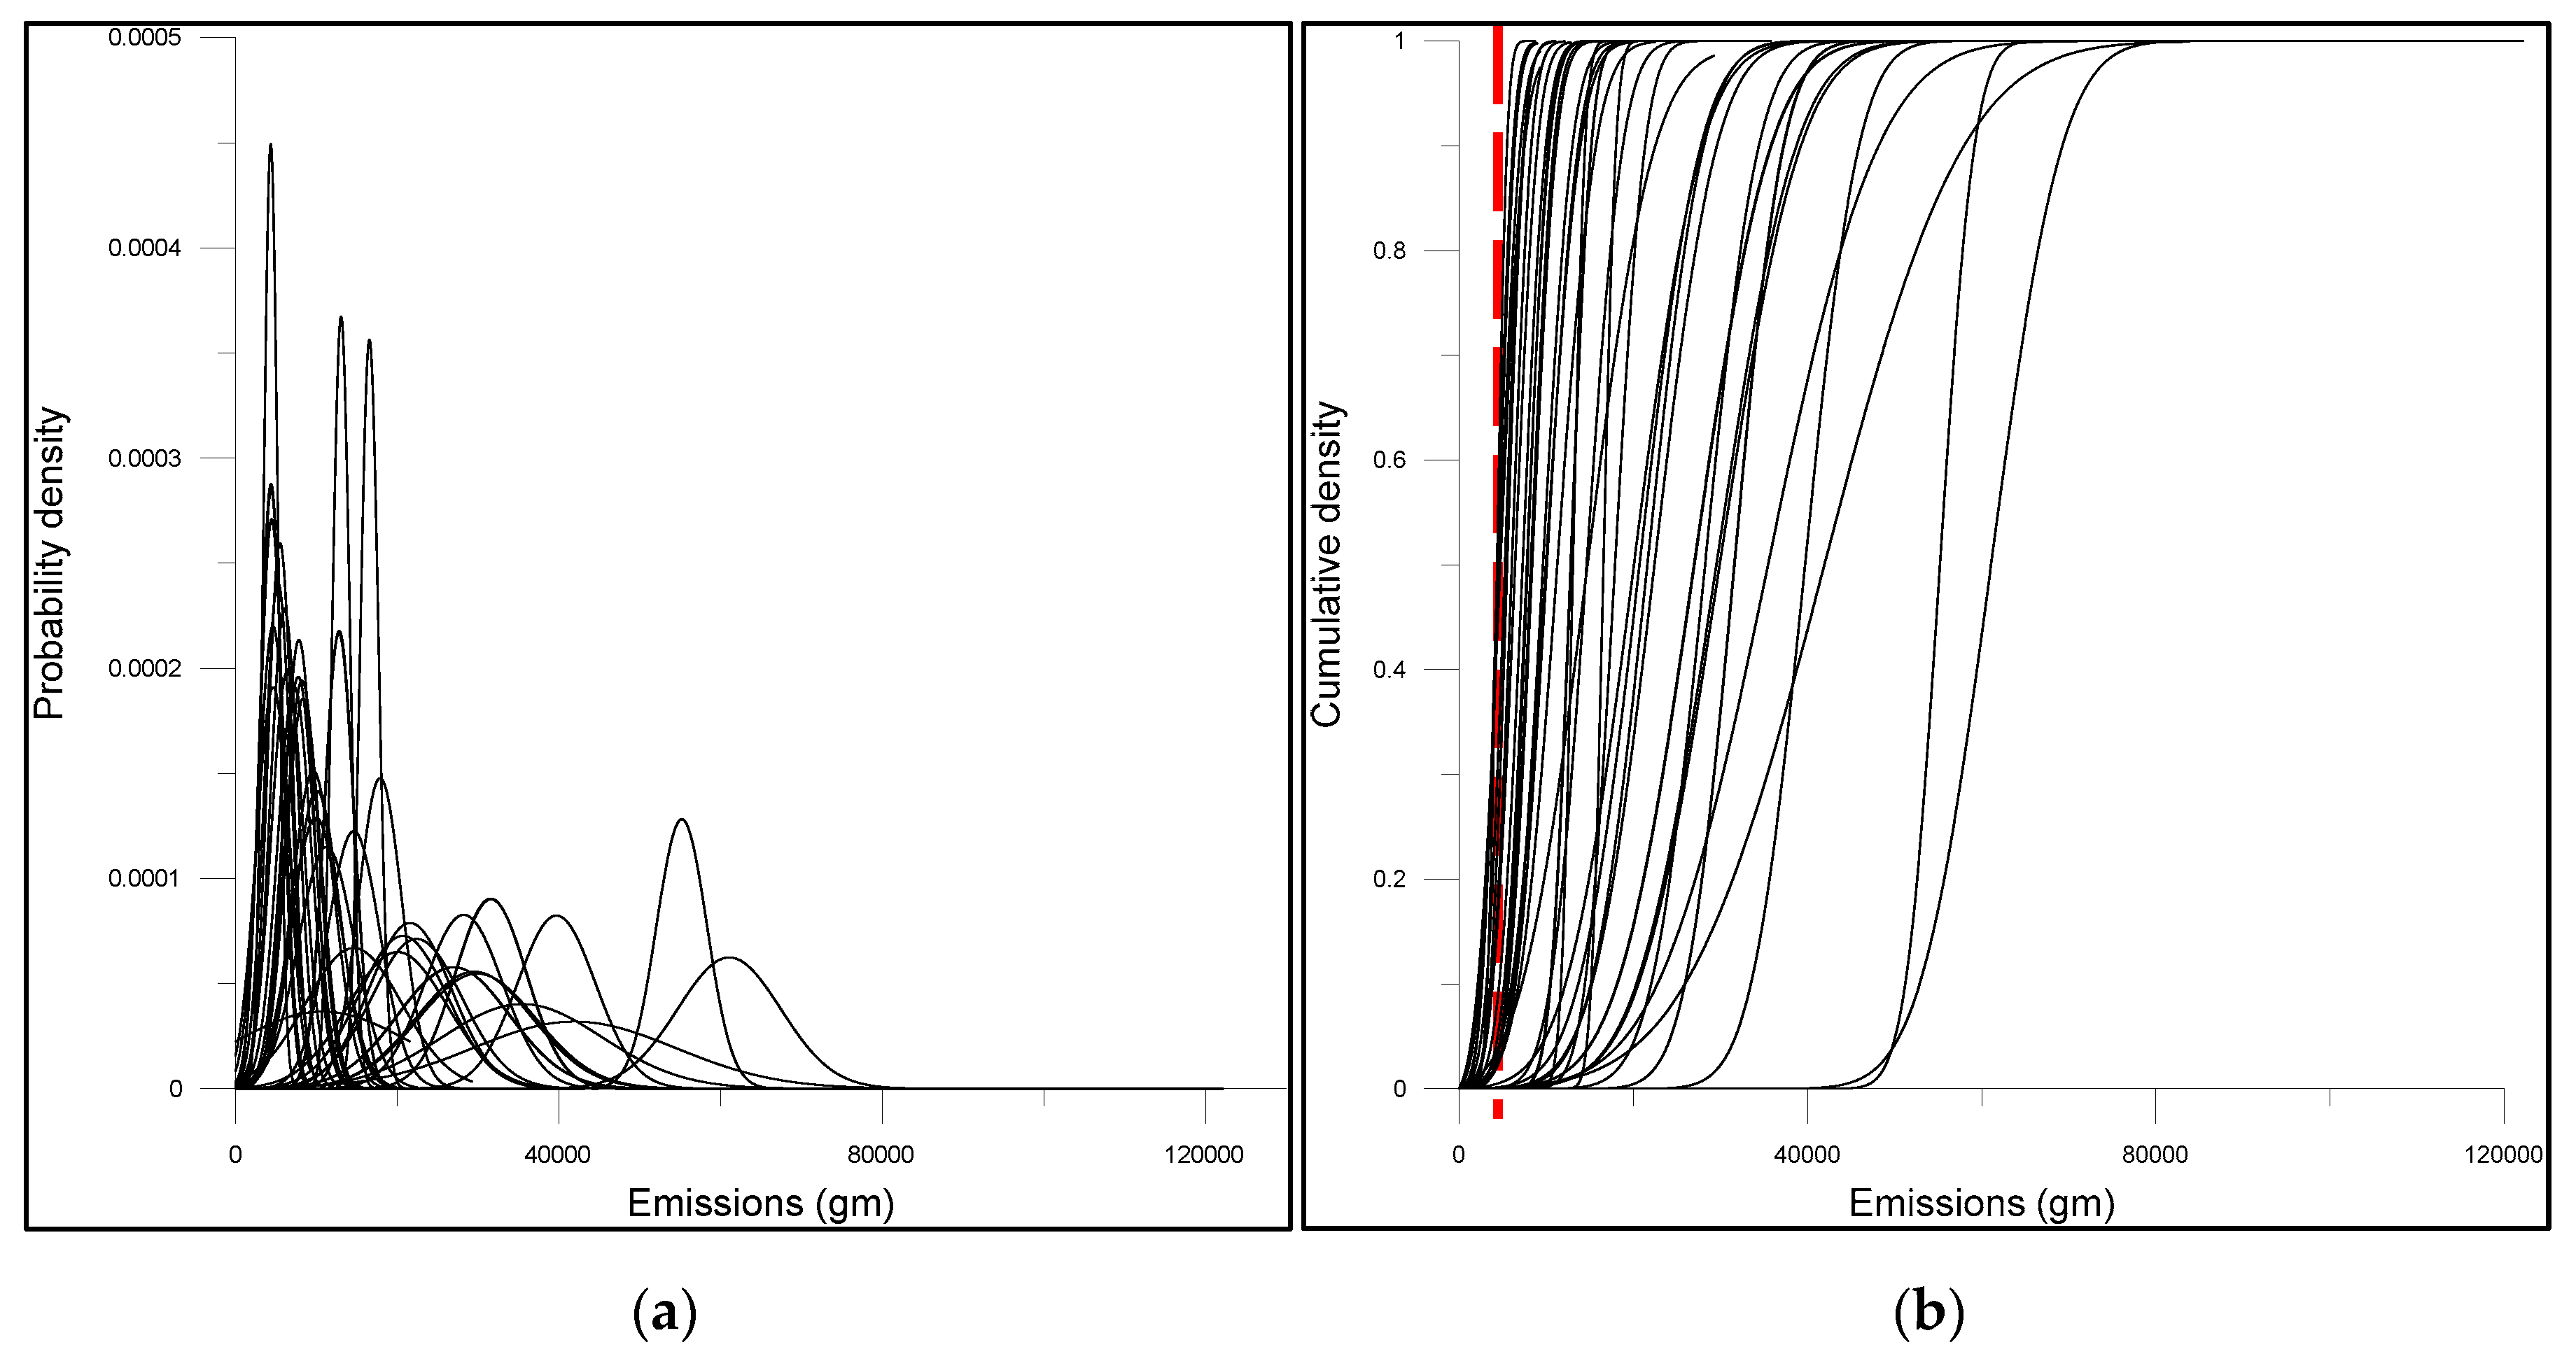
3.2. Emissions and Their Probability
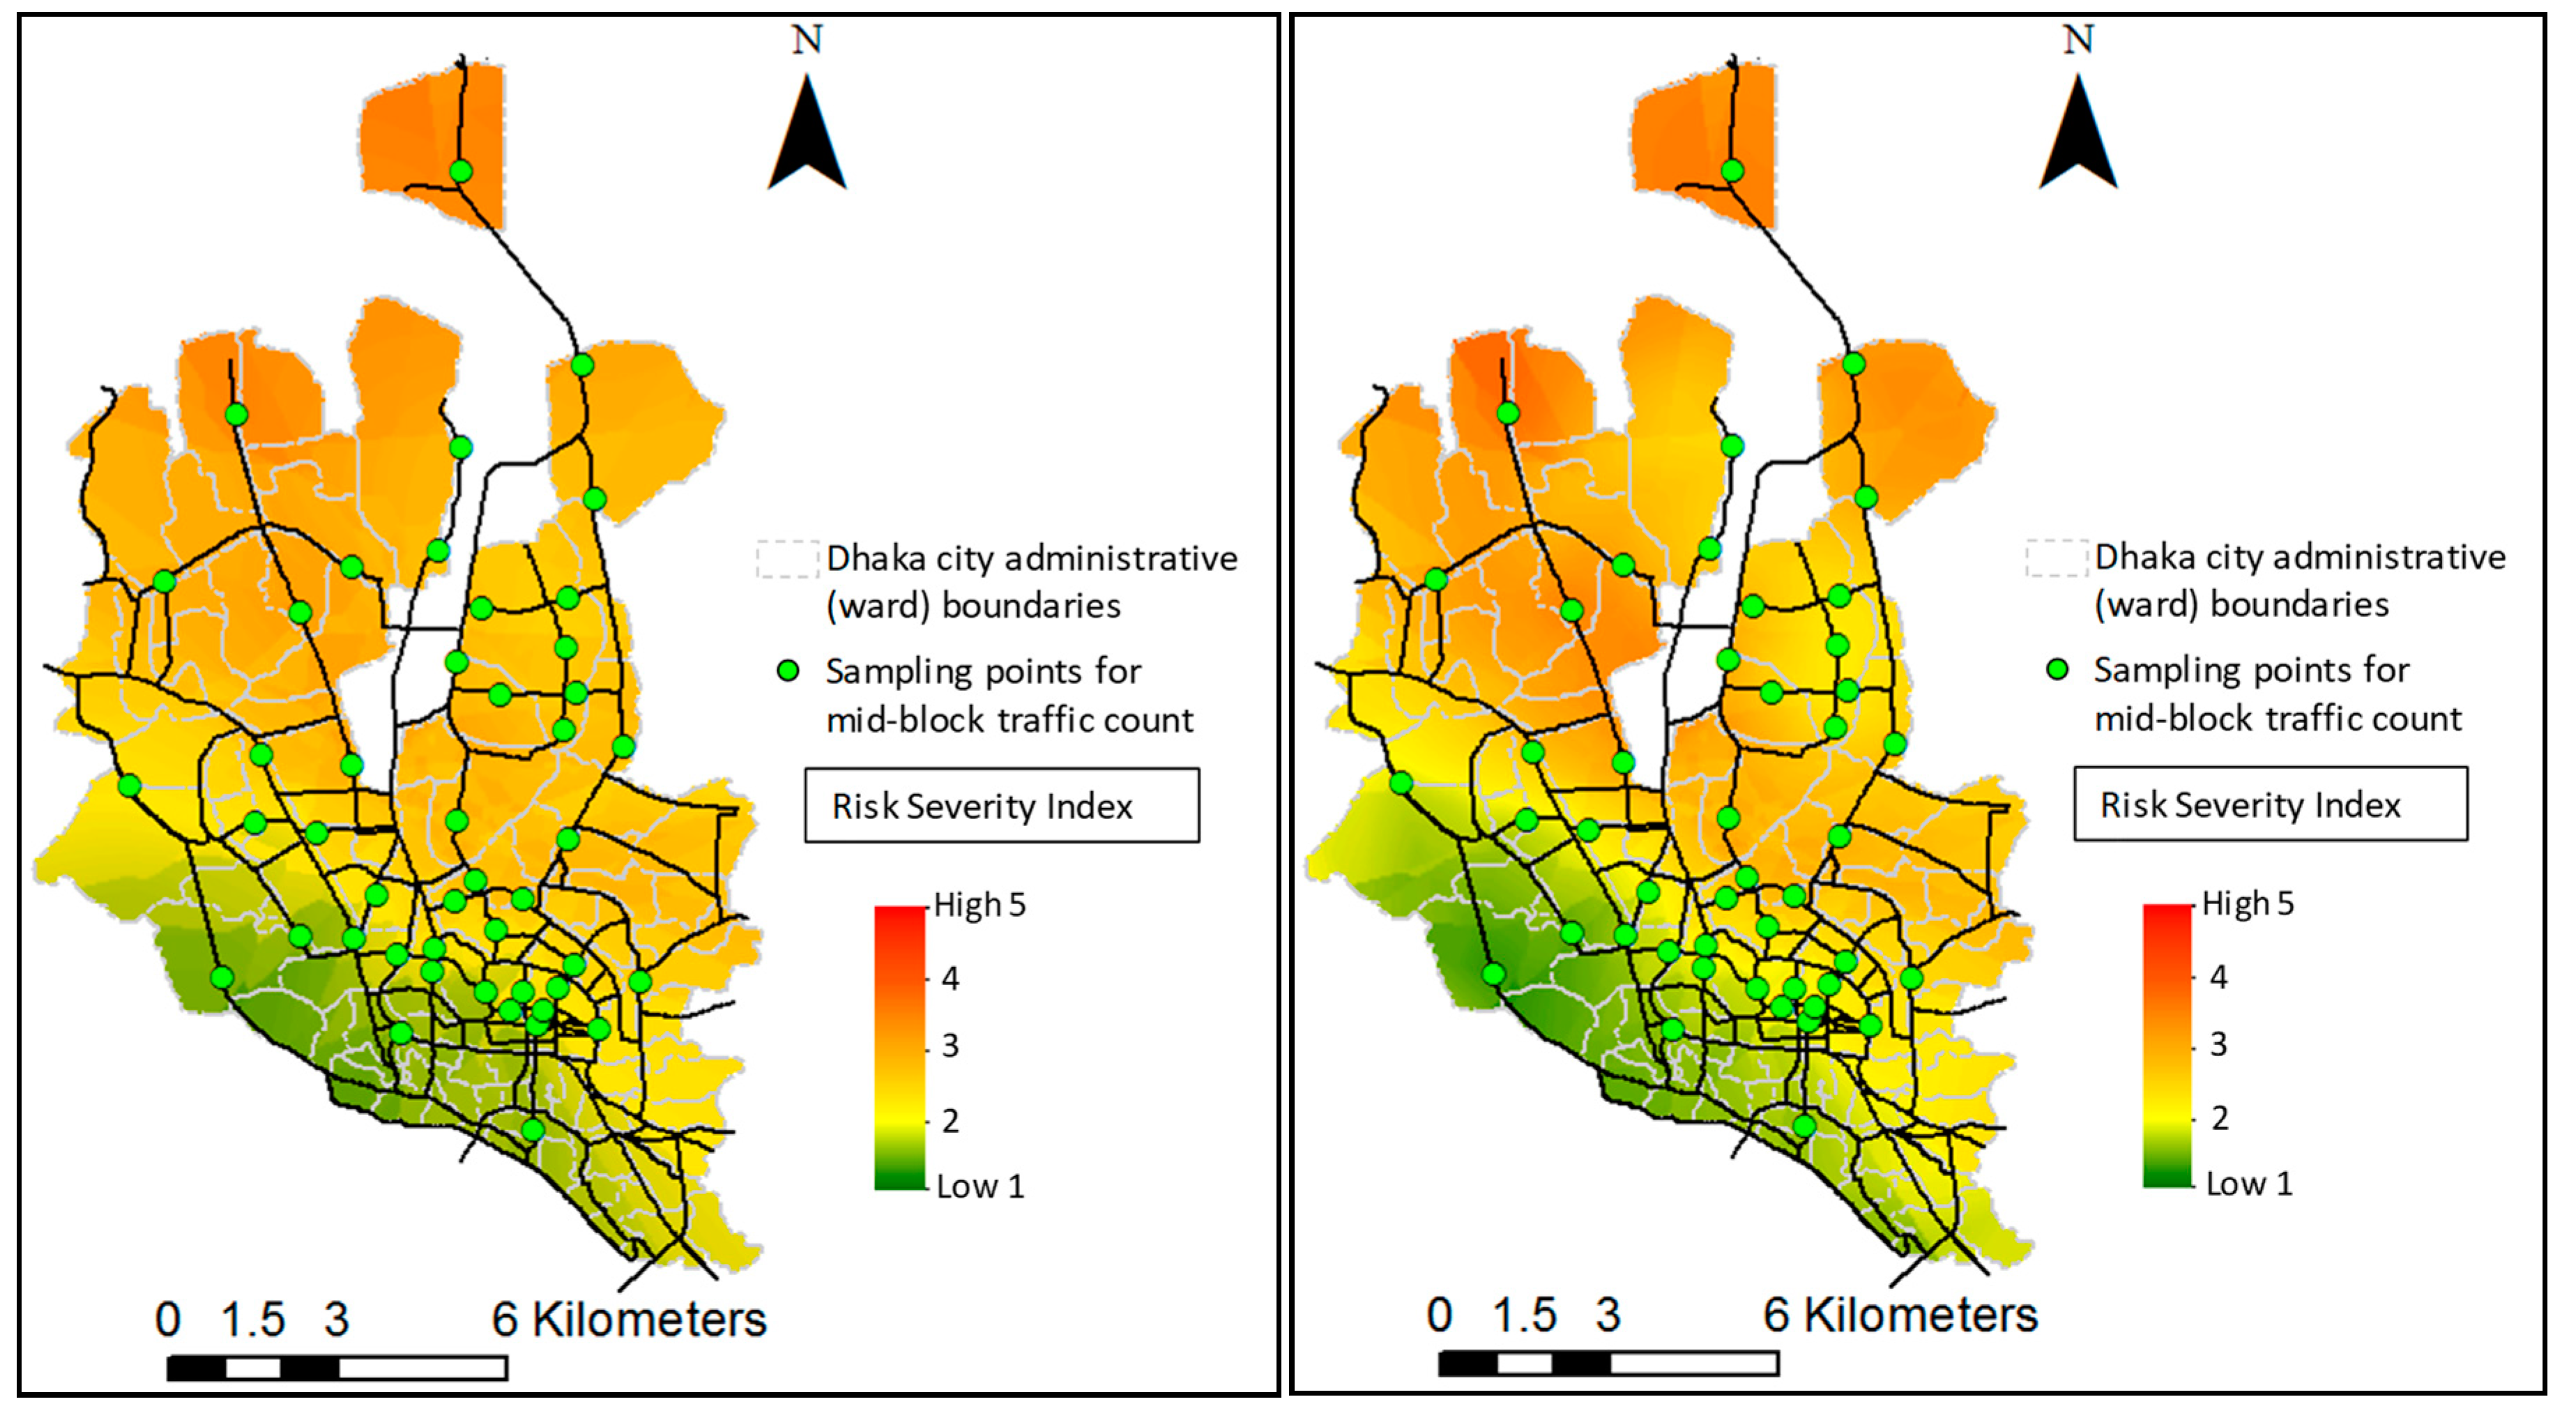
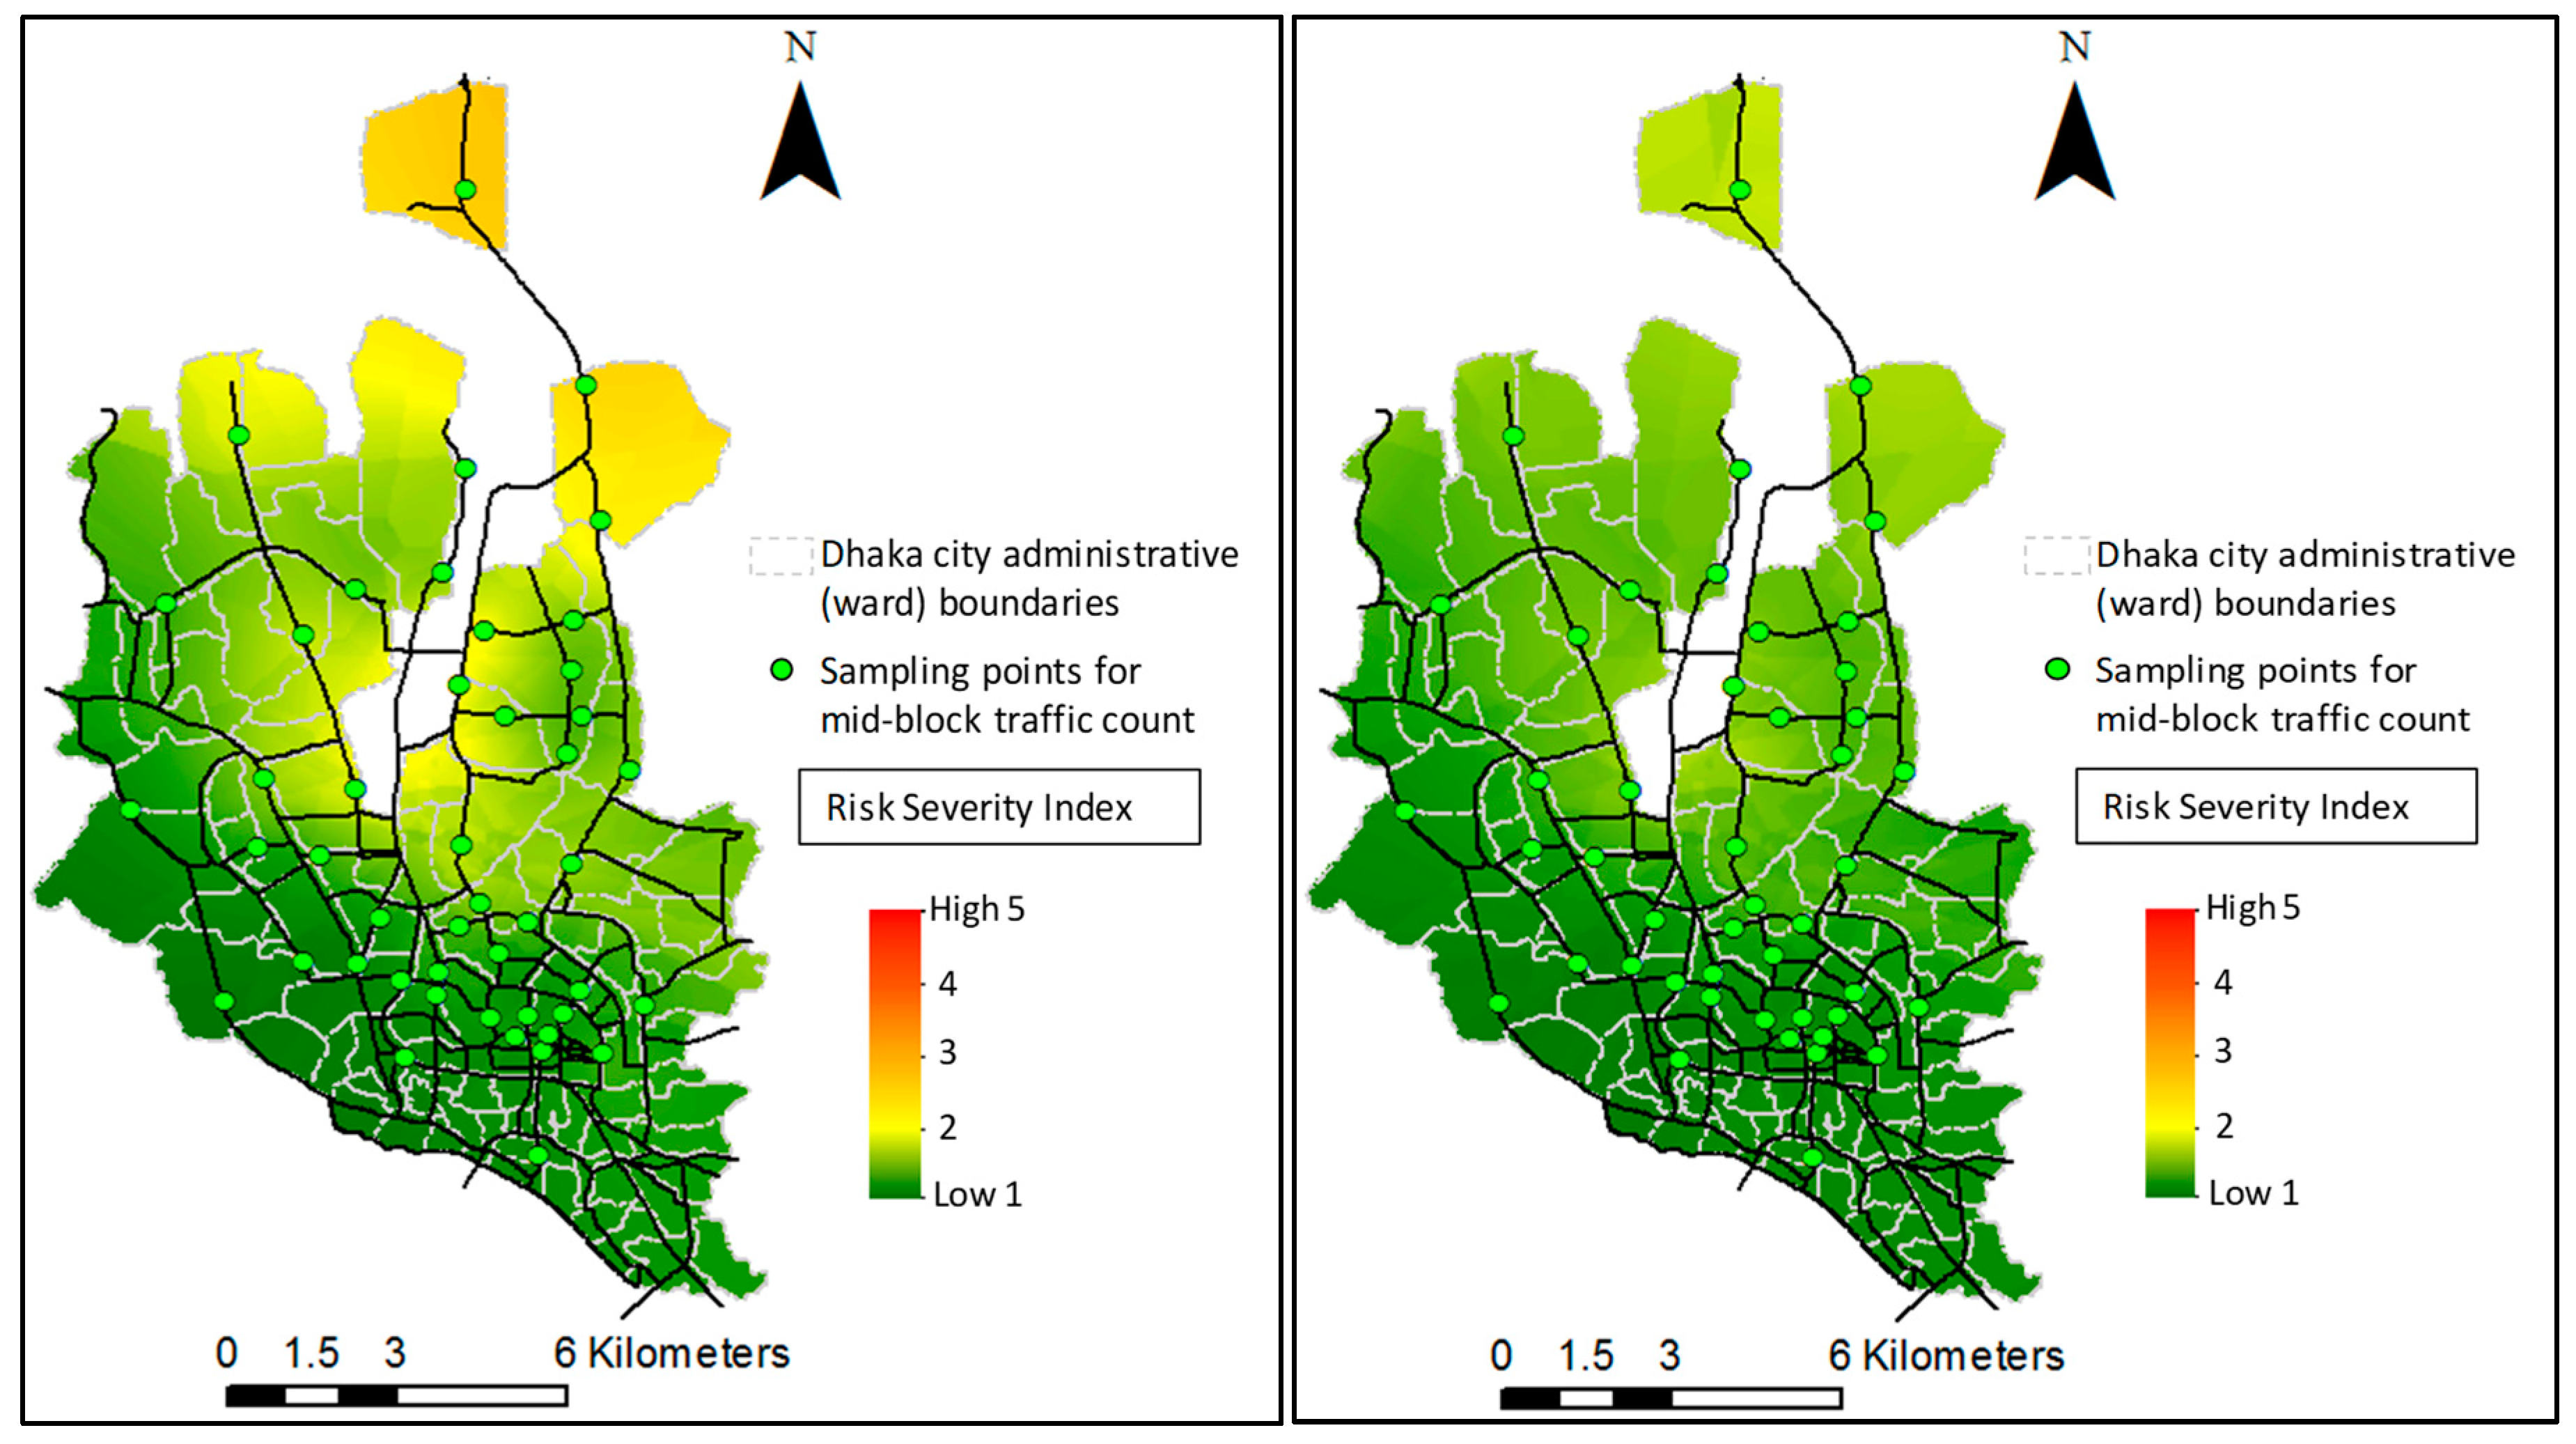
3.3. Risk Severity on City Roads
3.4. Public Transport Planning and Urban Sustainability
4. Conclusions
Author Contributions
Funding
Conflicts of Interest
References
- DTCB. BRT and Corridor Restructuring Implementation Study and Preliminary Design Work for the Uttara-Mohakhali-Ramna-SadarGhat Corridor in Dhaka: Interim Report; Dhaka Transport Coordination Board, Government of Bangladesh: Dhaka, Bangladesh, 2011.
- Bluett, J.; Dey, K.; Fisher, G. Assessing Vehicle Air Pollution Emissions; Report Prepared for Department of the Environment, Water, Heritage and the Arts; Commonwealth of Australia, National Institute for Water and Atmospheric Research: Auckland, New Zealand, 2008. [Google Scholar]
- BTRE. Health Impacts of Transport Emissions in Australia: Economic Costs; Working Paper 63; Bureau of Transport and Regional Economics, Australian Government: Canberra, Australia, 2005.
- Chan, C.K.; Yao, X. Air pollution in mega cities in China. Atmos. Environ. 2008, 42, 1–42. [Google Scholar] [CrossRef]
- EPA Victoria. Vehicle Emissions and Air Quality; Environment Protection Authority Victoria: Melbourne, Australia, 2019. Available online: https://www.epa.vic.gov.au/your-environment/air/vehicle-emissions-and-air-quality (accessed on 14 August 2019).
- Iqbal, A.; Allan, A.; Zito, R. Meso-scale on-road vehicle emission inventory approach: A study on Dhaka City of Bangladesh supporting the ‘cause-effect’ analysis of the transport system. Environ. Monit. Assess. 2016, 188, 149. [Google Scholar] [CrossRef] [PubMed]
- Oanh, N.K.; Upadhyay, N.; Zhuang, Y.H.; Hao, Z.P.; Murthy, D.V.; Lestari, P.; Villarin, J.T.; Chengchua, K.; Co, H.X.; Dung, N.T.; et al. Particulate air pollution in six Asian cities: Spatial and temporal distributions, and associated sources. Atmos. Environ. 2006, 40, 2267–3380. [Google Scholar]
- Shrestha, R.M.; Oanh, N.T.K.; Shrestha, R.P.; Rupakheti, M.; Rajbhandari, S.; Permadi, D.A.; Kanabkaeo, T.; Iyngararasan, M. Atmospheric Brown Cloud (ABC) Emission Inventory Manual; United Nations Environment Programme (UNEP): Nairobi, Kenya, 2013. [Google Scholar]
- US EPA. Greenhouse Gas Emissions from a Typical Passenger Vehicle; United States Environment Protection Authority: Washington, DC, USA, 2019. Available online: https://www.epa.gov/greenvehicles/greenhouse-gas-emissions-typical-passenger-vehicle (accessed on 14 August 2019).
- US EPA. 2014 National Emissions Inventory (NEI) Data; Version 2; United States Environment Protection Authority: Washington, DC, USA, 2019. Available online: https://www.epa.gov/air-emissions-inventories/2014-national-emissions-inventory-nei-data (accessed on 12 August 2019).
- DEFRA. Trends in Primary Nitrogen Dioxide in the UK; Air Quality Experts Group, Department of Environment, Food, and Rural Affairs: London, UK, 2007.
- Burgard, D.A.; Bishop, G.A.; Stedman, D.H.; Gessner, V.H.; Daeschlein, C. Remote Sensing of In-Use Heavy-Duty Diesel Trucks. Environ. Sci. Technol. 2006, 40, 6938–6942. [Google Scholar] [CrossRef] [PubMed]
- Xu, X.; Wang, L.; Niu, T. Air pollution and its health effects in Beijing. Ecosyst. Health 1998, 4, 199–209. [Google Scholar] [CrossRef]
- VTPI. Transportation Cost and Benefit Analysis—Air Pollution Costs; Victoria Transport Policy Institute: Victoria, BC, Canada, 2007. [Google Scholar]
- Nakai, S.; Nitta, H.; Maeda, K. Respiratory health associated with exposure to automobile exhaust. II. Personal NO2 exposure levels according to distance from the roadside. J. Expo. Anal. Environ. Epidemiol. 1995, 5, 125–136. [Google Scholar] [PubMed]
- Nitta, H.; Sato, T.; Nakai, S.; Maeda, K.; Aoki, S.; Ono, M. Respiratory Health Associated with Exposure to Automobile Exhaust. I. Results of Cross-sectional Studies in 1979, 1982, and 1983. Arch. Environ. Health Int. J. 1993, 48, 53–58. [Google Scholar] [CrossRef] [PubMed]
- Frey, H.C.; Zheng, J.; Frey, H. Probabilistic Analysis of Driving Cycle-Based Highway Vehicle Emission Factors. Environ. Sci. Technol. 2002, 36, 5184–5191. [Google Scholar] [CrossRef] [PubMed]
- Ryan, R.O.; Benavides, C.; Díaz, M.; Martín, J.P.S.; Mallea, J. Using probabilistic analysis to improve greenhouse gas baseline forecasts in developing country contexts: The case of Chile. Clim. Policy 2018, 19, 299–314. [Google Scholar] [CrossRef]
- EEA. EMEP/EEA Air Pollutant Emission Inventory Guidebook; European Environment Agency: Copenhagen, Denmark, 2009. Available online: http://www.eea.europa.eu/publications/emep-eea-emission-inventory-guidebook-2009 (accessed on 4 August 2019).
- BRTA. Registered Vehicles in Dhaka: Statistics; Bangladesh Road Transport Authority: Dhaka, Bangladesh, 2018. Available online: www.brta.gov.bd (accessed on 18 February 2019).
- Maphill. Savanna Style Location Map of Bangladesh. 2019. Available online: http://www.maphill.com/bangladesh/location-maps/savanna-style-map/ (accessed on 25 October 2019).
- JICA. Preparatory Survey Report on Dhaka Urban Transport Network Development Study (DHUTS) in Bangladesh: Final Report (Appendix Volume); Japan International Cooperation Agency: Tokyo, Japan, 2010. Available online: http://open_jicareport.jica.go.jp/pdf/11996782_01.pdf (accessed on 2 September 2019).
- Iqbal, A.; Allan, A. Modelling eco-efficiency for vehicular emissions from the perspective of dhaka city: Development of a tool for sustainable transport planning. In Proceedings of the 14th International Conference on Computers in Urban Planning and Urban Management, Cambridge, MA, USA, 7–10 July 2015. [Google Scholar]
- CL4. User’s Guide for CL4: A User Friendly Interface for the CALINE4 Model for Transportation Project Impact Assessments; California Line Source Dispersion Model Version 4 (CALINE4); California Department of Transportation: Sacramento, CA, USA, 1998. [Google Scholar]
- US EPA. Preferred Dispersion Models; Support Center for Regulatory and Atmospheric Modeling, US Environment Protection Agency: Washington, DC, USA, 2011. Available online: https://www.epa.gov/scram/air-quality-dispersion-modeling-preferred-and-recommended-models (accessed on 18 February 2019).
- BMD. Statistics; Bangladesh Meteorological Department, Government of Bangladesh: Dhaka, Bangladesh, 2018. [Google Scholar]
- World Weather Online. Dhaka Monthly Climate Averages. 2019. Available online: https://www.worldweatheronline.com/ (accessed on 29 August 2019).
- Vallack, H. Male Declaration Project as a Part of Capacity Building Activity. In Emission Inventory for Bangladesh; United Nations Environment Programme (UNEP): Nairobi, Kenya; Regional Resources Center for Asia and Pacific (RRCAP): Pathumthani, Thailand, 2000. [Google Scholar]
- Iqbal, A.; Oanh, N.T.K. Assessment of acid deposition over Dhaka division using CAMx-MM5 modeling system. Atmos. Pollut. Res. 2011, 2, 452–462. [Google Scholar] [CrossRef]
- DoE. Clean Air and Sustainable Environment Project. In Monthly Air Quality Monitoring Report for 2018; Department of Environment, Ministry of Environment and Forests, Government of the People’s Republic of Bangladesh: Dhaka, Bangladesh, 2018. Available online: http://case.doe.gov.bd/index.php?option=com_content&view=article&id=5&Itemid=9 (accessed on 24 June 2019).
- WHO. WHO Air Quality Guidelines for Particulate Matter, Ozone, Nitrogen Dioxide and Sulfur Dioxide; Global Update 2005; World Health Organization: Geneva, Switzerland, 2005. [Google Scholar]
- ACS. Risk Rating and Assessment; American Chemical Society: Washington, DC, USA, 2019; Available online: https://www.acs.org/content/acs/en/chemical-safety/hazard-assessment/fundamentals/risk-assessment.html (accessed on 24 June 2019).
- Garvey, P.R. Track 2: Implementing a Risk Management Process for a Large Scale Information System Upgrade—A Case Study. Insight 2001, 4, 15–22. [Google Scholar] [CrossRef]
- DoE. Clean Air and Sustainable Environment Project. In Revisions of Vehicular Emission Standards for Bangladesh; Department of Environment, Ministry of Environment and Forests, Government of the People’s Republic of Bangladesh: Dhaka, Bangladesh, 2012. Available online: http://case.doe.gov.bd/file_zone/feedback/Revisions%20of%20Vehicular%20Emission%20Standards%20for%20Bangladesh.pdf (accessed on 15 May 2019).
- Iqbal, A.; Allan, A.; Afroze, S. Analysis of transport eco-efficiency scenarios to support sustainability assessment: A study on Dhaka City, Bangladesh. Environ. Monit. Assess. 2017, 189, 366. [Google Scholar] [CrossRef] [PubMed]


| NOx Emissions (gm/gm of Fuel) N1 | Fuel Consumption (FC) (gm/km) N2 | FC Equation Variables and Their Values for Different Vehicles b | ||||||
|---|---|---|---|---|---|---|---|---|
| a | b | c | d | e | f | |||
| Gasoline | ||||||||
| Passenger Car (Euro 2/Euro 4) | (a + c × v + e × v2)/(1 + b × v + d × v2) | |||||||
| < 1.4 L | 0.016878/0.001107 | 208/136 | 0.107/0.026 | −0.565/−1.65 | −0.0005/0.000228 | 0.0143/0.0312 | ||
| 1.4–2.0 L | 0.014768/0.000939 | 347/174 | 0.217/0.0685 | 2.73/0.364 | −0.00091/−0.000247 | 0.00428/0.00874 | ||
| > 2.0 L | 0.012658/0.000674 | 1540/285 | 0.869/0.0728 | 19.1/−0.137 | −0.00363/−0.000416 | |||
| LDV (Conventional/Euro 4) | 0.012658/0.00064 | (a + c × v + e × v2)/(1 + b × v + d × v2) | 1540/285 | 0.869/0.0728 | 19.1/−0.137 | −0.00363/−0.000416 | ||
| MC−4 (> 50 cc) (Euro 2/Euro 4) | 0.021097/0.005388 | a + b × v + c × v2 + d × v3 + e × v4 + f × v5 | 87.94/81.14 | −4.081/−3.764 | 0.1095/0.1009 | −0.001543/−0.001423 | 1.15 × 10⁻⁵/1.06 × 10−5 | −3.442 × 10⁻⁸/−3.17 × 10−8 |
| Diesel | ||||||||
| LDV (conventional/Euro 3) | 0.083436/0.011573 | 0.02113v2 − 2.65v + 148.91 | ||||||
| HDV Truck (Euro 1/Euro 3) | 0.041718/0.02104 | ((a × (bv)) × (vc)) | 1324.255/1065.897 | 1.012839/1.0174198 | −0.8054/−0.85958 | |||
| HDV Bus (Euro 1/Euro 3) | 0.012564/0.025628 | ((a × (bv)) × (vc)) | 4075.513/2256.533 | 1.012972/1.0107409 | −0.9355/−0.80861 | |||
| CNG | ||||||||
| Passenger Car (Euro 2/Euro 4) (all capacities) | 0.0105/0.001105 | 0.00720v2 − 0.9250v + 74.625 | ||||||
| LDV (>2.0 L) (Euro 2/Euro 4) | 0.009/0.00063 | 0.00720v2 − 0.9250v + 74.625 | ||||||
| HDV bus (Euro 4) | 0.0114 | ((a × (bv)) × (vc)) | 4075.513/2256.533 | 1.012972/1.0107409 | −0.9355/−0.80861 | |||
| 3W (<1.4 L) (Euro 2/Euro 4) | 0.0105/0.001105 | 0.00720v2 − 0.9250v + 74.625 | ||||||
| Probability | Severity | |||
|---|---|---|---|---|
| Severe-4 | Critical-3 | Marginal-2 | Negligible-1 | |
| Strong-5 | Extreme (20) | Acute (15) | Major (10) | Minor (5) |
| High-4 | Acute (16) | Major (12) | Modest (8) | Minor (4) |
| Medium-3 | Major (12) | Modest (9) | Modest (6) | Minor (3) |
| Low-2 | Modest (8) | Modest (6) | Minor (4) | Minor (2) |
| Improbable-1 | Minor (4) | Minor (3) | Minor (2) | Minor (1) |
© 2019 by the authors. Licensee MDPI, Basel, Switzerland. This article is an open access article distributed under the terms and conditions of the Creative Commons Attribution (CC BY) license (http://creativecommons.org/licenses/by/4.0/).
Share and Cite
Iqbal, A.; Afroze, S.; Rahman, M.M. Probabilistic Health Risk Assessment of Vehicular Emissions as an Urban Health Indicator in Dhaka City. Sustainability 2019, 11, 6427. https://doi.org/10.3390/su11226427
Iqbal A, Afroze S, Rahman MM. Probabilistic Health Risk Assessment of Vehicular Emissions as an Urban Health Indicator in Dhaka City. Sustainability. 2019; 11(22):6427. https://doi.org/10.3390/su11226427
Chicago/Turabian StyleIqbal, Asif, Shirina Afroze, and Md. Mizanur Rahman. 2019. "Probabilistic Health Risk Assessment of Vehicular Emissions as an Urban Health Indicator in Dhaka City" Sustainability 11, no. 22: 6427. https://doi.org/10.3390/su11226427
APA StyleIqbal, A., Afroze, S., & Rahman, M. M. (2019). Probabilistic Health Risk Assessment of Vehicular Emissions as an Urban Health Indicator in Dhaka City. Sustainability, 11(22), 6427. https://doi.org/10.3390/su11226427