Impacts of Clean Energy Substitution for Polluting Fossil-Fuels in Terminal Energy Consumption on the Economy and Environment in China
Abstract
:1. Introduction
2. Methodology and Data
2.1. ARIMA Regression
2.2. CGE Model
2.2.1. Nested Structure of Energy Consumption for Production Sectors
2.2.2. Data and Closure
2.2.3. Simulation Scenario Design
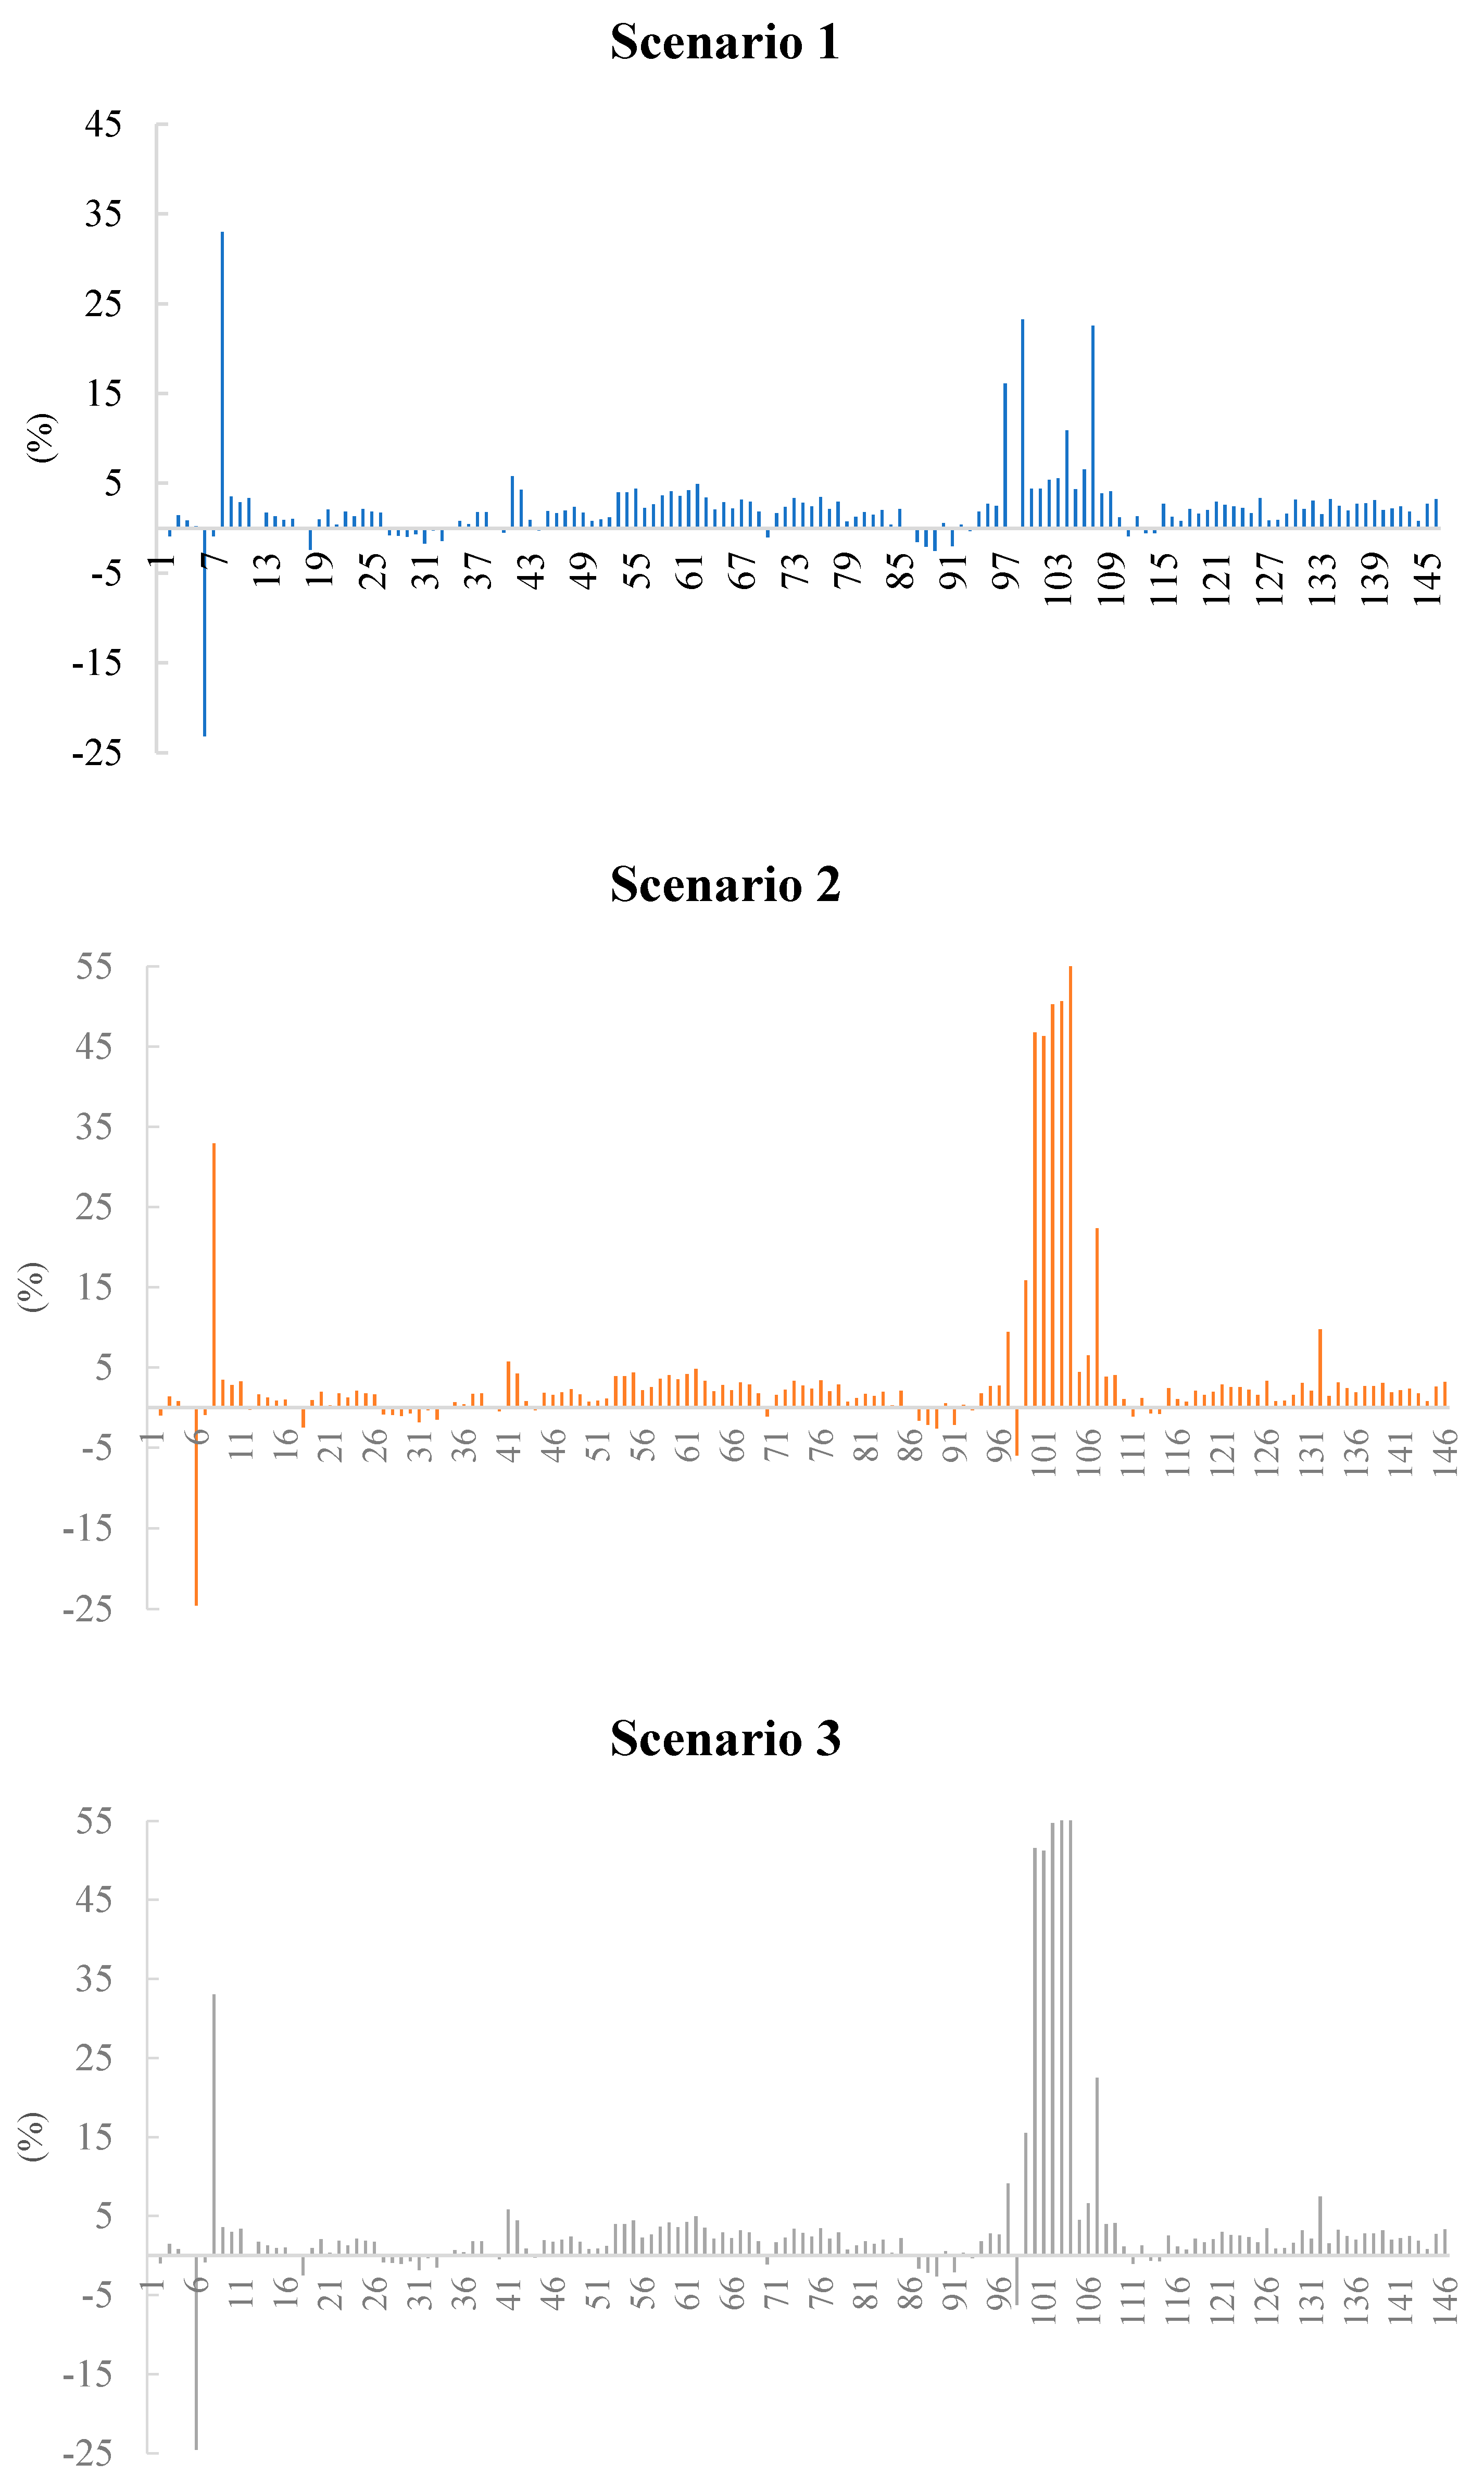
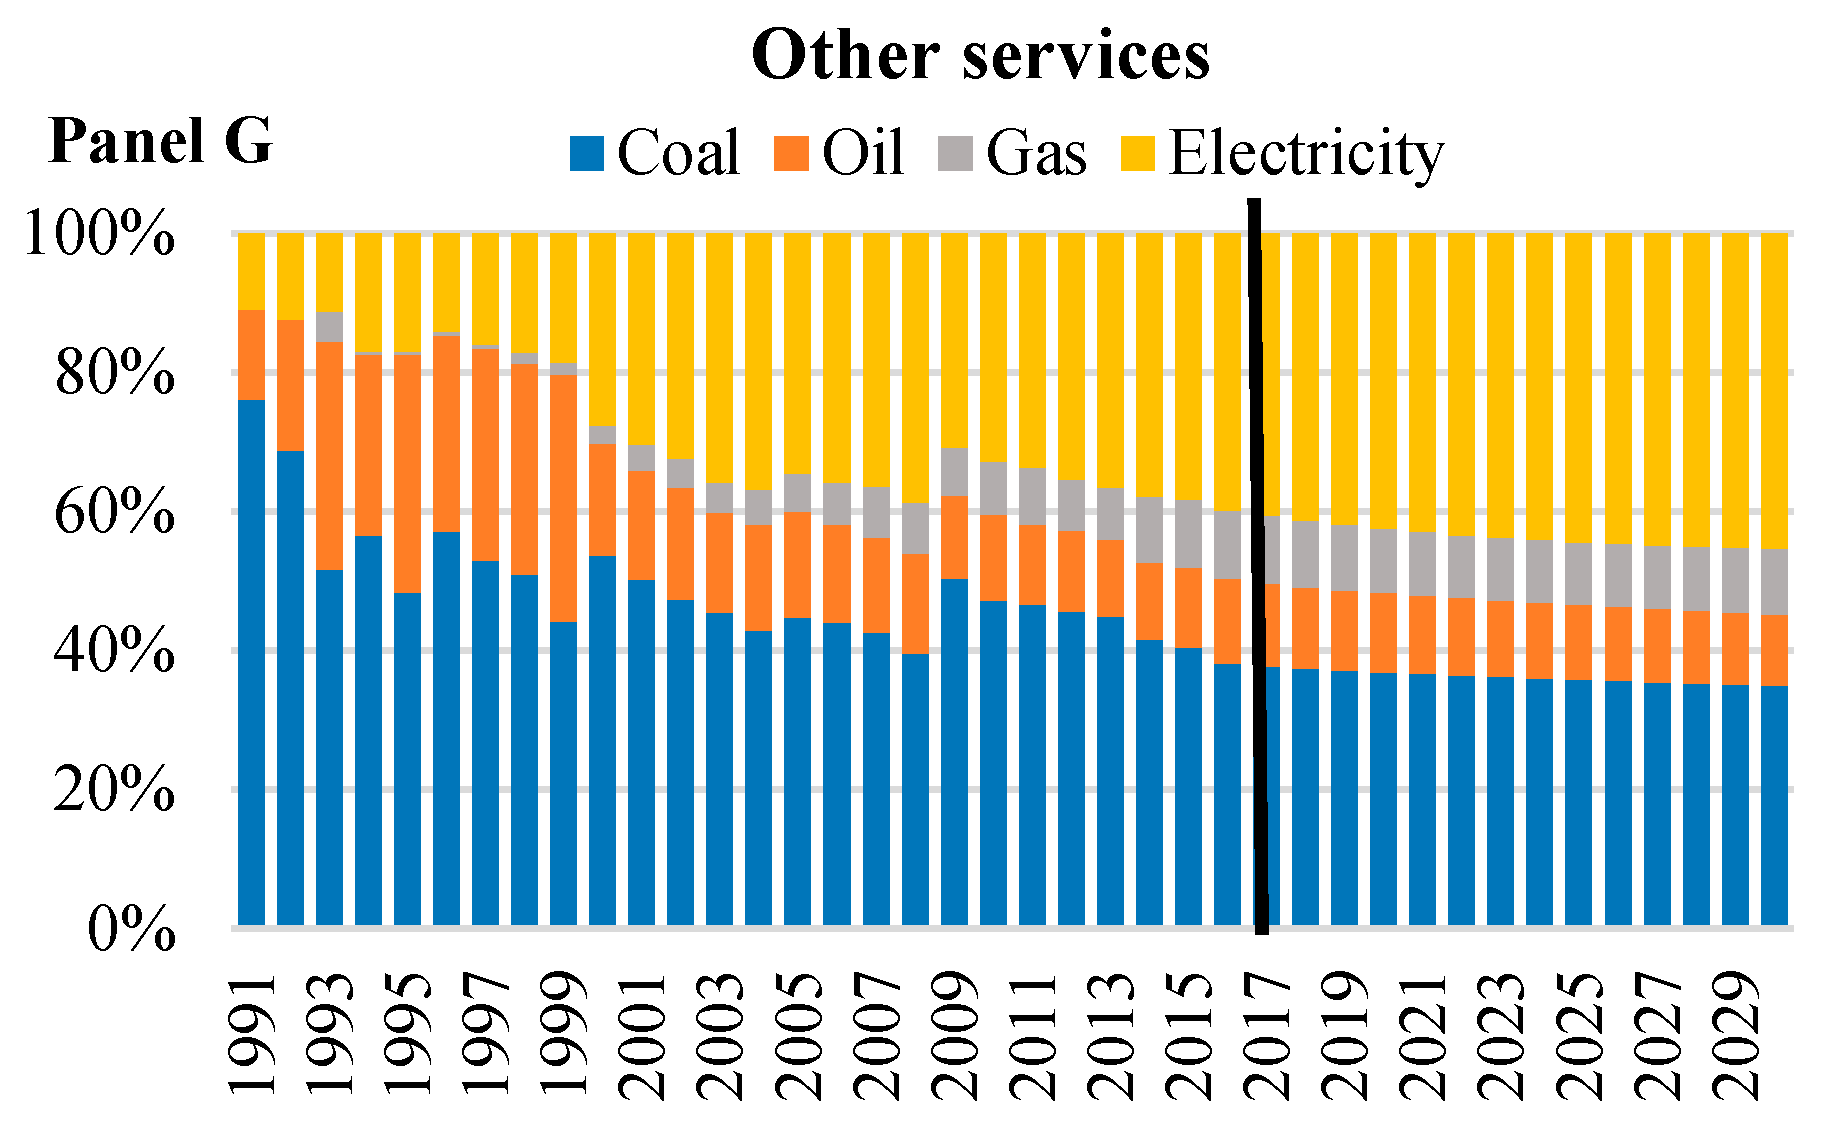
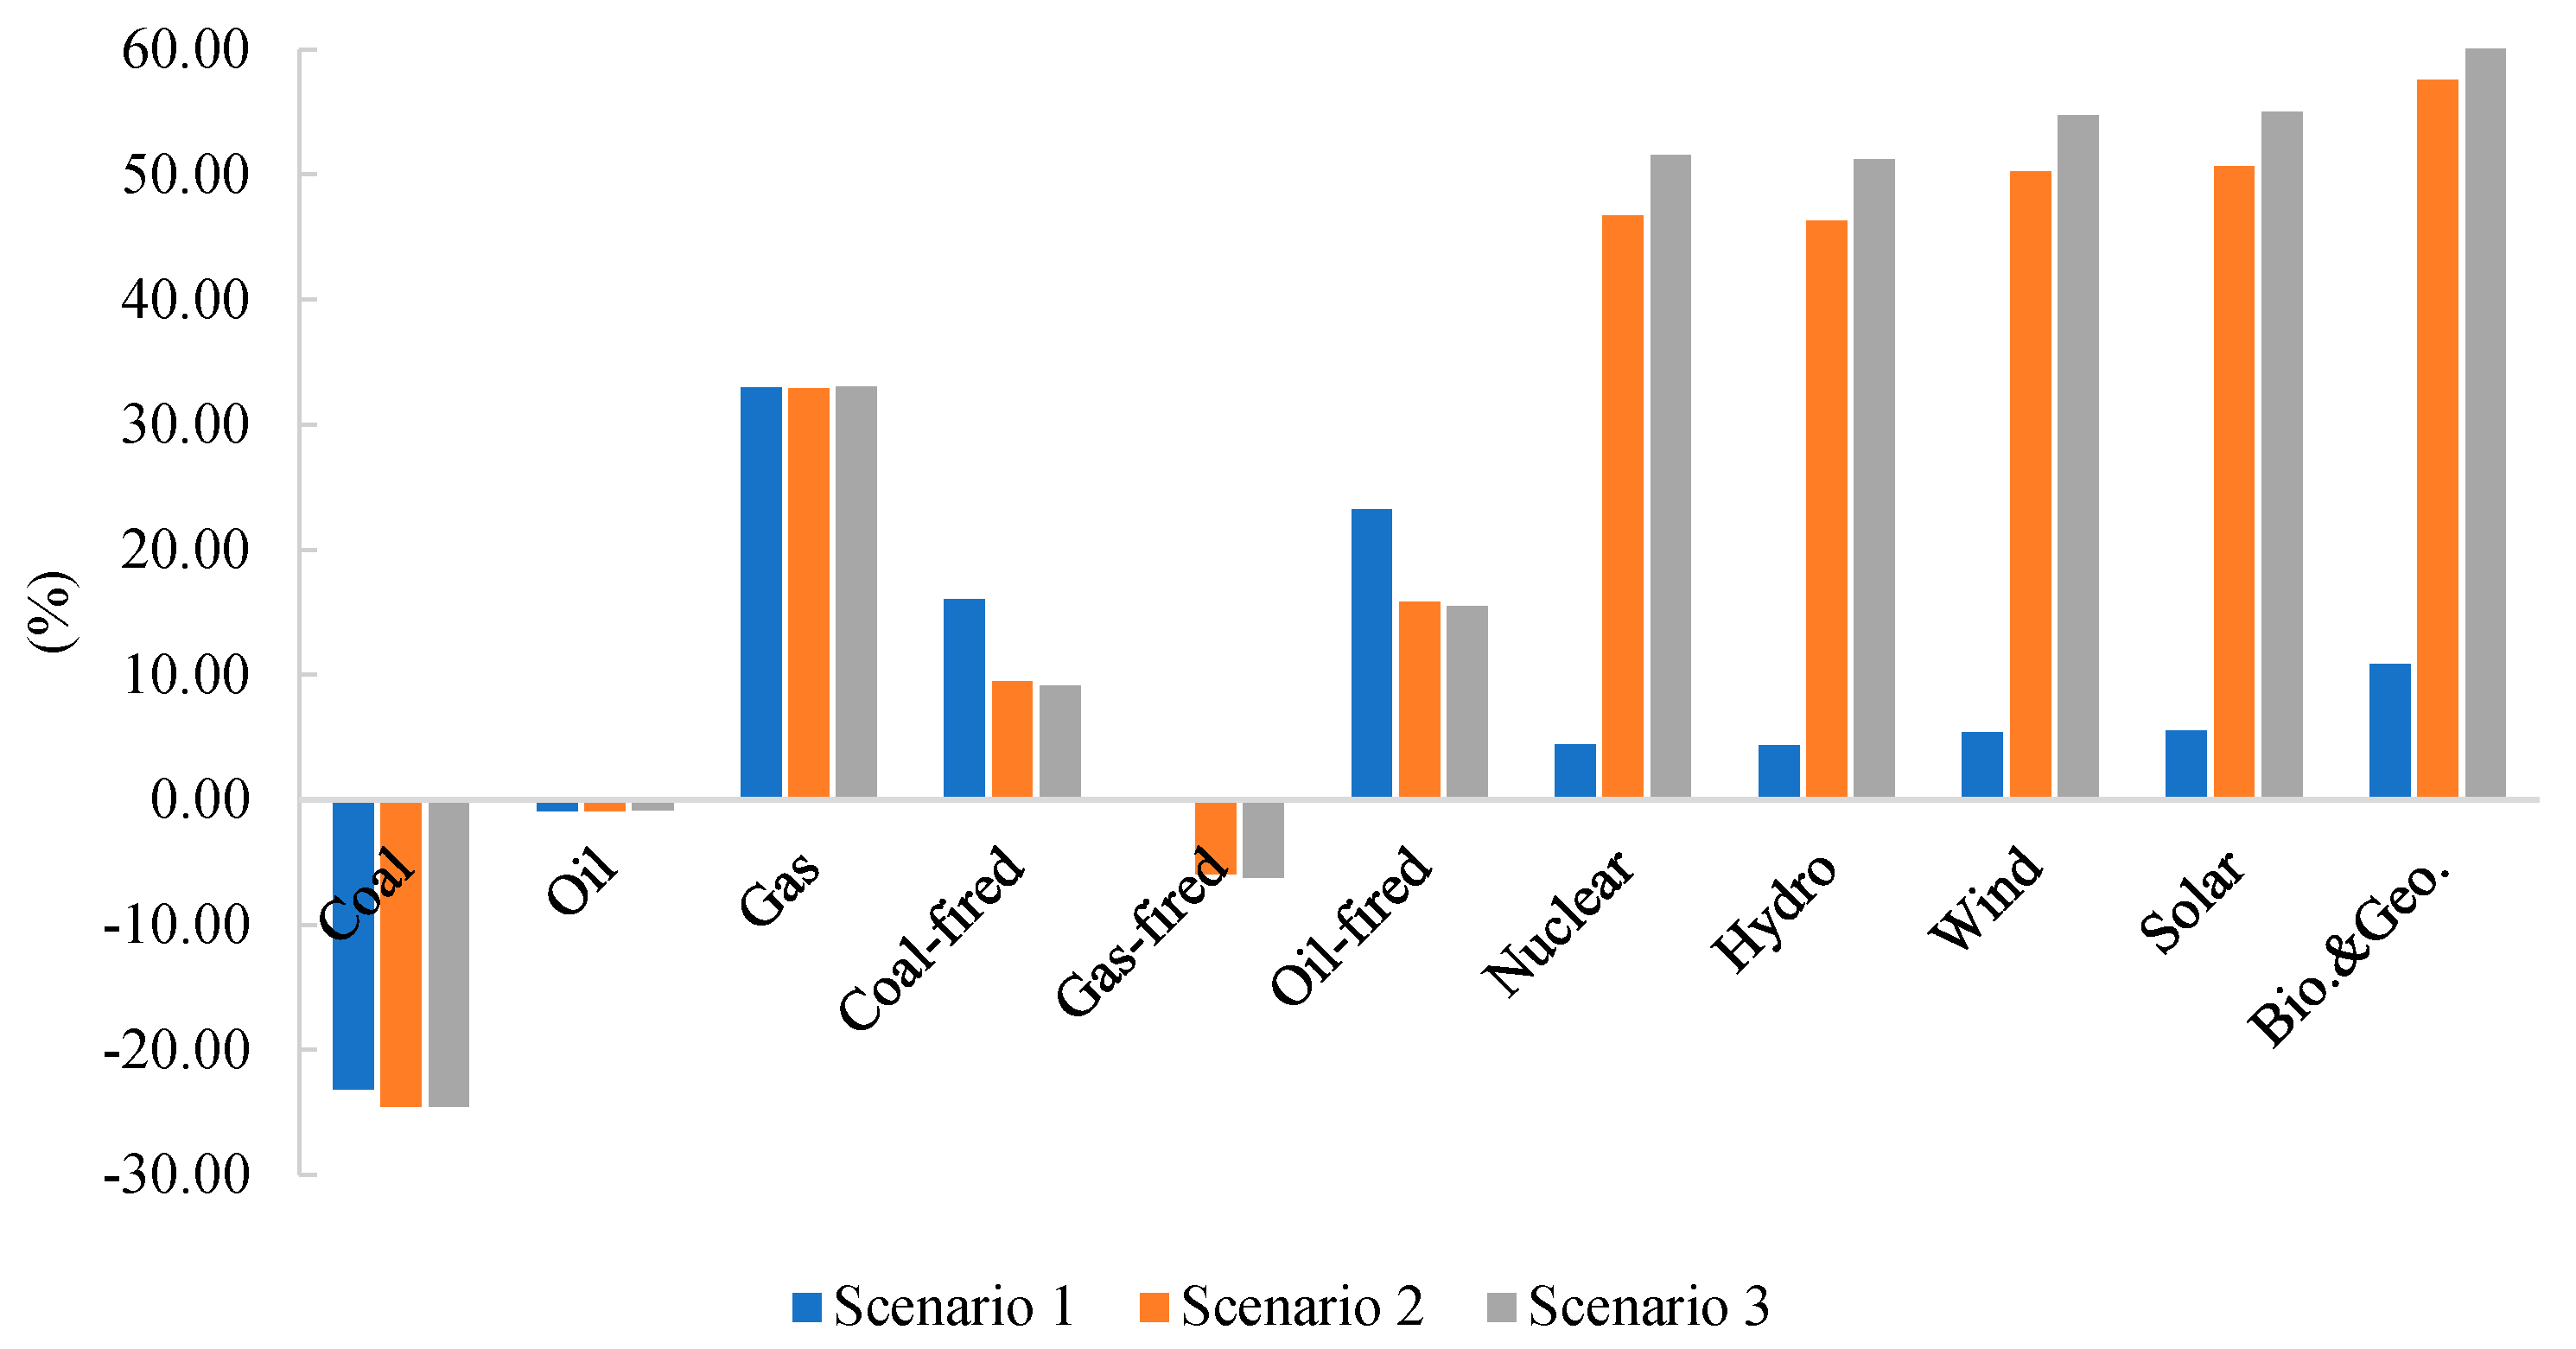
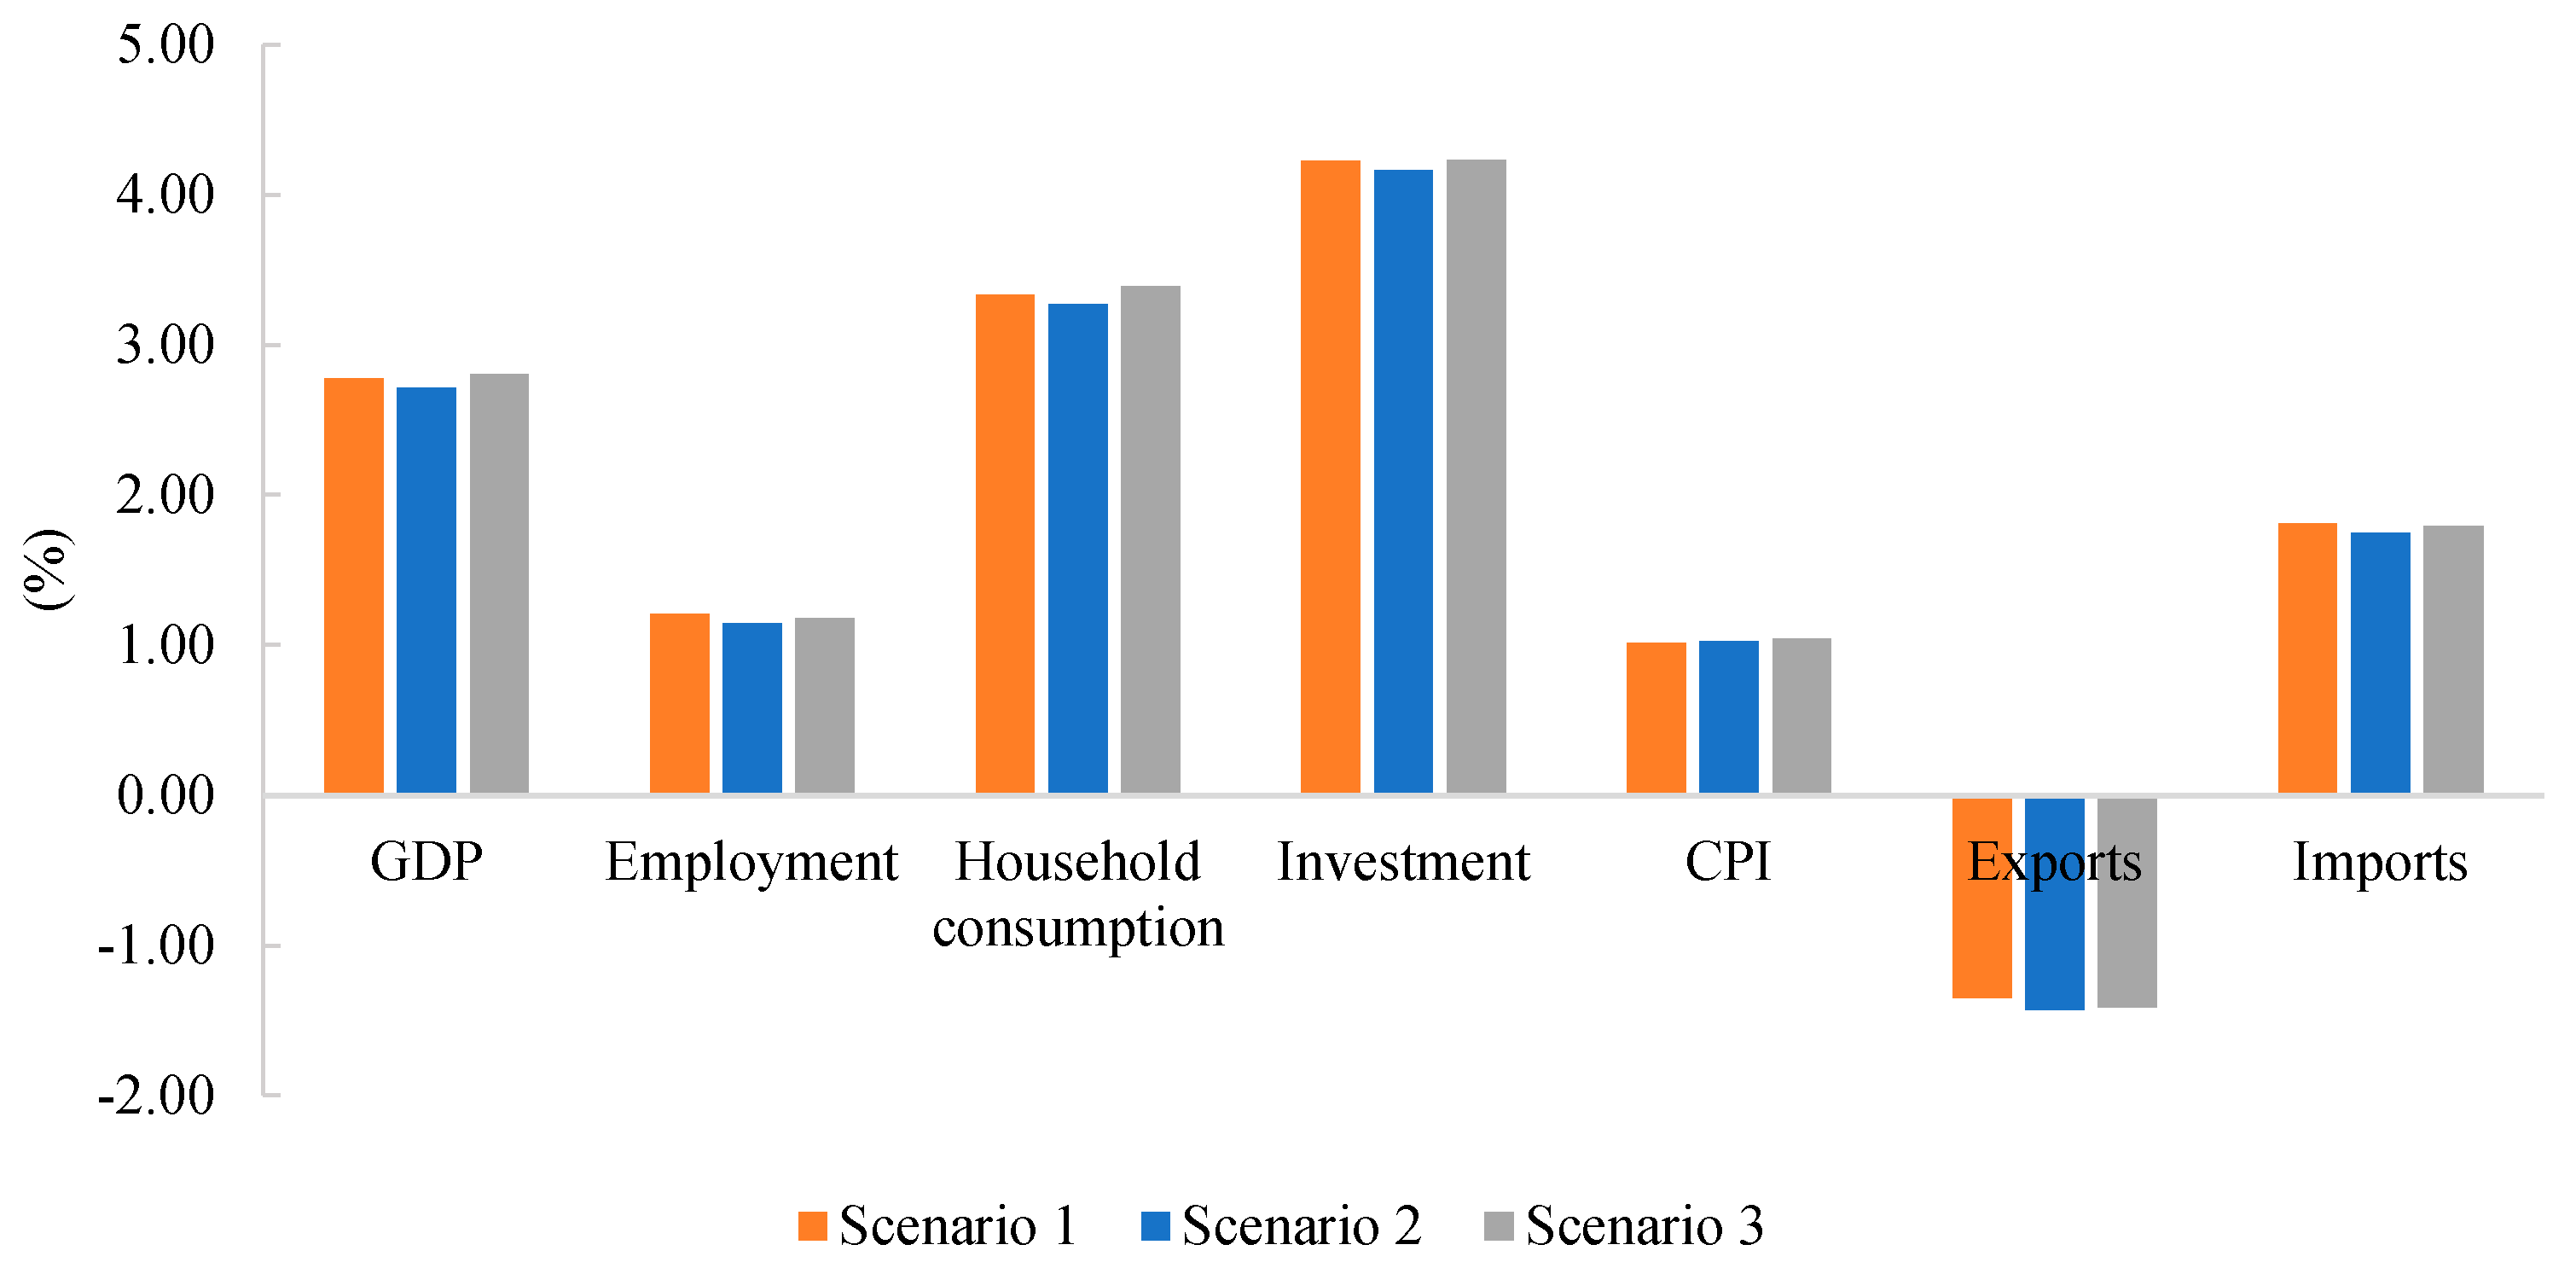
- Scenario 1: The primary purpose of implementing clean energy substitution is to reduce severe air pollution by substituting polluting fossil-fuels with clean energy in terminal energy consumption of production sectors. Therefore, this scenario considers the replacement of polluting fossil-fuels by gas and electricity with all types of power sources, including fossil-fuel electricity and non-fossil-fuel electricity. The changes in proportions of polluting fossil-fuels and clean energy in terminal energy consumption of production sectors are obtained from the projections of ARIMA regression from 2017 to 2030.
- Scenario 2: Fossil-fuel electricity still accounts for a large proportion of power generation in China. However, the generation of fossil-fuel electricity requires a great amount of fossil-fuels and emits severe carbon dioxide. Hence, much attention should be paid to increasing the proportion of electricity with renewable sources in terminal energy consumption to maximize the environmental benefits of clean energy substitution. Since 2013, China has firmly encouraged enterprises to utilize more clean energy from the consumption side via the renewable energy portfolio and green electricity trading policies [49,50], which increased the utilization of renewable electricity by production sectors. As a result, Scenario 2 simulates the effects of substituting polluting fossil-fuels with non-fossil-fuel electricity as well as gas.
- Scenario 3: National Energy Administration (NEA) has advocated to promote technological advancement and reduce the cost of renewable energy by adoption of innovative development mode [51]. Accordingly, upon the policy analyzed Scenario 2, Scenario 3 further considers that the production technology for non-fossil-fuel electricity is improved to increase the supply of non-fossil-fuel electricity. It assumes that the production efficiency of non-fossil-fuel electricity would improve by 1% every year during the period of 2017 to 2030.
3. Results
3.1. ARIMA Projection Results
3.2. Simulation Results of the CGE Model
3.2.1. Impacts on Energy Production
3.2.2. Impacts on Outputs of Non-Energy Sectors
3.2.3. Impacts on the Macro-Economy
3.2.4. Impacts on CO2 Emissions
4. Conclusions and Discussions
Author Contributions
Funding
Conflicts of Interest
Appendix A
Appendix A.1.The Structure of the CHINAGEM Database
| Dimension | Producer (Ind) | Household (1) | Investor (1) | Government (1) | Export (1) | |
|---|---|---|---|---|---|---|
| Basic flows | C*S | BAS | BAS | BAS | BAS | BAS |
| Taxes | C*S | TAX | TAX | TAX | TAX | TAX |
| Margins | M*C*S | MAR | MAR | MAR | MAR | MAR |
| Labor | 1 | LAB | ||||
| Capital | 1 | CAP | ||||
| Land | 1 | LND | ||||
| Production tax | 1 | PTAX | ||||
| Other cost | 1 | OCT |
Appendix A.2. The Production Sectors of CHINAGEM Model
| No. | Sectors | No. | Sectors |
|---|---|---|---|
| 1 | Crops | 74 | Agricultural equipment |
| 2 | Forest | 75 | Special equipment |
| 3 | Livestock | 76 | Automobile |
| 4 | Fishery | 77 | Automobile parts |
| 5 | Agricultural service | 78 | Rail equipment |
| 6 | Coal mineral production | 79 | Ships |
| 7 | Crude oil | 80 | Other transportation equipment |
| 8 | Crude gas | 81 | Generators |
| 9 | Ferrer ore | 82 | Power T&D equipment |
| 10 | Non-Ferrer ore | 83 | Electrical wires |
| 11 | Other mineral production | 84 | Battery |
| 12 | Other mineral service | 85 | Home electronical equipment |
| 13 | Grain mill | 86 | Other electronical equipment |
| 14 | Feed process | 87 | Computer |
| 15 | Vegetable oil | 88 | Communication equipment |
| 16 | Sugar production | 89 | Radar and broadcast equipment |
| 17 | Meat production | 90 | Video and TV equipment |
| 18 | Fish production | 91 | Electrical parts |
| 19 | Non-staple food production | 92 | Other electrical equipment |
| 20 | Convenient food production | 93 | Meters |
| 21 | Dairy production | 94 | Other manufacture |
| 22 | Condiment production | 95 | Scrap |
| 23 | Other food | 96 | Machine repair |
| 24 | Wines | 97 | Coal-fired electricity |
| 25 | Other beverage | 98 | Gas-fired electricity |
| 26 | Tobacco | 99 | Oil-fired electricity |
| 27 | Cotton textile | 100 | Nuclear electricity |
| 28 | Wool textile | 101 | Hydropower |
| 29 | Silk textile | 102 | Wind power |
| 30 | Knit and weave | 103 | Solar power |
| 31 | Textile production | 104 | Biomass and geothermal power |
| 32 | Clothes | 105 | Power transmission and distribution |
| 33 | Leather | 106 | Thermal supply |
| 34 | Shoes | 107 | Gas supply |
| 35 | Lumber | 108 | Water supply |
| 36 | Furniture | 109 | Construction |
| 37 | Paper production | 110 | Retail |
| 38 | Printing | 111 | Rail transportation |
| 39 | Cultural and sport production | 112 | Road transportation |
| 40 | Petroleum refine | 113 | Water transportation |
| 41 | Coke | 114 | Air transportation |
| 42 | Basic chemistry | 115 | Pipe transportation |
| 43 | Fertilizer | 116 | Logistics |
| 44 | Pesticide | 117 | Storage |
| 45 | Painting dyes | 118 | Post |
| 46 | Synthetic material | 119 | Hotel |
| 47 | Special chemistry | 120 | Restaurant |
| 48 | Daily chemistry | 121 | Information service |
| 49 | Medicine | 122 | Software service |
| 50 | Chemistry fiber | 123 | Financial service |
| 51 | Rubber production | 124 | Capital service |
| 52 | Plastic production | 125 | Insurance |
| 53 | Cement | 126 | Real estate |
| 54 | Cement production | 127 | Lease |
| 55 | Brick material | 128 | Business service |
| 56 | Glass | 129 | Research |
| 57 | China | 130 | Technology service |
| 58 | Fireproof material | 131 | Technology expansion service |
| 59 | Non-metal production | 132 | Water service |
| 60 | Steel and iron | 133 | Ecological service |
| 61 | Steel production | 134 | Public facility management |
| 62 | Ferrer production | 135 | Household service |
| 63 | Non-Ferrer casting | 136 | Other service |
| 64 | Non-Ferrer rolling | 137 | Education |
| 65 | Metal production | 138 | Health |
| 66 | Boilers | 139 | Social work |
| 67 | Metal process machine | 140 | Journalism and publication |
| 68 | Carrying equipment | 141 | Broadcast, film and TV |
| 69 | Pumper and other machine | 142 | Culture and arts |
| 70 | Cultural equipment | 143 | Sports |
| 71 | General equipment | 144 | Recreation |
| 72 | Mineral equipment | 145 | Public security |
| 73 | Chemistry equipment | 146 | Public administration |
Appendix A.3 The Sectorial Matching Concordance
| Sectors in GTAP Model | Sectors in CHINAGEM Model | ||
|---|---|---|---|
| No. | Code | Description | No. |
| 1 | pdr | Paddy rice | 1 |
| 2 | wht | Wheat | 1 |
| 3 | gro | Other grains | 1 |
| 4 | v_f | Veg & fruit | 1 |
| 5 | osd | Oil feeds | 1 |
| 6 | c_b | Cane & beet | 1 |
| 7 | pfb | Plant fibres | 1 |
| 8 | ocr | Other crops | 1 |
| 9 | ctl | Cattle | 3 |
| 10 | oap | Other animal products | 3 |
| 11 | rmk | Raw milk | 3 |
| 12 | wol | Wool | 3 |
| 13 | frs | Forestry | 2 |
| 14 | fsh | Fishing | 4, 5 |
| 15 | coa | Coal | 6 |
| 16 | oil | Oil | 7 |
| 17 | gas | Gas | 8 |
| 18 | omn | Other mining | 9, 10, 11, 12 |
| 19 | cmt | Cattle meat | 17 |
| 20 | omt | Other meat | 17 |
| 21 | vol | Vegetable oils | 15 |
| 22 | mil | Milk | 21 |
| 23 | pcr | Processed rice | 13, 14 |
| 24 | sgr | Sugar | 16 |
| 25 | ofd | Other food | 18, 19, 20, 22, 23 |
| 26 | b_t | Beverages and tobacco products | 24, 25, 26 |
| 27 | tex | Textiles | 27, 28, 29, 30, 31 |
| 28 | wap | Wearing apparel | 32, 34 |
| 29 | lea | Leather | 33 |
| 30 | lum | Lumber | 35, 36 |
| 31 | ppp | Paper & paper products | 37, 38, 39 |
| 32 | p_c | Petroleum & coke | 40, 41 |
| 33 | crp | Chemical rubber products | 42, 43, 44, 45, 46, 47, 48, 49, 50, 51, 52 |
| 34 | nmm | Non-metallic minerals | 53, 54, 55, 56, 57, 58, 59 |
| 35 | i_s | Iron & steel | 60, 61, 62 |
| 36 | nfm | Non-ferrous metals | 63, 64 |
| 37 | fmp | Fabricated metal products | 65 |
| 38 | mvh | Motor vehicles and parts | 68, 69, 76, 77, 78 |
| 39 | otn | Other transport equipment | 79, 80 |
| 40 | ele | Electronic equipment | 85, 86, 87, 88, 89, 90 |
| 41 | ome | Other machinery & equipment | 70, 81, 82, 83, 84, 91, 92, 93 |
| 42 | omf | Other manufacturing | 66, 67, 71, 72, 73, 74, 75, 94, 95, 96 |
| 43 | ely | Electricity | 97, 98, 99, 100, 101, 102, 103, 104, 105 |
| 44 | gdt | Gas distribution | 106, 107 |
| 45 | wtr | Water | 108 |
| 46 | cns | Construction | 109 |
| 47 | trd | Trade | 110, 119, 120 |
| 48 | otp | Other transport | 111, 112, 115 |
| 49 | wtp | Water transport | 113 |
| 50 | atp | Air transport | 114 |
| 51 | cmn | Communications | 116, 117, 118 |
| 52 | ofi | Other financial intermediation | 123, 124 |
| 53 | isr | Insurance | 125 |
| 54 | obs | Other business services | 121, 122, 126, 127, 128, 129, 130, 131 |
| 55 | ros | Recreation & other services | 140, 141, 142, 143, 144 |
| 56 | osg | Other services (Government) | 132, 133, 134, 137, 138, 139, 145, 146 |
| 57 | dwe | Dwellings | 135 |
Appendix B
Appendix C

| Sector | Energy Commodity | t-Statistic | Prob.* |
|---|---|---|---|
| Agriculture | Coal | −1.266923 | 0.6283 |
| Oil | −1.733843 | 0.4029 | |
| Gas | −0.005266 | 0.9495 | |
| Electricity | −0.684714 | 0.8331 | |
| Mining and quarrying | Coal | −1.279212 | 0.6228 |
| Oil | −2.407349 | 0.1499 | |
| Gas | 0.026049 | 0.9526 | |
| Electricity | 1.783099 | 0.9994 | |
| Manufacturing | Coal | −1.243439 | 0.6381 |
| Oil | −0.484508 | 0.8786 | |
| Gas | 3.898705 | 1.0000 | |
| Electricity | −0.988104 | 0.7389 | |
| Energy and water industry | Coal | −1.904277 | 0.3250 |
| Oil | −1.700393 | 0.4189 | |
| Gas | 0.009993 | 0.9510 | |
| Electricity | 2.927249 | 1.0000 | |
| Construction | Coal | −0.350402 | 0.9029 |
| Oil | 0.515356 | 0.9838 | |
| Gas | −1.125199 | 0.6856 | |
| Electricity | −1.118196 | 0.6895 | |
| Transportation | Coal | −2.852566 | 0.1967 |
| Oil | 1.496762 | 0.9988 | |
| Gas | 3.619652 | 1.0000 | |
| Electricity | 0.586410 | 0.9990 | |
| Other services | Coal | −0.123968 | 0.9339 |
| Oil | −1.912347 | 0.3216 | |
| Gas | 4.001430 | 1.0000 | |
| Electricity | 0.529219 | 0.9988 |
| Sector | Energy Commodity | t-Statistic | Prob.* |
|---|---|---|---|
| Agriculture | Coal | −4.382152 | 0.0023 |
| Oil | −4.185833 | 0.0036 | |
| Gas | −9.106804 | 0.0000 | |
| Electricity | −5.025878 | 0.0006 | |
| Mining and quarrying | Coal | −3.978660 | 0.0058 |
| Oil | −4.026766 | 0.0052 | |
| Gas | −4.060885 | 0.0048 | |
| Electricity | −4.133398 | 0.0204 | |
| Manufacturing | Coal | −2.682921 | 0.0915 |
| Oil | −4.616368 | 0.0014 | |
| Gas | −4.169695 | 0.0049 | |
| Electricity | −6.843205 | 0.0000 | |
| Energy and water industry | Coal | −4.817209 | 0.0008 |
| Oil | −5.711939 | 0.0001 | |
| Gas | −4.630552 | 0.0013 | |
| Electricity | −5.500325 | 0.0003 | |
| Construction | Coal | −8.032724 | 0.0000 |
| Oil | −5.503997 | 0.0002 | |
| Gas | −3.411236 | 0.0207 | |
| Electricity | −12.31219 | 0.0000 | |
| Transportation | Coal | −6.163410 | 0.0001 |
| Oil | −4.307724 | 0.0027 | |
| Gas | −6.880683 | 0.0000 | |
| Electricity | −6.547434 | 0.0000 | |
| Other services | Coal | −4.739897 | 0.0015 |
| Oil | −6.021559 | 0.0000 | |
| Gas | −5.734466 | 0.0002 | |
| Electricity | −5.367821 | 0.0002 |
| Dependent Variable: DAC1 (1st-order Differentiated Variable of Coal Consumption for Agriculture) | ||||
| Variable | Coefficient | Std. Error | t-Statistic | Prob. |
| AR(3) | −0.632 | 0.171 | −3.694 | 0.001 |
| MA(3) | 0.964 | 0.053 | 18.101 | 0.000 |
| R-squared | 0.171 | Prob(F-statistic) | 0.000 | |
| Dependent Variable: DAO1 (1st-order Differentiated Variable of Oil Consumption for Agriculture) | ||||
| Variable | Coefficient | Std. Error | t-Statistic | Prob. |
| AR(2) | 0.542 | 0.190 | 2.854 | 0.010 |
| MA(2) | −0.956 | 0.050 | −18.969 | 0.000 |
| R-squared | 0.227 | Prob(F-statistic) | 0.000 | |
| Dependent Variable: DAG2 (2nd-order Differentiated Variable of Gas Consumption for Agriculture) | ||||
| Variable | Coefficient | Std. Error | t-Statistic | Prob. |
| C | 0.162 | 0.037 | 4.395 | 0.000 |
| AR(1) | −0.841 | 0.057 | −14.869 | 0.000 |
| MA(2) | −1.000 | 0.038 | −26.525 | 0.000 |
| R-squared | 0.820 | Prob(F-statistic) | 0.000 | |
| Dependent Variable: DAE1 (1st-order Differentiated Variable of Electricity Consumption for Agriculture) | ||||
| Variable | Coefficient | Std. Error | t-Statistic | Prob. |
| C | 31.741 | 3.532 | 8.987 | 0.000 |
| AR(1) | 0.523 | 0.224 | 2.333 | 0.030 |
| MA(1) | −1.000 | 0.246 | −4.068 | 0.001 |
| R-squared | 0.260 | Prob(F-statistic) | 0.042 | |
| Dependent Variable: DM & QC1 (1st-order Differentiated Variable of Coal Consumption for Mining and Quarrying) | ||||
| Variable | Coefficient | Std. Error | t-Statistic | Prob. |
| AR(2) | 0.400 | 0.227 | 1.762 | 0.093 |
| MA(5) | −0.819 | 0.097 | −8.449 | 0.000 |
| R-squared | 0.467 | Prob(F-statistic) | 0.000 | |
| Dependent Variable: DM & QO1 (1st-order Differentiated Variable of Oil Consumption for Mining and Quarrying) | ||||
| Variable | Coefficient | Std. Error | t-Statistic | Prob. |
| AR(1) | 0.295 | 0.169 | 1.748 | 0.097 |
| AR(2) | −0.650 | 0.151 | −4.308 | 0.000 |
| MA(1) | −0.234 | 0.107 | −2.181 | 0.042 |
| MA(2) | 0.896 | 0.055 | 16.173 | 0.000 |
| R-squared | 0.198 | Prob(F-statistic) | 0.000 | |
| Dependent Variable: DM&QG1 (1st-order Differentiated variable of Gas Consumption for Mining and Quarrying) | ||||
| Variable | Coefficient | Std. Error | t-Statistic | Prob. |
| C | 63.559 | 11.110 | 5.721 | 0.000 |
| AR(1) | 0.468 | 0.175 | 2.679 | 0.015 |
| MA(1) | −0.574 | 0.076 | −7.597 | 0.000 |
| MA(2) | 0.554 | 0.076 | 7.302 | 0.000 |
| MA(3) | −0.917 | 0.036 | −25.207 | 0.000 |
| R-squared | 0.517 | Prob(F-statistic) | 0.006 | |
| Dependent Variable: DM&QE1 (1st-order Differentiated variable of Electricity Consumption for Mining and Quarrying) | ||||
| Variable | Coefficient | Std. Error | t-Statistic | Prob. |
| C | 105.149 | 13.902 | 7.564 | 0.000 |
| AR(1) | 0.587 | 0.206 | 2.848 | 0.010 |
| MA(1) | −0.446 | 0.225 | −1.988 | 0.061 |
| MA(2) | −0.470 | 0.218 | −2.156 | 0.044 |
| R-squared | 0.225 | Prob(F-statistic) | 0.057 | |
| Dependent Variable: DMC1 (1st-order Differentiated variable of Coal Consumption for Manufacturing) | ||||
| Variable | Coefficient | Std. Error | t-Statistic | Prob. |
| AR(5) | −0.483 | 0.205 | −2.354 | 0.031 |
| MA(4) | 0.569 | 0.188 | 3.031 | 0.008 |
| MA(5) | 0.387 | 0.197 | 1.969 | 0.066 |
| R-squared | 0.413 | Prob(F-statistic) | 0.000 | |
| Dependent Variable: DMO1 (1st-order Differentiated variable of Oil Consumption for Manufacturing) | ||||
| Variable | Coefficient | Std. Error | t-Statistic | Prob. |
| C | 691.109 | 152.233 | 4.540 | 0.000 |
| AR(1) | −0.731 | 0.140 | −5.210 | 0.000 |
| MA(1) | 1.142 | 0.063 | 18.007 | 0.000 |
| MA(3) | −0.539 | 0.035 | −15.227 | 0.000 |
| R-squared | 0.393 | Prob(F-statistic) | 0.017 | |
| Dependent Variable: DMG2 (2nd-order Differentiated variable of Gas Consumption for Manufacturing) | ||||
| Variable | Coefficient | Std. Error | t-Statistic | Prob. |
| C | 52.626 | 3.469 | 15.171 | 0.000 |
| AR(4) | −0.980 | 0.286 | −3.425 | 0.004 |
| MA(1) | −1.433 | 0.041 | −34.760 | 0.000 |
| MA(3) | 0.480 | 0.022 | 21.683 | 0.000 |
| R-squared | 0.770 | Prob(F-statistic) | 0.000 | |
| Dependent Variable: DME2 (1st-order Differentiated variable of Electricity Consumption for Manufacturing) | ||||
| Variable | Coefficient | Std. Error | t-Statistic | Prob. |
| AR(1) | −0.959 | 0.208 | −4.618 | 0.000 |
| AR(2) | −0.543 | 0.156 | −3.473 | 0.003 |
| MA(1) | 1.111 | 0.126 | 8.856 | 0.000 |
| MA(3) | −0.560 | 0.091 | −6.188 | 0.000 |
| R-squared | 0.514 | Prob(F-statistic) | 0.051 | |
| Dependent Variable: DPC1 (1st-order Differentiated variable of Coal Consumption for Energy and Water Industry) | ||||
| Variable | Coefficient | Std. Error | t-Statistic | Prob. |
| AR(2) | −0.448 | 0.191 | −2.347 | 0.029 |
| MA(2) | 0.987 | 0.067 | 14.780 | 0.000 |
| R-squared | 0.308 | Prob(F-statistic) | 0.000 | |
| Dependent Variable: DPO1 (1st-order Differentiated variable of Oil Consumption for Energy and Water Industry) | ||||
| Variable | Coefficient | Std. Error | t-Statistic | Prob. |
| C | −23.725 | 6.410 | −3.701 | 0.002 |
| AR(1) | −0.227 | 0.122 | −1.858 | 0.080 |
| AR(3) | 0.601 | 0.092 | 6.508 | 0.000 |
| MA(3) | −0.957 | 0.037 | −25.946 | 0.000 |
| R-squared | 0.617 | Prob(F-statistic) | 0.001 | |
| Dependent Variable: DPG1 (1st-order Differentiated Variable of Gas Consumption for Energy and Water Industry) | ||||
| Variable | Coefficient | Std. Error | t-Statistic | Prob. |
| AR(3) | −0.666 | 0.211 | −3.152 | 0.005 |
| MA(3) | 0.847 | 0.064 | 13.182 | 0.000 |
| R-squared | 0.006 | Prob(F-statistic) | 0.000 | |
| Dependent Variable: DPE2 (2nd-order Differentiated Variable of Electricity Consumption for Energy and Water Industry) | ||||
| Variable | Coefficient | Std. Error | t-Statistic | Prob. |
| C | 14.729 | 3.982 | 3.699 | 0.002 |
| AR(1) | −0.547 | 0.252 | −2.177 | 0.045 |
| AR(2) | −0.555 | 0.237 | −2.343 | 0.032 |
| AR(3) | −0.457 | 0.234 | −1.957 | 0.068 |
| MA(1) | −1.000 | 0.203 | −4.938 | 0.000 |
| R-squared | 0.734 | Prob(F-statistic) | 0.000 | |
| Dependent Variable: DCC1 (1st-order Differential Variable of Coal Consumption for Construction) | ||||
| Variable | Coefficient | Std. Error | t-Statistic | Prob. |
| C | 17.676 | 5.654 | 3.126 | 0.005 |
| AR(1) | −0.426 | 0.205 | −2.076 | 0.050 |
| MA(5) | −0.891 | 0.049 | −18.037 | 0.000 |
| R-squared | 0.577 | Prob(F-statistic) | 0.000 | |
| Dependent Variable: DCO1 (1st-order Differential Variable of Crude oil Consumption for Construction) | ||||
| Variable | Coefficient | Std. Error | t-Statistic | Prob. |
| AR(1) | −0.959 | 0.172 | −5.570 | 0.000 |
| AR(2) | −0.627 | 0.162 | −3.860 | 0.001 |
| MA(1) | 1.966 | 0.105 | 18.674 | 0.000 |
| MA(2) | 1.465 | 0.108 | 13.510 | 0.000 |
| R-squared | 0.445 | Prob(F-statistic) | 0.000 | |
| Dependent Variable: DCG1 (1st-order Differential Variable of Crude gas Consumption for Construction) | ||||
| Variable | Coefficient | Std. Error | t-Statistic | Prob. |
| AR(1) | −0.321 | 0.165 | −1.943 | 0.065 |
| MA(1) | 0.924 | 0.083 | 11.075 | 0.000 |
| R-squared | 0.491 | Prob(F-statistic) | 0.000 | |
| Dependent Variable: DCE2 (1st-order Differential Variable of Electricity Consumption for Construction) | ||||
| Variable | Coefficient | Std. Error | t-Statistic | Prob. |
| AR(2) | 0.395 | 0.193 | 2.041 | 0.055 |
| MA(1) | −1.034 | 0.048 | −21.474 | 0.000 |
| R-squared | 0.624 | Prob(F-statistic) | 0.000 | |
| Dependent Variable: DTC2 (2nd-order Differentiated Variable of Coal Consumption for Transportation) | ||||
| Variable | Coefficient | Std. Error | t-Statistic | Prob. |
| AR(3) | −0.346 | 0.157 | −2.201 | 0.040 |
| MA(1) | −1.000 | 0.030 | −33.155 | 0.000 |
| R-squared | 0.701 | Prob(F-statistic) | 0.044 | |
| Dependent Variable: DTO1 (1st-order Differentiated Variable of Oil Consumption for Transportation) | ||||
| Variable | Coefficient | Std. Error | t-Statistic | Prob. |
| C | 1486.252 | 162.030 | 9.173 | 0.000 |
| AR(1) | 0.769 | 0.098 | 7.854 | 0.000 |
| MA(1) | −0.959 | 0.040 | −23.868 | 0.000 |
| R-squared | 0.257 | Prob(F-statistic) | 0.000 | |
| Dependent Variable: DTG2 (2nd-order Differentiated Variable of Gas Consumption for Transportation) | ||||
| Variable | Coefficient | Std. Error | t-Statistic | Prob. |
| C | 3.862 | 0.781 | 4.944 | 0.000 |
| AR(1) | −1.385 | 0.137 | −10.109 | 0.000 |
| AR(2) | −1.094 | 0.137 | −7.994 | 0.000 |
| MA(1) | 0.596 | 0.210 | 2.840 | 0.012 |
| MA(2) | −0.557 | 0.156 | −3.581 | 0.003 |
| MA(3) | −0.984 | 0.152 | −6.493 | 0.000 |
| R-squared | 0.641 | Prob(F-statistic) | 0.003 | |
| Dependent Variable: DTE2 (1st-order Differentiated Variable of Electricity Consumption for Transportation) | ||||
| Variable | Coefficient | Std. Error | t-Statistic | Prob. |
| AR(2) | −0.451 | 0.228 | −1.976 | 0.062 |
| MA(1) | −0.470 | 0.215 | −2.190 | 0.041 |
| R-squared | 0.319 | Prob(F-statistic) | 0.000 | |
| Dependent Variable: DRC1 (1st-order Differentiated Variable of Coal Consumption for Other Services) | ||||
| Variable | Coefficient | Std. Error | t-Statistic | Prob. |
| C | 153.019 | 28.683 | 5.335 | 0.000 |
| AR(2) | 0.409 | 0.221 | 1.849 | 0.086 |
| MA(1) | −0.449 | 0.246 | −1.820 | 0.090 |
| MA(2) | −0.481 | 0.240 | −2.007 | 0.065 |
| R-squared | 0.279 | Prob(F-statistic) | 0.000 | |
| Dependent Variable: DRE2 (2nd-order Differentiated Variable of Electricity Consumption for Other Services) | ||||
| Variable | Coefficient | Std. Error | t-Statistic | Prob. |
| AR(2) | 0.443 | 0.214 | 2.069 | 0.052 |
| MA(2) | −0.876 | 0.061 | −14.481 | 0.000 |
| R-squared | 0.141 | Prob(F-statistic) | 0.000 | |
| Dependent Variable: DRO1 (1st-order Differentiated Variable of Oil Consumption for Other Services) | ||||
| Variable | Coefficient | Std. Error | t-Statistic | Prob. |
| C | 40.117 | 13.348 | 3.005 | 0.007 |
| AR(2) | 0.640 | 0.112 | 5.722 | 0.000 |
| MA(2) | −1.000 | 0.132 | −7.600 | 0.000 |
| R-squared | 0.329 | Prob(F-statistic) | 0.019 | |
| Dependent Variable: DRG2 (2nd-order Differentiated Variable of Gas Consumption for Other Services) | ||||
| Variable | Coefficient | Std. Error | t-Statistic | Prob. |
| C | 3.591 | 0.460 | 7.801 | 0.000 |
| AR(1) | −0.449 | 0.209 | −2.147 | 0.046 |
| AR(2) | −0.413 | 0.134 | −3.089 | 0.006 |
| MA(1) | −1.000 | 0.202 | −4.952 | 0.000 |
| R-squared | 0.739 | Prob(F-statistic) | 0.000 | |
| Sector | Energy Commodity | t-Statistic | Prob.* |
|---|---|---|---|
| Agriculture | Coal | −4.098440 | 0.0051 |
| Oil | −4.346252 | 0.0028 | |
| Gas | −5.838931 | 0.0001 | |
| Electricity | −4.426841 | 0.0022 | |
| Mining and quarrying | Coal | −3.955062 | 0.0066 |
| Oil | −4.125973 | 0.0045 | |
| Gas | −4.750180 | 0.0010 | |
| Electricity | −4.905932 | 0.0011 | |
| Manufacturing | Coal | −2.787728 | 0.0787 |
| Oil | −5.733958 | 0.0001 | |
| Gas | −3.953653 | 0.0078 | |
| Electricity | −4.664891 | 0.0015 | |
| Energy and water industry | Coal | −4.492589 | 0.0020 |
| Oil | −5.528755 | 0.0002 | |
| Gas | −4.149220 | 0.0046 | |
| Electricity | −4.594561 | 0.0019 | |
| Construction | Coal | −5.074255 | 0.0005 |
| Oil | −4.713244 | 0.0012 | |
| Gas | −7.172407 | 0.0000 | |
| Electricity | −4.877345 | 0.0009 | |
| Transportation | Coal | −6.006844 | 0.0001 |
| Oil | −4.828614 | 0.0009 | |
| Gas | −4.416807 | 0.0025 | |
| Electricity | −4.442505 | 0.0024 | |
| Other services | Coal | −3.685462 | 0.0149 |
| Oil | −4.601862 | 0.0016 | |
| Gas | −4.055596 | 0.0063 | |
| Electricity | −4.763266 | 0.0012 |
References
- Chai, J.; Du, M.; Liang, T.; Sun, X.C.; Yu, J.; Zhang, Z.G. Coal consumption in China: How to bend down the curve? Energy Econ. 2019, 80, 38–47. [Google Scholar] [CrossRef]
- Wang, J.; Feng, L.; Tverberg, G.E. An analysis of China’s coal supply and its impact on China’s future economic growth. Energy Policy 2013, 57, 542–551. [Google Scholar] [CrossRef]
- Wang, K.; Feng, L.; Wang, J.; Xiong, Y.; Tverberg, G.E. An oil production forecast for China considering economic limits. Energy 2016, 113, 586–596. [Google Scholar] [CrossRef]
- Paltsev, S.; Jacoby, H.D.; Reilly, J.M.; Ejaz, Q.J.; Morris, J.; O’sullivan, F.; Rausch, S.; Winchester, N.; Kragha, O. The future of U.S. natural gas production, use, and trade. Energy Policy 2011, 39, 5309–5321. [Google Scholar] [CrossRef]
- Peters, J. Natural gas and spillover from the US Clean Power Plan into the Paris Agreement. Energy Policy 2017, 106, 41–47. [Google Scholar] [CrossRef]
- Energy Information Administration US. Natural Gas 1998: Issues and Trends. Available online: https://digital.library.unt.edu/ark:/67531/metadc675165/ (accessed on 1 June 1999).
- Wang, Y.; Chen, X.; Ren, S. Clean energy adoption and maternal health: Evidence from China. Energy Econ. 2019, 84, 104517. [Google Scholar] [CrossRef]
- Cesur, R.; Tekin, E.; Ulker, A. Air Pollution and Infant Mortality: Evidence from the Expansion of Natural Gas Infrastructure. Econ. J. 2017, 127, 330–362. [Google Scholar] [CrossRef]
- National Energy Agency. Electric Power Statistics Yearbook (2018); China Electric Power Press: Beijing, China, 2018.
- Jiang, J.; Ye, B.; Liu, J. Peak of CO2 emissions in various sectors and provinces of China: Recent progress and avenues for further research. Renew. Sustain. Energy Rev. 2019, 112, 813–833. [Google Scholar] [CrossRef]
- BP Statistical Review of World Energy. Available online: https://www.bp.com/content/dam/bp-country/de_ch/PDF/bp-statistical-review-of-world-energy-2017-full-report.pdf (accessed on 13 June 2017).
- The State Council. Available online: http://www.gov.cn/zwgk/2013-09/12/content_2486773.htm (accessed on 10 September 2013).
- National Development and Reform Commission. Available online: http://www.ndrc.gov.cn/zcfb/zcfbtz/201605/t20160524_804425.html (accessed on 16 May 2016).
- National Development and Reform Commission. Available online: http://www.ndrc.gov.cn/zcfb/zcfbtz/201701/t20170117_835278.html. (accessed on 26 December 2016).
- Qiu, L. Analysis and suggestion on the development of electric energy substitution in China. Electr. Power Equip. Manag. 2018, 6, 33–37. [Google Scholar]
- Yuan, X.-C.; Sun, X.; Zhao, W.; Mi, Z.; Wang, B.; Wei, Y.-M. Forecasting China’s regional energy demand by 2030: A Bayesian approach. Resour. Conserv. Recycl. 2017, 127, 85–95. [Google Scholar] [CrossRef]
- Yuan, C.; Liu, S.; Fang, Z. Comparison of China’s primary energy consumption forecasting by using ARIMA (the autoregressive integrated moving average) model and GM (1,1) model. Energy 2016, 100, 384–390. [Google Scholar] [CrossRef]
- Gao, C.; Su, B.; Sun, M.; Zhang, X.; Zhang, Z. Interprovincial transfer of embodied primary energy in China: A complex network approach. Appl. Energy 2018, 215, 792–807. [Google Scholar] [CrossRef]
- Arora, V.; Cai, Y.; Jones, A. The national and international impacts of coal-to-gas switching in the Chinese power sector. Energy Econ. 2016, 60, 416–426. [Google Scholar] [CrossRef]
- Tanaka, K.; Cavalett, O.; Collins, W.J.; Cherubini, F. Asserting the climate benefits of the coal-to-gas shift across temporal and spatial scales. Nat. Clim. Chang. 2019, 9, 389–396. [Google Scholar] [CrossRef]
- Lin, B.; Jia, Z. Economic, energy and environmental impact of coal-to-electricity policy in China: A dynamic recursive CGE study. Sci. Total Environ. 2020, 698, 134–241. [Google Scholar] [CrossRef]
- Wu, W.; Cheng, Y.; Lin, X.; Yao, X. How does the implementation of the Policy of Electricity Substitution influence green economic growth in China? Energy Policy 2019, 131, 251–261. [Google Scholar] [CrossRef]
- Zhang, C.; Yang, J. Economic benefits assessments of “coal-to-electricity” project in rural residents heating based on life cycle cost. J. Clean. Prod. 2019, 213, 217–224. [Google Scholar] [CrossRef]
- Wang, J.; Mohr, S.; Feng, L.; Liu, H.; Tverberg, G.E. Analysis of resource potential for China’s unconventional gas and forecast for its long-term production growth. Energy Policy 2016, 88, 389–401. [Google Scholar] [CrossRef]
- He, Y.; Lin, B. Forecasting China’s total energy demand and its structure using ADL-MIDAS model. Energy 2018, 151, 420–429. [Google Scholar] [CrossRef]
- Zhao, X.; Luo, D. Forecasting fossil energy consumption structure toward low-carbon and sustainable economy in China: Evidence and policy responses. Energy Strategy Rev. 2018, 22, 303–312. [Google Scholar] [CrossRef]
- Shan, B.; Xu, M.; Zhu, F.; Zhang, C. China’s Energy Demand Scenario Analysis in 2030. Energy Procedia 2012, 14, 1292–1298. [Google Scholar] [CrossRef]
- Yu, S.; Zheng, S.; Li, X. The achievement of the carbon emissions peak in China: The role of energy consumption structure optimization. Energy Econ. 2018, 74, 693–707. [Google Scholar] [CrossRef]
- Dai, H.; Xie, X.; Xie, Y.; Liu, J.; Masui, T. Green growth: The economic impacts of large-scale renewable energy development in China. Appl. Energy 2016, 162, 435–449. [Google Scholar] [CrossRef]
- Qi, T.; Zhang, X.; Karplus, V.J. The energy and CO2 emissions impact of renewable energy development in China. Energy Policy 2014, 68, 60–69. [Google Scholar] [CrossRef]
- Liu, W.; Lund, H.; Mathiesen, B.V. Large-scale integration of wind power into the existing Chinese energy system. Energy 2011, 36, 4753–4760. [Google Scholar] [CrossRef]
- Chen, H.; Chen, W. Potential impact of shifting coal to gas and electricity for building sectors in 28 major northern cities of China. Appl. Energy 2019, 236, 1049–1061. [Google Scholar] [CrossRef]
- Niu, D.; Song, Z.; Xiao, X. Electric power substitution for coal in China: Status quo and SWOT analysis. Renew. Sustain. Energy Rev. 2017, 70, 610–622. [Google Scholar] [CrossRef]
- Kamidelivand, M.; Cahill, C.; Llop, M.; Rogan, F.; O’Gallachoir, B. A comparative analysis of substituting imported gas and coal for electricity with renewables—An input-output simulation. Sustain. Energy Technol. Assess. 2018, 30, 1–10. [Google Scholar] [CrossRef]
- Yan, X.; Han, S.; Cheng, Y.; Lin, X.; Qin, L.; Wu, W.; Zeng, B. The economic and environmental impact analysis of replacing fossil energy with electricity in Guangxi—Based on Input-Output model. Energy Procedia 2018, 152, 841–846. [Google Scholar] [CrossRef]
- Lin, B.; Ankrah, I. Renewable energy (electricity) development in Ghana: Observations, concerns, substitution possibilities, and implications for the economy. J. Clean. Prod. 2019, 233, 1396–1409. [Google Scholar] [CrossRef]
- Cholette, P.A. Prior Information and ARIMA Forecasting. J. Forecast. 1982, 1, 375–383. [Google Scholar] [CrossRef]
- Ediger, V.Ş.; Akar, S. ARIMA forecasting of primary energy demand by fuel in Turkey. Energy Policy 2007, 35, 1701–1708. [Google Scholar] [CrossRef]
- Kumar, U.; Jain, V. ARIMA forecasting of ambient air pollutants (O3, NO, NO2 and CO). Stoch. Environ. Res. Risk Assess. 2010, 24, 751–760. [Google Scholar] [CrossRef]
- Mohammadi, H.; Su, L. International evidence on crude oil price dynamics: Applications of ARIMA-GARCH models. Energy Econ. 2010, 32, 1001–1008. [Google Scholar] [CrossRef]
- Roberts, S.A. A General Class of Holt-Winters Type Forecasting Models. Manag. Sci. 1982, 28, 808–820. [Google Scholar] [CrossRef]
- Ding, S.; Kang, J. Applications of ARIMA Model on Predictive Incidence. Chin. J. Hosp. Stat. 2003, 1, 23–26. [Google Scholar]
- Nesticò, A.; Sica, F. The sustainability of urban renewal projects: A model for economic multi-criteria analysis. J. Prop. Invest. Financ. 2017, 35, 397–409. [Google Scholar] [CrossRef]
- Ali-Toudert, F.; Ji, L.; Fährmann, L.; Czempik, S. Comprehensive Assessment Method for Sustainable Urban Development (CAMSUD)—A New Multi-Criteria System for Planning, Evaluation and Decision-Making. Prog. Plan. 2019, 100430. [Google Scholar] [CrossRef]
- D’Agostino, D.; Parker, D.; Melià, P. Environmental and economic implications of energy efficiency in new residential buildings: A multi-criteria selection approach. Energy Strategy Rev. 2019, 26, 100412. [Google Scholar] [CrossRef]
- Dixon, P.B.; Rimmer, M. Dynamic General Equilibrium Modelling for Forecasting and Policy; IMPACT Center Working Papers; Center of Policy Studies: London, UK, 2002. [Google Scholar]
- Feng, S.; Howes, S.; Liu, Y.; Zhang, K.; Yang, J. Towards a national ETS in China: Cap-setting and model mechanisms. Energy Econ. 2018, 73, 43–52. [Google Scholar] [CrossRef]
- Mai, Y.; Dixon, P.B.; Rimmer, M. CHINAGEM: A Monash-Styled Dynamic CGE Model. of China; MPACT Center Working Papers; Center of Policy Studies: London, UK, 2010. [Google Scholar]
- The State Council. Strategic Action Plan for Energy Development. Available online: http://www.gov.cn/zhengce/content/2014-11/19/content_9222.htm (accessed on 7 June 2014).
- National Development and Reform Commission. Notice on Trial Implementation of Renewable Energy Tradable Green Certificate Issuance and Voluntary Subscription Trading System. Available online: http://www.ndrc.gov.cn/zcfb/zcfbtz/201702/t20170203_837117.html (accessed on 18 January 2017).
- National Energy Administration. Guidance on the Implementation of the 13th Five-Year Plan for Renewable Energy Development. Available online: http://zfxxgk.nea.gov.cn/auto87/201707/t20170728_2835.htm (accessed on 19 July 2017).
- IPCC Guidelines for National Greenhouse Gas Inventories; Institute for Global Environmental Strategies: Hayama, Japan, 2006.

| Sectors | Scenario 1 | Scenario 2 | Scenario 3 |
|---|---|---|---|
| The most positively affected sectors | |||
| Gas supply | 22.52 | 22.34 | 22.48 |
| Thermal supply | 6.53 | 6.50 | 6.61 |
| Coking | 5.79 | 5.75 | 5.80 |
| Ferrer production | 4.92 | 4.84 | 4.98 |
| Brick material | 4.40 | 4.35 | 4.42 |
| Power transmission and distribution | 4.36 | 4.43 | 4.53 |
| Steel production | 4.24 | 4.16 | 4.24 |
| Construction | 4.10 | 4.04 | 4.11 |
| The most negatively affected sectors | |||
| Radar and broadcast equipment | −2.50 | −2.58 | −2.61 |
| Fishery | −2.39 | −2.45 | −2.51 |
| Communication equipment | −2.07 | −2.13 | −2.15 |
| Electrical parts | −2.01 | −2.10 | −2.09 |
| Textile production | −1.72 | −1.78 | −1.80 |
| Computer | −1.55 | −1.60 | −1.61 |
| Leather | −1.39 | −1.46 | −1.48 |
| Rail transportation | −0.91 | −1.06 | −1.00 |
| Year | Baseline | Scenario 1 | Scenario 2 | Scenario 3 |
|---|---|---|---|---|
| 2017 | 11.08 | 11.08 | 11.08 | 11.08 |
| 2018 | 11.67 | 11.85 | 11.82 | 11.82 |
| 2019 | 12.29 | 12.42 | 12.36 | 12.36 |
| 2020 | 12.92 | 12.93 | 12.86 | 12.86 |
| 2021 | 13.55 | 13.42 | 13.33 | 13.33 |
| 2022 | 14.18 | 13.94 | 13.84 | 13.84 |
| 2023 | 14.80 | 14.43 | 14.32 | 14.31 |
| 2024 | 15.43 | 14.89 | 14.76 | 14.76 |
| 2025 | 16.06 | 15.34 | 15.20 | 15.20 |
| 2026 | 16.70 | 15.79 | 15.64 | 15.64 |
| 2027 | 17.34 | 16.25 | 16.09 | 16.09 |
| 2028 | 17.99 | 16.7 | 16.53 | 16.53 |
| 2029 | 18.64 | 17.16 | 16.98 | 16.97 |
| 2030 | 19.29 | 17.61 | 17.42 | 17.42 |
© 2019 by the authors. Licensee MDPI, Basel, Switzerland. This article is an open access article distributed under the terms and conditions of the Creative Commons Attribution (CC BY) license (http://creativecommons.org/licenses/by/4.0/).
Share and Cite
Chen, H.; He, L.; Chen, J.; Yuan, B.; Huang, T.; Cui, Q. Impacts of Clean Energy Substitution for Polluting Fossil-Fuels in Terminal Energy Consumption on the Economy and Environment in China. Sustainability 2019, 11, 6419. https://doi.org/10.3390/su11226419
Chen H, He L, Chen J, Yuan B, Huang T, Cui Q. Impacts of Clean Energy Substitution for Polluting Fossil-Fuels in Terminal Energy Consumption on the Economy and Environment in China. Sustainability. 2019; 11(22):6419. https://doi.org/10.3390/su11226419
Chicago/Turabian StyleChen, Hao, Ling He, Jiachuan Chen, Bo Yuan, Teng Huang, and Qi Cui. 2019. "Impacts of Clean Energy Substitution for Polluting Fossil-Fuels in Terminal Energy Consumption on the Economy and Environment in China" Sustainability 11, no. 22: 6419. https://doi.org/10.3390/su11226419
APA StyleChen, H., He, L., Chen, J., Yuan, B., Huang, T., & Cui, Q. (2019). Impacts of Clean Energy Substitution for Polluting Fossil-Fuels in Terminal Energy Consumption on the Economy and Environment in China. Sustainability, 11(22), 6419. https://doi.org/10.3390/su11226419


