Abstract
Streets, as one type of land use, are generally treated as developed or impervious areas in most of the land-use/land-cover studies. This coarse classification substantially understates the value of streets as a type of public space with the most complexity. Street space, being an important arena for urban vitality, is valued by various dimensions, such as transportation, recreation, aesthetics, public health, and social interactions. Traditional remote sensing approaches taking a sky viewpoint cannot capture these dimensions not only due to the resolution issue but also the lack of a citizen viewpoint. The proliferation of street view images provides an unprecedented opportunity to characterize street spaces from a citizen perspective at the human scale for an entire city. This paper aims to characterize and classify street spaces based on features extracted from street view images by a deep learning model of computer vision. A rule-based clustering method is devised to support the empirically generated classification of street spaces. The proposed classification scheme of street spaces can serve as an indirect indicator of place-related functions if not a direct one, once its relationship with urban functions is empirically tested and established. This approach is empirically applied to Beijing city to demonstrate its validity.
1. Introduction
Streets, as one type of land use, are generally treated as developed or impervious areas, or more specifically, as carrying the transport function in most land-use/land-cover (LULC) studies. This oversimplified classification entirely neglects the value of streets as a type of public space with the most complexity. Street space, as an important place for urban vitality, and its place-related activities and functions, such as recreation, aesthetics, public health, and social interactions, have been discussed and understood separately in specific domains of the literature [1]. There is still a lack of large-scale empirical studies that quantitatively test if the physical appearance of a street space can reflect fundamental urban functions for a large city. Furthermore, because of the richness and complexity of these functions the street space can serve, it remains intangible that how and where those streets serving different place-related functions are delineated and distributed spatially across a city. It would be greatly desirable for urban planners and researchers to obtain an indicator of specific urban functions for street spaces, as the information about the functions of street spaces cannot be collected as straightforwardly and directly as other land-use information.
The physical appearance of the street space, termed streetscape, and its characteristics have been the central interest for urban designers and planners. Traditional remote sensing as a standard approach to existing LULC research, taking a sky viewpoint, can hardly capture the relevant dimensions not only due to the resolution issue but also because of the lack of a citizen perspective. The proliferation of street view images (SVIs), such as Google StreetView, provides an unprecedented opportunity to characterize the streetscape from a citizen perspective at the human scale for an entire city. Taking advantage of this novel approach, this paper aimed to characterize and classify streetscapes based on features extracted from SVIs by deep learning methods that are well developed in computer vision. The proposed classification scheme for the streetscape can serve as an indirect indicator of place-related functions, if not a direct one, once its relationship with urban functions is empirically tested and established. This approach was empirically applied to Beijing city to demonstrate its validity.
The rest of this paper is organized as follows. The second section reviews the various urban functions that streets can serve from different domains of the literature and discusses the data approaches to the measurement of the physical appearance of street spaces. The third section introduces the study area and proposes an analytical framework of characterizing and classifying street spaces in order to test the correspondence of street features to urban functions. This is followed by a detailed description of the involved methods and data within the framework. Section 5 discusses the analytical results after applying the framework to the study area. Section 6 draws the conclusions and speculates on future work.
2. Literature Review
2.1. Urban Functions of Street Spaces
Streets have traditionally been considered an essential element of urban form and structure [1]. As a form of urban land use, streets are normally treated as linear public spaces connected to each other in a network, with buildings and other structures on one or each side. This particular structure allows them to serve many urban functions, such as mobility, commerce, recreation, aesthetics, public health, and social interactions. Among those functions, two main types of functions can be differentiated: Transport-related and place-related functions [1,2]. The former refers to the function of public infrastructure through which the movement of people, goods, and vehicles occurs, which has been a main focus of the discussions in transportation literature. The latter includes serving any kind of non-transport-related human activities taking place in this public space that may have one or many economic, civic, political, cultural, and social values. However, in most LULC studies, streets are generally treated as developed or impervious areas, or more specifically, as carrying the transport-related function, while their place-related functions have been largely overlooked in land classification.
The place-related functions of streets have been widely researched in the literature of urban studies, with a focus on pedestrians at the individual scale and their everyday activities and social interactions, such as walking, meeting, staying, and playing [3,4,5]. In these studies, special attention has been paid to how humans perceive, make use of, and interact with the physical environment of street spaces as accessible, safe, and vibrant urban places that can support various activities separately or simultaneously, as exemplified by the ‘livable streets’ and ‘complete streets’ movements [5,6,7,8,9]. The common idea in these notions about streets centers on improving people’s well-being and promoting urban prosperity, reflecting a recognition of the street space as an integral factor to achieve sustainable urban development. Specifically, studies of 100 cities around the world have found that proper management of street spaces plays a key role in five aspects of urban prosperity: Infrastructure development, environmental sustainability, productivity, quality of life, and equity and social inclusion [1].
Unlike other land uses, such as residential, commercial, and industrial types, the various place-related functions served by streets are not predesignated during planning and the information about these functions is rarely collected during use, although administrative agencies of transportation and urban planning usually maintain the classification of transport uses for roads, such as hierarchical road systems. Instead, the place-related functions of streets usually emerge as a result of human interaction with the physical environment of street spaces, hence the latter could somehow reflect those urban functions. Therefore, the richness and variation of the multi-functionality of streets and the lack of information about place-related functions in administrative data pose challenges to land-use classification in that how and where those streets serving different functions are delineated and distributed spatially across a city.
2.2. Measurement of Streetscape Features as a Reflection of Urban Functions
The physical appearance of urban form and structure is a strong indication of urban land uses, and thus is a traditional interest of LULC studies [10]. Remote sensing from aerial and satellite imageries of earth surfaces has become a standard approach to extracting land use information that indicates the functions of land covers. This approach has been working quite well for typical land uses, e.g., residence, commerce, and industry, other than streets. In nature, the standard approach takes a top-down bird’s eye viewpoint, which is good enough for two-dimensional land features, yet is incapable of sensing the street as a three-dimensional space, including the pavement of lanes, trees, facades of buildings on the sides, and other features. More importantly, the standard approach does not take a citizen perspective that senses and perceives the physical appearance of streets from a human viewpoint.
The measurement and quality of the streetscape, which refers to the appearance and arrangement of physical features of the street space, have been a central topic in the urban design literature [11,12,13]. Features characterizing the streetscape have been proposed, such as streetscape skeleton variables and streetscape or scene elements, among which important features include enclosure, openness, and greenery [12,14,15]. Enclosure is the property of a contained street space with room-like proportions related to the amount of building facades on each side of the street. Openness refers to the amount of sky visibility in the scene. Greenery is the proportion of green space covered by trees or other vegetation in the scene.
With the proliferation of spatial data and geographic information, geographic information system (GIS) and remote sensing techniques have been widely used to extract the streetscape features from data, such as building footprints, street parcels, and tree canopy mappings, in large-scale analysis at the city level. They have largely mitigated the drawbacks of the time-consuming approach of field audits, which are restricted to small-scale empirical studies [12,16]. However, due to the lack of a citizen viewpoint in these GIS data and methods, the streetscape features extracted from a pedestrian perspective remain missing. The advent of street view images from Google StreetView and similar online data services has opened the door of opportunities to remedy this disadvantage. A series of recent studies managed to extract streetscape features from SVIs and applied them in a range of applications, including the perception and quality of the urban environment [15,17,18,19,20], street livability and walkability [21,22,23,24], environmental audit for human health and wellbeing [25,26,27,28,29], urban inequality and socioeconomic changes of neighborhoods [30,31,32,33,34], urban safety [35,36], and information retrieval for adjacent land uses [37]. Among these studies, many assume implicitly or explicitly that the extracted streetscape features, representing the physical appearance of streets, from SVIs can reflect place-related functions that serve human activities both on the street and those associated with the uses of buildings on the sides [23,30,32,33,34,37]. However, a confirmatory testing of this relationship in a large-scale empirical study is still lacking. This research closes this gap in the literature.
3. Analytical Framework and Study Area
This research aimed to characterize and classify streetscapes based on features extracted from SVIs and empirically test if streetscape classes can reflect urban functions. Once this relationship is confirmed, the empirically generated classification of streetscapes can be used as a spatial indicator of the delineation and distribution of streets serving different urban functions. Specifically, SVIs were leveraged by a state-of-the-art deep learning model of computer vision to extract scene elements (e.g., sky, building, and tree) to construct features of enclosure, openness, and greenery. Then, a rule-based clustering approach was applied to classify the streetscapes into classes based on the diversity and complexity of the streetscape feature composition. Finally, we regressed these empirically generated streetscape classes on an extensive list of urban functions and activities-related factors to test if the streetscape feature can reflect urban functions. An analytical framework depicting these steps is detailed in Figure 1.
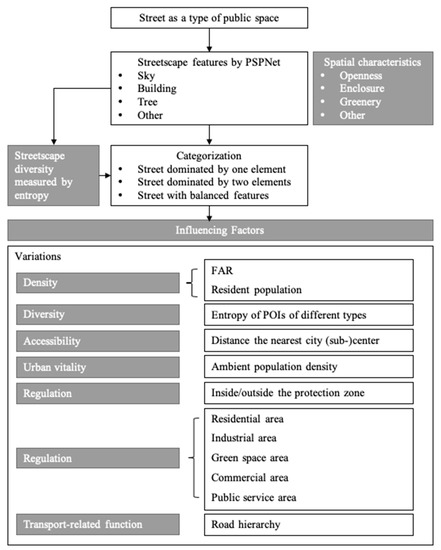
Figure 1.
Analytical framework.
This research was conducted within the area confined by the Fifth Ring Express Road in Beijing, an area of 667 km2 with a perimeter of 98.6 km (Figure 2). This area is a core area with the highest (re)development intensity and the highest population density in Beijing. It includes Beijing’s primary city center and several sub-centers, such as Zhongguancun, Financial Street, and CBD, and has urban and rural lands mixed together at the periphery. The street system in this area is complex. There are streets with transportation as the leading function, streets with balanced transportation and place-related functions, and also streets and Hutongs that play a main role for pedestrians instead of vehicles. In particular, Hutong is a representative traditional street form in Beijing old city and refers to narrow pathways or alleys enclosed by two rows of courtyards in traditional neighborhoods.
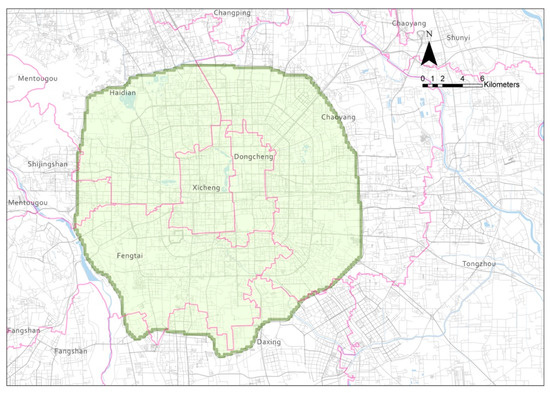
Figure 2.
A map of the study area, including six districts: Haidian, Chaoyang, Dongcheng, Xicheng, Fengtai, Daxing, and Shijingshan.
4. Methods and Data
4.1. Characterizing Streetscape from SVIs
We utilized street view images (SVIs), which were acquired from Baidu Maps, one of the largest big data venders in China. The SVIs were requested from the Baidu Maps API service with sample points generated along the streets at an interval of 100 m. The street network data were also from Baidu Maps. Theoretically, SVIs could be obtained from different lanes of a street. To better simulate the actual pedestrians’ perspective, we set the detailed request parameters for each sample point as follows: Image size: 480 × 600; compass heading of the camera: 0 degrees; the horizontal field of view of the image: 90 degrees. As a result, 42,077 SVIs with 800 × 500 pixels were collected for the period from March 1 to September 1 2018.
Currently, numerous deep learning models, including DCNN, FCN, and SegNet, have been applied in the task of image semantic segmentation [20]. However, specific to the field of streetscape image partition, the performance of these models may vary. A key factor lies in the lack of accurate scene perception. For instance, when partitioning an image taken on the 4th ring road, the shadow of trees may be mistakenly regarded as water due to a similar shape and color. However, given the prior knowledge that the image is taken on an express road, it is not likely that water would appear. By incorporating this information, the results of image recognition can be improved by considering the contextual information. Therefore, the most proper model should incorporate suitable strategies to understand the complex scene semantics of the streetscape in Beijing.
In this study, we employed PSPNet (Figure 3), a novel deep convolutional neural network model, to take advantage of its special architecture, which has been proven to be remarkably efficient and accurate in streetscape image segmentation [38]. PSPNet provides a strong ability to interpret the overall scene by extending the pixel-level clues to a global pyramid pooling one. Therefore, the model combines global and local features together to achieve a state-of-the-art performance. In addition, the loss function of PSPNet has been carefully designed to have a better optimization strategy. The PSPNet model was pre-trained on the cityscape dataset, which is a representative repository containing 5000 SVIs [39]. We further fine-tuned the model using 500 high-quality pixel-level annotated SVIs provided by Baidu Maps to achieve a better classification accuracy in our task.
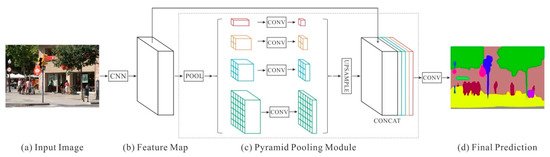
Figure 3.
Overview of image semantic segmentation using PSPNet: (a) Input image; (b) feature map; (c) pyramid pooling module; and (d) final prediction
SVIs were partitioned into 21 different categories (Figure 4), including major elements, such as the sky, roads, and trees, as well as secondary elements, such as dustbins, billboards, and traffic lights. For each SVI, the number of pixels for every category was recorded and further calculated as proportions. As a result, streetscape elements were characterized as proportions of a scene view for each SVI at the 42,077 sample locations in the study area (Figure 5). Specifically, the proportion of sky represent the openness of a street canyon: A higher proportion of sky is usually related to an open street where buildings and trees are relatively low in height compared with the width of the street. The proportion of building stands for the degree of enclosure of a street. A higher proportion of building often indicates a so-called street wall or a Hutong with relatively tall buildings along the streets. Another import indicator that reflects the quality of a street is the proportion of tree, which reflects the degree of street greenery that pedestrians actually perceive, rather than the projected area of trees.
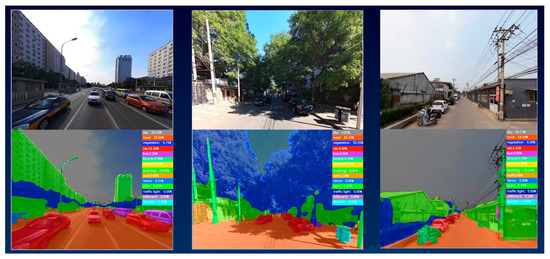
Figure 4.
Street view scene segmentation results of the trained PSPNet: Street view images before (top) and after the segmentation (bottom). Legend items from top to bottom: Sky, road vegetation, car bus, bicycles, person, building, wall, fence, pole, traffic light, billboard, and dustbin.
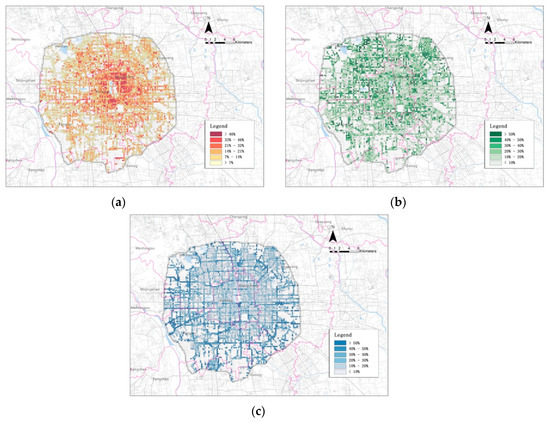
Figure 5.
The proportions of (a) building, (b) tree, and (c) sky per grid.
4.2. Classifying Streetscape
To further measure the streetscape at the local neighborhood level that forms a rather homogeneous scene character, a grid scheme of 250 by 250 m was empirically adopted. Grids, instead of street segments, were chosen as the unit of analysis based on the following considerations. As the streetscape characteristics can vary along a street segment, especially for a long one, the length of the street segments varies greatly in Beijing, making the street segment an inappropriate unit of analysis to capture a homogeneous scene of the streetscape at its pertaining level. In addition, other data can be easily aggregated or disaggregated at the level of grids, which facilitates an efficient way of data integration. A total of 5844 grids, which contained sample locations of SVIs, were generated with about 7 SVI locations per grid on average. In other words, each grid contained at least one location and up to 36 locations. The proportion of a streetscape element within a grid was computed by taking the average of the proportion of the element at all SVI locations within that grid.
In order to reflect the place-related function of the streetscape, we clustered the streetscape of grids into classes based on the streetscape features extracted from SVIs. According to existing research [15,17,19], using the three dimensions of enclosure, openness, and greenery features is sufficient to portray the spatial characteristics of streets, while keeping the model as easy to interpret and analyze. In order to support the rule-based classification, we used information entropy [40] to measure the proportional relationship between these streetscape elements. The calculation formula of information entropy is as follows:
where is the proportion of sky, tree, building, and other elements. The distribution of can be converted to a heavy-tailed distribution by taking:
The distribution of in Figure 6 provides evidence on how streetscape elements mix. The landscape patterns are highly or moderately balanced in most grids, which are characterized by low values (high entropy values). In contrast, there are also grids with relatively high values (low entropy value), which indicates that the form of the streets in these grids may be dominated by certain elements. Inspired by Jiang’s work [41], a head/tail breaks method was introduced here to provide further insight. Specifically, we partitioned the entire range of the values at the mean, then took the part with larger values and partitioned it at its mean value. By continuing this process recursively, we obtained a smaller range of higher (lower entropy) values. In this case, the process was executed twice with two breaks: The first break at the mean point of 0.48 (entropy = 2.1); the second break at the mean point of 0.52 (entropy = 1.9). With the two breaks, three ranges were formed, and each range allowed a further exploration of the ratios between any two element proportions among the three elements.
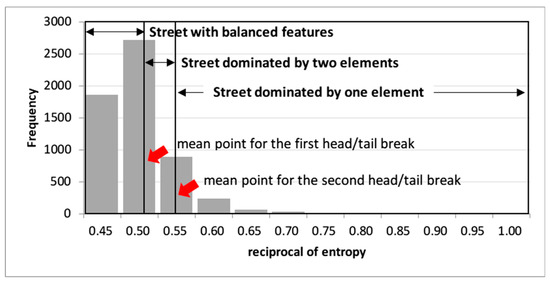
Figure 6.
Distribution of Lr representing the diversity of streetscape elements.
When (Figure 7), the proportion of the three elements are close in that the majority of the grids have ratios of any two element proportions distributed between 0.5 and 1.0, indicating a balanced streetscape. When (Figure 8), for most grids, the ratios of the two largest element proportions are greater than 0.5, while the ratios of the two smallest element proportions are less than 0.5. It means that there are the two dominating elements with comparable proportions in these grids. When (Figure 9), most grids have the ratios of the two largest element proportions less than 0.5, while only a slightly greater number of grids have ratios of the two smallest element proportions less than 0.5. It is evident that there is a dominating element in these grids and the influence of the other two elements is minor.
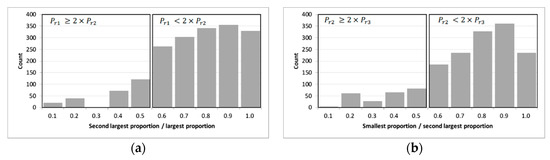
Figure 7.
Distributions of (a) the ratio of the second largest proportion to the largest proportion and (b) the ratio of the smallest proportion to the second largest proportion for grids with .
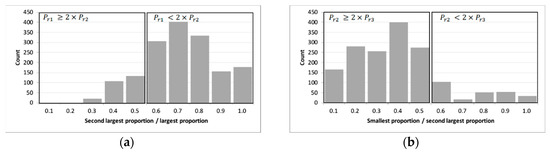
Figure 8.
Distributions of (a) the ratio of the second largest proportion to the largest proportion and (b) the ratio of the smallest proportion to the second largest proportion for grids with .
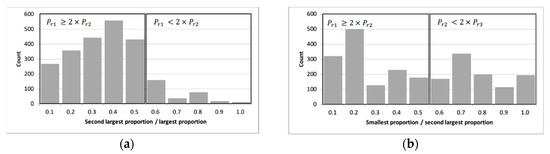
Figure 9.
Distributions of (a) the ratio of the second largest proportion to the largest proportion and (b) the ratio of the smallest proportion to the second largest proportion for grids with .
Given the distributions in Figure 7, Figure 8 and Figure 9, a set of rules can be derived to classify the streetscape grids. The distributions of the generated streetscape classes are detailed in Figure 10 and Table 1.
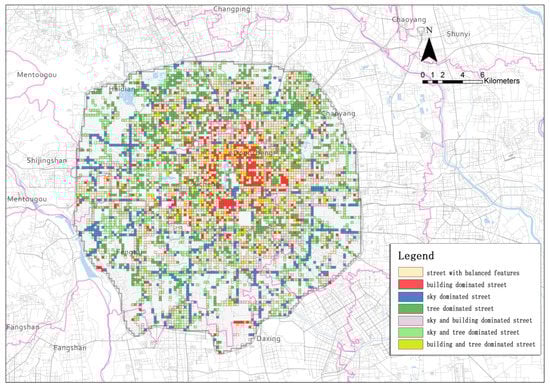
Figure 10.
The spatial distribution of the seven empirically generated streetscape classes.

Table 1.
Percentages of grids for seven streetscape classes.
(1) Single-feature-dominated streets. Single-feature-dominated classes were defined as the proportion of any feature for openness (sky), enclosure (building), or greenery (tree) being at least two times larger than that of the second largest feature. Three classes were generated based on this rule: Openness (S), enclosure (B), and greenery (T):
where the proportion of the largest feature; the proportion of the second largest feature.
(2) Two-feature-dominated streets. Two-feature-dominated classes were defined as the proportions of the two largest features among the three being relatively close, in that the larger one is less than twice that of the smaller one. They are both much larger than the proportion of the smallest feature in that the second largest proportion is at least twice that of the smallest proportion. Three classes were generated based on this rule: Enclosure/openness (BS), greenery/openness (TS), and greenery/enclosure (TB):
where the proportion of the smallest feature.
(3) Streets with balanced features. This class was defined as the proportion of all three features being relatively close in that the largest proportion is less than the twice that of the second largest proportion and the second largest proportion is less than twice that of the smallest proportion. One class was generated based on this rule: Enclosure/openness/greenery (A):
4.3. Variables of Urban Functions and Model Specification
An extensive list of factors related to urban functions and activities were identified and obtained from the seven categories (Table 2). The first six are place-related urban functions, while the last is the transport-related function. Figure 11 demonstrates the spatial distributions of some of the variables.
Table 2.
Variable description.
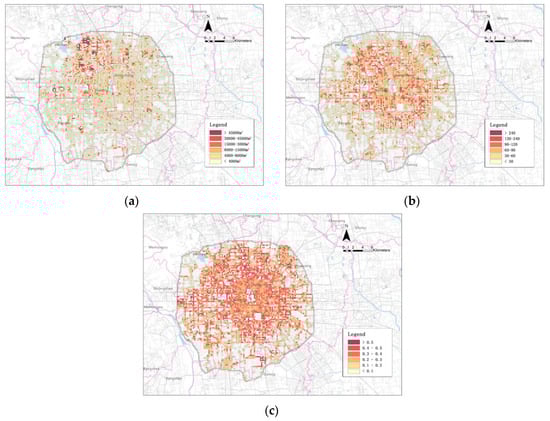
Figure 11.
Total land area of (a) public service facilities; (b) ambient population; and (c) diversity of urban services.
The density of the urban space is mainly characterized by two indicators: FAR (floor area ratio) and the resident population. FAR was defined as the ratio of a building’s total floor area to the size of the piece of land upon which it is built. FAR were derived based on the building footprint data and land use survey data. The building footprint data were sourced from Baidu Maps and the land use survey data were provided by the land administration of Beijing city and was collected in 2015. The resident population reflects the density from a perspective of human dwellings. It was estimated through China Unicom cellphone data over a long period of time to identify users’ home locations and was aggregated to grids. The population density of neighborhoods may represent different socioeconomic statuses and preferences of residents.
For the diversity of urban services, we present an entropy-based measure using point-of-interest (POI) data. Specifically, the number of each type of POI by the grid was recorded and the index of diversity was computed as follows:
where is the proportion of a certain kind of POI and is the ratio of this kind of POI’s count to the count of all POIs in the grid. The larger the value, the higher the diversity of urban functions. A high degree of functional mix may indicate a commercial center or a mature community, while a low degree of functional mix is more relevant to industrial or suburban areas.
We defined the accessibility of a grid by its geographical distance to the nearest city center. Accessibility impacts street space through its influence on land value. The closer the neighborhood is to the city center, the higher the land value, and the more compact the city space. The vitality of a neighborhood was measured by the ambient population of a grid. The ambient population is a temporally averaged measure of human activity intensity. Different from resident population, ambient population considered the average volume of people appearing in a grid. The data were sourced from China Unicom and were collected from August 1 to August 7, 2018. The protection zone of Beijing old city is located at the core area of our study area. Its boundary was defined as the second ring road. The total area of the protection zone is around 62 km2. Protection regulations are direct influence factors of the streetscapes. By regulating FAR, building height, etc. to preserve the traditional pattern of the old city, the forms of streets can be effectively maintained. The adjacent land uses on the sides of streets include residential, commercial, industrial, green space, and public service types. The area of each type of land uses for each grid was extracted from the Beijing Land-use Survey Data of 2015.
The transport-related function of a street/road is represented by its hierarchy in the transportation system. According to the traffic capacity of streets, there are mainly two levels: Main streets and secondary/branch streets. All grids were divided into two categories: Main-street-dominated grids and secondary-street-dominated grids, according to the proportion of the length of each type of streets. A strong transportation function leads to a large street width, resulting in an increase of the proportion of sky and a decrease of the proportion of other streetscape elements accordingly.
Because the dependent variable, the streetscape class, is categorical, multinomial logistic regression was used for model estimation. We have two model specifications: 1) To test if the streetscape features reflect place-related functions from the first six categories of variables; and 2) to test if the streetscape features reflect place-related functions from the first six categories of variables while controlling for the variables of the transport-related function. As the streetscape class A is a balanced feature class, it was used as the reference alternative for both model estimations:
where are variables of the place-related functions, is the multinomial logistic regression formulation, is the probability of an alternative of the generated seven streetscape classes:
where are variables of the transport-related function.
5. Results and Discussions
Table 3 presents the general goodness of fit for the two model estimations. These testing statistics indicate that both models are acceptable. Compared to model 1, model 2 gains a better goodness of fit due to the addition of transport-related variables, which may be correlated with some of the place-related variables and thus inflate the goodness of fit. This will be investigated in more detail in the following variable discussions. Table 4 and Table 5 show the results of models 1 and 2, respectively. All coefficients of the variables were estimated regarding any other alterative class relative to the balanced streetscape class (A). As only the sign direction of the coefficients and the significance level are of the interest, Table 4 and Table 5 are the simplified results. Here, 95% was empirically taken as the significance level for model interpretation.
Table 3.
Model fitting.
Table 4.
Results of model 1.
Table 5.
Results of model 2.
The results of model 1 (Table 4) show shat all place-related function variables have certain significant effects on some streetscape classes, while, on the other hand, all streetscape classes reflect the significant influence from certain place-related function variables. It means that: 1) There is no waste of variables; and 2) the six categories of place-related variables are able to differentiate all the streetscape classes. Specifically, FAR has a significant impact on several streetscape classes. Higher FAR usually means a higher building volume, leading to well-enclosed street spaces. In particular, FAR has a positive effect on building-dominated streets and a negative effect on the streets where openness is at least one of the dominant features. The resident population has a significant positive effect on tree-dominated streets, showing greenery as an amenity for residential choice. The diversity of urban services has a significant negative effect on tree-dominated streets. This indicates that areas with a high diversity of urban services are mainly located in more commercialized areas where the degree of greenery is lacking.
The distance to the nearest city center has a positive effect on the building- and tree-dominated streets. It is an indication that urban peripheries are less developed and have less greenery compared to urban centers. Urban vitality has a negative effect on the tree-dominated streets, which is less likely in city centers. The protection zone of Beijing’s historical and cultural city also affects the character of streets. According to the protection planning and regulations, the land use and density are strictly controlled to preserve the traditional street patterns. The streets mainly comprise small-scale roads and Hutongs, making building-dominated streets and building- and tree-dominated streets as the most common streetscapes within this area. As a result, the zoning has a positive effect on these two types of streetscapes.
Land-use-related variables all have significant effects on at least one class of streetscape. Residential land has a positive influence on the greenery and enclosure of street space where trees and buildings are dominant features. Commercial lands have a positive effect on the enclosure and openness of the streets, reflecting a common scene in commercial centers where buildings and the sky are dominant features. Green spaces unquestionably affect the streetscapes with trees as the dominant feature. Industrial lands have a positive influence on tree- and building-dominated streets as they are often located in suburban areas. Public service lands have a positive effect on the greenery of streets, as the administrative, school, and hospital campuses usually consider green space as an amenity, while openness is not a requirement.
Compared to model 1, model 2 examines the variation of effects from place-related functions on the streetscape with the presence of the effects from the transport-related functions. There is almost no change for the significance and direction of the effects from variables in the categories of density, diversity, accessibility, vitality, and regulation. For variables of land use, residential and industrial lands become insignificant in influencing any streetscape class and public service lands become insignificant in affecting streets with trees and buildings as the dominant features. The effects of other land types do not change. In contrast, streets with the secondary road function gain significance in positively influencing the tree- and building-dominated streetscape, which has lost the influence from residential, industrial, and public service lands. This could be explained by the association or interaction between the secondary road function and the above three land uses, as road levels affect not only the traffic capacity but also the development type of surrounding areas. On the contrary, the place-related functions from the categories of density, diversity, accessibility, vitality, and regulation are less associated with the transportation function, resulting in their invariant effects on streetscapes. Besides, both levels of road functions have non-positive effects on streetscapes with a high degree of openness and the secondary road function has significant effects on almost all classes of streetscapes, which means that the transport-related variables are less differentiative for streetscape classes compared to place-related variables.
6. Conclusions and Future Work
This study proposed an analytical framework for characterizing and classifying streetscapes based on features extracted from large-scale street view images collected for a city through a state-of-the-art deep learning model of computer vision. With the constructed streetscape features of enclosure, openness, and greenery, a rule-based clustering method was devised to support the empirically generated classification of streetscapes based on the diversity and complexity of those features. The derived streetscape classes delineating street spaces geographically were tested against six categories of place-related factors with and without a set of transport-related variables by two multinomial logit models, respectively. The results formally confirmed that streetscape classes indeed reflect and correspond to certain urban functions with an acceptable model fitting. We found that the six categories of place-related variables were capable of differentiating all identified streetscape classes. Based on the comparison of the two models, we also found that place-related variables from the categories of density, diversity, accessibility, vitality, and regulation were more robust than land-use variables as they were less associated and interacted with transport-related variables, which in turn validated the selection of these place-related variables. Last, but not least, transport-related variables were shown to be less useful in differentiating between the streetscape classes, which is evidence of the deficiency of street space classification only based on transport-related functions.
As the relationship that streetscape features reflect place-related urban functions was confirmed, the empirically generated classes of streetscapes can be used as a spatial indicator of the delineation and distribution of streets serving different urban functions (Figure 10). It would be greatly desirable for urban planners and researchers to obtain such a spatial indicator of urban functions for street spaces, as the information cannot be collected as straightforwardly and directly as other land uses. Furthermore, this indicator can facilitate the evaluation of the usage of street spaces by considering the mixed use of various urban functions, interactions with adjacent land uses, and provision of transport options beyond the automobile, and thus it can aid the design of multi-functional streets that are more livable.
This research serves as an initial study of street space classification based on street view images. For a large city, such as Beijing, including a hierarchy of urban centers and peripheries, spatial heterogeneity plays an important role for any spatial indicators of urban functions. The consideration of spatial heterogeneity could be incorporated into the derivation of clusters and the model estimations in future research. In addition, direct indicators of urban functions for streets can be obtained via an on-site survey and field work, which should be incorporated in future studies to further validate the proposed indirect indicator in this research.
Author Contributions
Conceptualization, Z.G. and Q.M.; methodology, Q.M. and Z.G.; validation, Q.M. and Z.G.; formal analysis, Q.M. and Q.Q.; investigation, Z.G. and Q.M.; resources, C.K.; writing—original draft preparation, Z.G. and Q.M.; writing—review and editing, Z.G. and Q.M; visualization, Q.M.; project administration, Q.M.; funding acquisition, Q.M.
Funding
This research was funded by Beijing Municipal Natural Science Foundation, grant number No.8182027. Project name: Research on the Healthy City Planning Approaches of Beijing Based on the Analysis of Social Sensing Data.
Conflicts of Interest
The authors declare no conflict of interest.
References
- Mboup, G.; Warah, R. United Nations Human Settlements Programme. In Streets as Public Spaces and Drivers of Urban Prosperity; UN-Habitat: Nairobi, Kenya, 2013; ISBN 978-92-1-132590-4. [Google Scholar]
- Hidalgo, A.K. Urban streets: Towards a psychological restorative function. In Proceedings of the 2nd Future of Places International Conference on Public Space and Placemaking (Ed.), Streets as Public Spaces and Drivers of Urban Prosperity, Stockholm, Sweden, 4–26 June 2013; pp. 240–258. [Google Scholar]
- Jacobs, J. The Death and Life of Great American Cities, Vintage Books ed.; Vintage Books: New York, NY, USA, 1992; ISBN 978-0-679-74195-4. [Google Scholar]
- Brower, S.N. Design in Familiar Places: What Makes Home Environments Look Good; Praeger: New York, NY, USA, 1988; ISBN 978-0-275-92686-1. [Google Scholar]
- Gehl, J. Life Between Buildings: Using Public Space; Island Press: Washington, DC, USA, 2011; ISBN 978-1-59726-827-1. [Google Scholar]
- Lynch, K. Good City Form; MIT Press: Cambridge, MA, USA, 1984; ISBN 978-0-262-62046-8. [Google Scholar]
- Jacobs, A.B. Great Streets; MIT Press: Cambridge, MA, USA, 1993; ISBN 978-0-262-10048-9. [Google Scholar]
- Appleyard, D. Livable Streets: Protected Neighborhoods? Ann. Am. Acad. Pol. Soc. Sci. 1980, 451, 106–117. [Google Scholar] [CrossRef]
- McCann, B.; Rynne, S. Complete the streets. Planning 2005, 71, 18–23. [Google Scholar]
- Meyer, W.B.; Turner, B.L. Changes in Land Use and Land Cover: A Global Perspective; University Corporation for Atmospheric Research, Ed.; Cambridge University Press: Cambridge, UK, 1994; ISBN 978-0-521-47085-8. [Google Scholar]
- Hartanti, N.B.; Martokusumo, W. Streetscape connectivity and the making of urban identity. In Proceedings of the Arte-Polis-4 International Conference, Bandung, Indonesia, 5–6 July 2012. [Google Scholar]
- Harvey, C.; Aultman-Hall, L.; Troy, A.; Hurley, S.E. Streetscape skeleton measurement and classification. Environ. Plan. B Urban Anal. City Sci. 2017, 44, 668–692. [Google Scholar] [CrossRef]
- Zhang, F.; Zhang, D.; Liu, Y.; Lin, H. Representing place locales using scene elements. Comput. Environ. Urban Syst. 2018, 71, 153–164. [Google Scholar] [CrossRef]
- Ewing, R.H.; Clemente, O. Measuring Urban Design: Metrics for Livable Places; Island Press: Washington, DC, USA, 2013; ISBN 978-1-61091-193-1. [Google Scholar]
- Tang, J.; Long, Y. Measuring visual quality of street space and its temporal variation: Methodology and its application in the Hutong area in Beijing. Landsc. Urban Plan. 2019, 191, 103436. [Google Scholar] [CrossRef]
- Kendal, D.; Williams, N.S.G.; Williams, K.J.H. Drivers of diversity and tree cover in gardens, parks and streetscapes in an Australian city. Urban For. Urban Green. 2012, 11, 257–265. [Google Scholar] [CrossRef]
- Zhang, F.; Zhou, B.; Liu, L.; Liu, Y.; Fung, H.H.; Lin, H.; Ratti, C. Measuring human perceptions of a large-scale urban region using machine learning. Landsc. Urban Plan. 2018, 180, 148–160. [Google Scholar] [CrossRef]
- Zhang, F.; Hu, M.; Che, W.; Lin, H.; Fang, C. Framework for Virtual Cognitive Experiment in Virtual Geographic Environments. ISPRS Int. J. Geo-Inf. 2018, 7, 36. [Google Scholar] [CrossRef]
- Liu, L.; Silva, E.A.; Wu, C.; Wang, H. A machine learning-based method for the large-scale evaluation of the qualities of the urban environment. Comput. Environ. Urban Syst. 2017, 65, 113–125. [Google Scholar] [CrossRef]
- Dubey, A.; Naik, N.; Parikh, D.; Raskar, R.; Hidalgo, C.A. Deep Learning the City: Quantifying Urban Perception at a Global Scale. In Proceedings of the Computer Vision–ECCV 2016, Amsterdam, The Netherlands, 11–14 October 2016; Leibe, B., Matas, J., Sebe, N., Welling, M., Eds.; Springer: Cham, Switzerland; Amsterdam, The Netherlands, 2016; Volume 9905, pp. 196–212. [Google Scholar]
- Li, X.; Zhang, C.; Li, W.; Ricard, R.; Meng, Q.; Zhang, W. Assessing street-level urban greenery using Google Street View and a modified green view index. Urban For. Urban Green. 2015, 14, 675–685. [Google Scholar] [CrossRef]
- Long, Y.; Liu, L. How green are the streets? An analysis for central areas of Chinese cities using Tencent Street View. PLoS ONE 2017, 12, e0171110. [Google Scholar] [CrossRef] [PubMed]
- Li, X.; Santi, P.; Courtney, T.K.; Verma, S.K.; Ratti, C. Investigating the association between streetscapes and human walking activities using Google Street View and human trajectory data. Trans. GIS 2018, 22, 1029–1044. [Google Scholar] [CrossRef]
- Ye, Y.; Richards, D.; Lu, Y.; Song, X.; Zhuang, Y.; Zeng, W.; Zhong, T. Measuring daily accessed street greenery: A human-scale approach for informing better urban planning practices. Landsc. Urban Plan. 2019, 191, 103434. [Google Scholar] [CrossRef]
- Helbich, M.; Yao, Y.; Liu, Y.; Zhang, J.; Liu, P.; Wang, R. Using deep learning to examine street view green and blue spaces and their associations with geriatric depression in Beijing, China. Environ. Int. 2019, 126, 107–117. [Google Scholar] [CrossRef]
- Weichenthal, S.; Hatzopoulou, M.; Brauer, M. A picture tells a thousand…exposures: Opportunities and challenges of deep learning image analyses in exposure science and environmental epidemiology. Environ. Int. 2019, 122, 3–10. [Google Scholar] [CrossRef]
- Ji, J.S.; Zhu, A.; Bai, C.; Wu, C.-D.; Yan, L.; Tang, S.; Zeng, Y.; James, P. Residential greenness and mortality in oldest-old women and men in China: A longitudinal cohort study. Lancet Planet. Health 2019, 3, e17–e25. [Google Scholar] [CrossRef]
- Wang, R.; Helbich, M.; Yao, Y.; Zhang, J.; Liu, P.; Yuan, Y.; Liu, Y. Urban greenery and mental wellbeing in adults: Cross-sectional mediation analyses on multiple pathways across different greenery measures. Environ. Res. 2019, 176, 108535. [Google Scholar] [CrossRef]
- Wijnands, J.S.; Nice, K.A.; Thompson, J.; Zhao, H.; Stevenson, M. Streetscape augmentation using generative adversarial networks: Insights related to health and wellbeing. Sustain. Cities Soc. 2019, 49, 101602. [Google Scholar] [CrossRef]
- Naik, N.; Kominers, S.D.; Raskar, R.; Glaeser, E.L.; Hidalgo, C.A. Computer vision uncovers predictors of physical urban change. Proc. Natl. Acad. Sci. USA 2017, 114, 7571–7576. [Google Scholar] [CrossRef]
- Salesses, P.; Schechtner, K.; Hidalgo, C.A. The Collaborative Image of the City: Mapping the Inequality of Urban Perception. PLoS ONE 2013, 8, e68400. [Google Scholar] [CrossRef]
- Ye, Y.; Xie, H.; Fang, J.; Jiang, H.; Wang, D. Daily Accessed Street Greenery and Housing Price: Measuring Economic Performance of Human-Scale Streetscapes via New Urban Data. Sustainability 2019, 11, 1741. [Google Scholar] [CrossRef]
- Zhang, F.; Wu, L.; Zhu, D.; Liu, Y. Social sensing from street-level imagery: A case study in learning spatio-temporal urban mobility patterns. ISPRS J. Photogramm. Remote Sens. 2019, 153, 48–58. [Google Scholar] [CrossRef]
- Glaeser, E.L.; Kominers, S.D.; Luca, M.; Naik, N. Big Data and Big Cities: The Promises and Limitations of Improved Measures of Urban Life. Econ. Inq. 2018, 56, 114–137. [Google Scholar] [CrossRef]
- Naik, N.; Philipoom, J.; Raskar, R.; Hidalgo, C. Streetscore-Predicting the Perceived Safety of One Million Streetscapes; IEEE: Columbus, OH, USA, 2014; pp. 779–785. [Google Scholar]
- Li, X.; Zhang, C.; Li, W. Does the Visibility of Greenery Increase Perceived Safety in Urban Areas? Evidence from the Place Pulse 1.0 Dataset. ISPRS Int. J. Geo-Inf. 2015, 4, 1166–1183. [Google Scholar] [CrossRef]
- Li, X.; Zhang, C.; Li, W. Building block level urban land-use information retrieval based on Google Street View images. GIScience Remote Sens. 2017, 54, 819–835. [Google Scholar] [CrossRef]
- Zhao, H.; Shi, J.; Qi, X.; Wang, X.; Jia, J. Pyramid Scene Parsing Network. In Proceedings of the IEEE Conference on Computer Vision and Pattern Recognition, Honolulu, HI, USA, 21–26 July 2017; pp. 2881–2890. [Google Scholar]
- Cordts, M.; Omran, M.; Ramos, S.; Rehfeld, T.; Enzweiler, M.; Benenson, R.; Franke, U.; Roth, S.; Schiele, B. The Cityscapes Dataset for Semantic Urban Scene Understanding; IEEE: Las Vegas, NV, USA, 2016; pp. 3213–3223. [Google Scholar]
- Song, Y.; Merlin, L.; Rodriguez, D. Comparing measures of urban land use mix. Comput. Environ. Urban Syst. 2013, 42, 1–13. [Google Scholar] [CrossRef]
- Jiang, B. Head/Tail Breaks: A New Classification Scheme for Data with a Heavy-Tailed Distribution. Prof. Geogr. 2013, 65, 482–494. [Google Scholar] [CrossRef]
© 2019 by the authors. Licensee MDPI, Basel, Switzerland. This article is an open access article distributed under the terms and conditions of the Creative Commons Attribution (CC BY) license (http://creativecommons.org/licenses/by/4.0/).