Article

Study of a Li-Ion Cell Kinetics in Five Regions to Predict Li Plating Using a Pseudo Two-Dimensional Model

by
Sanaz Momeni Boroujeni
* and
Kai Peter Birke
Electrical Energy Storage Systems, Institute for Photovoltaics, University of Stuttgart, Pfaffenwaldring 47, 70569 Stuttgart, Germany
*
Author to whom correspondence should be addressed.
Sustainability 2019, 11(22), 6392; https://doi.org/10.3390/su11226392
Submission received: 17 October 2019 / Revised: 5 November 2019 / Accepted: 7 November 2019 / Published: 14 November 2019

Abstract

:
Detecting or predicting lithium plating in Li-ion cells and subsequently suppressing or preventing it have been the aim of many researches as it directly contributes to the aging, safety, and life-time of the cell. Although abundant influencing parameters on lithium deposition are already known, more information is still needed in order to predict this phenomenon and prevent it in time. It is observed that balancing in a Li-ion cell can play an important role in controlling lithium plating. In this work, five regions are defined with the intention of covering all the zones participating in the charge transfer from one electrode to the other during cell cycling. We employ a pseudo two-dimensional (P2D) cell model including two irreversible side reactions of solid electrolyte interface (SEI) formation and lithium plating (Li-P) as the anode aging mechanisms. With the help of simulated data and the Nernst–Einstein relation, ionic conductivities of the regions are calculated separately. Calculation results show that by aging the cell, more deviation between ionic conductivities of cathode and anode takes place which leads to the start of Li plating.

1. Introduction

Lithium ion (Li-ion) batteries were first developed in the 1970s [1,2,3]. After two decades of intensive materials development, Li-ion cells were commercialized by Sony in 1991 [4,5]. Constructed as the best compromise due to many excessive failures of rechargeable Li-metal cells beforehand, Li-ion cells have undergone a tremendous evolution in the last few decades and have been widely utilized for energy storage in different portable, computing, and telecommunicating devices as well as electrified transport vehicles. Clean electric conveyances are a possible way to reduce the environmental impact of private transport and abate about 10–20% of the emissions [6,7]. However, increasing the energy density of Li-ion batteries to accomplish the actual demand of electrified vehicles is of importance. As a solution, electrodes have to become thicker and denser. If the negative carbon-based electrode is manufactured with a higher thicknesses, more density, and less electrolyte uptake, then the occurrence of Li-plating becomes an unavoidable issue. Moreover, capacity retention, lifetime, fast and low temperature charging, and safety performance of the cells still require improvements. These challenging demands are all directly or indirectly influenced by lithium deposition [8,9,10]. The appearance of metallic lithium on the surface of carbon particles is a complex function of temperature, aging, and cycle loads.
Lithium deposition or lithium plating, which generally means the formation of metallic lithium on the negative electrode is an all-time undesirable phenomenon, contributing to cell performance degradation, reducing the cell durability and cyclability. Additionally, it significantly raises safety issues [11]. Avoiding or suppressing the lithium deposition reaction is essential to the reliability and also improvement of Li-ion cells. This paper introduces a way to investigate plating occurrence. Therefore, it is important to describe the phenomenon of Li-Plating in more details.
While charging, lithium ions are extracted from the cathode, diffuse through the electrolyte, and intercalate into the graphite structure of the negative electrode. The Li + charge transfer process (CTP) takes place on the surface of electrode particles, meaning the de-solvation of solvated lithium ion from the electrolyte, transferring through the solid electrolyte interface (SEI) layer and entering into the electrode particle, becoming an intercalated lithium. The intercalated lithium diffuses further inside the insertion electrode, i.e., the graphene planes of graphite, preventing the particle surface to reach saturation. This is called the lithium solid diffusion process (SDP). Depending on the operation conditions e.g., at a high C-rate, low temperature and high state of charge (SOC), the CTP and SDP will be the limiting factor, respectively. It means the speed of the lithium ion flow in the electrolyte is exceeding the charge transfer process or solid diffusion. Consequently, the lithium deposition reaction can occur instead or in parallel with intercalation. Thermodynamically, lithium plating is not favorable in comparison to intercalation since its reaction enthalpy is more positive [12,13]. Nevertheless, during a charge process, due to the deviation from equilibrium, an induced overpotential is formed [14] which may cause the anode potential to drop below 0 V vs. Li + /Li and consequently the lithium deposits on the surface of the graphite particle [15]. It should be noted that for intercalation, the potential range is from 200 to 65 mV vs. Li + /Li [13]. Lithium solid diffusion overpotential and charge transfer overpotential, which enable the lithium deposition reaction, are the kinetic causes of this phenomenon. Operating conditions like low temperature (below 25 C), fast charging, and high SOCs increase the cell overpotentials [16,17].
According to the literature [18], a Li + ion which is transferred from electrolyte to the anode experiences discrete energy barriers at different regions. Diffusing in the electrolyte (considered a liquid) has a relatively low energy barrier while charge transfer through the SEI usually has the biggest activation energy (E a ) and diffusion of Li into graphite has a moderate energy barrier in the range of 0.22–0.4 eV, increasing by x in Li x C 6 [19,20]. According to Arrhenius, a low temperature slows down the reactions [14] which means less Li + ions can overcome the charge transfer energy barrier to intercalate. At the same time, the solid diffusion of Li happens more sluggish at high SOCs. Therefore, when the charging current is high enough to induce a big ion flux toward the anode, so that the Li solid diffusion rate cannot compete, lithium deposition happens with a higher probability [15,17,21].
There is some literature investigating factors influencing CTP kinetics. Some believe that the Li + de-solvation step is always slower than Li + transferring through the SEI [22,23]. Some other investigate different electrode as well as electrolyte materials and conclude that the kinetics of Li + charge transfer process is controlled by the chemistry of the electrode components and their interfacial layer. By having a SEI layer with a low energy barrier for conducting Li + , the de-solvation step is limiting and vice versa if the SEI layer is not conductive enough [24].
Numerical simulations provide quantitative information to further investigate the phenomenon. Firstly Arora et al. [25] introduced a numerical way for describing and predicting the lithium deposition at charge and overcharge. Years later Tang et al. [26] extended the previous work to 2D. Legrand et al. [13] investigated Li-P (lithium plating) through CTP limitations by an electrochemical model, yet they have not examined the SPD process. Jiang et al. [27] proposed characteristic times to explain charge and species transport limitations in Li-ion batteries, but they did not cover the aging influences. Understanding the lithium plating phenomenon has been the focus of many studies, however there is still a lack of information on the mechanisms of transport-related performance limitations during charge/discharge operations over the life time of Li-ion cells. In the present model-based study we investigate the transport mechanisms behavior of Li-ion cell over 400 cycles. Aging mechanisms are included by a growing surface layer consisting of SEI and plated lithium. We introduce and explain five regions in the cell (A-E) which are contributing to the Li + charge transfer and Li solid diffusion processes. Ionic conductivities of these regions are calculated afterwards. The cell aging behavior and appearance of Li plating from the 116th cycle of the simulated cell are explained and discussed with the help of ionic conductivity variation in the mentioned regions.
The paper is organized as follows. Section 2 explains the transport regions and implementation of our P2D (pseudo two-dimensional) model. In Section 3 we show the validation of our calculations, discuss the model results, and explain them with the help of ionic conductivity calculations. Section 4 summarizes the results.

2. Theory

2.1. Transport Regions

In addition to electrical conduction, ionic conductivity in the electrodes and electrolyte is necessary for the completion of electrochemical reactions. Charged species, including Li-ions can pass through a media under two driving forces: An externally applied electric field and/or a concentration gradient which is described in the Nernst–Planck relation:
j i o n = c i o n v i o n = u i o n z i o n q k T ( c i o n + F k T c i o n ϕ ) = D i o n ( c i o n + F k T c i o n ϕ )
where j i o n is the ionic current density, v i o n is the drift velocity, u i o n is the electrical mobility of ions, z i o n is the valence number, and q is the charge. K is the Boltzamn constant, D i o n is the diffusion coefficient, and ϕ is the gradient of potential. Ohm’s law is the relation between current density (i), conductivity ( σ ), and the electric field ( ζ ). By substituting the ionic current density (j) for i into Ohm’s relation and including chemical potential in driving forces, as it is needed for the ions, then rewriting the derived formula for σ i o n and finally comparing it with Nernst–Plank relation we come to an equation called the Nernst–Einstein:
σ i o n = c i o n D i o n z i o n 2 F 2 R T .
During charge and discharge, Li + transfers from one side to the other. To study the transport mechanisms in the cell we consider five regions (see Figure 1), which can be defined as follows:
  • Regions A and E representing the inner part of solid active material particles in the anode and cathode respectively;
  • Regions B and D that are the solid particles/electrolyte interfaces at the anode and cathode side respectively;
  • Region C which indicates the electrolyte which can be in the anode, the separator, or the cathode.
During the charge period, intercalated Li diffuses from the cathode particle bulk to the interface (E). Particles of the solid active materials at the cathode and anode are assumed to be spherical. At the surface, it donates one electron and crosses the formed SEI layer on particles at the interface (D) to enter the electrolyte. This electrochemical reaction can be explained by the Butler–Volmer equation. Li + diffuses further in the electrolyte towards the anode because of the concentration gradient and electric field (C). By reaching the anode particles, the Li + ion transfers through the surface layer formed on the particles and receives one electron (B) and enters into the particle. Intercalated lithium diffuses away from the surface due to the concentration gradient (A). Once the cell is fully charged and the discharge starts, the whole transport process takes place in a reverse direction from the anode side to the cathode.
Calculating the ionic conductivity for each of the five regions can give us a simple way to compare the transport performances at different conditions. In this work we calculate ionic conductivity of transport for (1) solid active materials A and E, (2) electrolyte C, and (3) interfaces B and D based on the Nernst–Einstein relation.

2.2. Model Description

The required data for calculation comes from an implemented model which is based on the pseudo two-dimensional (P2D) approach [28]. We used COMSOL Multiphysics® 5.4 software for simulation. A detailed explanation of the governing partial differential equations can be found in the literature [28,29,30,31]. The model considers charge and species transport along the electrodes thicknesses direction (x) and in the solid particles (r) of active materials. Equations governing the x and r directions are coupled via the electrochemical reactions on the surface of active material particles described by the Butler–Volmer relation. Lithium plating and SEI formation are considered aging mechanisms, so that they are the anode side reactions competing the intercalation reaction during the charge process. This means:
j t o t = j i n t + j S E I + j L i P
where j i n t is the intercalation current density, j S E I is the current density of the SEI formation, and j L i P is the current density of lithium plating. From the Butler–Volmer relation for the intercalation current density we have the definition of:
j i n t = j 0 , i n t ( e x p ( α a F η i n t R T ) e x p ( α c F η i n t R T ) )
where j 0 , i n t is the intercalation exchange current density, α a and α c are anodic and cathodic transfer coefficients respectively. Exchange current density for intercalation can be calculated as follows:
j 0 , i n t = F k c α a k a α c ( c s , m a x c s ) α a ( c s ) α c ( c l c l , r e f ) α a
k a and k c are the rate constants of the anodic and cathodic reactions respectively. The maximum possible concentration is c s , m a x , and c s is the local concentration of solid particles. c l represents the electrolyte concentration. SEI formation, which we assumed in this model is the reaction of ethylene carbonate (EC) from electrolyte with lithium ions and electrons. A detailed description about the simulation of the SEI layer can be found in previous works [32,33]. The surface overpotential for each of the reactions (intercalation, SEI, Li-plating) is:
η ( i n t , S E I , L i P ) = ϕ s ϕ l E e q ( i n t , S E I , L i P ) Δ ϕ f i l m
where ϕ s and ϕ l are the potential of solid and electrolyte phase respectively. Δ ϕ f i l m is the potential drop over the film which is forming because of the SEI and Li-plating side reactions and E e q is the equilibrium potential of the corresponding reaction.
Both side reactions are assumed to be irreversible. The additional oxidation of plated lithium and consequently the formation of the secondary SEI layer on the plated lithium is neglected. Additionally, it is assumed that no partial dissolution of deposited Li during the discharge occurs. The current density of each of the side reactions is calculated, considering only the cathodic part of the Butler–Volmer relation [34]:
j ( S E I , L i P ) = j 0 ( S E I , L i P ) e x p ( α c ( S E I , L i P ) F η ( S E I , L i P ) R T )
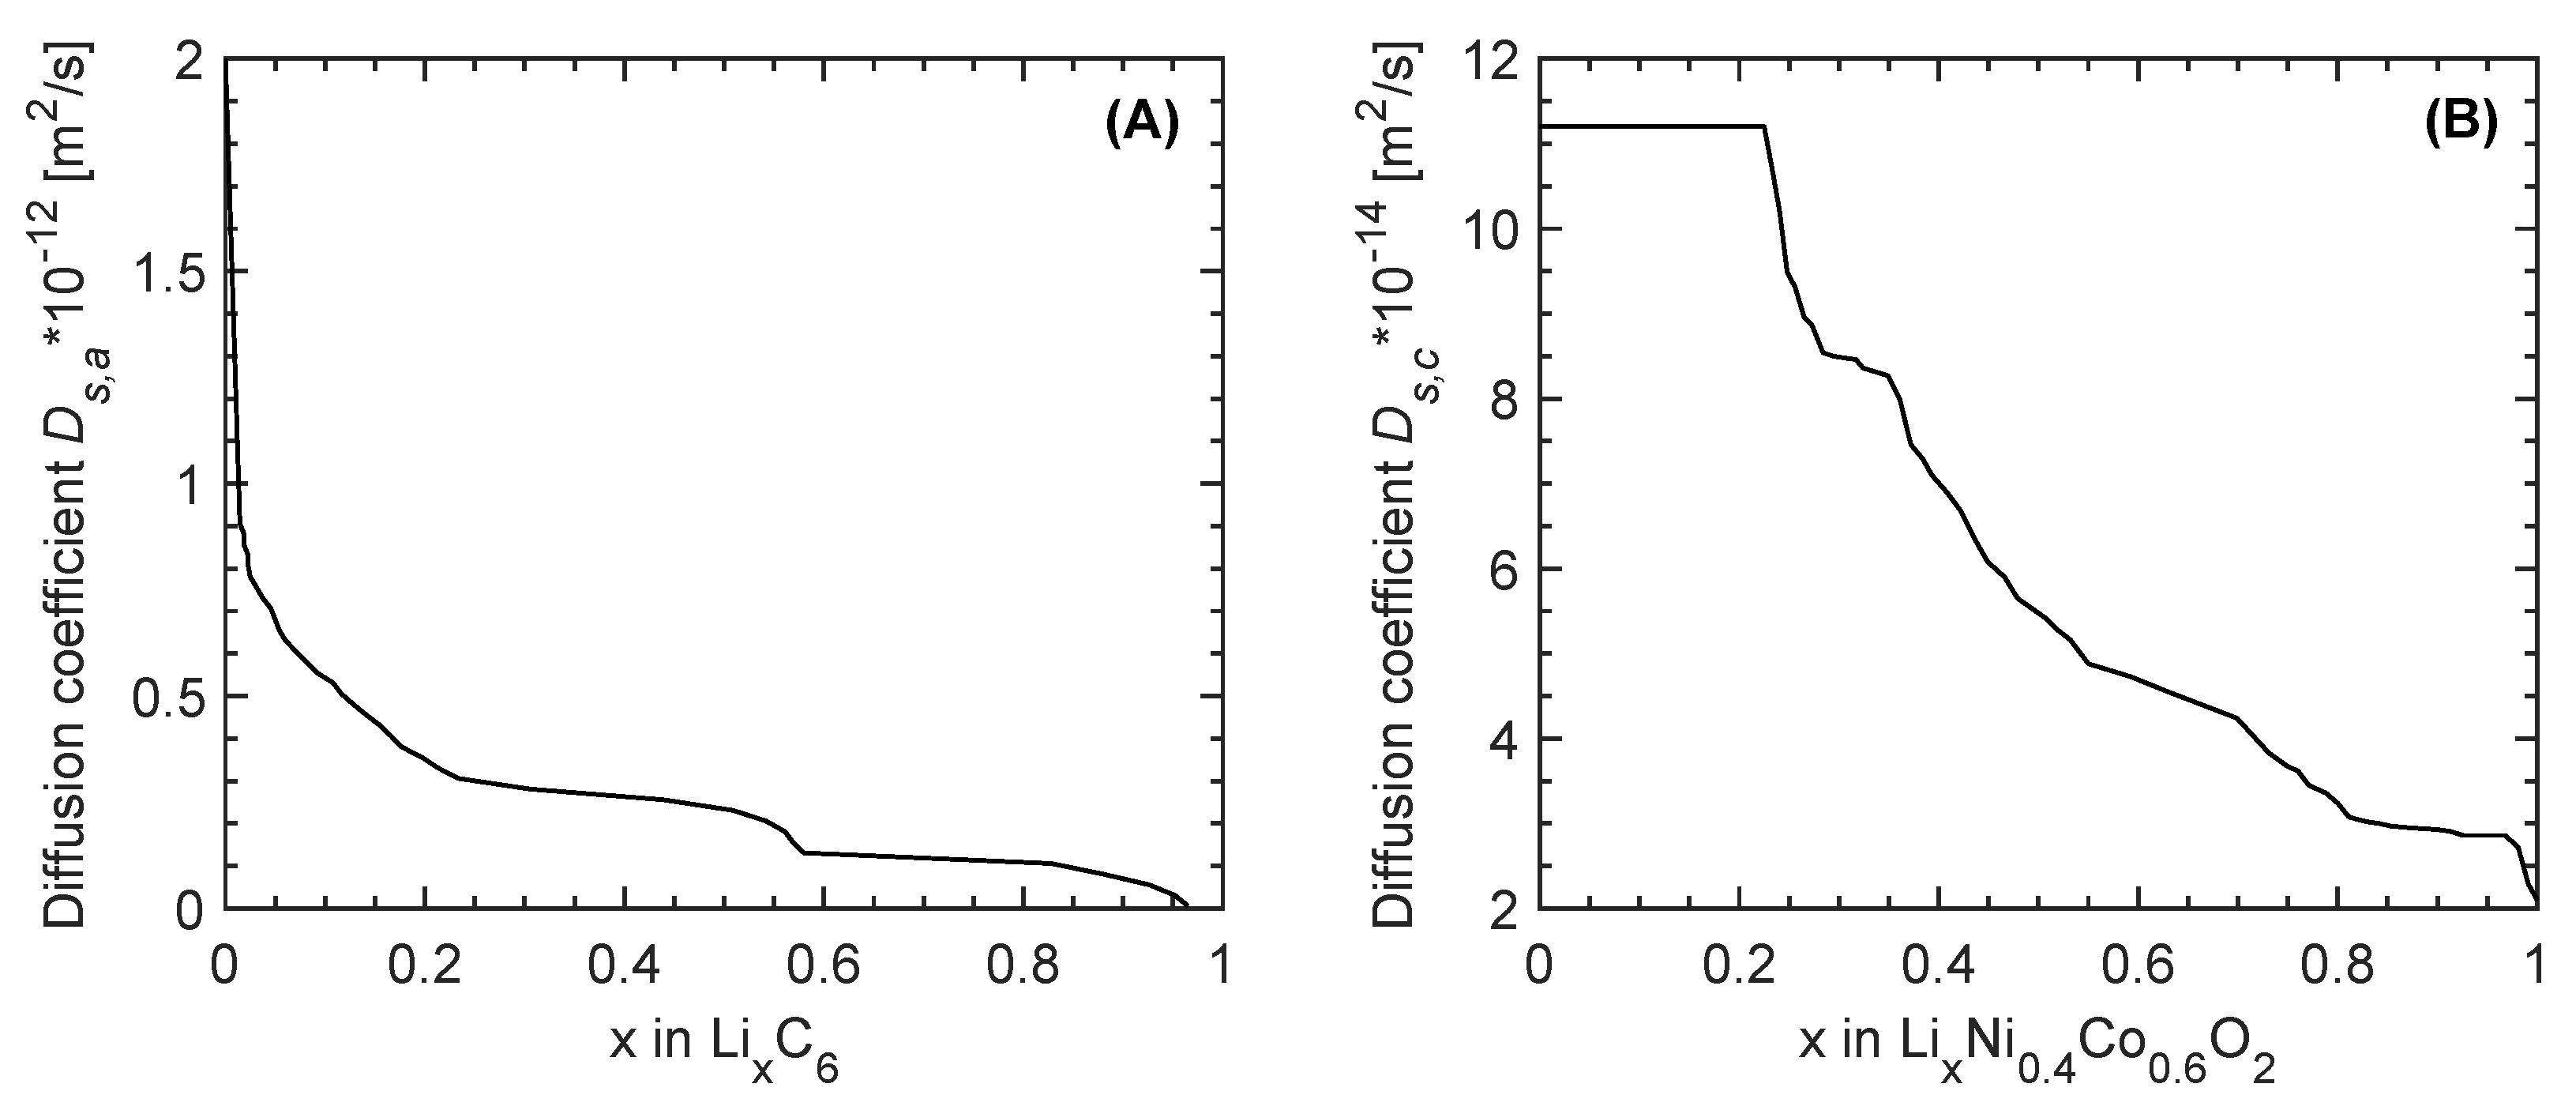
Cell parameters originate from an experimental cell. Key cell parameters and simulation conditions are listed in Table 1. Diffusion coefficient of electrodes are adjusted based on Cabanero’s work [35] to include a degree of lithiation dependency. The cycling is simulated using a constant current/constant voltage (CC/CV) charging strategy. Discharge is simulated using CC only. Since no thermal modeling is included, a 0.5 C charge/discharge rate is applied for the whole simulation so that the temperature variation over charge and discharge can be neglected [36].
Based on the Nernst–Einstein relation, we defined ionic conductivity for each of the regions as follows:
σ l ( a , c , s ) = c l D l ( a , c , s ) e f f F 2 R T
σ l is the ionic conductivity of electrolyte (region C). D l e f f is the effective diffusion coefficient of electrolyte which is defined depending on its medium i.e., anode, cathode, or separator. It is calculated with the Bruggeman correlation. So that:
D l ( a , c , s ) e f f = D l ϵ l ( a , c , s ) γ
consisting of the electrolyte diffusion coefficient D l , the electrolyte volume fraction ϵ l ( a , c , s ) , and the Bruggeman exponent γ .
For the particles of solid active material (region A and E) we have:
σ s ( a , c ) = ( c s , m a x ( a , c ) c s , a v e ( a , c ) ) D s ( a , c ) F 2 R T
in which D s is the diffusion coefficient of the solid particles.
To calculate the ionic conductivity for the last two regions (B and D) we assume the interface reactions to consume Li ion from electrolyte at electrode/electrolyte interface. Therefore ionic conductivity is:
σ i ( a , c ) = c s ( a , c ) ( c l c l r e f ) α a F 2 R T
including surface and electrolyte concentrations ( c s   and   c l ) coming from the Butler–Volmer relation definitions and effective electrolyte diffusion coefficients.

3. Results

3.1. Validation

To validate the ionic conductivity results coming from our calculations we compared them with the characteristic time values for transport which are introduced by Jiang and Peng [27]. They have defined three parameters, t s , t i , and t l as:
t s ( a , c ) = ( r 0 ( a , c ) / 3 ) 2 D s ( a , c )
t i ( a , c ) = F ϵ c l ( 1 t + 0 ) | j L i |
t l = L a 2 D l , a e f f + L s 2 D l , s e f f + L c 2 D l , c e f f .
t s is describing a characteristic time of the Li diffusion process into solid particles in negative and positive electrodes. t i stands for the transport time relating to the local depletion rate of Li ions in electrolyte at the electrode/electrolyte interface, and t l is the characteristic time for Li ion transport through the electrolyte. Considering these definitions we can relate σ l ( a , c , s ) , σ s ( a , c ) , and σ i ( a , c ) to t l ( a , c , s ) , t s ( a , c ) and t i ( a , c ) respectively.
Using the cell parameters reported in the Jiang’s article for simulation, we gain the following results for transport times and ionic conductivity calculations in idle state prior to discharge as listed in Table 2. There are slight differences between anode transfer time coming from our calculations and the one reported in Jiang’s work. The reason might be (1) due to the differences in parameters assumptions as not all the values are mentioned in the article and (2) in contrast to Jiang’s model we included Li-plating and SEI formation (anode aging mechanisms).
Comparing the ionic conductivities with their corresponding transport times, we realized that t and σ values of similar regions in positive and negative electrodes are following the same trend. This compatibility of results suggests that it is valid to compare σ s , a to σ s , c and additionally σ i , a to σ i , c . As shown in Table 2, there is only one value reported for the transport time of electrolyte. Therefore it is not possible to check the trend of our discrete values of electrolyte ionic conductivity in different mediums with the transport time.

3.2. Simulation Results

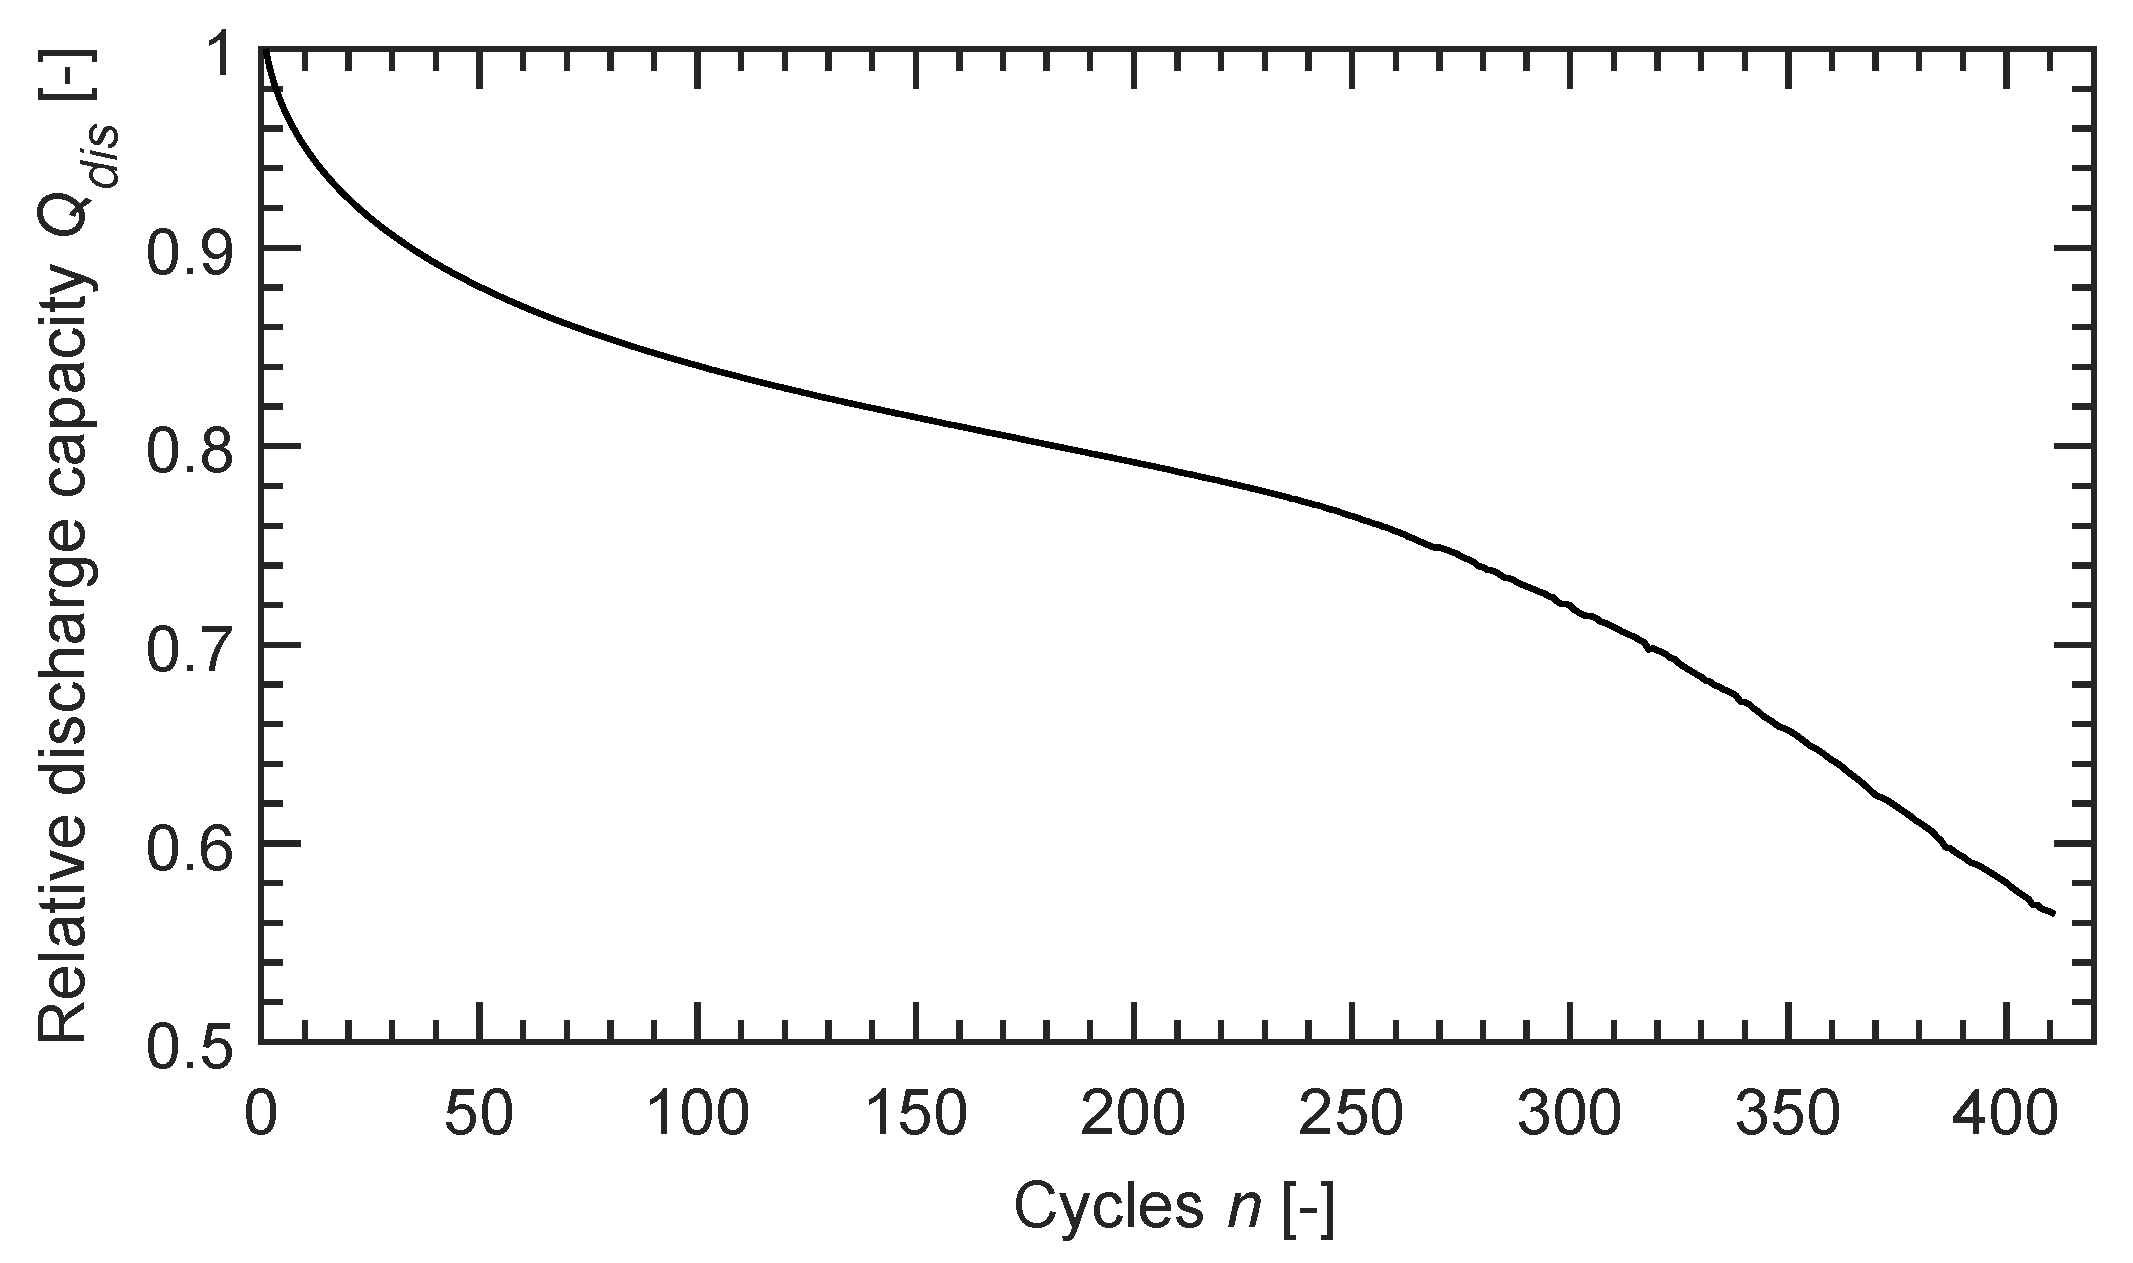
The discharge capacity behavior of the simulated Li-ion cell with the mentioned parameters in Table 1 over the cycle number is shown in Figure 3. The relative discharge capacity is defined as the relation of current Q d i s to the first cycle discharge capacity. During the initial cycles, the discharge capacity decreased faster than the following cycles, which was when the SEI layer initially formed. The almost linear decrease continued until cycle number 230, where the Q d i s reached 78% of the initial capacity. Then the phase of nonlinear decrease in discharge capacity starts so that in total cycle numbers of 400, the cell lost more than 60% of its initial capacity.
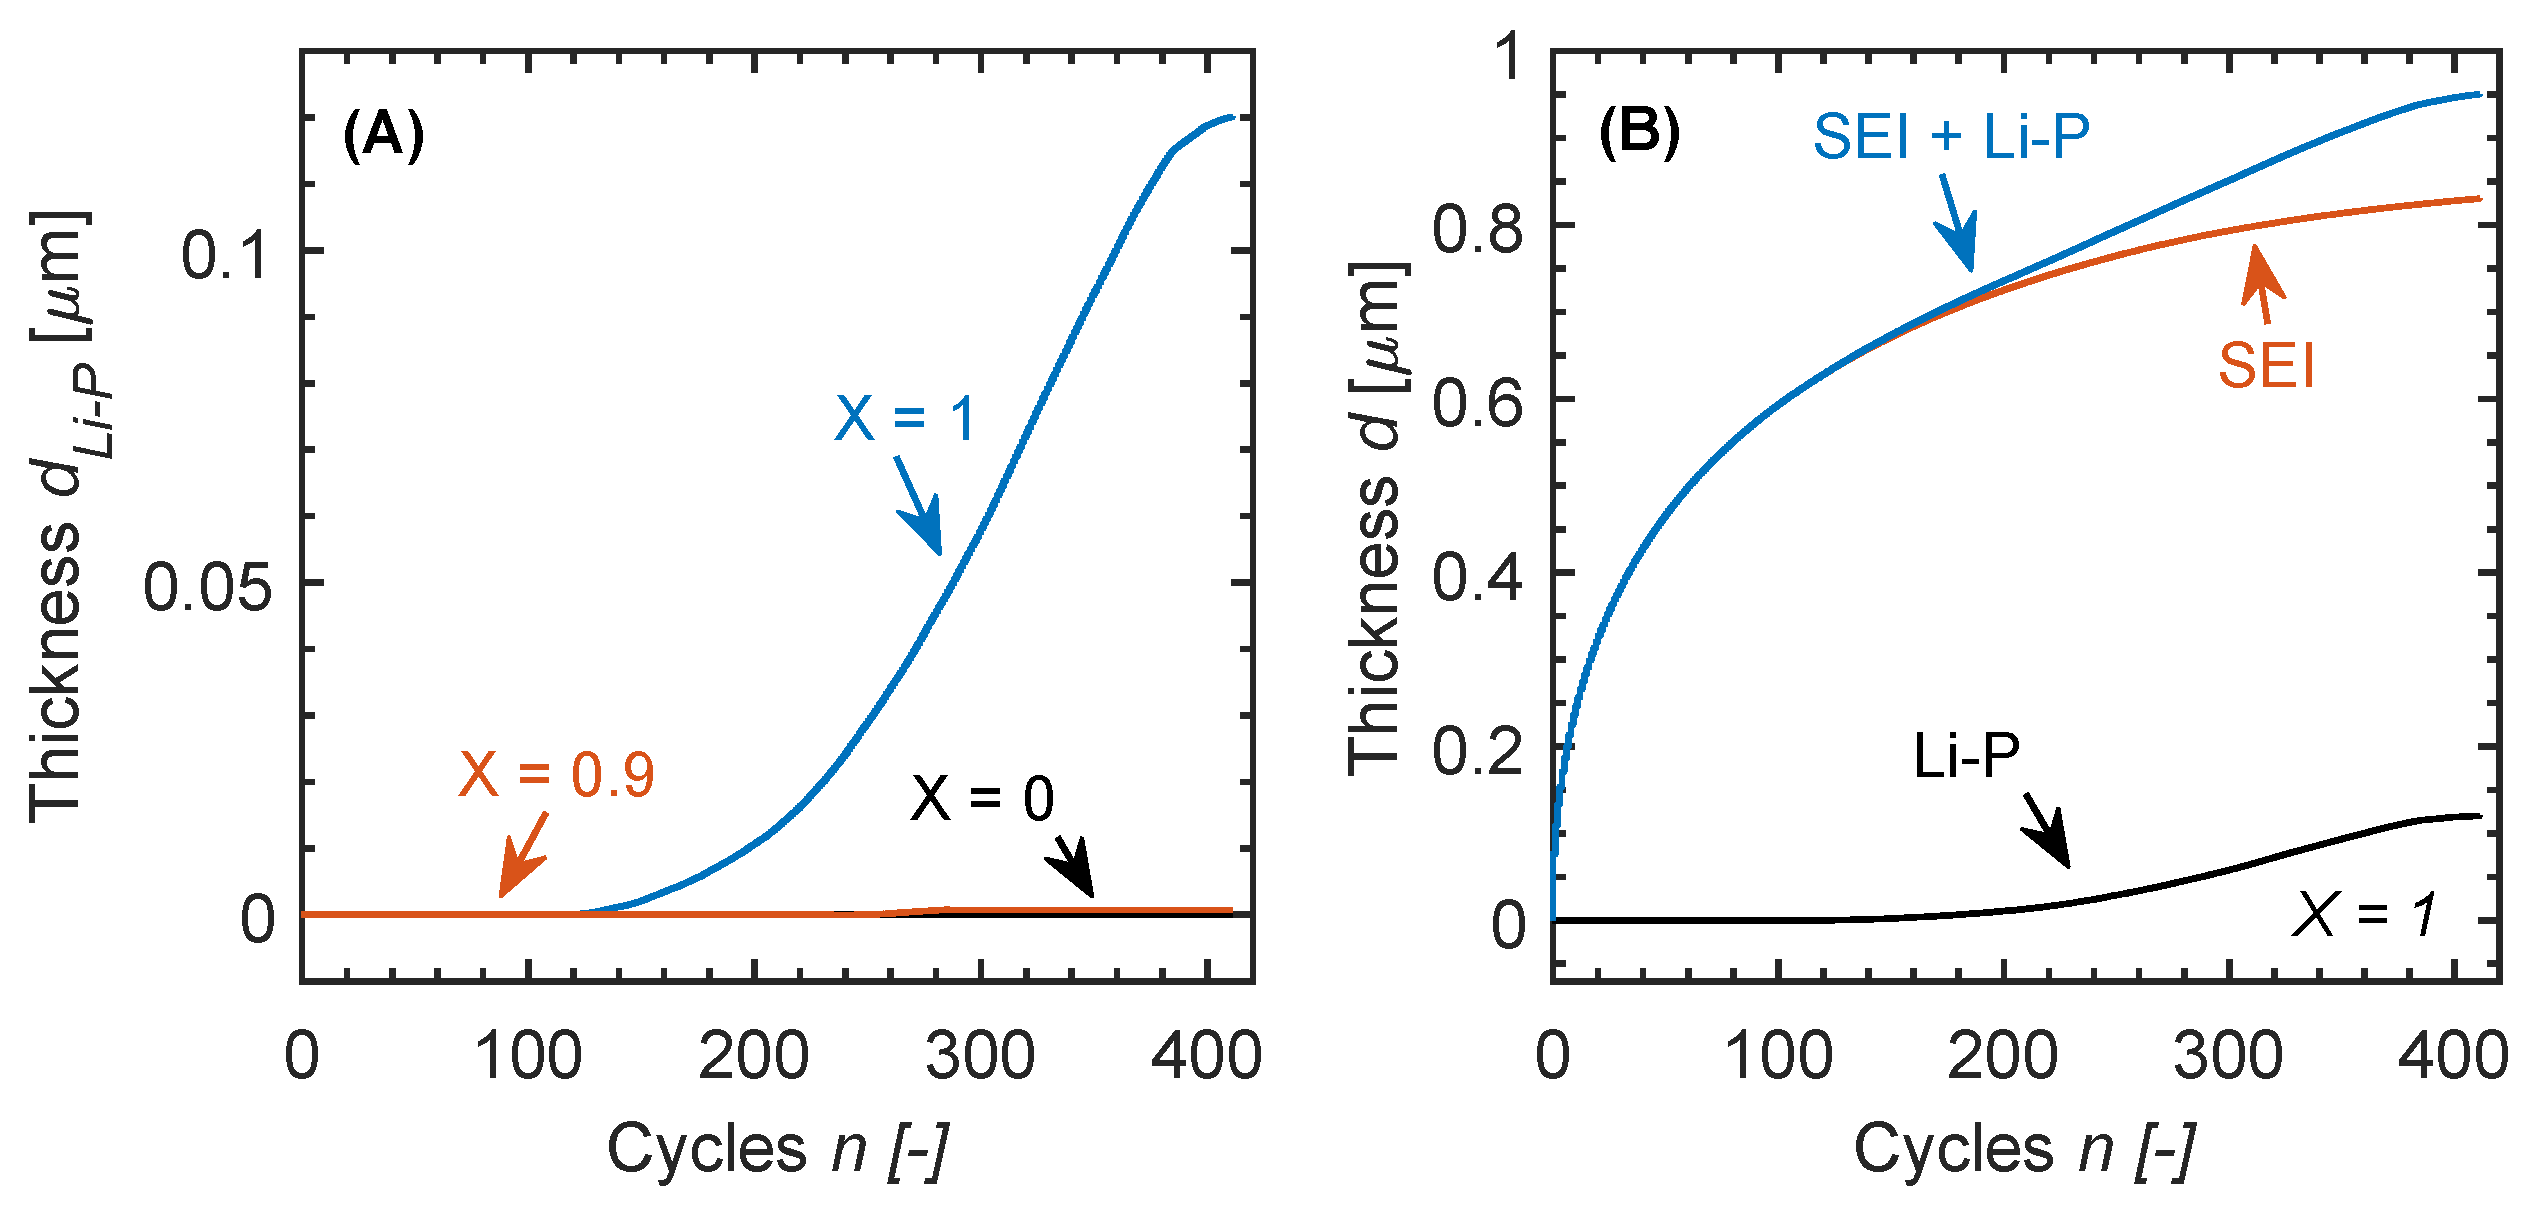
Looking at the equivalent thickness of the lithium plating layer on the surface of anode particles in Figure 4A, we can see that from the 116th cycle Li-P started at the separator side of the negative electrode and the layer thickness increased by continuing the cycling of the cell. During the whole 400 simulated cycles, no Li-plating occurred at the current collector side of the anode. The total surface layer, Li-P, and SEI, together with equivalent thickness of each layer is shown in Figure 4B. From cycle 116 until 230, Li-plating showed a more moderate increase rate in comparison to cycles after 230 which is when the cell began nonlinear aging behavior. In contrast to Li-P, the SEI layer grew with a high rate during the first 50 cycles and after that increased more moderately. The decrease in the SEI layer’s growth rate is due to the limited electrolyte diffusion through the formed layer as well as the lower EC concentration in the electrolyte as it became consumed through the SEI formation reaction. In contrast to lithium plating, which depends on the location along the anode thickness, SEI layer growth was uniform across the anode. The SEI and Li-P at the separator, grew to around d S E I 800 nm and d L i P 120 nm. Kindermann et al. [38] simulated the SEI layer with d S E I 600 nm. Separately Petzl et al. [39] in their experimental low-temperature study measured a d L i P 5 μ m after 120 cycles at −22 C with 1C.

4. Discussion

To study and track the reasons leading to lithium plating, starting from cycle 116 in our cell, we plotted the ionic conductivity of solid particles, the electrolyte, and electrode/separator interface over the constant current (CC) charge period for the anode and cathode, as shown in Figure 5 and Figure 6 respectively. Figure 5A shows calculated ionic conductivity for region A which are the solid active particles of the negative electrode from start until end of the CC charge period for the 116th cycle. Two points of X = 1 and X = 0.9 are chosen to be shown. X = 1 for the anode means the separator side. X = 0.9 is also displayed as it is the furthest point of the anode from the separator that shows lithium deposition over the whole simulated cycle life. As expected, the ionic conductivity of the particles declined while the SOC increased. At the end of the charge, particles closer to the separator side were at a higher SOC and therefore showed poorer ionic conductivity in comparison to particles with a higher distance to the separator. The beginning of Li-plating is where a short plateau is observable in the conductivity trend at the end of CC charge. Effective electrolyte ionic conductivity in Figure 5B is showing a similar trend. It displayed a higher value during early charge stages in comparison to the end of the charge as well as poorer particle ionic conductivity closer to the separator. This is explainable as the side reactions and surface layer formation was happening more at the separator side, leading to more porosity reduction which is equal to less electrolyte volume fraction. The last transport region of the anode that we include in this study is the electrolyte/solid particles interface. As shown in Figure 5C, the ionic conductivity increased while charging until a local SOC of 50%. By continuing the CC charge process we can observe a decline in conductivity values followed by a plateau which is the start of lithium plating. Comparing σ s , a to the corresponding Figure 6A, shows that anode active particles are having a better ionic conductivity, except for the end of the charge process which were slightly smaller than the cathode particle conductivity values. Figure 6B shows that electrolyte had a better effective ionic conductivity of factor 8 at the cathode side. It is the same when we compare their interface conductivity as well. Figure 6C shows that σ i , c is one order of magnitude bigger than σ i , a .
For comparison, the same is plotted in Figure 7 and Figure 8 for the ionic conductivity results of the cell at cycle 10 where the cell is not aged and shows no trace of lithium plating. Looking at Figure 7A and Figure 8A, we can see that values neither for the cathode nor the anode change significantly. In comparison to cycle 10, the final value at the end of charge of cycle 116 for both cathode and anode at the separator side declined. For the positive electrode, the cathode particles could not de-intercalate fully during the 10th cycle. To explain the anode behavior, listed data in Table 3 is helpful. Considering the σ s , a at different cycles, it is observable that by aging, the anode distribution of lithium ions becomes deficient so that by increasing the cycle number σ s , a at the current collector side shows higher values. This means by increasing the cycle number, during a charge process, particles at X = 0 only charged to the lower SOCs. The reverse is observable for the particles at the separator side of the anode. This can lead the cell to favorable conditions for Li deposition. Figure 7B and Figure 8B show that although electrolyte conductivity does not show a significant change at the cathode, the anode values declined by factor of 4. A similar behavior is observable for the anode interface ionic conductivity. Figure 7C shows that conductivity values of the 10th cycle are about 4 times bigger than those at cycle 116. However no significant variation is shown in Figure 8C in comparison to cycle 116. These two behaviors are another factor that cause Li-plating.

5. Conclusions

In this work, we studied the aging behavior of a Li-ion cell and investigated the ionic conductivity variation of the cell and its relation to the appearance of unwanted lithium deposition on the surface of negative electrode particles from the 116th cycle. We introduced five regions that explained the transport mechanisms of lithium from one electrode to the other, including the Li + charge transfer, Li solid diffusion, and Li + diffusion through the electrolyte. Simulation data and ionic conductivity calculations showed that both interface and electrolyte conductivity of the anode ( σ i , a and σ l , a ) at cycle 116 were four times smaller than the not-aged values. Moreover solid particle conductivity of the anode σ s , a showed that the poor distribution of Li in the anode particles along the x direction led to local overcharging on the separator side. These effects together caused the cell to plate lithium from the 116th cycle.

Author Contributions

Conceptualization, S.M.B. and K.P.B.; methodology, S.M.B. and K.P.B.; software, S.M.B.; formal analysis, S.M.B.; writing–original draft, S.M.B. and K.P.B.; writing–review and editing, S.M.B.; visualization, S.M.B.; supervision, K.P.B.; funding acquisition, K.P.B.

Funding

This research was funded by Robert Bosch GmbH.

Acknowledgments

The authors thank Robert Bosch GmbH for their financial support through the Bosch Promotionskolleg. The author would also like to thank D. Müller for their constructive criticism of the manuscript.

Conflicts of Interest

The authors declare no conflict of interest.The funders had no role in the design of the study; in the collection, analyses, or interpretation of data; in the writing of the manuscript, or in the decision to publish the results.

Nomenclature

Abbreviations
P2Dpseudo two-dimensional
SEIsolid electrolyte interface
Li-Plithium plating
Li-ionlithium ion
CTPcharge transfer process
SPDsolid diffusion process
SOCstate of charge
ECethylene carbonate
CCconstant current
CVconstant voltage
An.anode
Ca.cathode
Lit.literature
Cal.calculated
Symbols
jionic current density
j 0 exchange current density
vdrift velocity
uelectrical mobility of ions
Zvalence number
qcharge
KBoltzamn constant
Rideal gas constant
FFaraday constant
Ddiffusion coefficient
ϕ potential
icurrent density
σ conductivity
ζ electric field
α transfer coefficient
η surface overpotential
Epotential
Ttemperature
Cconcentration
Ttemperature
ϵ volume fraction
γ Bruggeman exponent
tcharacteristic time
Lthickness
L s separator thickness
Subscripts and Superscripts
i o n ion species
t o t total
i n t intercalation
S E I solid electrolyte interface
L i P lithium plating
aanodic, anode
ccathodic, cathode
ssolid
a , c , s anode, cathode, separator
lliquid
iinterface
e q equilibrium
e f f effective
m a x maximum
a v e average
r e f reference

References

  1. Brandt, K. Historical development of secondary lithium batteries. Solid State Ionics 1994, 69, 173–183. [Google Scholar] [CrossRef]
  2. Besenhard, J. The electrochemical preparation and properties of ionic alkali metal-and NR4-graphite intercalation compounds in organic electrolytes. Carbon 1976, 14, 111–115. [Google Scholar] [CrossRef]
  3. Whittingham, M.S. Electrical energy storage and intercalation chemistry. Science 1976, 192, 1126–1127. [Google Scholar] [CrossRef] [PubMed]
  4. Slane, S.M.; Foster, D.L. Lithium Ion Rechargeable Intercallation Cell. US Patent No. 07/625,181, 7 July 1992. [Google Scholar]
  5. Yoshino, A. Development of the lithium-ion battery and recent technological trends. In Lithium-Ion Batteries; Elsevier: Amsterdam, The Netherlands, 2014; pp. 1–20. [Google Scholar]
  6. Almeida, A.; Sousa, N.; Coutinho-Rodrigues, J. Quest for Sustainability: Life-Cycle Emissions Assessment of Electric Vehicles Considering Newer Li-Ion Batteries. Sustainability 2019, 11, 2366. [Google Scholar] [CrossRef]
  7. Onat, N.; Kucukvar, M.; Tatari, O. Towards life cycle sustainability assessment of alternative passenger vehicles. Sustainability 2014, 6, 9305–9342. [Google Scholar] [CrossRef]
  8. Burns, J.; Stevens, D.; Dahn, J. In-situ detection of lithium plating using high precision coulometry. J. Electrochem. Soc. 2015, 162, A959–A964. [Google Scholar] [CrossRef]
  9. Fleischhammer, M.; Waldmann, T.; Bisle, G.; Hogg, B.I.; Wohlfahrt-Mehrens, M. Interaction of cyclic ageing at high-rate and low temperatures and safety in lithium-ion batteries. J. Power Sources 2015, 274, 432–439. [Google Scholar] [CrossRef]
  10. Waldmann, T.; Hogg, B.I.; Wohlfahrt-Mehrens, M. Li plating as unwanted side reaction in commercial Li-ion cells—A review. J. Power Sources 2018, 384, 107–124. [Google Scholar] [CrossRef]
  11. Uhlmann, C.; Illig, J.; Ender, M.; Schuster, R.; Ivers-Tiffée, E. In situ detection of lithium metal plating on graphite in experimental cells. J. Power Sources 2015, 279, 428–438. [Google Scholar] [CrossRef]
  12. Doh, C.H.; Han, B.C.; Jin, B.S.; Gu, H.B. Structures and formation energies of LixC6 (x = 1-3) and its homologues for lithium rechargeable batteries. Bull. Korean Chem. Soc 2011, 32, 2045–2050. [Google Scholar] [CrossRef]
  13. Legrand, N.; Knosp, B.; Desprez, P.; Lapicque, F.; Raël, S. Physical characterization of the charging process of a Li-ion battery and prediction of Li plating by electrochemical modelling. J. Power Sources 2014, 245, 208–216. [Google Scholar] [CrossRef]
  14. Atkins, P.W.; De Paula, J.; Keeler, J. Atkins’ Physical Chemistry; Oxford University Press: Oxford, UK, 2018. [Google Scholar]
  15. Hein, S.; Latz, A. Influence of local lithium metal deposition in 3D microstructures on local and global behavior of Lithium-ion batteries. Electrochim. Acta 2016, 201, 354–365. [Google Scholar] [CrossRef]
  16. Wu, M.S.; Chiang, P.C.J.; Lin, J.C. Electrochemical investigations on advanced lithium-ion batteries by three-electrode measurements. J. Electrochem. Soc. 2005, 152, A47–A52. [Google Scholar] [CrossRef]
  17. Lin, H.P.; Chua, D.; Salomon, M.; Shiao, H.; Hendrickson, M.; Plichta, E.; Slane, S. Low-temperature behavior of Li-ion cells. Electrochem. Solid-State Lett. 2001, 4, A71–A73. [Google Scholar] [CrossRef]
  18. Waldmann, T.; Hogg, B.I.; Kasper, M.; Grolleau, S.; Couceiro, C.G.; Trad, K.; Matadi, B.P.; Wohlfahrt-Mehrens, M. Interplay of operational parameters on lithium deposition in lithium-ion cells: systematic measurements with reconstructed 3-electrode pouch full cells. J. Electrochem. Soc. 2016, 163, A1232–A1238. [Google Scholar] [CrossRef]
  19. Persson, K.; Sethuraman, V.A.; Hardwick, L.J.; Hinuma, Y.; Meng, Y.S.; Van Der Ven, A.; Srinivasan, V.; Kostecki, R.; Ceder, G. Lithium diffusion in graphitic carbon. J. Phys. Chem. Lett. 2010, 1, 1176–1180. [Google Scholar] [CrossRef]
  20. Persson, K.; Hinuma, Y.; Meng, Y.S.; Van der Ven, A.; Ceder, G. Thermodynamic and kinetic properties of the Li-graphite system from first-principles calculations. Phys. Rev. B 2010, 82, 125416. [Google Scholar] [CrossRef]
  21. Smart, M.; Ratnakumar, B. Effects of electrolyte composition on lithium plating in lithium-ion cells. J. Electrochem. Soc. 2011, 158, A379–A389. [Google Scholar] [CrossRef]
  22. Ishihara, Y.; Miyazaki, K.; Fukutsuka, T.; Abe, T. Kinetics of lithium-ion transfer at the interface between Li4Ti5O12 thin films and organic electrolytes. ECS Electrochem. Lett. 2014, 3, A83–A86. [Google Scholar] [CrossRef]
  23. Abe, T.; Sagane, F.; Ohtsuka, M.; Iriyama, Y.; Ogumi, Z. Lithium-ion transfer at the interface between lithium-ion conductive ceramic electrolyte and liquid electrolyte—A key to enhancing the rate capability of lithium-ion batteries. J. Electrochem. Soc. 2005, 152, A2151–A2154. [Google Scholar] [CrossRef]
  24. Jow, T.R.; Delp, S.A.; Allen, J.L.; Jones, J.P.; Smart, M.C. Factors Limiting Li+ Charge Transfer Kinetics in Li-Ion Batteries. J. Electrochem. Soc. 2018, 165, A361–A367. [Google Scholar] [CrossRef]
  25. Arora, P.; Doyle, M.; White, R.E. Mathematical modeling of the lithium deposition overcharge reaction in lithium-ion batteries using carbon-based negative electrodes. J. Electrochem. Soc. 1999, 146, 3543–3553. [Google Scholar] [CrossRef]
  26. Tang, M.; Albertus, P.; Newman, J. Two-dimensional modeling of lithium deposition during cell charging. J. Electrochem. Soc. 2009, 156, A390–A399. [Google Scholar] [CrossRef]
  27. Jiang, F.; Peng, P. Elucidating the performance limitations of lithium-ion batteries due to species and charge transport through five characteristic parameters. Sci. Rep. 2016, 6, 32639. [Google Scholar] [CrossRef] [PubMed]
  28. Doyle, M.; Fuller, T.F.; Newman, J. Modeling of galvanostatic charge and discharge of the lithium/polymer/insertion cell. J. Electrochem. Soc. 1993, 140, 1526–1533. [Google Scholar] [CrossRef]
  29. Fuller, T.F.; Doyle, M.; Newman, J. Simulation and optimization of the dual lithium ion insertion cell. J. Electrochem. Soc. 1994, 141, 1–10. [Google Scholar] [CrossRef]
  30. Doyle, C.M. Design and Simulation of Lithium Rechargeable Batteries. Ph.D. Thesis, University of California, Berkeley, CA, USA, 1995. [Google Scholar]
  31. Doyle, M.; Newman, J.; Gozdz, A.S.; Schmutz, C.N.; Tarascon, J.M. Comparison of modeling predictions with experimental data from plastic lithium ion cells. J. Electrochem. Soc. 1996, 143, 1890–1903. [Google Scholar] [CrossRef]
  32. Müller, D.; Dufaux, T.; Birke, K.P. Model-Based Investigation of Porosity Profiles in Graphite Anodes Regarding Sudden-Death and Second-Life of Lithium Ion Cells. Batteries 2019, 5, 49. [Google Scholar] [CrossRef]
  33. Yang, X.G.; Leng, Y.; Zhang, G.; Ge, S.; Wang, C.Y. Modeling of lithium plating induced aging of lithium-ion batteries: Transition from linear to nonlinear aging. J. Power Sources 2017, 360, 28–40. [Google Scholar] [CrossRef]
  34. Darling, R.; Newman, J. Modeling side reactions in composite li y mn2 o 4 electrodes. J. Electrochem. Soc. 1998, 145, 990–998. [Google Scholar] [CrossRef]
  35. Cabañero, M.A.; Altmann, J.; Gold, L.; Boaretto, N.; Müller, J.; Hein, S.; Zausch, J.; Kallo, J.; Latz, A. Investigation of the temperature dependence of lithium plating onset conditions in commercial Li-ion batteries. Energy 2019, 171, 1217–1228. [Google Scholar] [CrossRef]
  36. Eddahech, A.; Briat, O.; Vinassa, J.M. Thermal characterization of a high-power lithium-ion battery: Potentiometric and calorimetric measurement of entropy changes. Energy 2013, 61, 432–439. [Google Scholar] [CrossRef]
  37. Safari, M.; Morcrette, M.; Teyssot, A.; Delacourt, C. Multimodal physics-based aging model for life prediction of Li-ion batteries. J. Electrochem. Soc. 2009, 156, A145–A153. [Google Scholar] [CrossRef]
  38. Kindermann, F.M.; Keil, J.; Frank, A.; Jossen, A. A SEI modeling approach distinguishing between capacity and power fade. J. Electrochem. Soc. 2017, 164, E287–E294. [Google Scholar] [CrossRef] [Green Version]
  39. Petzl, M.; Kasper, M.; Danzer, M.A. Lithium plating in a commercial lithium-ion battery—A low-temperature aging study. J. Power Sources 2015, 275, 799–807. [Google Scholar] [CrossRef]
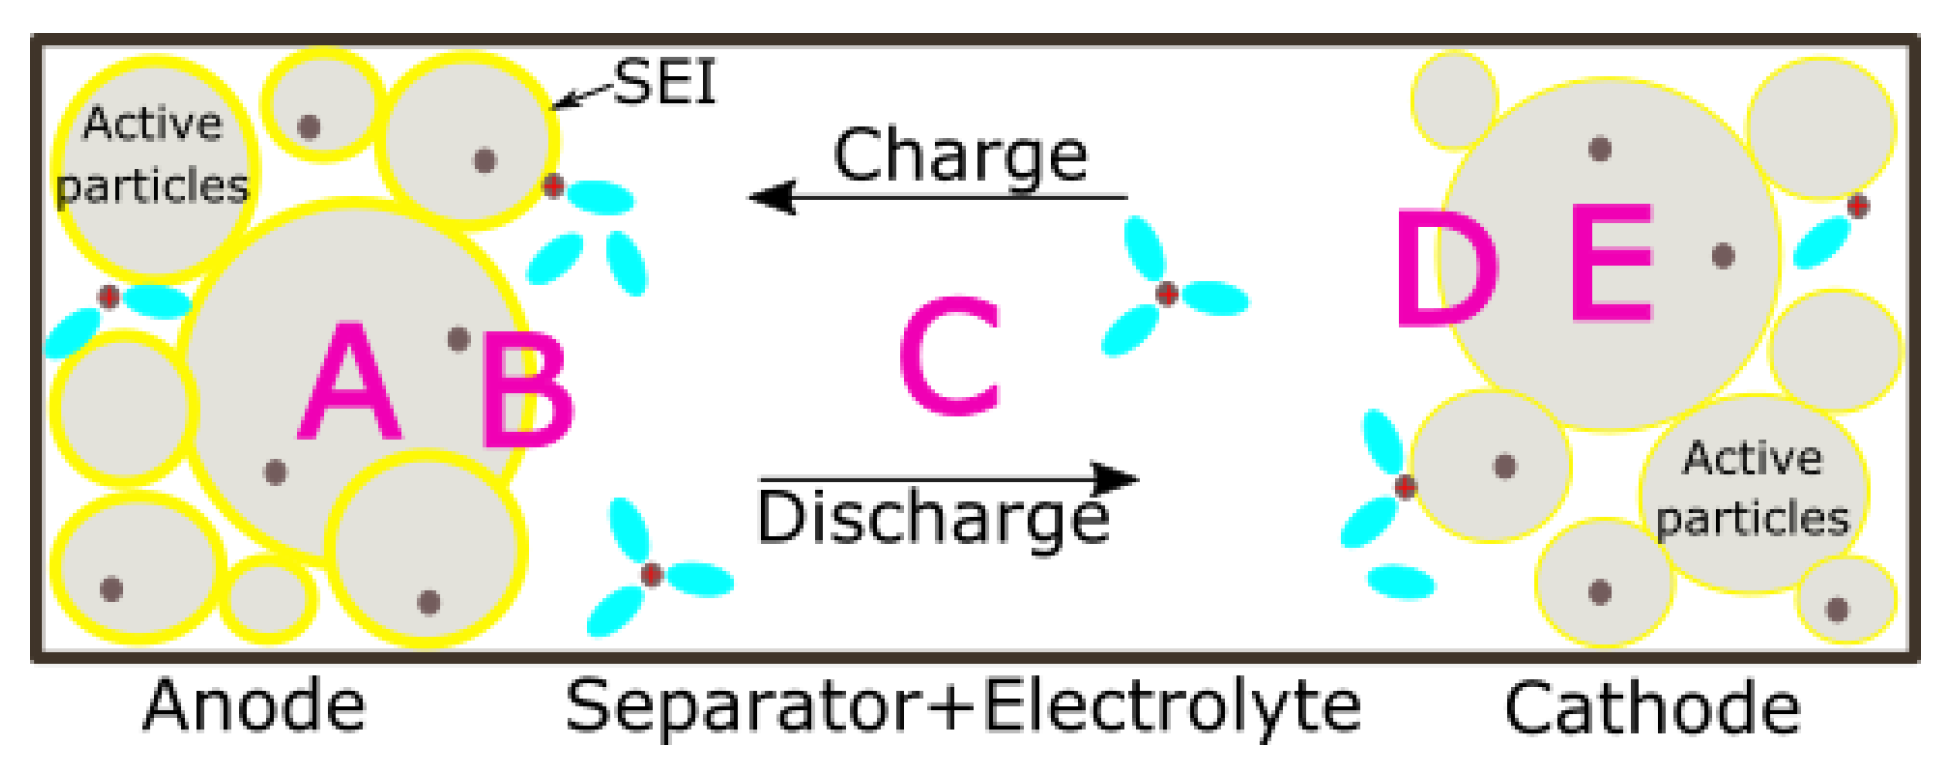
Figure 1. Schematic view of the five transport regions considered in a full lithium ion cell.
Sustainability 11 06392 g001
Figure 2. Diffusion coefficient (A) of the anode and (B) of the cathode as a function of the lithiation degree.
Sustainability 11 06392 g002
Figure 3. Relative discharge capacity of the simulated cell over the life time. A linear ageing phase following by a non-linear aging phase are observable.
Sustainability 11 06392 g003
Figure 4. (A) Thickness of the plated lithium layer on the surface of negative electrode particles at the current collector (X = 0), 0.9 of the relative anode thickness (X = 0.9), and the separator side (X = 1). Over the cycle numbers, no lithium plating happened at the current collector side but it increased moving toward the separator side. (B) Total surface layer thickness as well as equivalent thicknesses of plated lithium and SEI (solid electrolyte interface) layers separately. Since the cell has the maximum amount lithium plating at the separator side, only the layers at X = 1 are displayed.
Sustainability 11 06392 g004
Figure 5. Ionic conductivity of the simulated cell at cycle 116 for the negative electrode side. Start of Li-plating is when a plateau is formed. (A) Is the calculated ionic conductivity for region A over start until end of CC (current) charge period of the 116th cycle. X = 1 is at the separator side and X = 0.9 is at 0.9 of anode thickness closer to the separator. (B) is the effective ionic conductivity of electrolyte in the negative electrode over start until end of CC charge period of the 116th cycle. Data comes from the model. (C) Is the calculated ionic conductivity for region B over start until end of the CC charge period of the 116th cycle.
Sustainability 11 06392 g005
Figure 6. Ionic conductivity of the simulated cell at cycle 116 for the positive electrode side. (A) Is the calculated ionic conductivity for region E over start until end of the CC charge period of the 116th cycle. X = 0 is at separator side and X = 1 is at the current collector of the cathode. (B) Is the effective ionic conductivity of the electrolyte in the positive electrode over start until end of the CC charge period of the 116th cycle. Data comes from the model. (C) Is the calculated ionic conductivity for region D over start until end of the CC charge period of the 116th cycle.
Sustainability 11 06392 g006
Figure 7. Ionic conductivity of the simulated cell at cycle 10 for the negative electrode side. (A) Is the calculated ionic conductivity for region A over start until end of the CC charge period of the 10th cycle. X = 1 is at the separator side and X = 0.9 is at 0.9 of relative anode thickness closer to the separator. (B) Is the effective ionic conductivity of the electrolyte in the negative electrode over start until end of the CC charge period of the 10th cycle. Data comes from the model. (C) Is the calculated ionic conductivity for region B over start until the end of the CC charge period of the 10th cycle.
Sustainability 11 06392 g007
Figure 8. Ionic conductivity of the simulated cell at cycle 10 for the positive electrode side. (A) Is the calculated ionic conductivity for region E over start until end of the CC charge period of the 10th cycle. X = 0 is at the separator side and X = 1 is at the current collector of the cathode. (B) Is the effective ionic conductivity of electrolyte in the positive electrode over start until end of the CC charge period of 10th cycle. Data comes from the model. (C) Is the calculated ionic conductivity for region D over start until end of the CC charge period of the 10th cycle.
Sustainability 11 06392 g008
Table 1. Cell parameters and simulation conditions used in the model.
ParametersAnodeSeparatorCathode
Thickness L ( μ m )1161688.7
Particle radius r 0 ( μ m )8.8-6.5
Porosity ϵ (%)0.260.50.24
Bruggeman exponent γ (-)1.81.51.56
Initial electrolyte concentration c e (mol/m 3 )1200
Diffusion coefficient in solid D s (m 2 /s)Figure 2A [35]-Figure 2B [35]
Diffusion coefficient in liquid D l (m 2 /s)3.7 × 10 9 *
Ionic conductivity in liquid σ l (S/m)8.735 × 10 1 *
Maximum Li + concentration in solid (mol/m 3 )27,880-48,580
Anodic/Cathodic transfer coefficient α a , α c (-)0.5 0.5
Transference number t + (-)0.577
Simulation conditionsValues
Temperature T (K)298.15
Lower and upper voltage boundary U m i n U m a x (V)2.7–4.2
Charge and discharge rate C r a t e 0.5
Equilibrium potential SEI formation E e q , S E I (V)0.4 [37]
Equilibrium potential lithium plating E e q , L i P (V)0
Cathodic charge transfer coefficients for side reactions α c S E I . L i P (/)0.5 [34]
* for c l = 1200 mol/m 3 .
Table 2. Values of the characteristic times and corresponding ionic conductivities when the battery is in the pause state prior to discharge. Lit. values are extracted from Jiang’s article [27].
t l [s] σ l [S/cm] t s [s] σ s [S/cm] t i [s] σ i [S/cm]
Lit.Cal.Cal.Lit.Cal.Cal.Lit.Cal.Cal.
Anode1801741.12 × 10 2 3.2 × 10 3 2.2 × 10 3 (3.19-2.98) × 10 7 147.71302.88 × 10 4
Cathode 103.21.21 × 10 2 71.171.11.28 × 10 4 101.392.31.16 × 10 3
Separator 8.82.15 × 10 2 ------
Table 3. Ionic conductivity for solid particles of active materials σ s , electrolyte in the porous electrodes σ l , and electrode/electrolyte interface σ i at cycle number 10, 50, 100, 116, 150, and 230. Cycle 116 is the start of Li-P and cycle 230 is the start of nonlinear aging behavior of the cell. σ s and σ i are calculated from Nernst–Einstein relation. σ l is calculated directly through the model.
CycleCharge – CC σ s [S/cm] σ l [S/cm] σ i [S/cm]
An.An.An.
10Begin1.0 × 10 3 (4.8-4.7) × 10 4 1.3 × 10 3
End(7.3-3.5) × 10 5 (4.7-4.6) × 10 4 (4.5-4.0) × 10 3
50Begin(9.9-10.3) × 10 4 (2.5-2.4) × 10 4 0.7 × 10 3
End(14.7-3.7) × 10 5 (2.5-2.4) × 10 4 (2.6-2.2) × 10 3
100Begin(9.2-10.4) × 10 4 1.5 × 10 4 (0.5-0.4) × 10 3
End(18.3-3.3) × 10 5 (1.5-1.4) × 10 4 (1.6-1.4) × 10 3
116Begin(9.1-10.4) × 10 4 1.3 × 10 4 (0.5-0.4) × 10 3
End(19.1-3.1) × 10 5 1.3 × 10 4 (1.4-1.2) × 10 3
150Begin(8.8-10.5) × 10 4 1.0 × 10 4 (0.4-0.3) × 10 3
End(20.1-2.8) × 10 5 (1.1-1.0) × 10 4 (1.1-0.9) × 10 3
230Begin(7.2-10.5) × 10 4 (0.6-0.5) × 10 4 (0.3-0.2) × 10 3
End(21.7-0.2) × 10 5 (0.6-0.5) × 10 4 (0.7-0.3) × 10 3
Ca.Ca.Ca.
10Begin(3.4-4.0) × 10 6 9.2 × 10 4 0.8 × 10 2
End(5.8-5.7) × 10 5 9.2 × 10 4 1.3 × 10 2
50Begin(5.1-5.7) × 10 6 (8.8-8.7) × 10 4 (0.9-1.0) × 10 2
End(5.6-5.4) × 10 5 8.7 × 10 4 1.4 × 10 2
100Begin(6.2-6.7) × 10 6 8.3 × 10 4 1.0 × 10 2
End(5.3-5.1) × 10 5 (8.3-8.2) × 10 4 1.4 × 10 2
116Begin(6.5-7.0) × 10 6 8.2 × 10 4 1 × 10 2
End(5.2-5.0) × 10 5 8.1 × 10 4 1.4 × 10 2
150Begin(6.9-7.5) × 10 6 8 × 10 4 (1.0-1.1) × 10 2
End(5.0-4.7) × 10 5 (7.9-7.8) × 10 4 1.4 × 10 2
230Begin(8.1-9.2) × 10 6 7.6 × 10 4 1.1 × 10 2
End(5.7-5.6) × 10 5 7.4 × 10 4 1.3 × 10 2