Assessing the Ecological Sensitivity of Coastal Marine Ecosystems: A Case Study in Xiamen Bay, China


Abstract
1. Introduction
2. Materials and Methods
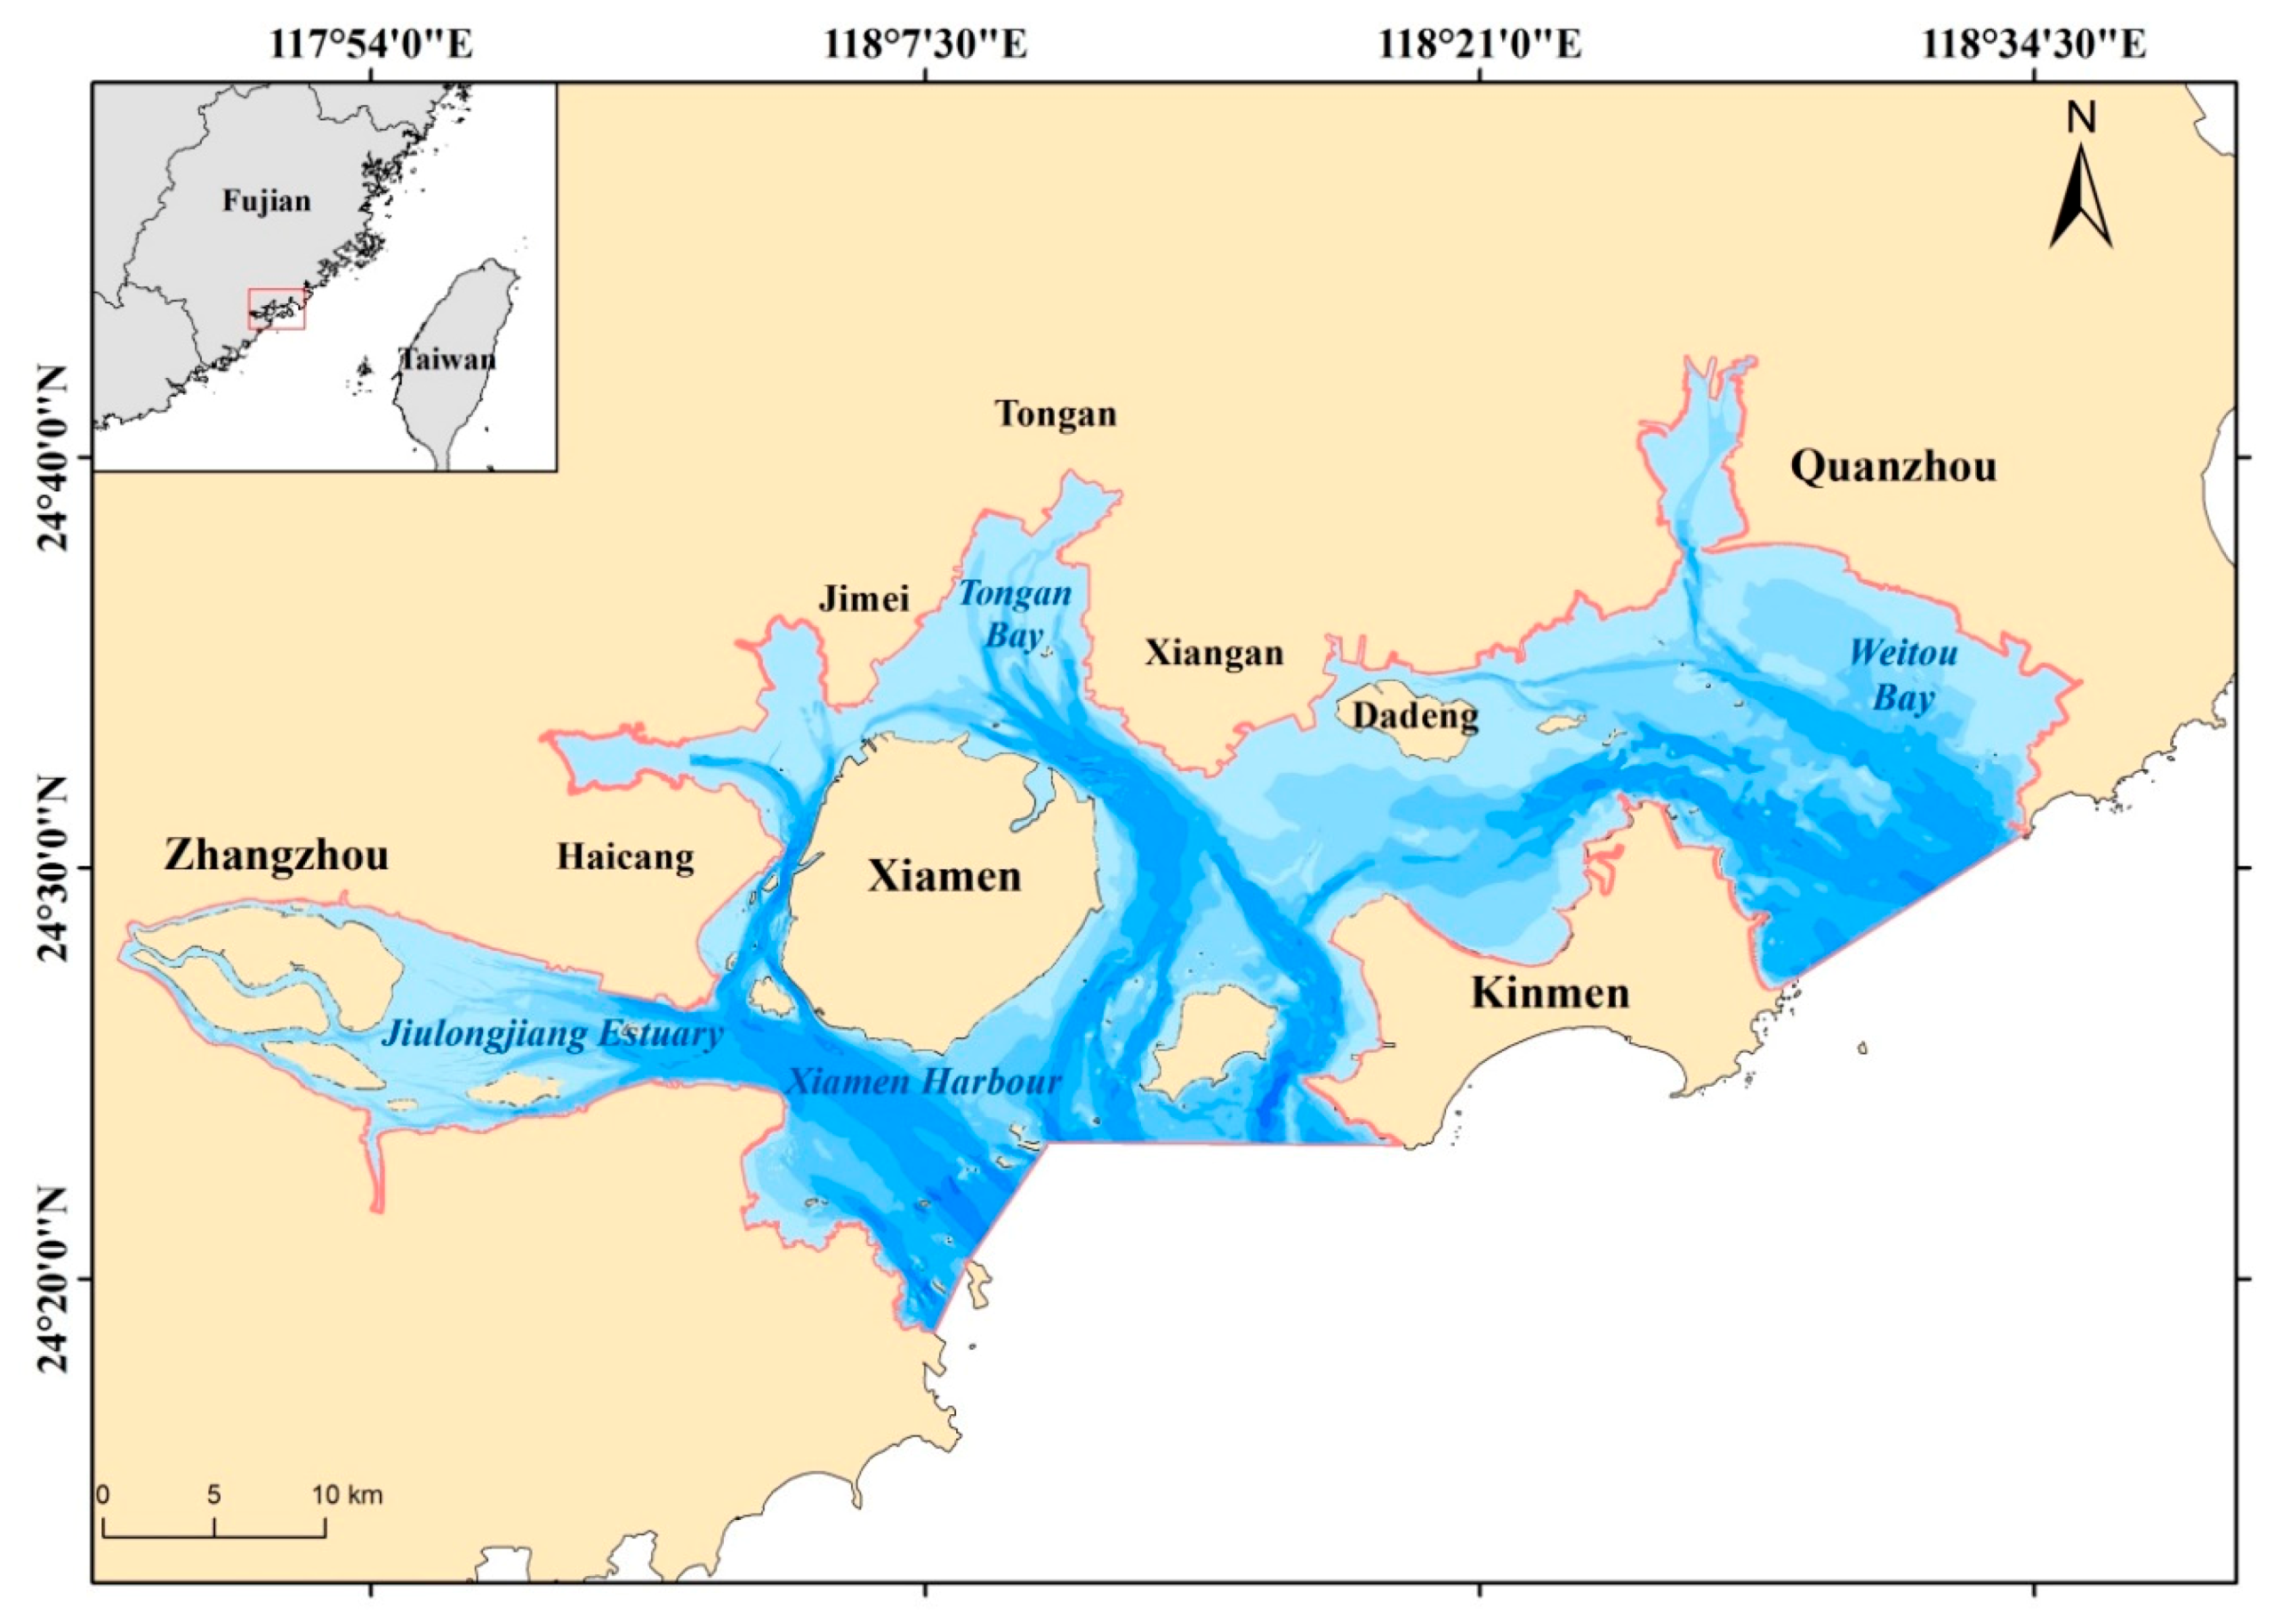
2.1. Study Area
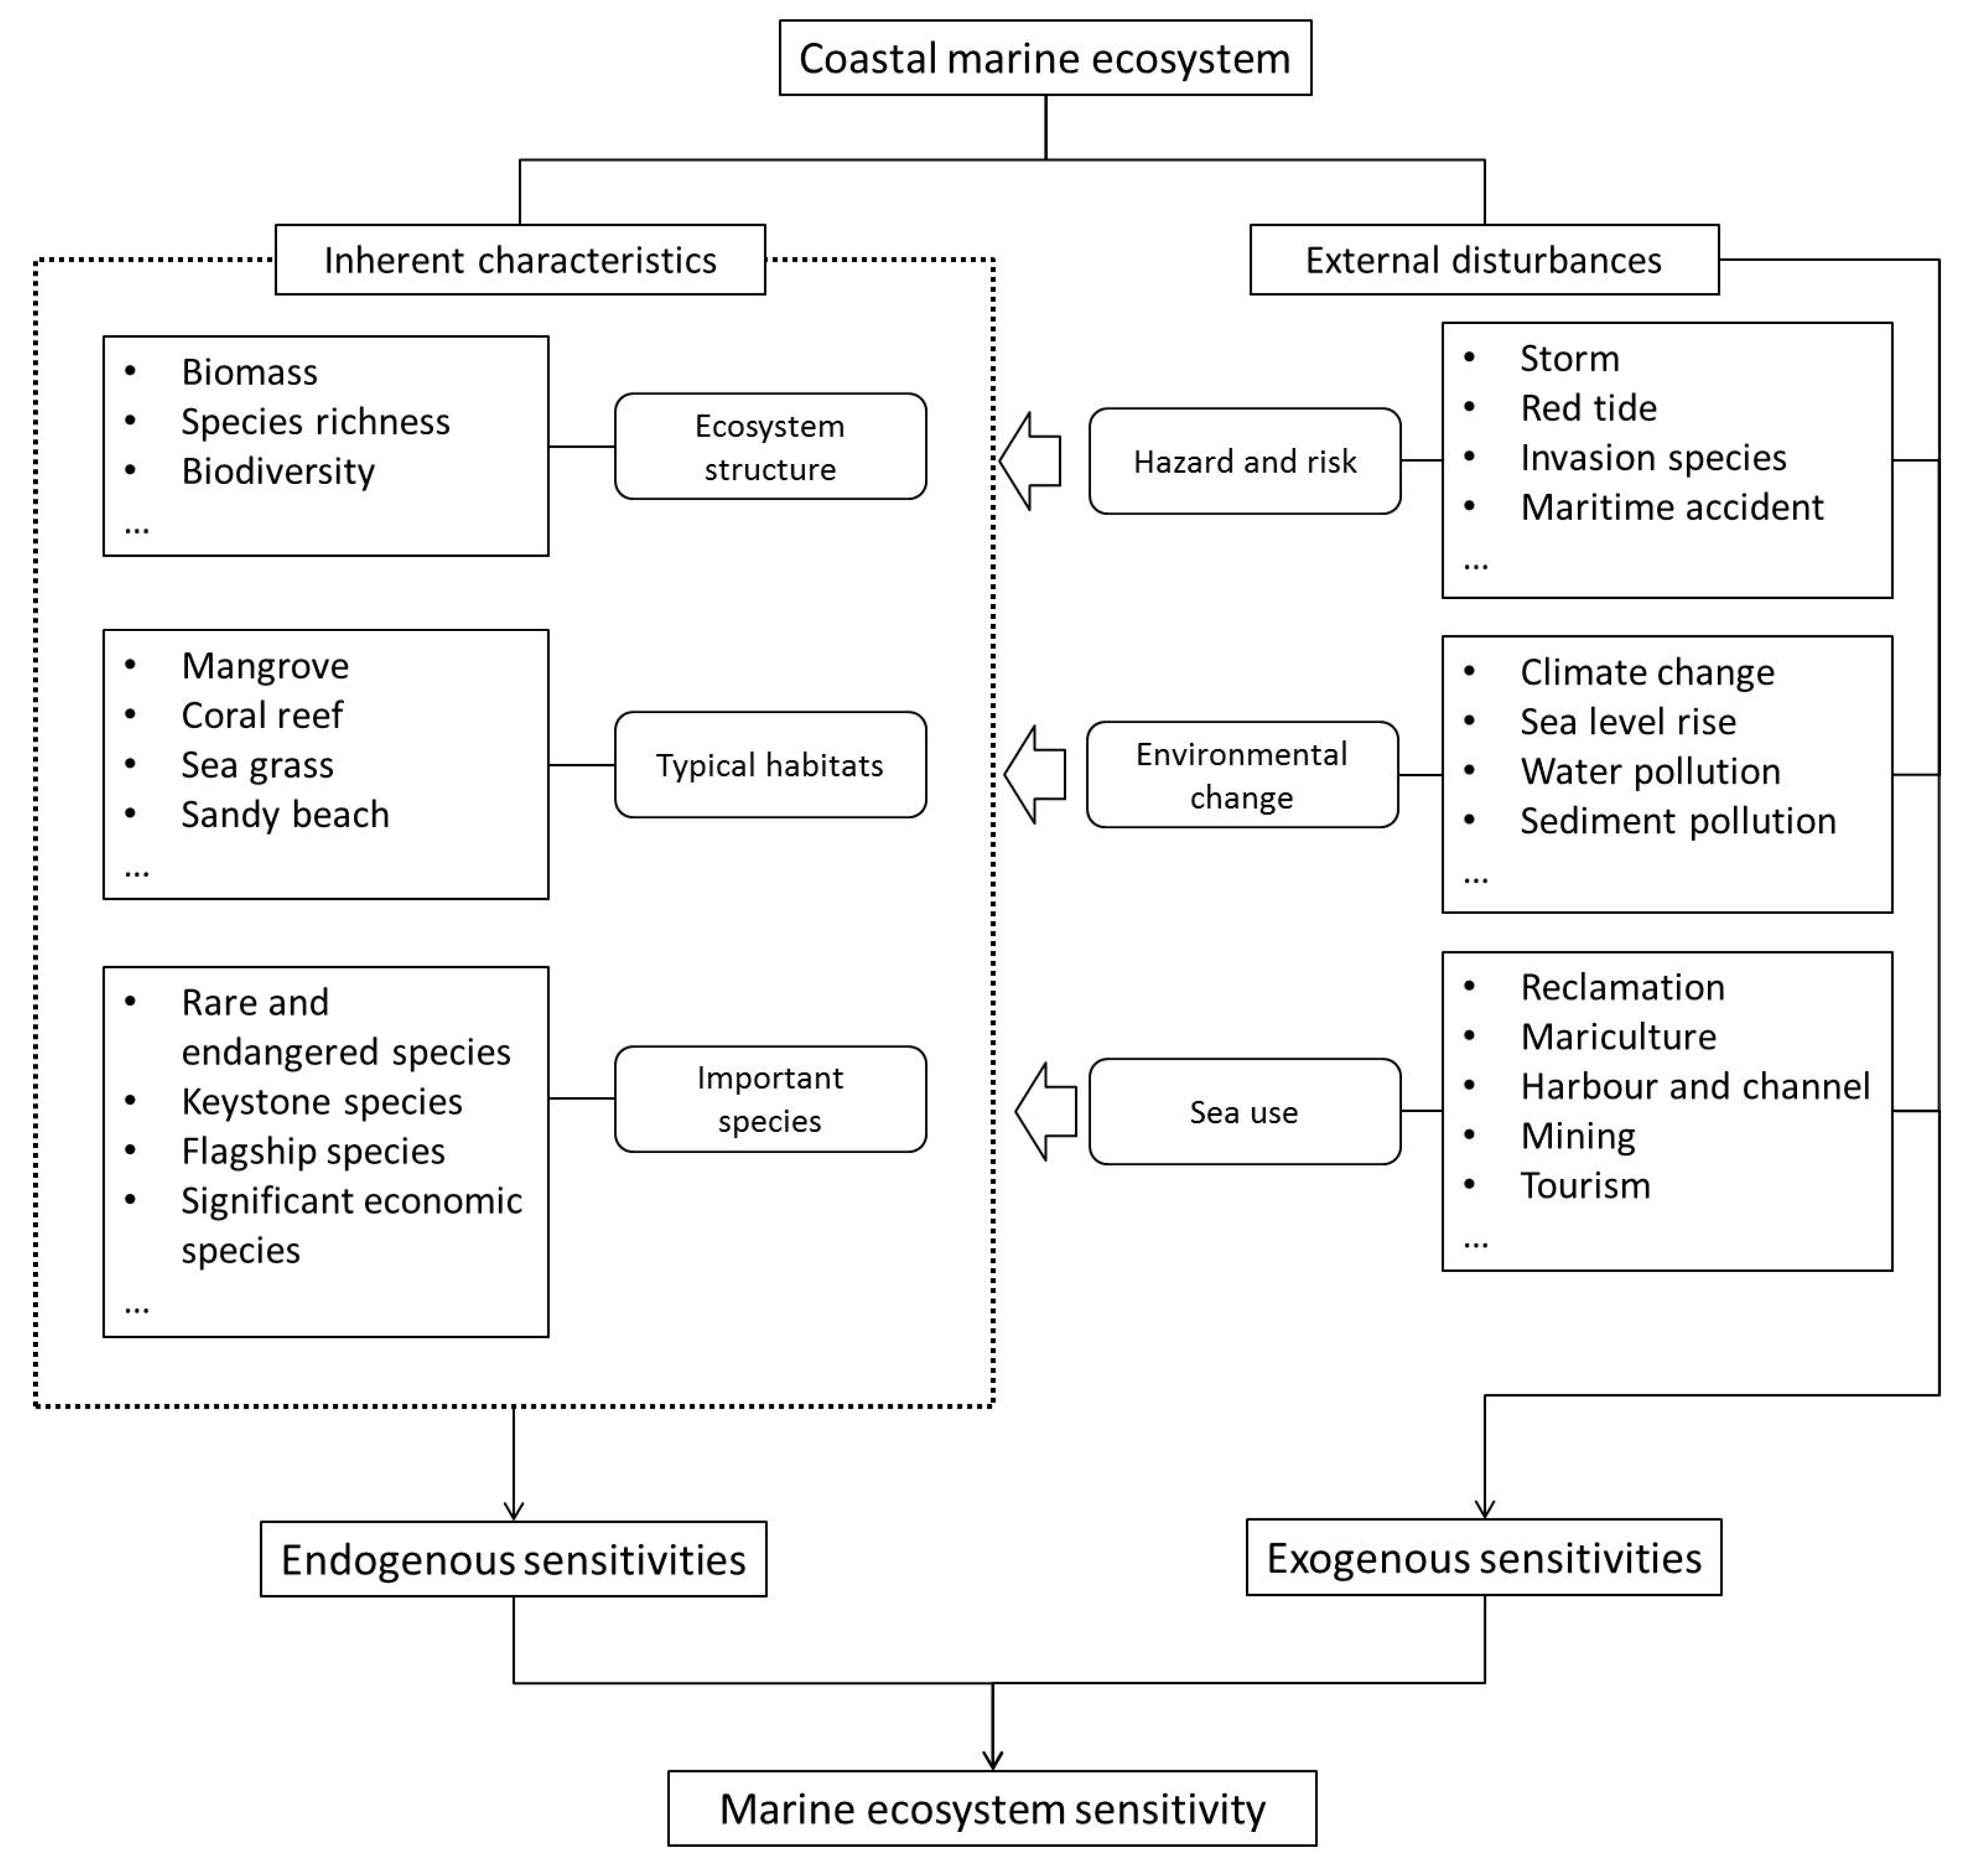
2.2. Ecological Sensitivity Assessment Framework and Indicators
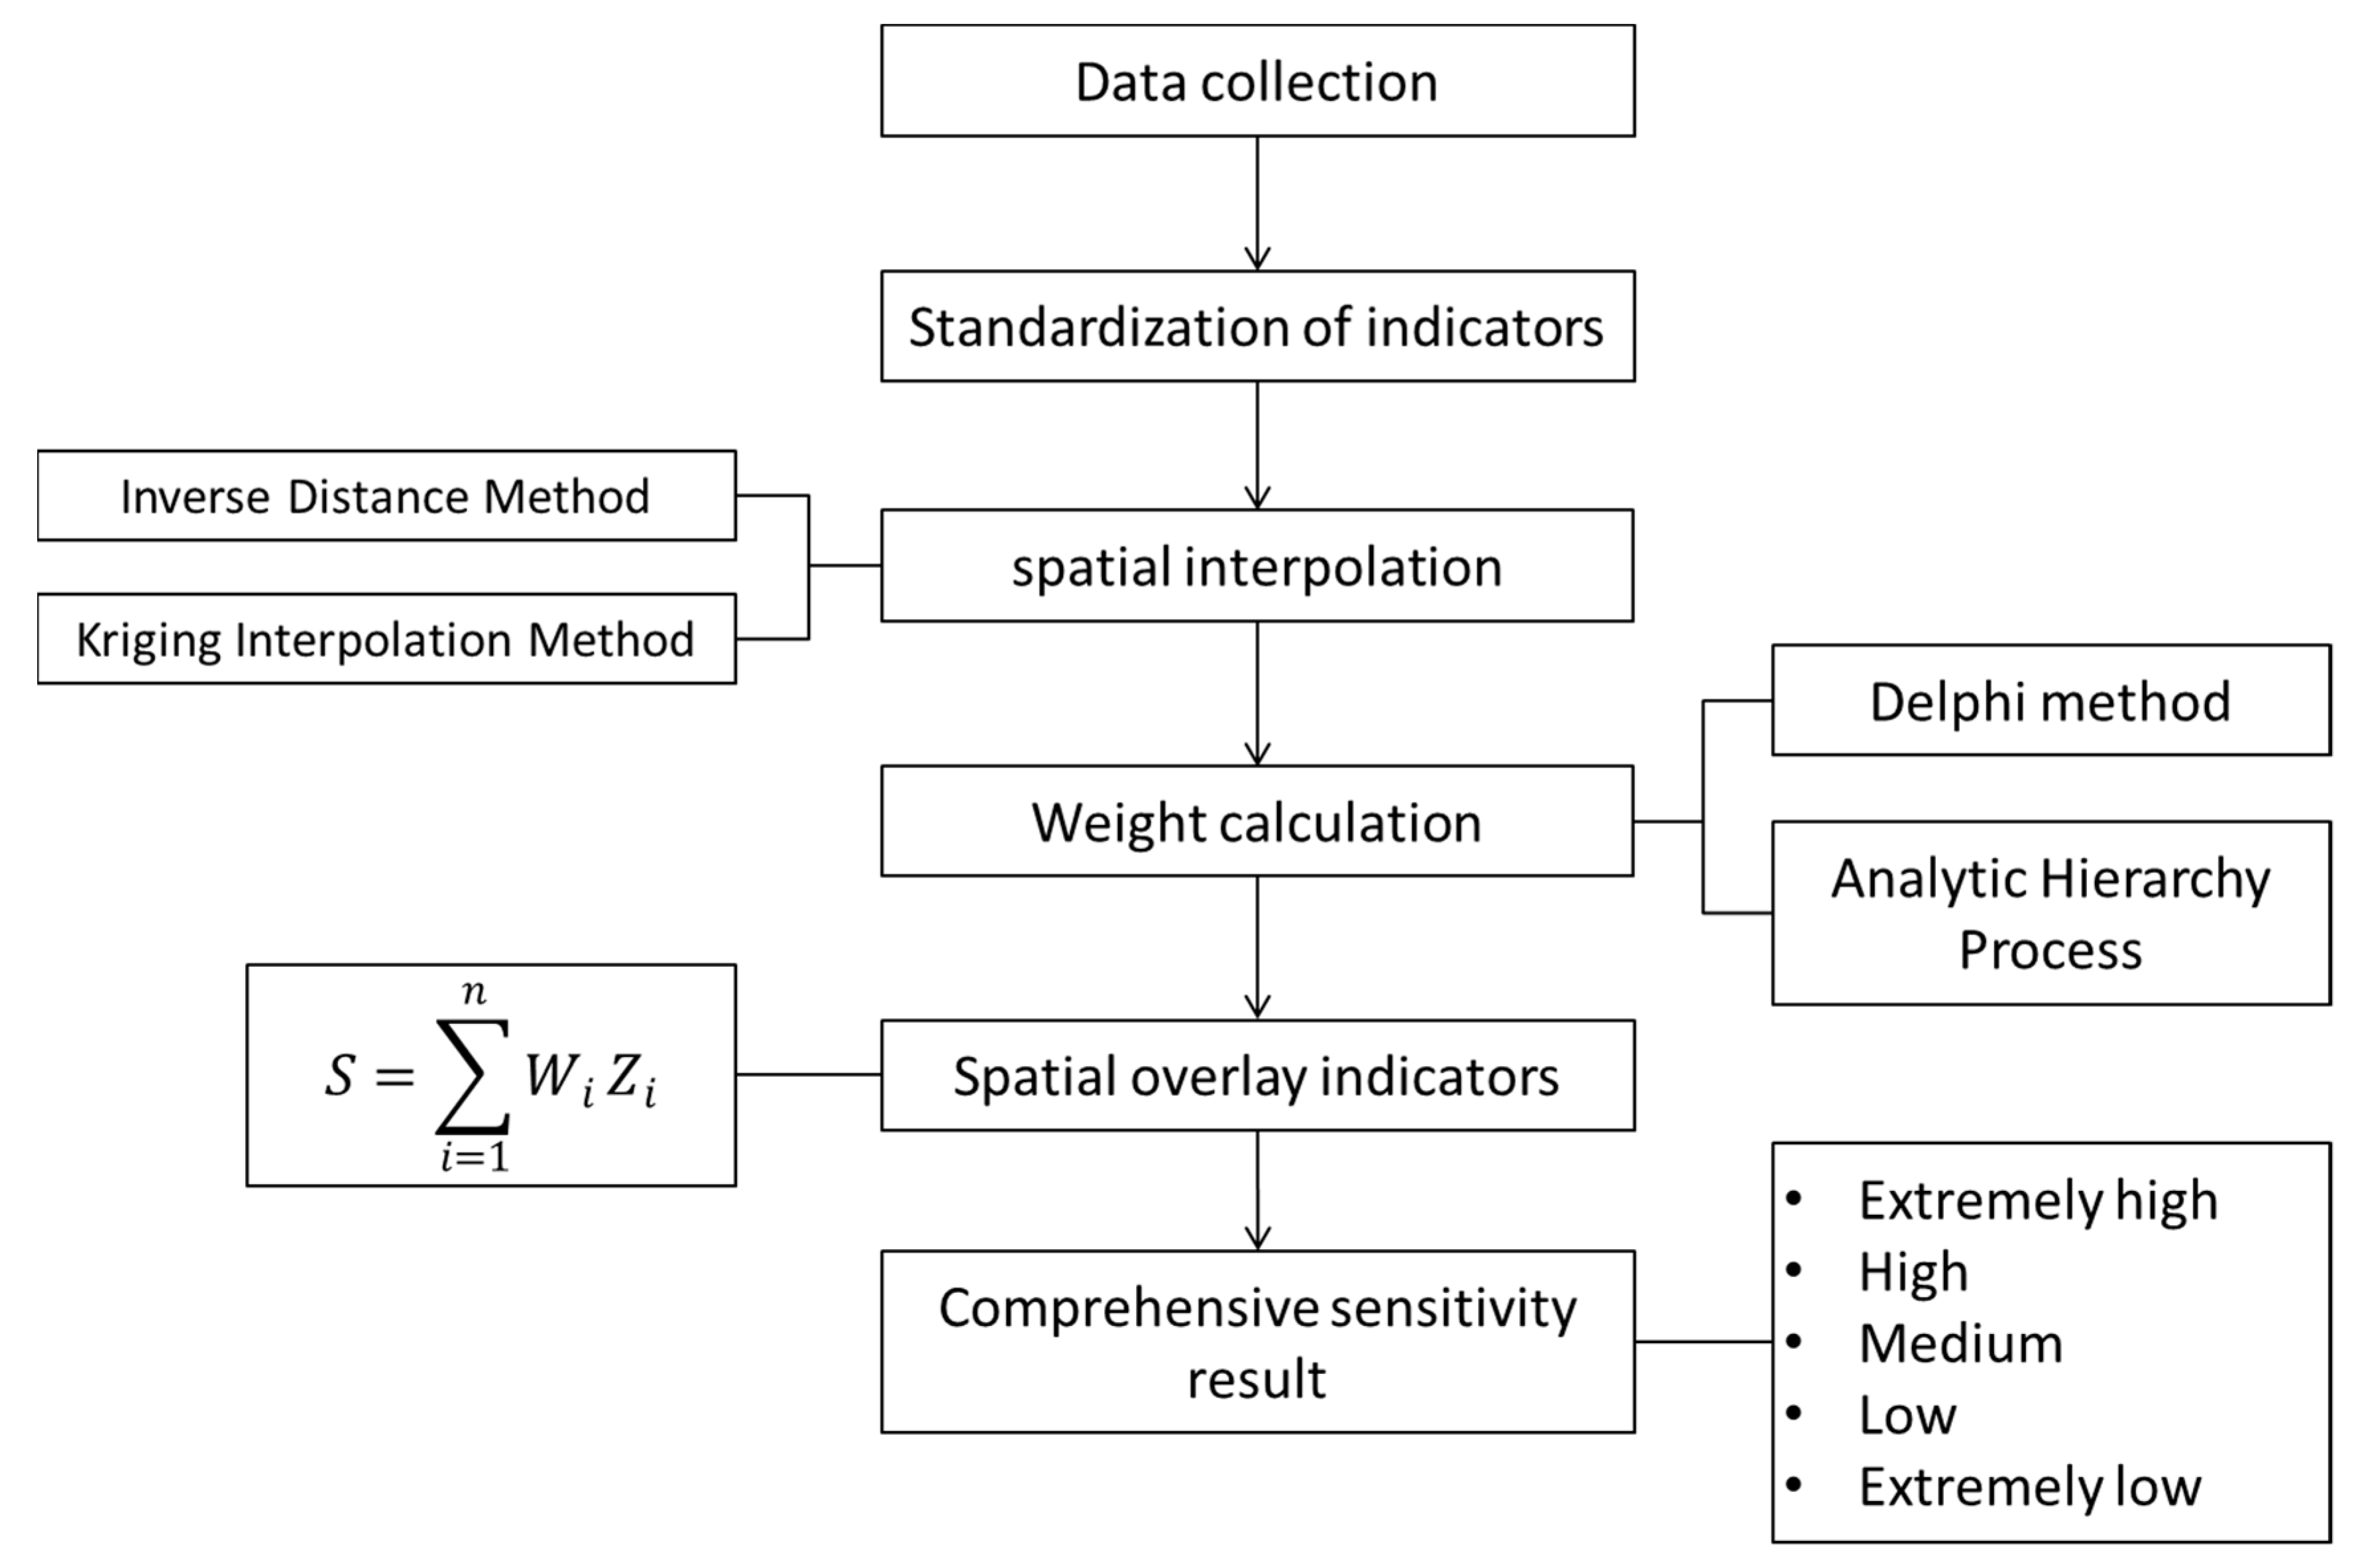
2.3. Data Processing
2.4. Calculation of Comprehensive Sensitivity
3. Results
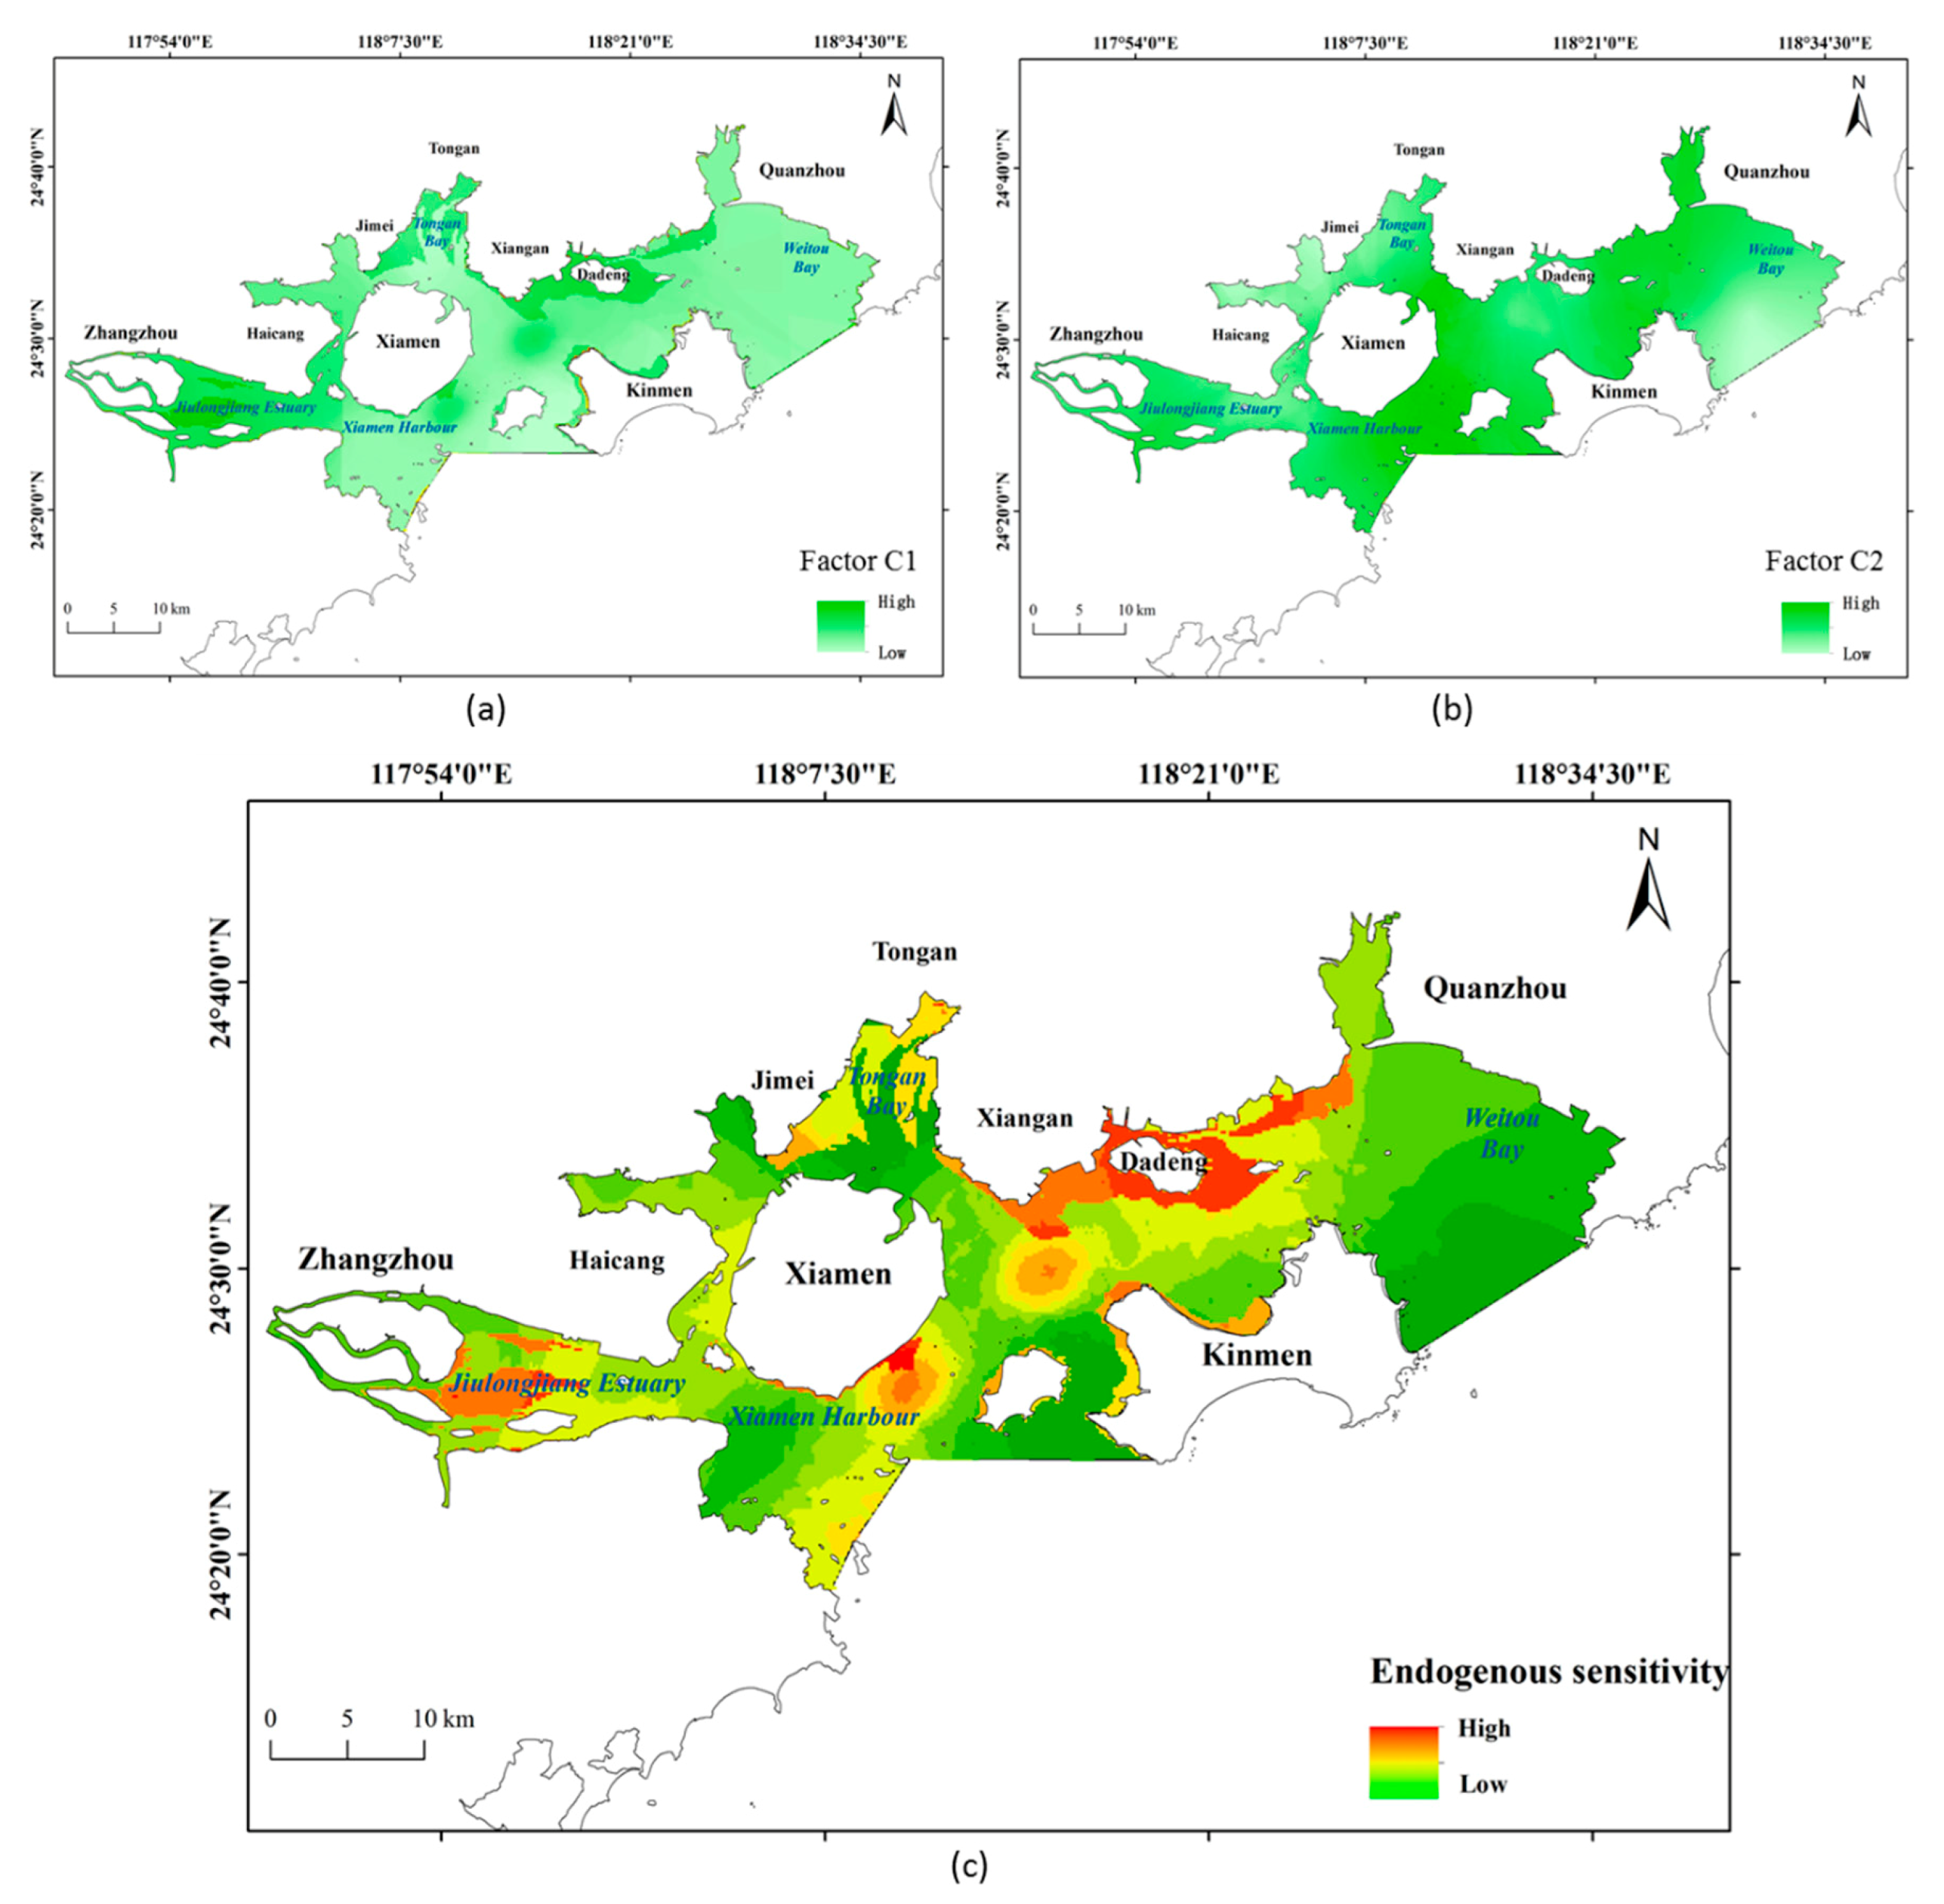
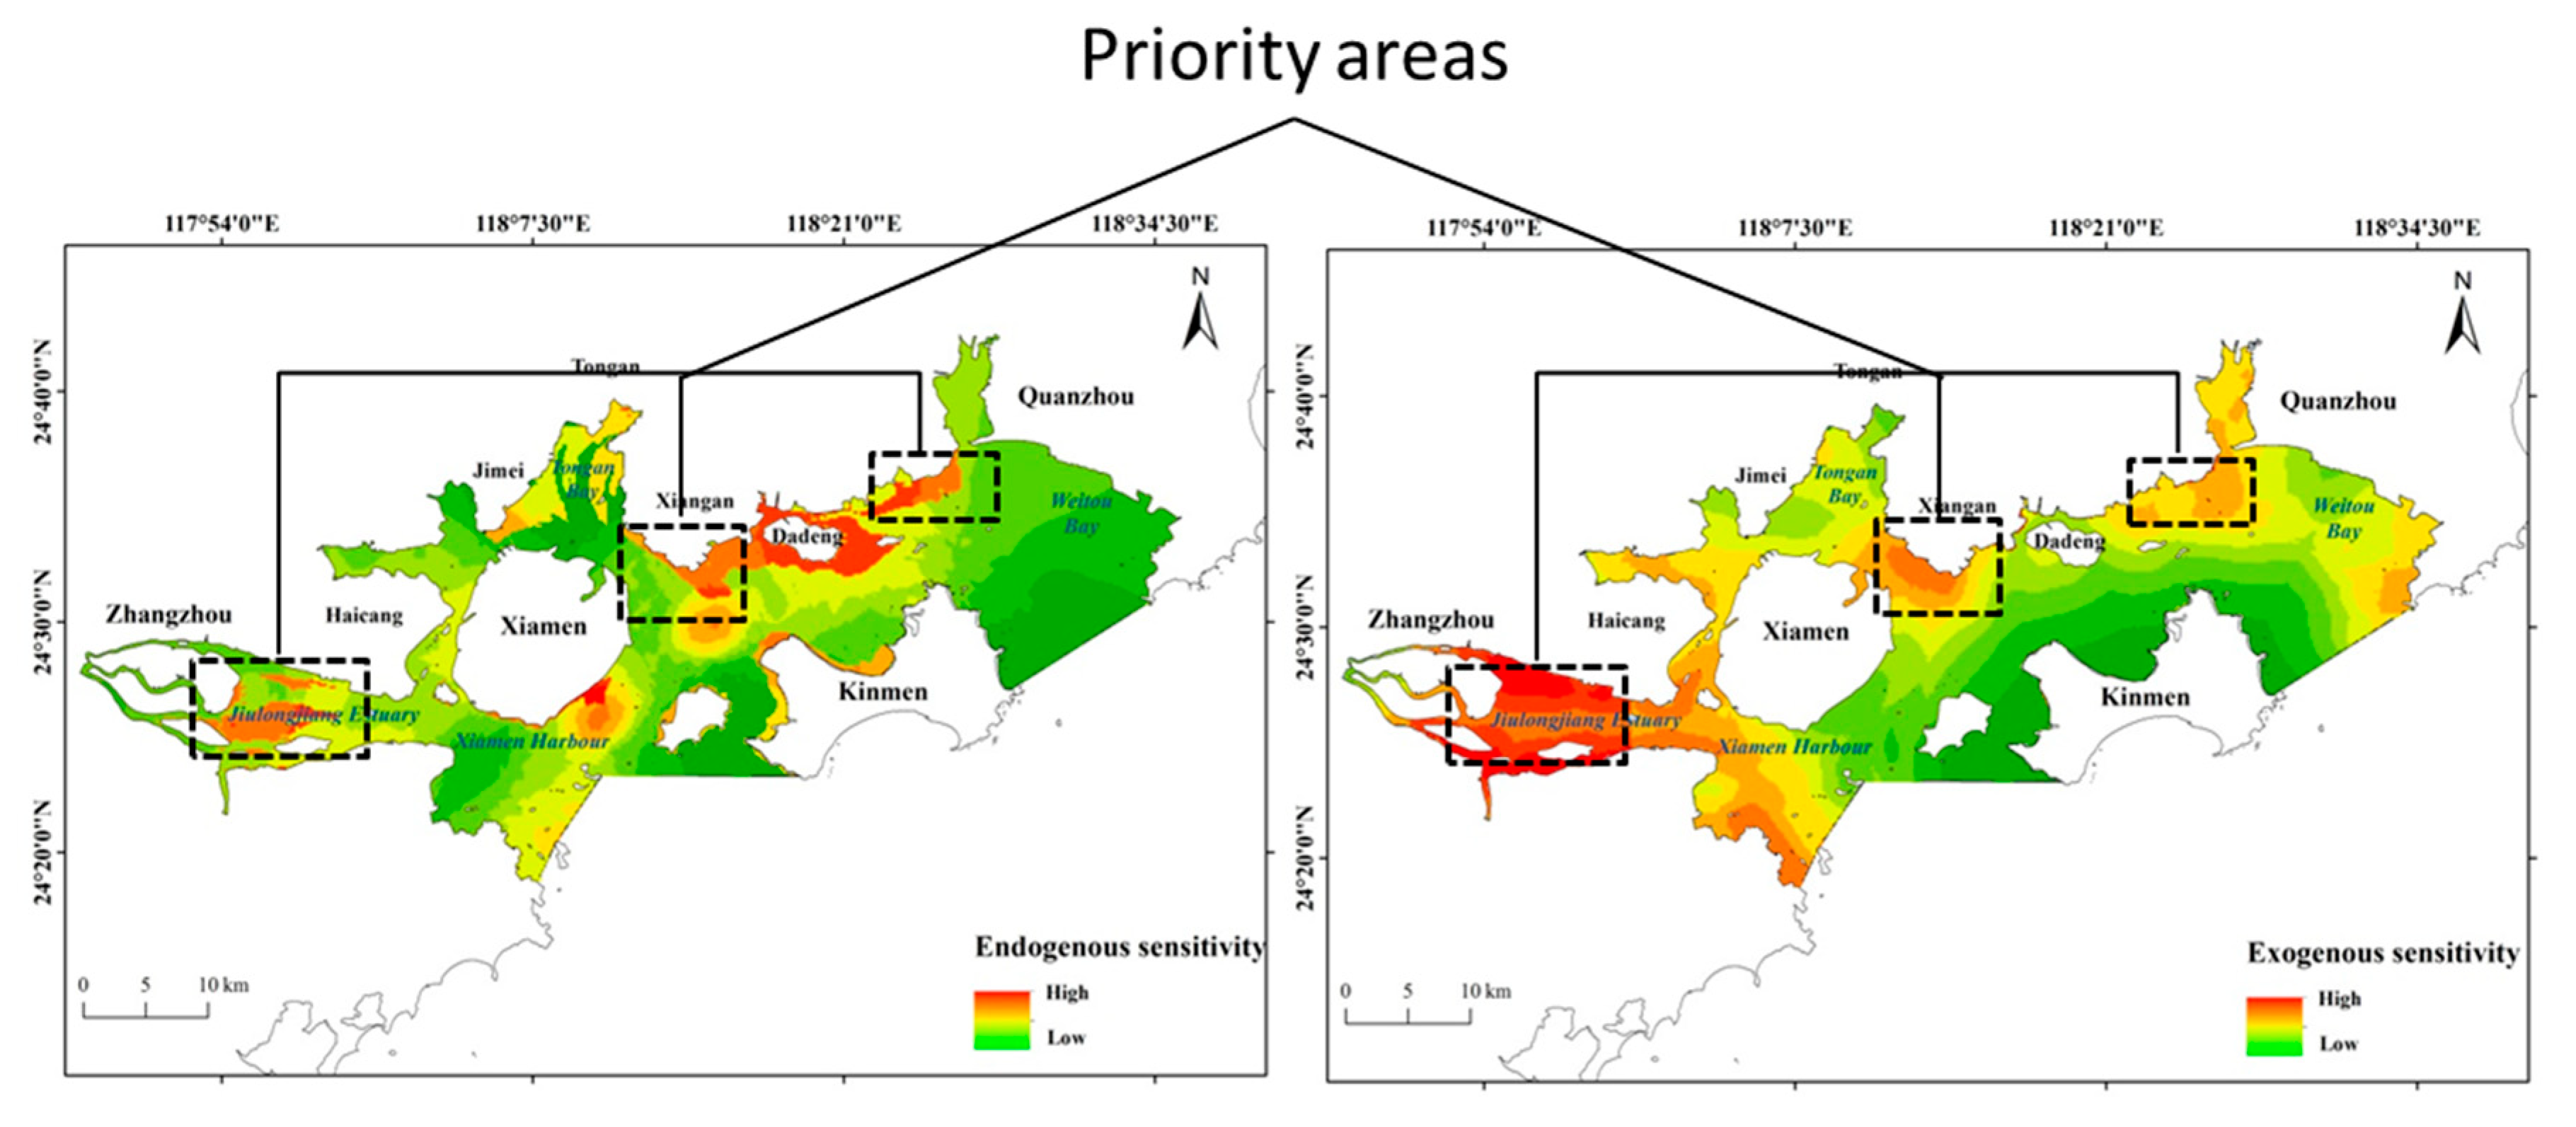
3.1. Endogenous Sensitivity
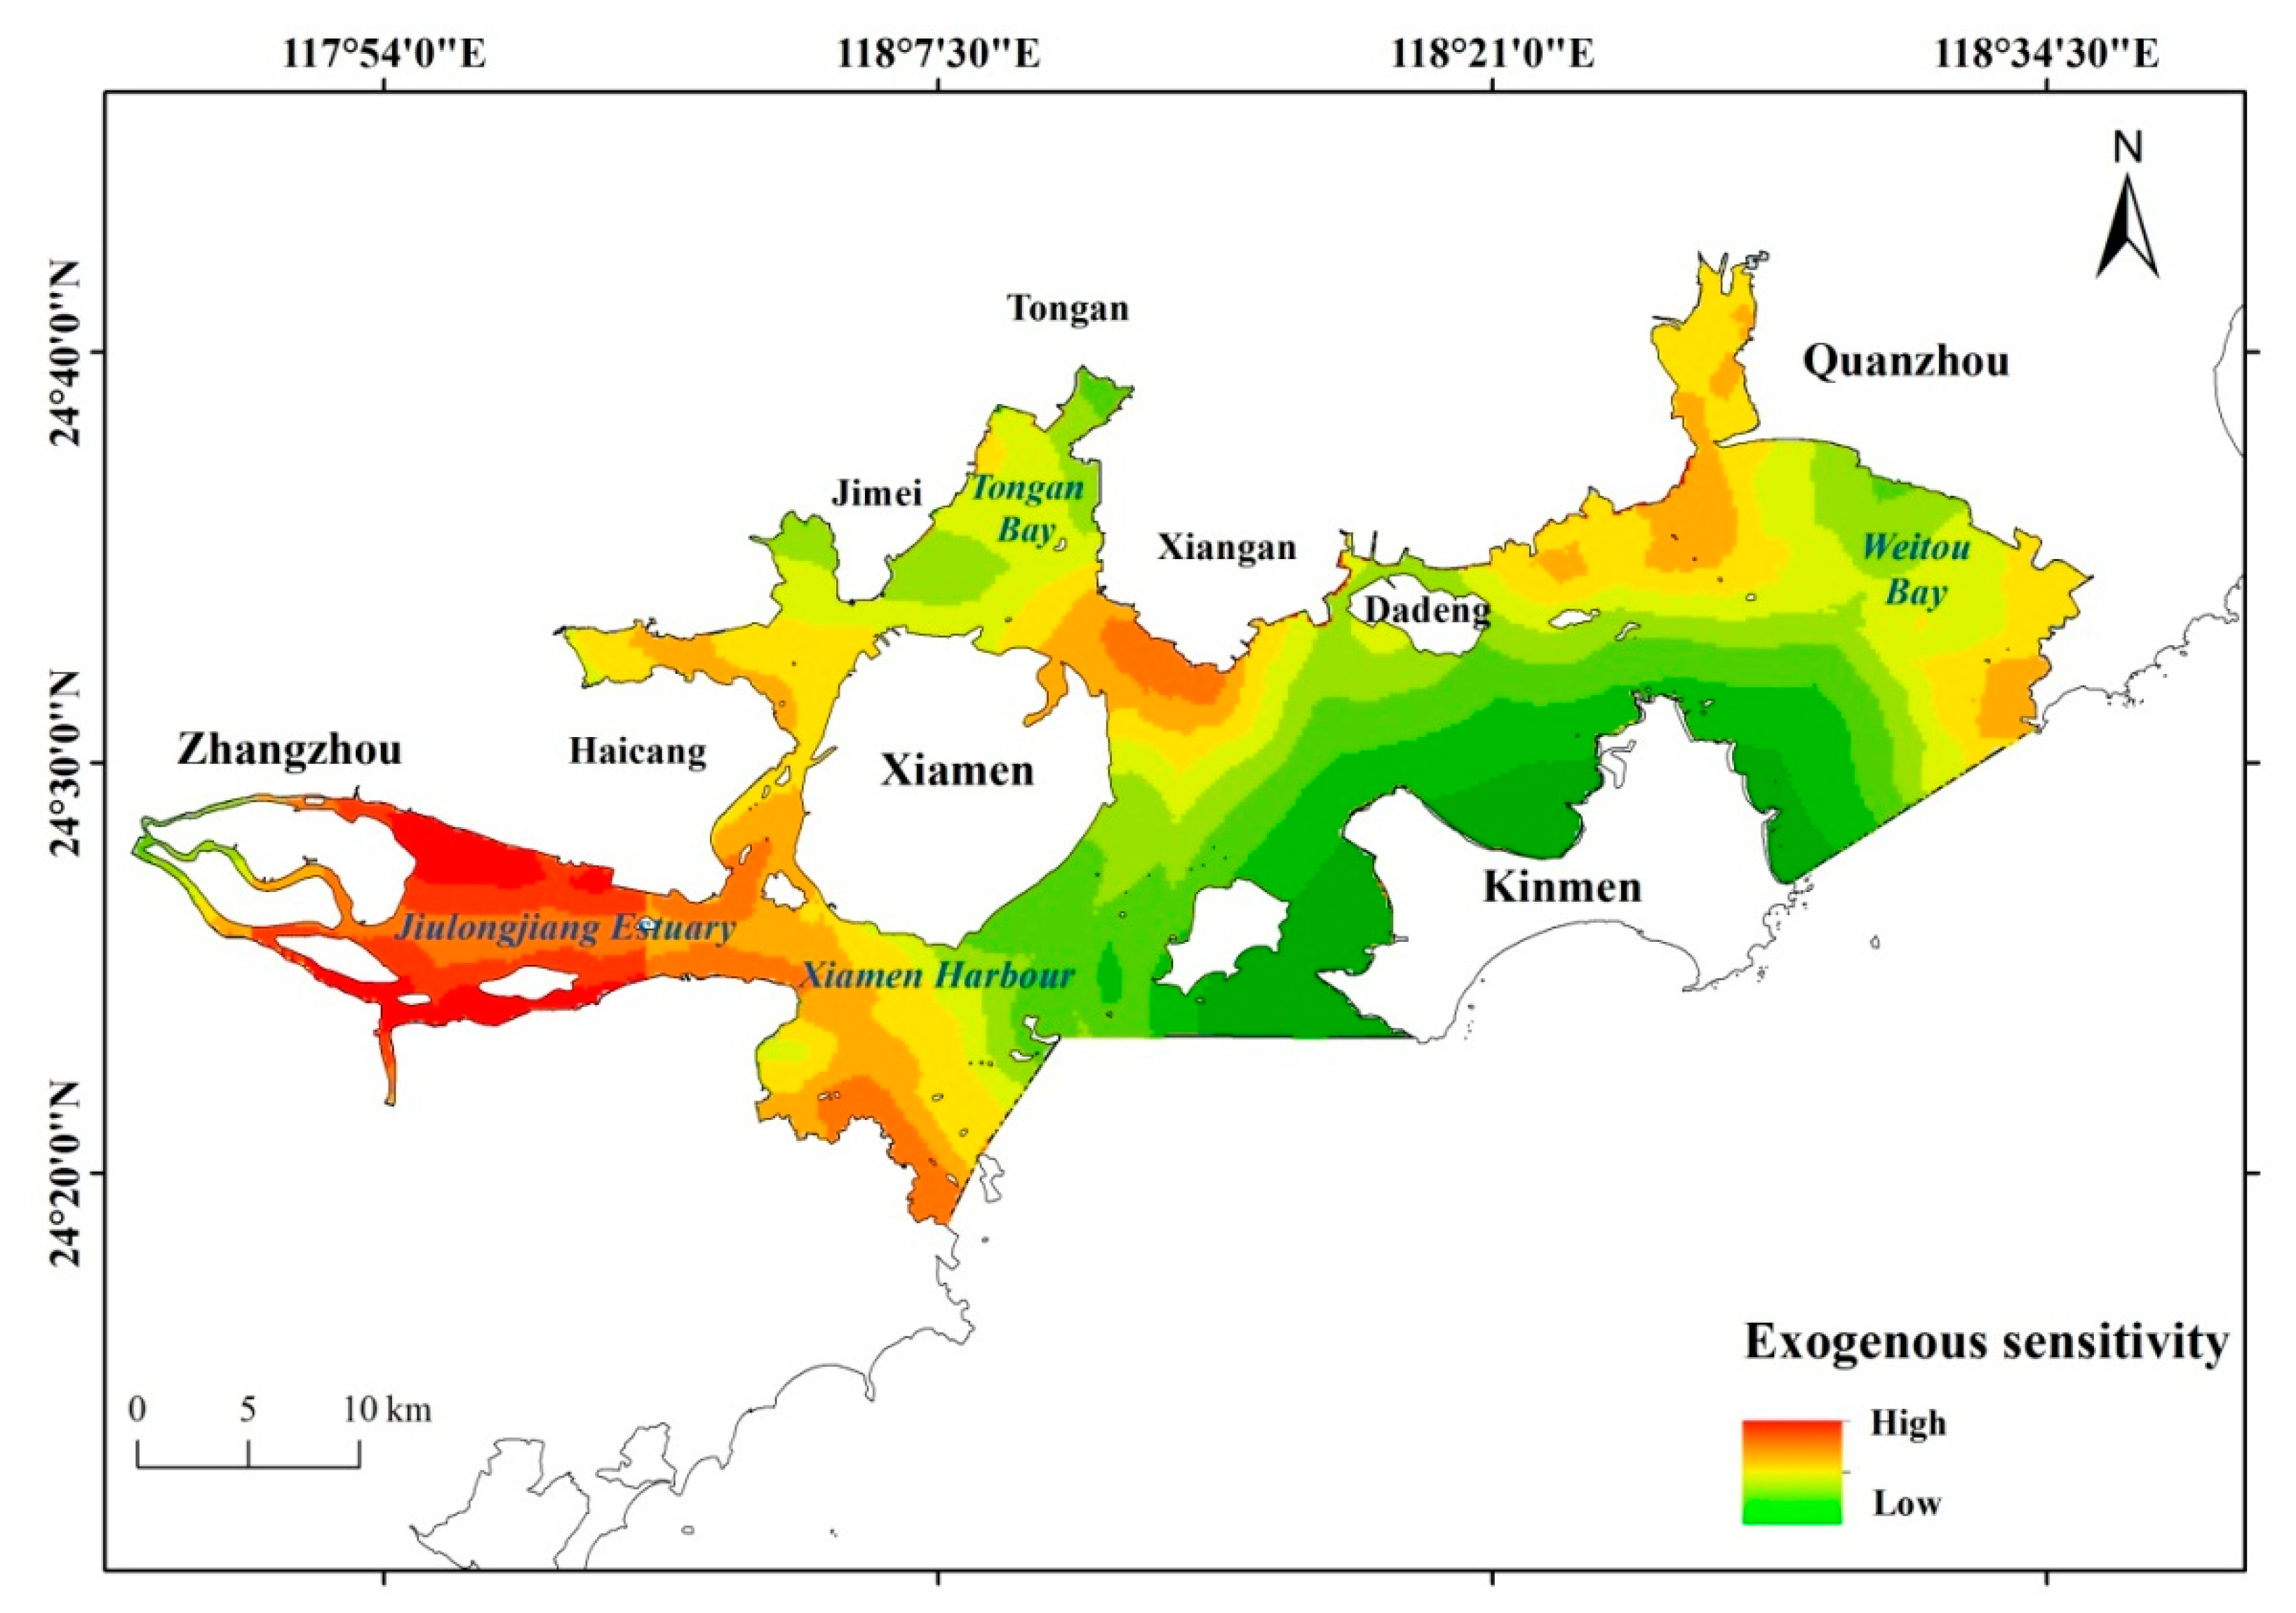
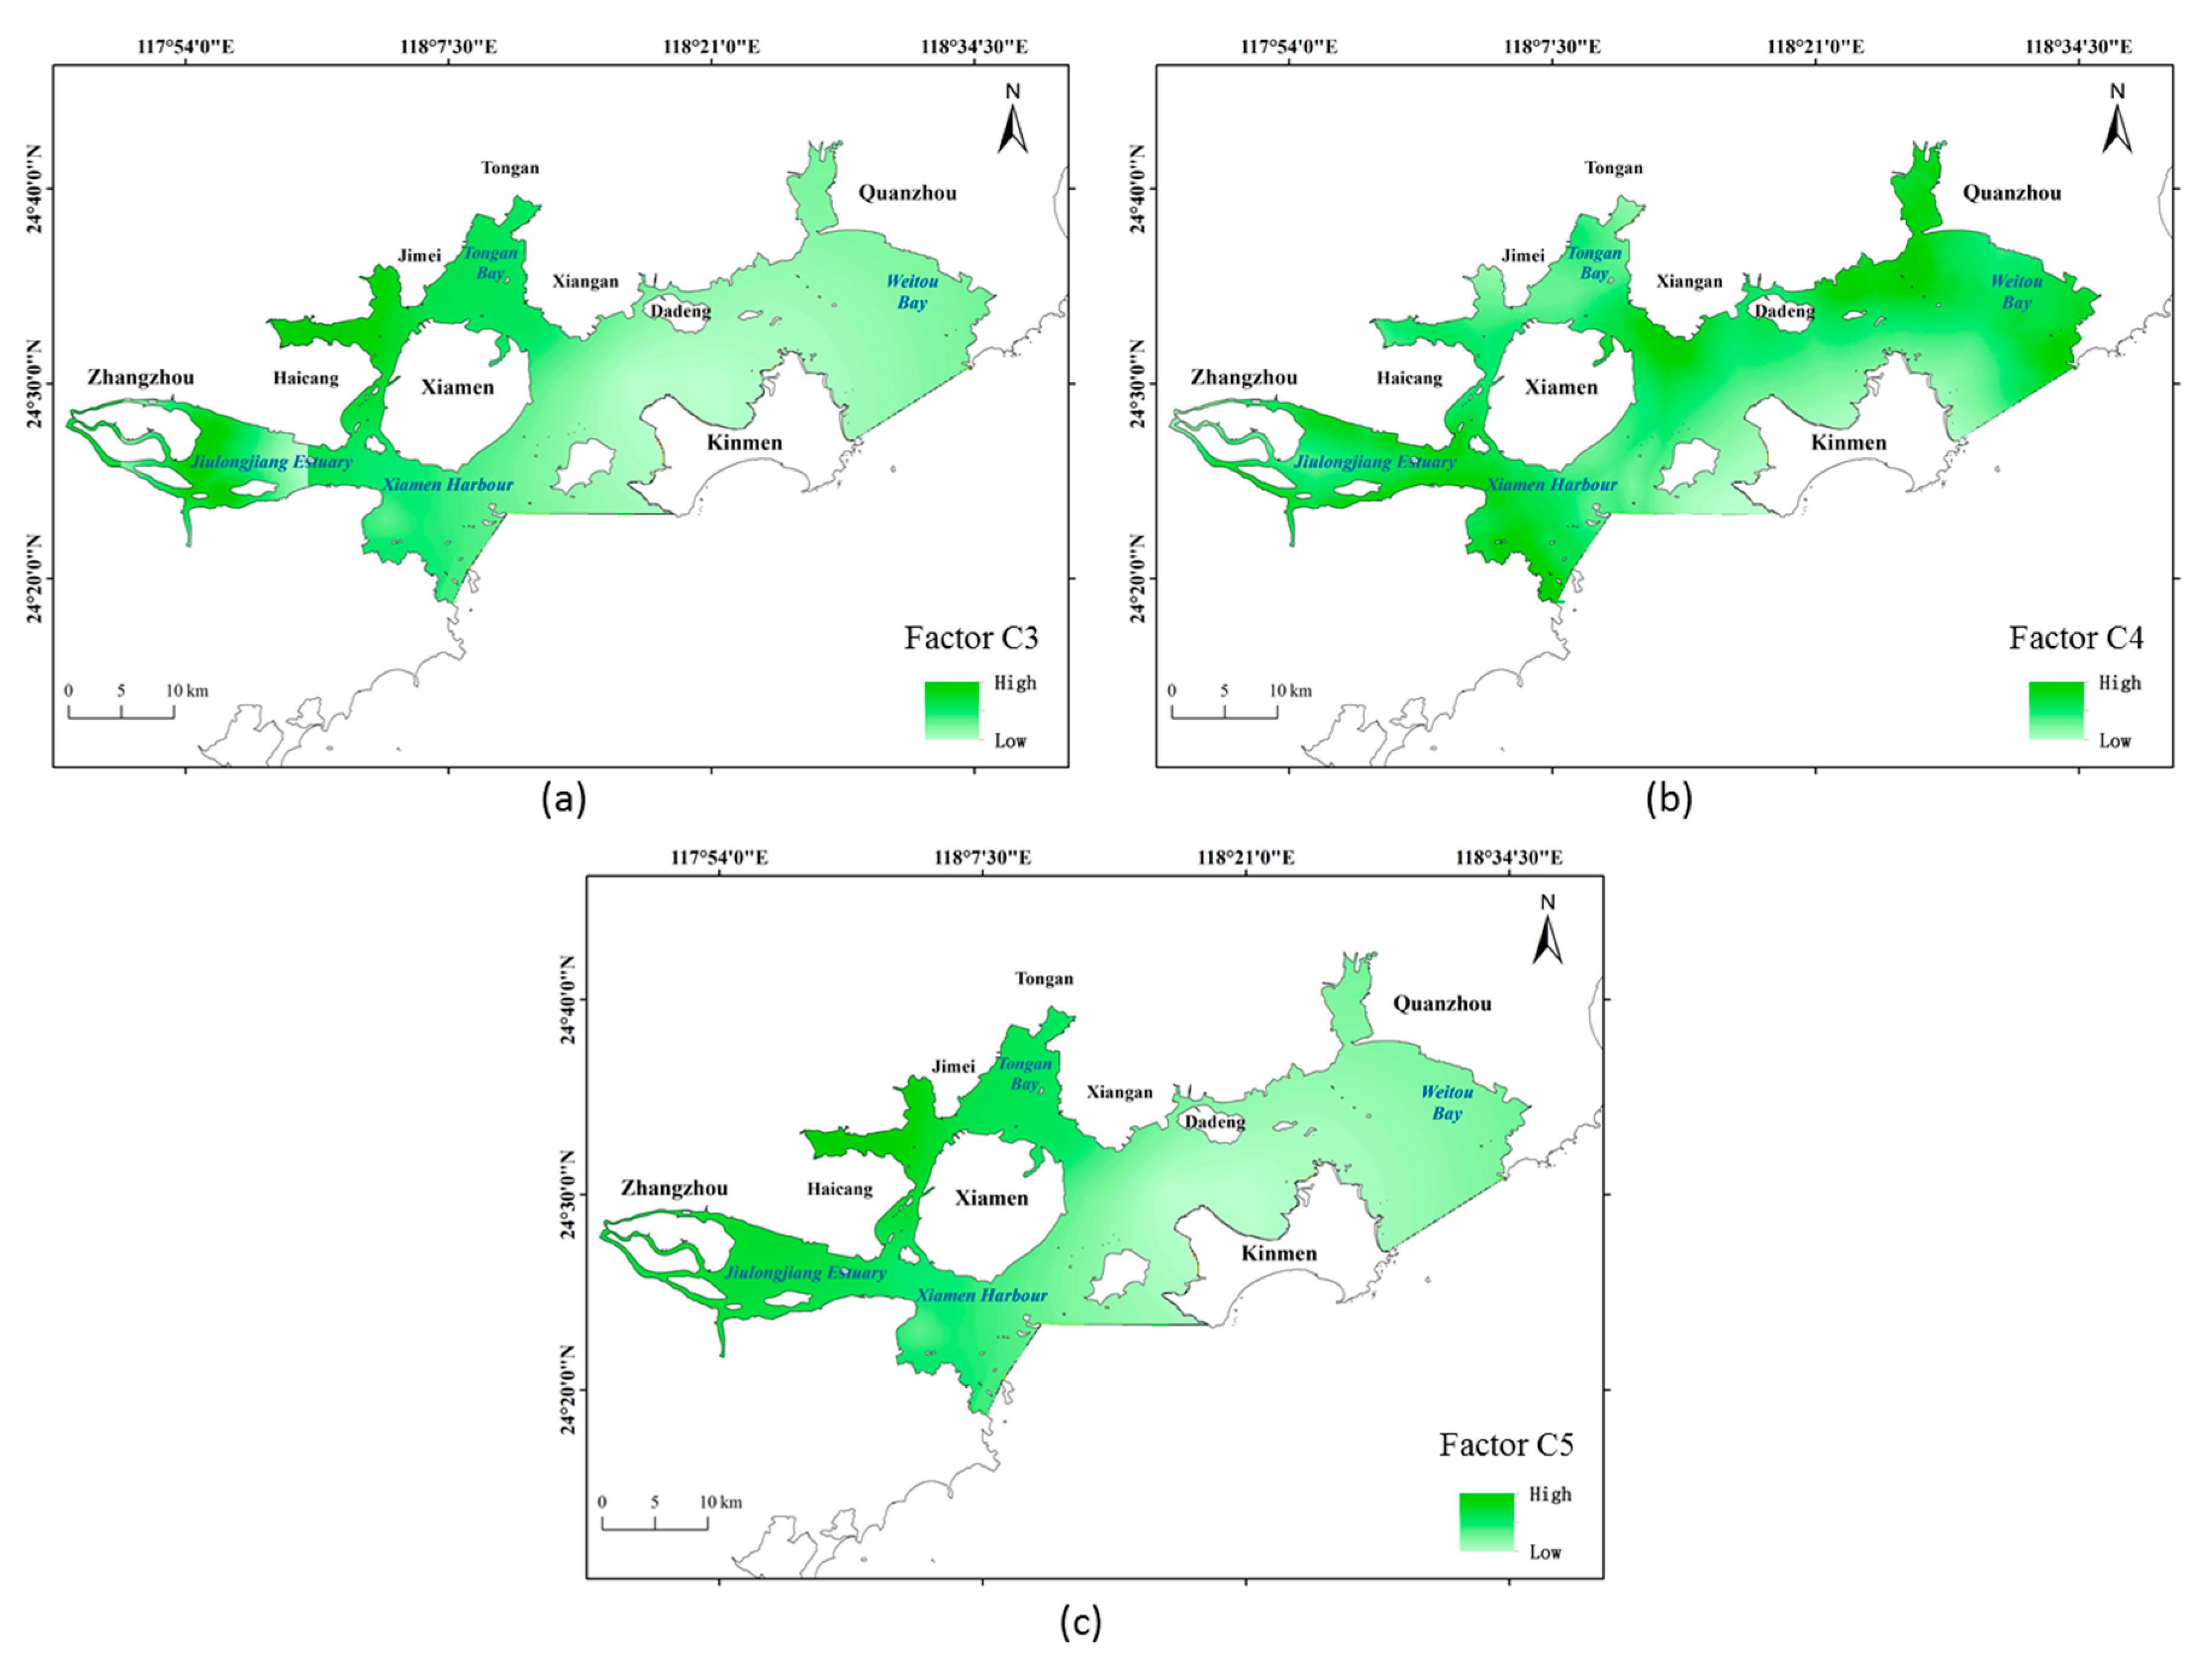
3.2. Exogenous Sensitivity
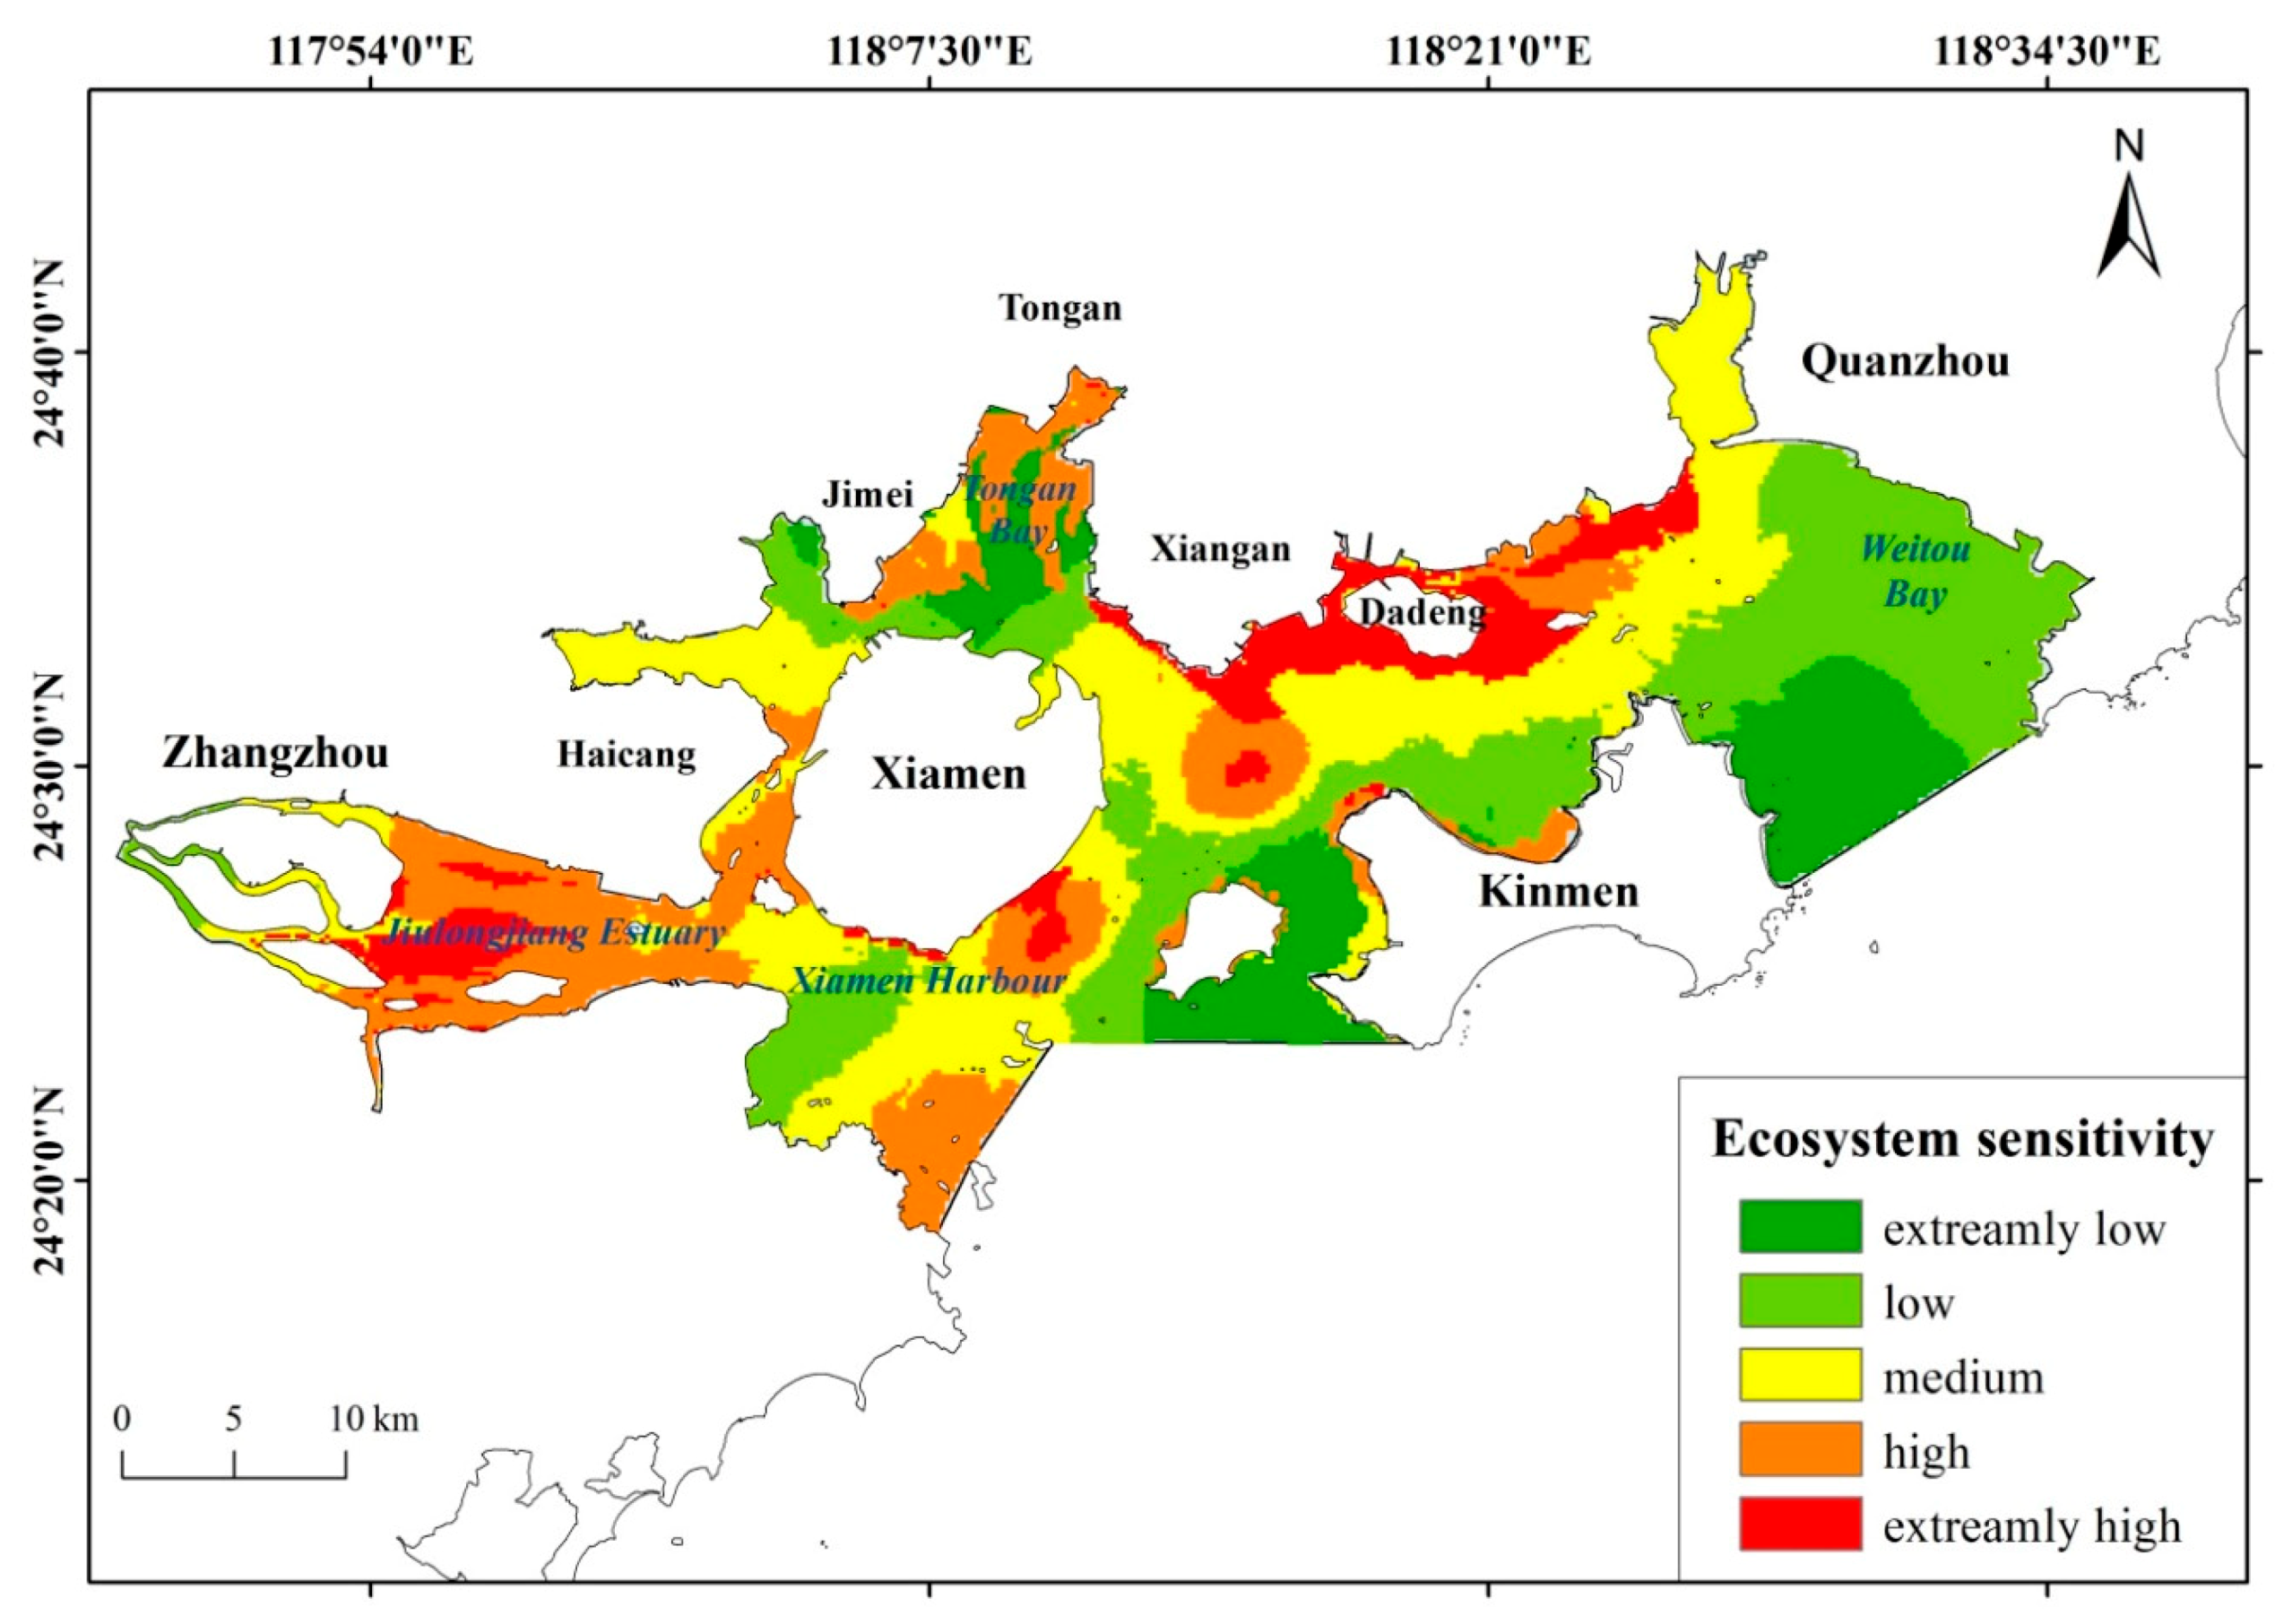
3.3. Ecological Sensitivity Distribution in Xiamen Bay
4. Discussion
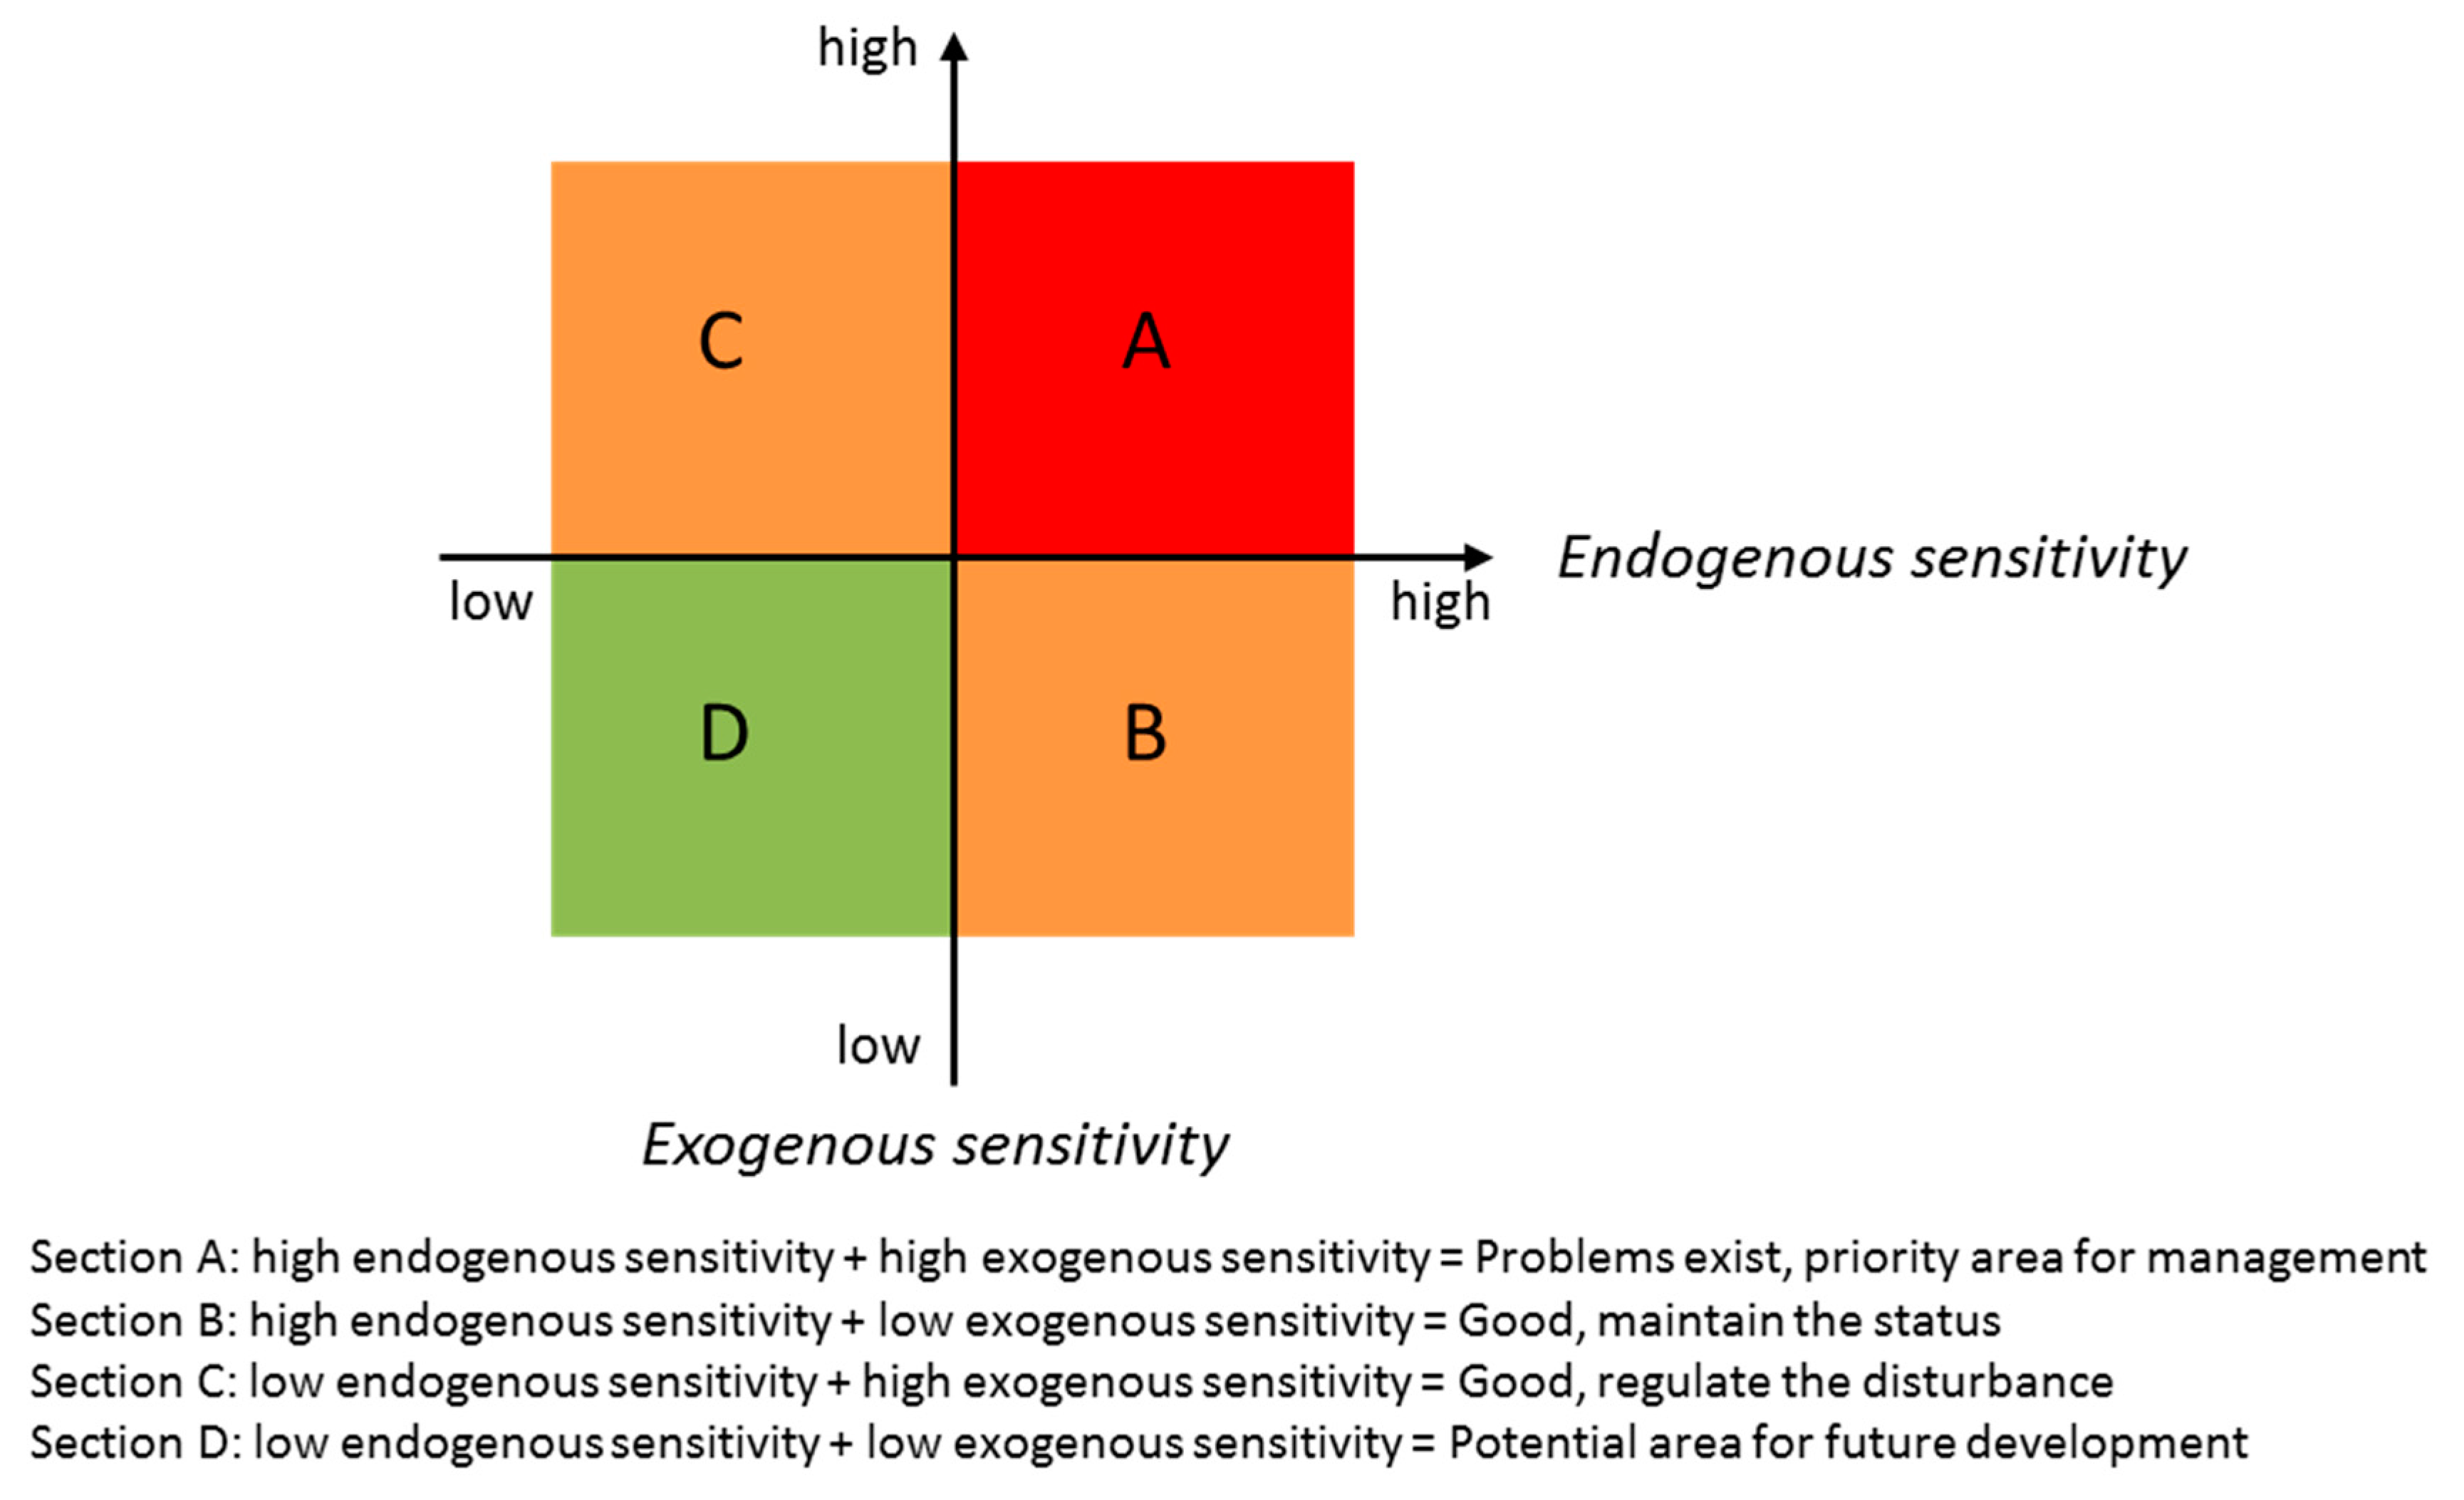
4.1. Comparison Analysis of Endogenous Sensitivity and Exogenous Sensitivity
4.2. Strategy for Ecosystem-Based Management in Xiamen Bay
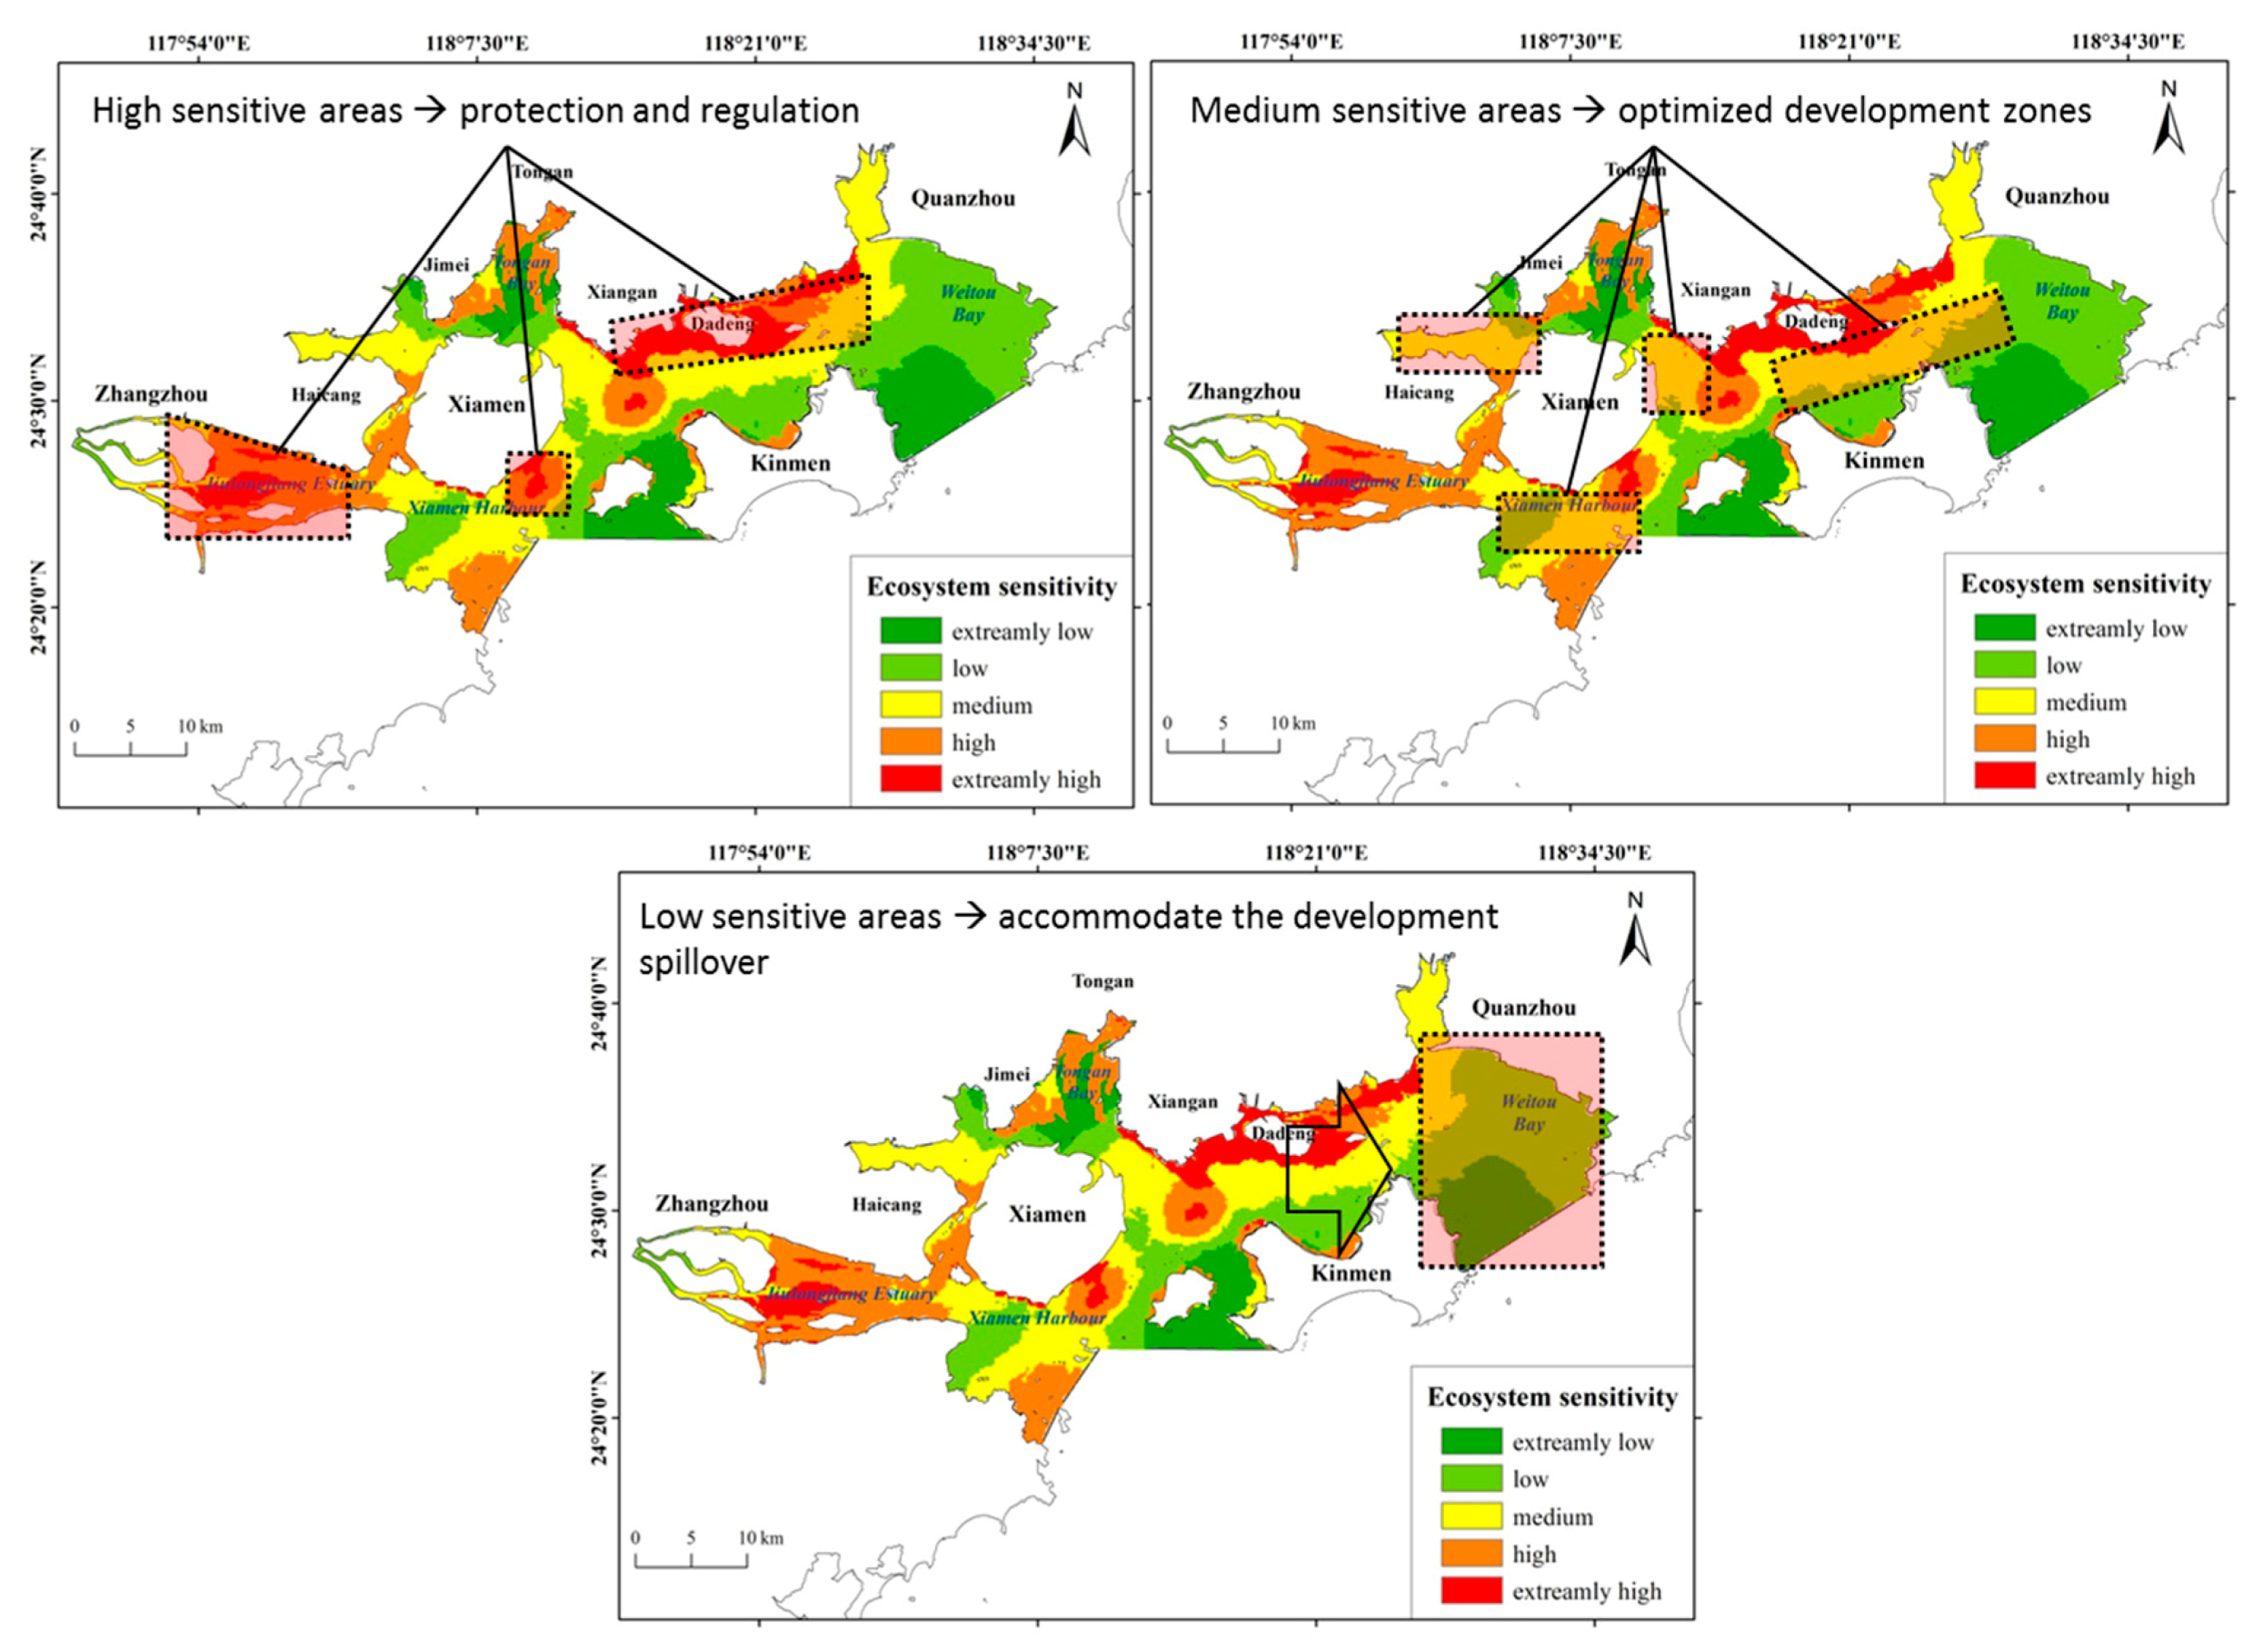
- Extremely high and highly sensitive areas in Xiamen Bay basically encompassed certain habitats, such as mangroves and sandy beaches, as well as habitats used by important species [55,56]. A considerable portion of these areas already falls within protected areas, which should be under mandatory protection in accordance with the laws, regulations, and related plans. Development and construction activities that influence the ecological function of the region should be strictly prohibited, and exogenous sensitivity should be controlled or reduced as much as possible.
- Medium-sensitivity areas in Xiamen Bay were mainly located in zones that supported harbors, shipping, mariculture, reclamation, and other coastal development, where sustainable sea-use management should be emphasized by controlling the scope and form of construction [57]. The introduction of development activities that adversely affect marine ecosystems should be limited and the methods of using natural resources should be improved. These areas could be treated as optimized development zones that are allowed to undergo a moderate degree of development under the “protection with development” policy.
- Areas with extremely low and low sensitivity were mainly located in zones where protected species and typical habitats are absent and where marine development activities are weak. Therefore, the protection value of these areas is low and the ecological cost of development is also low. In MSP, these areas should be treated as priority zones for future construction and urbanization. Leisure and entertainment facilities should be promoted. However, all development should be subject to scientific regulation and control to ensure that human activities are gradually and properly transferred from the highly sensitive areas.
4.3. The Implementation in MSP
5. Conclusions
Author Contributions
Funding
Conflicts of Interest
Appendix A

| Target Level | Criterion Level | Factor Level | Indicator Level | Weight |
|---|---|---|---|---|
| Ecosystem sensitivity of Xiamen Bay A1 | Endogenous sensitivity B1 | Distribution areas of typical habitats and important species C1 | Mangrove D1 | 0.089 |
| Waterfowl habitat D2 | 0.089 | |||
| Chinese White Dolphin habitat D3 | 0.089 | |||
| Amphioxus habitat D4 | 0.089 | |||
| Sandy beach D5 | 0.089 | |||
| Marine biome C2 | Chlorophyll a content D6 | 0.021 | ||
| Biodiversity index of phytoplankton D7 | 0.048 | |||
| Biodiversity index of zooplankton D8 | 0.036 | |||
| Biodiversity index of benthos D9 | 0.087 | |||
| Biodiversity index of nekton D10 | 0.030 | |||
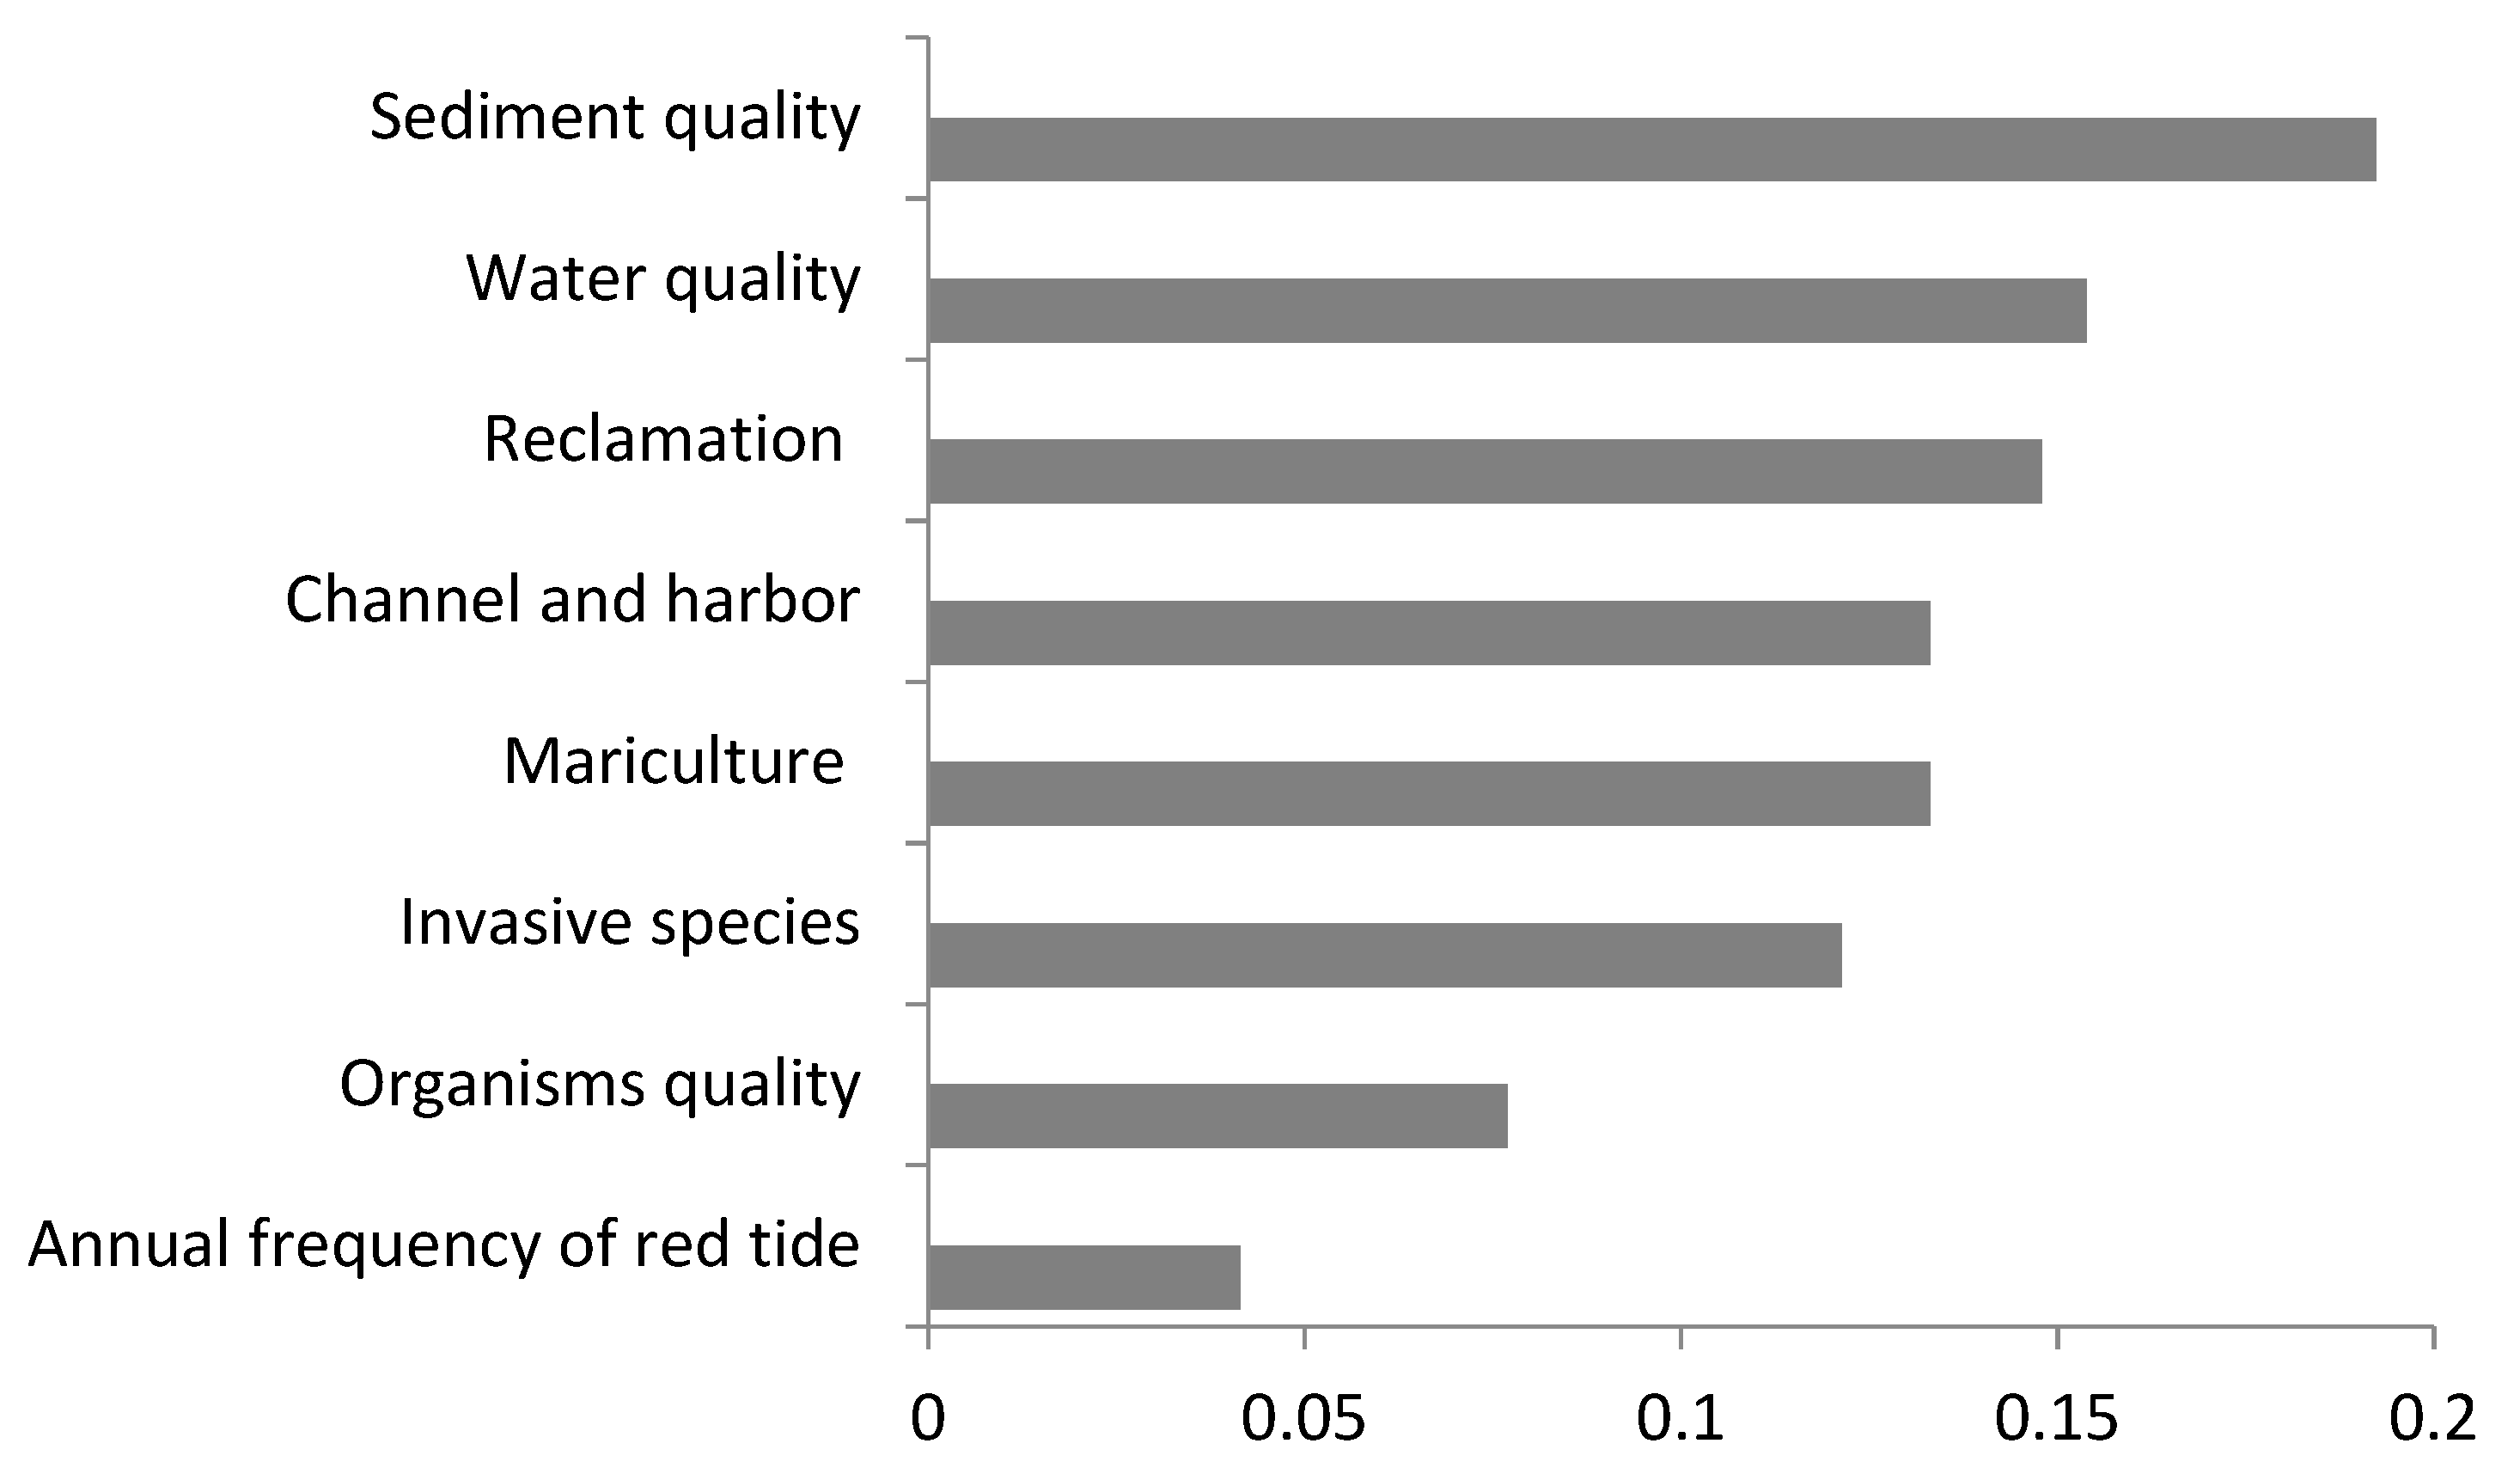
| Exogenous sensitivity B2 | Hazard and risk C3 | Annual frequency of red tide D11 | 0.014 | |
| Invasive species D12 | 0.041 | |||
| Sea-use activities C4 | Mariculture D13 | 0.045 | ||
| Reclamation D14 | 0.050 | |||
| Channel and harbor D15 | 0.045 | |||
| Environment qualities C5 | Petroleum in water D16 | 0.013 | ||
| Organic pollution in water D17 | 0.013 | |||
| Inorganic nitrogen in water D18 | 0.013 | |||
| Active phosphate in water D19 | 0.013 | |||
| Organic carbon in sediment D20 | 0.013 | |||
| Sulfides in sediment D21 | 0.013 | |||
| Polychlorinated biphenyls in sediment D22 | 0.013 | |||
| Heavy metals in sediment D23 | 0.013 | |||
| Petroleum in sediment D24 | 0.013 | |||
| Heavy metals in organisms D25 | 0.013 | |||
| Petroleum in organisms D26 | 0.013 |
References
- Ray, G.C.; Hayden, B.P. Coastal zone ecotones. In Landscape Boundaries; Springer: New York, NY, USA, 1992; pp. 403–420. [Google Scholar]
- Reizopoulou, S.; Simboura, N.; Barbone, E.; Aleffi, F.; Basset, A.; Nicolaidou, A. Biodiversity in transitional waters: Steeper ecotone, lower diversity. Mar. Ecol. 2014, 35, 78–84. [Google Scholar] [CrossRef]
- Halpern, B.S.; Walbridge, S.; Selkoe, K.A.; Kappel, C.V.; Micheli, F.; D’agrosa, C.; Bruno, J.F.; Casey, K.S.; Ebert, C.; Fox, H.E.; et al. A global map of human impact on marine ecosystems. Science 2008, 319, 948–952. [Google Scholar] [CrossRef] [PubMed]
- Hoegh-Guldberg, O.; Bruno, J.F. The impact of climate change on the world’s marine ecosystems. Science 2010, 328, 1523–1528. [Google Scholar] [CrossRef] [PubMed]
- Perry, R.I.; Cury, P.; Brander, K.; Jennings, S.; Möllmann, C.; Planque, B. Sensitivity of marine systems to climate and fishing: Concepts, issues and management responses. J. Mar. Syst. 2010, 79, 427–435. [Google Scholar] [CrossRef]
- Solan, M.; Cardinale, B.J.; Downing, A.L.; Engelhardt, K.A.; Ruesink, J.L.; Srivastava, D.S. Extinction and ecosystem function in the marine benthos. Science 2004, 306, 1177–1180. [Google Scholar] [CrossRef]
- Worm, B.; Barbier, E.B.; Beaumont, N.; Duffy, J.E.; Folke, C.; Halpern, B.S.; Jackson, J.C.; Lotze, H.K.; Micheli, F.; Palumbi, S.R.; et al. Impacts of biodiversity loss on ocean ecosystem services. Science 2006, 314, 787–790. [Google Scholar] [CrossRef]
- Deegan, L.A.; Johnson, D.S.; Warren, R.S.; Peterson, B.J.; Fleeger, J.W.; Fagherazzi, S.; Wollheim, W.M. Coastal eutrophication as a driver of salt marsh loss. Nature 2012, 490, 388. [Google Scholar] [CrossRef]
- Johnston, E.L.; Mayer-Pinto, M.; Crowe, T.P. Chemical contaminant effects on marine ecosystem functioning. J. Appl. Ecol. 2015, 52, 140–149. [Google Scholar] [CrossRef]
- Hewitt, J.E.; Ellis, J.I.; Thrush, S.F. Multiple stressors, nonlinear effects and the implications of climate change impacts on marine coastal ecosystems. Glob. Chang. Biol. 2016, 22, 2665–2675. [Google Scholar] [CrossRef]
- Le Moal, M.; Gascuel-Odoux, C.; Ménesguen, A.; Souchon, Y.; étrillard, C.; Levain, A.; Moatar, F.; Pannard, A.; Souchu, P.; Lefebvre, A.; et al. Eutrophication: A new wine in an old bottle? Sci. Total Environ. 2019, 651, 1–11. [Google Scholar] [CrossRef]
- Douvere, F.; Ehler, C. Ecosystem-based marine spatial management: An evolving paradigm for the management of coastal and marine places. Ocean Yearb. Online 2009, 23, 1–26. [Google Scholar] [CrossRef]
- Zeng, J.N.; Chen, Q.Z.; Huang, W.; Du, P.; Yang, H. Transformation and Development of China’s Marine Ecological Protection System-From Marine Protected Areas to Marine Ecological Red Line Areas. Acta Ecol. Sin. 2016, 36, 1–10. (In Chinese) [Google Scholar]
- Lu, W.H.; Liu, J.; Xiang, X.Q.; Song, W.L.; Mcllgorm, A.A. Comparison of marine spatial planning approaches in China: Marine functional zoning and the marine ecological red line. Mar. Policy 2015, 62, 94–101. [Google Scholar] [CrossRef]
- Zhao, P.; Lu, W.; Song, J.; Stuart, P.; Yang, H. Natural coast protection and use in China: Implications of resource protection “Redline” policies. Coast. Manag. 2016, 44, 21–35. [Google Scholar]
- Wang, C.S.; Sun, G.Y.; Dang, L.J. Identifying ecological red lines: A case study of the coast in Liaoning province. Sustainability 2015, 7, 9461–9477. [Google Scholar] [CrossRef]
- Shi, Y.S.; Li, J.Q.; Xie, M.Q. Evaluation of the ecological sensitivity and security of tidal flats in Shanghai. Ecol. Indic. 2018, 85, 729–741. [Google Scholar] [CrossRef]
- Zheng, Y.; Lan, S.R.; Chen, W.Y.; Chen, X.Y.; Xu, X.X.; Chen, Y.N.; Dong, J.W. Visual sensitivity versus ecological sensitivity: An application of GIS in urban forest park planning. Urban For. Urban Greeen. 2019, 41, 139–149. [Google Scholar] [CrossRef]
- Crowder, L.; Norse, E. Essential ecological insights for marine ecosystem-based management and marine spatial planning. Mar. Policy 2008, 32, 772–778. [Google Scholar] [CrossRef]
- Douvere, F. The importance of marine spatial planning in advancing ecosystem-based sea use management. Mar. Policy 2008, 32, 762–771. [Google Scholar] [CrossRef]
- Dunstan, P.K.; Bax, N.J.; Dambacher, J.M.; Hayes, K.R.; Hedge, P.T.; Smith, D.C.; Smith, A.D. Using ecologically or biologically significant marine areas (EBSAs) to implement marine spatial planning. Ocean Coast. Manag. 2016, 121, 116–127. [Google Scholar] [CrossRef]
- Cosme, N.; Hauschild, M.Z. Effect factors for marine eutrophication in LCIA based on species sensitivity to hypoxia. Ecol. Indic. 2016, 69, 453–462. [Google Scholar] [CrossRef]
- Trannum, H.C.; Gundersen, H.; Oug, E.; Rygg, B.; Norderhaug, K.M. Soft bottom benthos and responses to climate variation and eutrophication in Skagerrak. J. Sea Res. 2018, 141, 83–98. [Google Scholar] [CrossRef]
- Halouani, G.; Le Loc’h, F.; Shin, Y.J.; Velez, L.; Hattab, T.; Romdhane, M.S.; Lasram, F.B.R. An end-to-end model to evaluate the sensitivity of ecosystem indicators to track fishing impacts. Ecol. Indic. 2019, 98, 121–130. [Google Scholar] [CrossRef]
- Cheung, W.W.; Oyinlola, M.A. Vulnerability of flatfish and their fisheries to climate change. J. Sea Res. 2018, 140, 1–10. [Google Scholar] [CrossRef]
- Roué-Legall, A.; Lucotte, M.; Carreau, J.; Canuel, R.; Garcia, E. Development of an ecosystem sensitivity model regarding mercury levels in fish using a preference modeling methodology: Application to the Canadian boreal system. Environ. Sci. Technol. 2005, 39, 9412–9423. [Google Scholar] [CrossRef] [PubMed]
- Lathrop, R.G.; Bognar, J.; Buenaventura, E.; Ciappi, M.; Green, E.; Belton, T.J. Establishment of Marine Protected Areas to Reduce Watercraft Impacts in Barnegat Bay, New Jersey. J. Coast. Res. 2017, 78, 277–286. [Google Scholar] [CrossRef]
- García-Ayllón, S. GIS assessment of mass tourism anthropization in sensitive coastal environments: Application to a case study in the mar menor area. Sustainability 2018, 10, 1344. [Google Scholar] [CrossRef]
- Ostrom, E. A general framework for analyzing sustainability of social-ecological systems. Science 2009, 325, 419–422. [Google Scholar] [CrossRef]
- Borja, A.; Galparsoro, I.; Solaun, O.; Muxika, I.; Tello, E.M.; Uriarte, A.; Valencia, V. The European Water Framework Directive and the DPSIR, a methodological approach to assess the risk of failing to achieve good ecological status. Estuar. Coast. Shelf Sci. 2006, 66, 84–96. [Google Scholar] [CrossRef]
- Levin, P.S.; Fogarty, M.J.; Murawski, S.A.; Fluharty, D. Integrated ecosystem assessments: Developing the scientific basis for ecosystem-based management of the ocean. PLoS Biol. 2009, 7, e1000014. [Google Scholar] [CrossRef]
- Atkins, J.P.; Burdon, D.; Elliott, M.; Gregory, A.J. Management of the marine environment: Integrating ecosystem services and societal benefits with the DPSIR framework in a systems approach. Mar. Pollut. Bull. 2011, 62, 215–226. [Google Scholar] [CrossRef] [PubMed]
- Kelble, C.R.; Loomis, D.K.; Lovelace, S.; Nuttle, W.K.; Ortner, P.B.; Fletcher, P.; Cook, G.S.; Lorenz, J.J.; Boyer, J.N. The EBM-DPSER conceptual model: Integrating ecosystem services into the DPSIR framework. PLoS ONE 2013, 8, e70766. [Google Scholar] [CrossRef] [PubMed]
- Chi, Y.; Zhang, Z.W.; Gao, J.H.; Xie, Z.L.; Zhao, M.W.; Wang, E.K. Evaluating landscape ecological sensitivity of an estuarine island based on landscape pattern across temporal and spatial scales. Ecol. Indic. 2019, 101, 221–237. [Google Scholar] [CrossRef]
- Wang, C.Y.; Pan, D.L. Zoning of Hangzhou Bay ecological red line using GIS-based multi-criteria decision analysis. Ocean Coast. Manag. 2017, 139, 42–50. [Google Scholar]
- Wood, L.J.; Dragicevic, S. GIS-based multicriteria evaluation and fuzzy sets to identify priority sites for marine protection. Biodivers. Conserv. 2007, 16, 2539–2558. [Google Scholar] [CrossRef]
- Qiu, P.; Xu, S.; Xie, G.; Tang, B.; Bi, H.; Yu, L. Analysis of the ecological vulnerability of the western Hainan Island based on its landscape pattern and ecosystem sensitivity. Acta Ecol. Sin. 2007, 27, 1257–1264. [Google Scholar]
- Muñoz, M.; Reul, A.; de Sola, L.G.; Lauerburg, R.A.M.; Tello, O.; Gimpel, A.; Stelzenmüller, V. A spatial risk approach towards integrated marine spatial planning: A case study on European hake nursery areas in the North Alboran Sea. Mar. Environ. Res. 2018, 142, 190–207. [Google Scholar] [CrossRef]
- Ortiz, G.; Dominguez-Gómez, J.A.; Tur, A.; Maria Urgeghe, A. Participatory multi-criteria decision analysis for prioritizing impacts in environmental and social impact assessments. Sustain. Sci. Pract. Policy 2018, 14, 6–21. [Google Scholar] [CrossRef]
- Manea, E.; Di Carlo, D.; Depellegrin, D.; Agardy, T.; Gissi, E. Multidimensional assessment of supporting ecosystem services for marine spatial planning of the Adriatic Sea. Ecol. Indic. 2019, 101, 821–837. [Google Scholar] [CrossRef]
- Kirkman, S.P.; Holness, S.; Harris, L.R.; Sink, K.J.; Lombard, A.T.; Kainge, P.; Majiedt, P.; Nsiangango, S.E.; Nsingi, K.K.; Samaai, T. Using Systematic Conservation Planning to support Marine Spatial Planning and achieve marine protection targets in the transboundary Benguela Ecosystem. Ocean Coast. Manag. 2019, 168, 117–129. [Google Scholar] [CrossRef]
- Hiddink, J.G.; Jennings, S.; Kaiser, M.J. Assessing and predicting the relative ecological impacts of disturbance on habitats with different sensitivities. J. Appl. Ecol. 2007, 44, 405–413. [Google Scholar] [CrossRef]
- Zhang, Z.H.; Xu, J.H.; Han, G.F. Ecological sensitive area division indicator system. Ecol. Sci. 2007, 1, 17. (In Chinese) [Google Scholar]
- Gorman, D.; Corte, G.; Checon, H.H.; Amaral, A.C.Z.; Turra, A. Optimizing coastal and marine spatial planning through the use of high-resolution benthic sensitivity models. Ecol. Indic. 2017, 82, 23–31. [Google Scholar] [CrossRef]
- Conti, L.A.; Fonseca Filho, H.; Turra, A.; Amaral, A.C.Z. Building a local spatial data infrastructure (SDI) to collect, manage and deliver coastal information. Ocean Coast. Manag. 2018, 164, 136–146. [Google Scholar] [CrossRef]
- Wang, X.; Wu, F.; Turvey, S.T.; Rosso, M.; Tao, C.; Ding, X.; Zhu, Q. Social organization and distribution patterns inform conservation management of a threatened Indo-Pacific humpback dolphin population. J. Mammal. 2015, 96, 964–971. [Google Scholar] [CrossRef]
- Yu, Z.; Yu, J. Study on value assessment of rare and endangered species in marine reserve: A case of the Xiamen rare marine species national nature reserve. Chin. J. Mar. Environ. Sci. 2017, 36, 81–86. (In Chinese) [Google Scholar]
- Zhang, X.; Xue, X. Analysis of marine environmental problems in a rapidly urbanising coastal area using the DPSIR framework: A case study in Xiamen, China. J. Environ. Plan. Manag. 2013, 56, 720–742. (In Chinese) [Google Scholar] [CrossRef]
- Fang, Q.; Ma, D.; Zhang, L.; Zhu, S. Marine functional zoning: A practical approach for integrated coastal management (ICM) in Xiamen. Ocean Coast. Manag. 2018, in press. [Google Scholar] [CrossRef]
- Su, J.; Peng, B. Evaluating the trade-offs between alternative coastal policies: Evidence from Xiamen’s ICM programme. Ocean Coast. Manag. 2018, in press. [Google Scholar] [CrossRef]
- Saaty, T.L. How to make a decision: The analytic hierarchy process. Eur. J. Oper. Res. 1990, 48, 9–26. [Google Scholar] [CrossRef]
- Tran, L.T.; Knight, C.G.; O’Neill, R.V.; Smith, E.R.; Riitters, K.H.; Wickham, J. Fuzzy decision analysis for integrated environmental vulnerability assessment of the Mid-Atlantic region. Environ. Manag. 2002, 29, 845–859. [Google Scholar] [CrossRef]
- Scolozzi, R.; Morri, E.; Santolini, R. Delphi-based change assessment in ecosystem service values to support strategic spatial planning in Italian landscapes. Ecol. Indic. 2012, 21, 134–144. [Google Scholar] [CrossRef]
- Dang, G.F.; Ji, S.Z. Ecological Sensitivity Evaluation Based on GIS in Qinba Mountainous Area—A Case Study of Longnan Mountainous Area. Chin. Agric. Sci. Bull. 2017, 33, 118–127. [Google Scholar]
- Fang, S.H.; Lu, X.M. Resources and Protetion of Amphioxus (Branchiostoma belcheri) in Xiamen National Natural Reserve Area of Rare Marine Species. Mar. Sci. 2002, 26, 12. (In Chinese) [Google Scholar]
- Lin, P.; Zhang, Y.H.; Yang, Z.W. Protection and restoration of mangroves along the coast of Xiamen. J. Xiamen Univ. (Nat. Sci.) 2005, 44, 1–6. (In Chinese) [Google Scholar]
- Lin, T. Study on Coastal Ecological Safety Assessment Mode and Case Studies. Ph.D. Thesis, Xiamen University, Xiamen, China, 2007. (In Chinese). [Google Scholar]
- JiulongJiang Estuary and Xiamen Bay Ecological Integrated Governance Action Plan; Fujian Provincial Department of Environment and Ecology: Fuzhou, Fujian, January 2019. (In Chinese)
- Guo, Q. XiaTanwei in Tong’an Bay will become the largest mangrove area in Xiamen. Xiamen Net News, March 2018. (In Chinese) [Google Scholar]


| Target Level | Criterion Level | Factor Level | Indicator level | Source of Data |
|---|---|---|---|---|
| Ecosystem sensitivity of Xiamen Bay A1 | Endogenous sensitivity B1 | Distribution areas of typical habitats and important species C1 | Mangrove D1 | Interpretation of satellite remote sensing images of 2014 |
| Waterfowl habitat D2 | Field survey in the winters of 2013–2014 | |||
| Chinese White Dolphin habitat D3 | Field survey in December of 2010–2014 | |||
| Amphioxus habitat D4 | Field survey in September 2015 | |||
| Sandy beach D5 | Interpretation of satellite remote sensing images of 2014 | |||
| Marine biome C2 | Chlorophyll a content D6 | Field survey from 2012 to 2015 | ||
| Biodiversity index of phytoplankton D7 | Field survey from 2012 to 2015 | |||
| Biodiversity index of zooplankton D8 | Field survey from 2012 to 2015 | |||
| Biodiversity index of benthos D9 | Field survey from 2012 to 2015 | |||
| Biodiversity index of nekton D10 | Field survey from 2012 to 2015 | |||
| Exogenous sensitivity B2 | Hazard and risk C3 | Annual frequency of red tide D11 | The Xiamen Marine Environment Bulletin reports of 2005–2014 | |
| Invasive species D12 | Interpretation of satellite remote sensing images of 2014 | |||
| Sea-use activities C4 | Mariculture D13 | Interpretation of satellite remote sensing images of 2014 | ||
| Reclamation D14 | Interpretation of satellite remote sensing images of 2014, and Fujian Marine Functional Zoning (2011–2020) | |||
| Channel and harbor D15 | Fujian Marine Functional Zoning (2011–2020) | |||
| Environmental quality C5 | Petroleum in water D16 | The trend monitoring report on marine environment in coastal waters of Xiamen in 2016 | ||
| Organic pollution in water D17 | The trend monitoring report on marine environment in coastal waters of Xiamen in 2016 | |||
| Inorganic nitrogen in water D18 | The trend monitoring report on marine environment in coastal waters of Xiamen in 2016 | |||
| Active phosphate in water D19 | The trend monitoring report on marine environment in coastal waters of Xiamen in 2016 | |||
| Organic carbon in sediment D20 | The trend monitoring report on marine environment in coastal waters of Xiamen in 2016 | |||
| Sulfides in sediment D21 | The trend monitoring report on marine environment in coastal waters of Xiamen in 2016 | |||
| Polychlorinated biphenyls in sediment D22 | The trend monitoring report on marine environment in coastal waters of Xiamen in 2016 | |||
| Heavy metals in sediment D23 | The trend monitoring report on marine environment in coastal waters of Xiamen in 2016 | |||
| Petroleum in sediment D24 | The trend monitoring report on marine environment in coastal waters of Xiamen in 2016 | |||
| Heavy metals in organisms D25 | The Xiamen Marine Environment Bulletin reports of 2014–2015 | |||
| Petroleum in organisms D26 | The Xiamen Marine Environment Bulletin reports of 2014–2015 |
| Indicators | Standardization Method | Spatial Analysis Method | |
|---|---|---|---|
| Type I | C2, C5 | Quantitative method | Kriging interpolation method |
| C1(D3 and D4) | Quantitative method | Kernel density analyst | |
| Type II | C1(D1, D2 and D5) | Qualitative scoring method | 0/1 (absence/presence) |
| C3, C4 | Qualitative scoring method | Inverse distance weighted method | |
| Sensitivity Levels | Break Points | Area (km2) | Proportion |
|---|---|---|---|
| Extremely high | ≥5.7 | 87 | 7.5% |
| High | [4.8, 5.7) | 235 | 20.3% |
| Medium | [4.3, 4.8) | 395 | 34.1% |
| Low | [3.7, 4.3) | 298 | 25.7% |
| Extremely low | <3.7 | 143 | 12.3% |
© 2019 by the authors. Licensee MDPI, Basel, Switzerland. This article is an open access article distributed under the terms and conditions of the Creative Commons Attribution (CC BY) license (http://creativecommons.org/licenses/by/4.0/).
Share and Cite
Hu, W.; Yu, W.; Ma, Z.; Ye, G.; Dang, E.; Huang, H.; Zhang, D.; Chen, B. Assessing the Ecological Sensitivity of Coastal Marine Ecosystems: A Case Study in Xiamen Bay, China. Sustainability 2019, 11, 6372. https://doi.org/10.3390/su11226372
Hu W, Yu W, Ma Z, Ye G, Dang E, Huang H, Zhang D, Chen B. Assessing the Ecological Sensitivity of Coastal Marine Ecosystems: A Case Study in Xiamen Bay, China. Sustainability. 2019; 11(22):6372. https://doi.org/10.3390/su11226372
Chicago/Turabian StyleHu, Wenjia, Weiwei Yu, Zhiyuan Ma, Guanqiong Ye, Ersha Dang, Hao Huang, Dian Zhang, and Bin Chen. 2019. "Assessing the Ecological Sensitivity of Coastal Marine Ecosystems: A Case Study in Xiamen Bay, China" Sustainability 11, no. 22: 6372. https://doi.org/10.3390/su11226372
APA StyleHu, W., Yu, W., Ma, Z., Ye, G., Dang, E., Huang, H., Zhang, D., & Chen, B. (2019). Assessing the Ecological Sensitivity of Coastal Marine Ecosystems: A Case Study in Xiamen Bay, China. Sustainability, 11(22), 6372. https://doi.org/10.3390/su11226372