Abstract
The previous literature on the resource curse has not taken resource price fluctuations into account. Using panel data covering the period from 1993 to 2017 from 28 provinces in China and dynamic generalized method of moments (GMM), this article takes a fresh look at the relationship between resource dependence and sustainable economic growth and the potential transmission mechanisms taking resource price fluctuations into consideration. We find that resource price fluctuations represent an important factor when researching the resource curse, and there is a U-shaped relationship between resource dependence and sustainable economic growth. However, over the past 20 years, provinces in China remained on the left of the U-shaped curve, and there is a single negative correlation between resource dependence and sustainable economic growth. This means that resource curse occurs in nearly all provinces in China. The analysis of transmission mechanisms of indirect effects taking resource price fluctuations into consideration shows that human capital investment and physical capital investment are more important than other mechanisms, and there are considerably more indirect effects than direct effects when taking into account the total effects of the resource curse.
1. Introduction
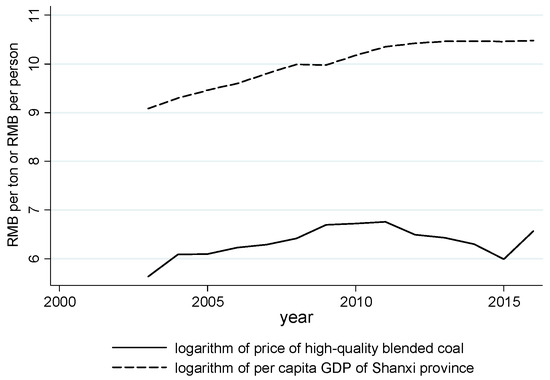
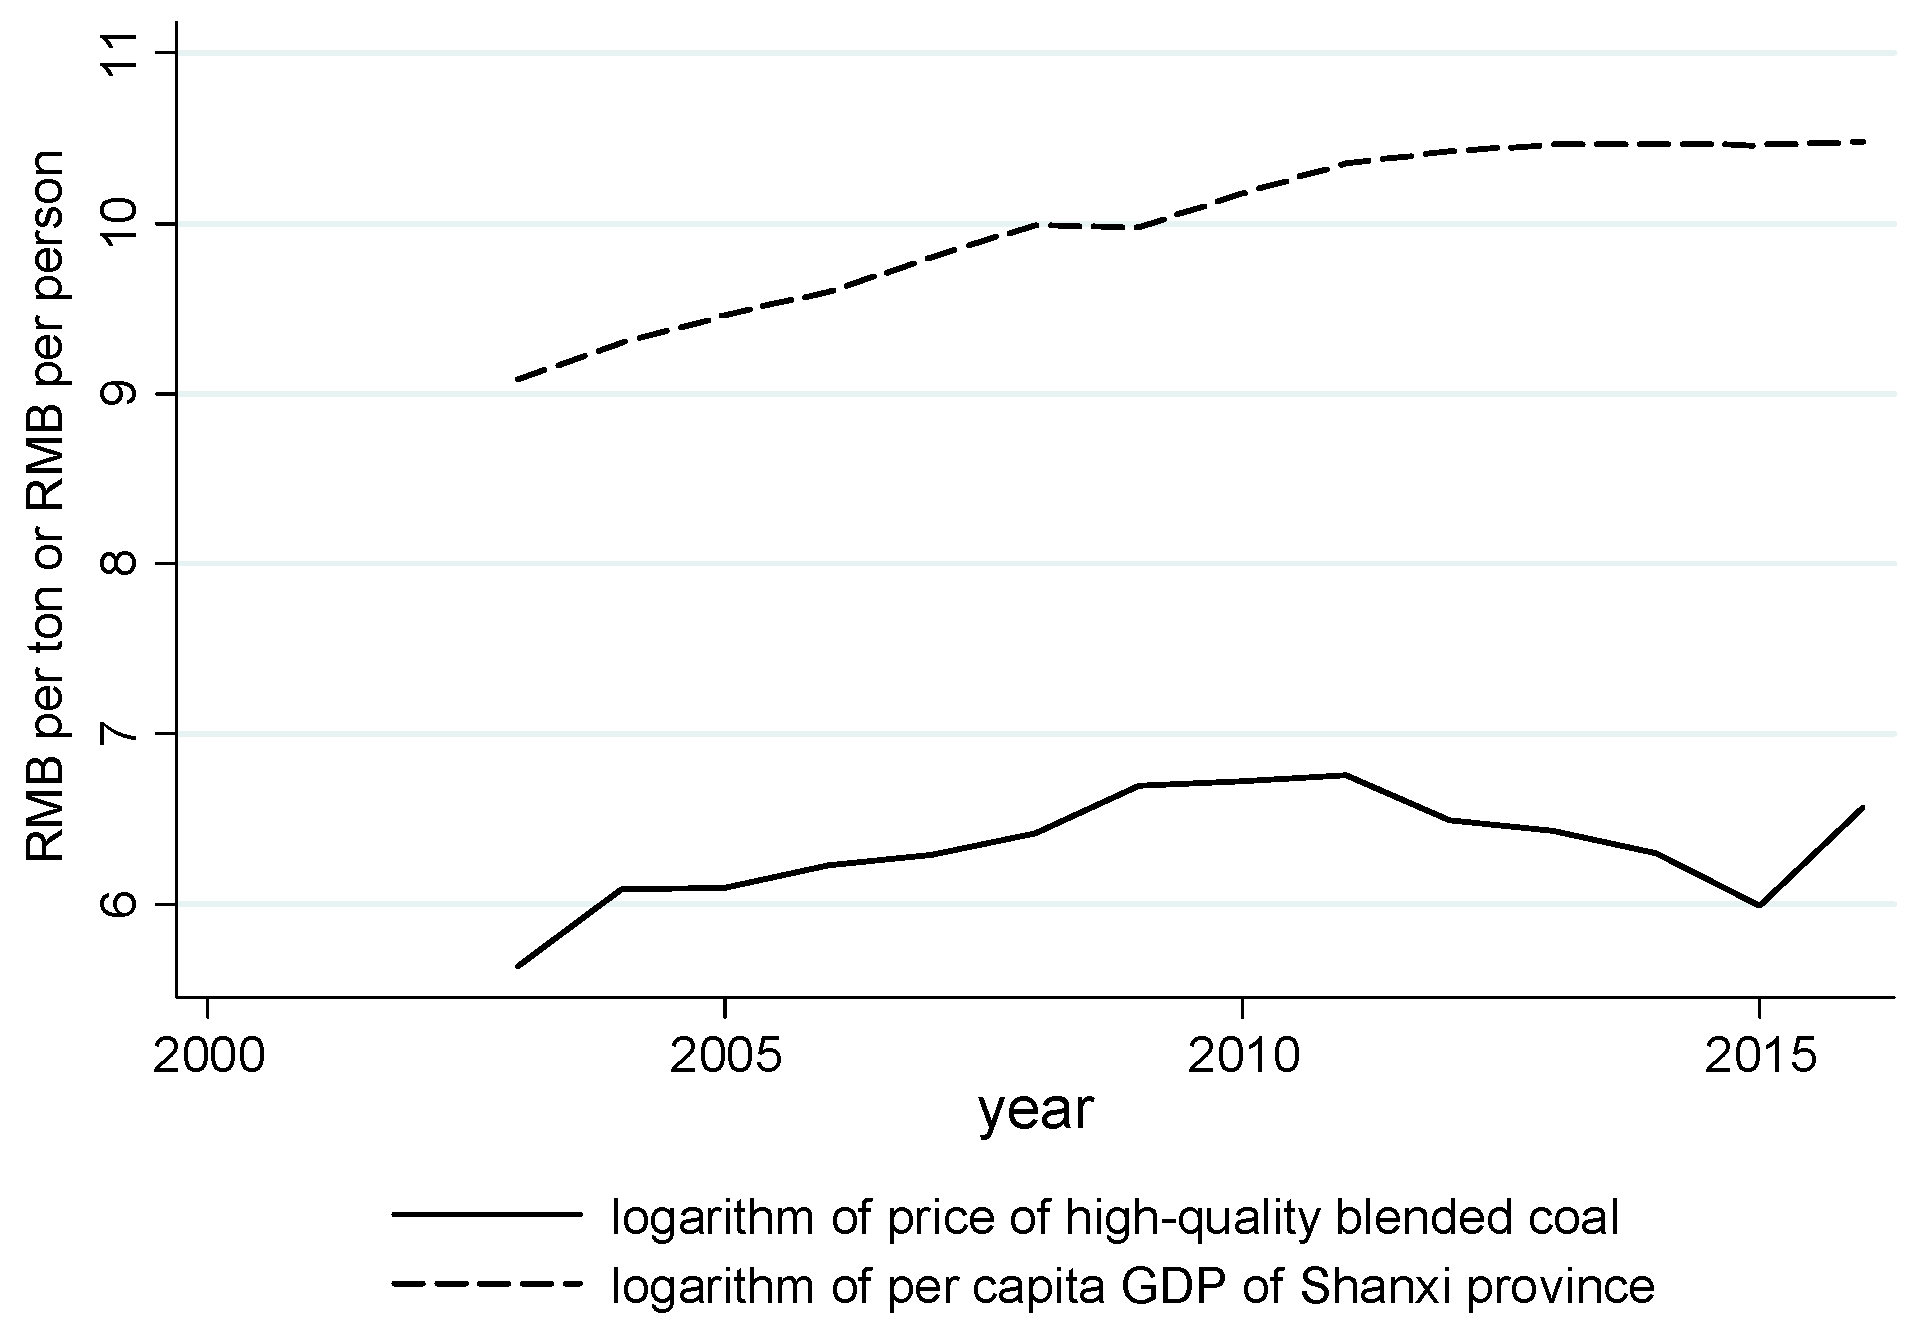
The resource curse hypothesis posits that a negative correlation exists between the resource dependence and sustainable growth in an economy. Many studies have tested the theory of the resource curse. However, scholars have not taken resource price fluctuations into consideration [1,2,3,4,5,6], with the exception of Douglas and Walker [7]. Actually, in resource-rich areas, the resource industry makes up a large portion of the national economy, and resource price fluctuations exert a greater influence on local economic growth. In a global economic boom, resource demand increases rapidly, leading to a gradual growth in resource prices and resource industry investments, which then promotes rapid economic growth in resource-rich areas. Meanwhile, in a global economic recession, resource demand shrinks, leading to a fall in resource prices and resource industry investments, which leads to a decline in economic growth. Consider the coal industry (China’s most important energy resource) as an example. Figure 1 displays the correlation between the fluctuation of coal prices (nominal prices) and gross domestic product (GDP) per capita in nominal value in Shanxi province, which is rich in coal resources. Qinhuangdao Port is currently the largest coal market in China, and its trading information is the heart of the national coal trade market, while high-quality blended coal produced in Datong city is the major trade product in Qinhuangdao Port. Therefore, this paper selects the price of Datong’s high-quality blended coal in Qinhuangdao Port as the standard of coal price and uses its natural logarithm to study the correlation between the fluctuation of coal price and economic growth in Shanxi province.
Figure 1.
Correlation between coal price fluctuation and economic growth in Shanxi province.
As shown in Figure 1, the coal price in most years is positively correlated with economic growth in Shanxi province, and the correlation coefficient of these two variables is 0.79. From the above analysis, it is shown that there may be a positive correlation between resource price and economic growth. Therefore, when studying the theory of the resource curse, if we do not take resource price fluctuations into consideration, biased errors may occur in the regression results owing to the omission of key explanatory variables. It should be noted that although Shanxi is one of the major energy provinces in China, it cannot represent the whole situation in China. However, Figure 1 can be used as a preliminary illustration of the potential relationship between resource price fluctuations and economic growth. Based on a panel data of provinces in China, this article studies the resource curse taking resource price fluctuations into consideration.
2. Literature Review
The study of the correlation between natural resources and economic growth has become a hot research topic since the publication of papers by Sachs and Warner [1]. Sachs and Warner published a series of papers demonstrating the existence of the natural resource curse and posited that in previous decades the role of natural resources in a country was negatively correlated to its economic growth rate [2,3,4]. These findings triggered a lively discussion about the cause of the resource curse among scholars. Atkinson and Hamilton [8] held that the inefficient use of resource rent and waste of economic resources in resource-rich countries usually led to the resource curse. Deller and Schreiber [9] found that non-oil and gas mining had a positive impact on per capita income for nonmetropolitan U.S. counties for the period 2000–2007. Deller [10] found that higher dependency on non-oil and gas mining was associated with higher rates of U.S. rural income growth over the years 2000–2011. Sarmidi et al. [11] indicated that poor institutional arrangements were an important reason for the negative effects of natural resource endowments on economic growth. Betz et al. [12] did not find strong evidence of a resources curse in the United States, except that coal mining had a negative association with population growth and entrepreneurship. Perez-Sebastian and Raveh [13] found that whether natural resource abundance is a blessing or a curse depends on the degree of fiscal decentralization. Kim and Lin [14] found that countries with scarce resources tended to develop more quickly than resource-based economies. Badeeb et al. [15] provided a critical literature survey about the mechanisms through which resource abundance might influence economic growth. Douglas and Walker [7] found the increase in resource dependence was associated with the drop in annual growth rates of per capita personal income in the eastern United States. Song et al. [5] found that the location of industrial sectors in China was affected by coal abundance, and low coal-consuming industries prefer to be located away from resource-abundant areas, supporting the “Dutch Disease” hypothesis. Marchand and Weber [16] synthesized the literature linking natural resources to local labor markets by organizing existing studies according to their resource measurement and the outcomes that they consider. Zhang and Brouwer [17] analyzed 44 studies published in Chinese between 2005 and 2017, and found that the existence of the resource curse was ambiguous in China. Lu et al. [6] found that the resource curse effect is strongest for a resource-dependent city during an economic recession, less severe during a development period, and weakest during maturation with a case study of Qingyang, Jinchang, and Baiyin in China.
As research continued, some scholars began to doubt the research conducted by Sachs. For example, Ploeg and Poelhekke [18] deemed that there might be endogeneity in the research of Sachs and Warner [1] and proposed that the high portion of primary commodity exports is probably the result, rather than the cause, of slow economic growth. Brunschweiller and Bulte [19] further suggested that the export share of natural resources merely accounts for resource dependence and cannot measure resources abundance, and the latter should be adopted in the study of resource curse.
Although many studies on the theory of the resource curse were conducted from different perspectives, and fruitful research achievements were achieved, there still have been problems and difficulties in current studies.
Firstly, the existing literature did not consider the impact of resource price fluctuations. As mentioned before, there may be a positive correlation between the resource price and economic growth, and thus, the impact of resource price fluctuations should be taken into account in the study of the resource curse. However, nearly all the existing literature has overlooked resource price fluctuations, and biased error is likely to have occurred in the regression results owing to the omission of a key explanatory variable.
Secondly, endogeneity problems related to the resource dependence indicator remain unresolved. Restricted by data availability, the index of resource dependence, which is easily quantified, is still used in the majority of studies. However, the reliability of the results may be questioned since many studies did not solve the endogeneity problems brought about by this indicator when adopting this measurement mode.
Finally, is there an inverted U-shaped correlation between resource dependence and economic growth? Previous studies [2,3,4,14] on the resource curse demonstrated that there was a simple linear negative correlation between resource dependence and economic growth, but recently, some scholars [11,20,21] found that there may be an inverted U-shaped correlation between resource dependence and economic growth. Considering the resource price fluctuations and the endogeneity induced by the resource dependence indicator, this article discusses whether there is an inverted U-shaped correlation, a U-shaped correlation, or other correlations between resource dependence and economic growth.
3. Econometric Tests
3.1. Model Specification and Variable Declaration
In response to the problems and controversies in the existing studies, this article modified the regression model proposed by Sachs and Warner [1] by adding resource prices as well as the quadratic term and cubic term of resource dependence while taking into consideration the dynamic features of economic growth. It specifies the following dynamic regression model of panel data:
In this model, Y refers to per capita real GDP, taking its natural logarithm; L refers to resource dependence, with L2 and L3 being its quadratic term and cubic term, respectively; P represents the growth rate of the resource price; X is the vector consisting of other explanatory variables that impact economic growth; i refers to provinces and t years; α0~α6 refer to parameters to be estimated; vi represents the influencing factors specific to each province; and εit is the random perturbed variable.
The correlation between resource dependence and economic growth can be estimated by symbols of α2, α3, and α4 in Equation (1):
When α2 > 0, α3 < 0, α4 = 0, there is an inverted U-shaped correlation between resource dependence and economic growth; that is, when resource dependence is lower than the threshold value, the increase of resource dependence promotes economic growth and the resource is a blessing rather than curse, and when resource dependence is too high, higher than the threshold value, the resource curse appears. When α2 < 0, α3 > 0, α4 = 0, there is a U-shaped correlation between resource dependence and economic growth; that is, when resource dependence is lower than the threshold value, the increase of resource dependence inhibits economic growth, and once it crosses the threshold value, its increase promotes economic growth. When α2 > 0, α3 < 0, α4 > 0, there is a complicated N-shaped relationship between resource dependence and economic growth.
The measurement index of natural resource mainly includes the output of raw coal, crude oil, natural gas and fixed asset investment in the mining industry sector. The measurement of resource abundance is an important problem in empirical research. Scholars have introduced a lot of substitution variables, such as the proportion of primary sector exports in GDP [1,22], the proportion of employment in the primary sector [23], the amount of arable land per capita [24], the energy reserves [25] and the proportion of resource rents in GDP [26]. In this article, the ratio of mining industry employment in total employment is selected as an indicator to measure resource dependence, because greater extraction requires a larger resource sector. As indicated by Marchand and Weber [16], it also increases as the non-resource economy shrinks, such as greater competition from imports, and the multiple sources of variation in this measure complicate its interpretation. However, compared with the indicators related to GDP, such as the proportion of primary sector exports in GDP or the proportion of resource rents in GDP, the measurement we select can alleviate endogeneity [27]. In addition, according to the standard of industry statistics published by the State Statistics Bureau, the mining industry includes ferrous and nonferrous metals mining and dressing industry, coal mining and dressing industry, petroleum and natural gas extracting industry, mining and processing of nonmetal minerals, and so on. It encompasses resources and other related preliminary departments. Therefore, this indicator can approximately measure resource dependence.
As for resource prices, so far there are no integrated indicators that can be used to describe resource price fluctuations. Nonetheless, Kellard and Wohar [28] noted that the producer price index of raw materials is highly correlated to the price index of mining products. Therefore, in this article, the resource price is measured by the purchase price of fuel, raw materials and power, and the growth rate is calculated by the purchase price index of fuel, raw materials and power in the statistics yearbook.
Based on the theory of economic growth, we chose the explanatory variables in the vectors X as follows. Firstly, there is physical capital investment (K). Similar to most studies, the GDP share of the total fixed asset investment is used to measure physical capital investment in this article, and clearly, the higher the physical capital investment, the faster the economy grows, and thus, the expected coefficient is positive. Secondly, there is human capital investment (EDU). Human capital investment is measured by the number of college students per 10,000 population in the statistical yearbook, and the expected coefficient is positive. Thirdly, there is the degree of opening up (OPE). The proportion of total volume of imports and exports in GDP is used in this article to measure the degree of opening up, and the total volume of imports and exports is converted into RMB yuan according to the average exchange rate in the same year, and we expect the regression coefficient to be positive. Fourthly, there is innovation input (RD). The share of researchers’ employment in the total employment is used to measure innovation input, and the expected relation is positive. Based on previous studies, resource dependence not only affects economic growth directly, but also indirectly influences economic growth through the four control variables mentioned above: physical capital investment, human capital investment, degree of opening up, and innovation input. Therefore, the above four variables will also be used when analyzing the transmission mechanism of resource curse hereinafter. Therefore, the ultimate regression model used in this article is as follows:
3.2. Data Sample
Constrained by data availability and with consideration to data consistency, the research period of this article ranges from 1993 to 2017. Tibet and Hainan provinces are beyond the scope of this research due to missing data, and the data from the Chongqing Municipality are merged into those of Sichuan province since Chongqing Municipality separated from Sichuan province in 1997. Overall, panel data from 28 provinces in China from 1993 to 2017 are used in this article. Related data are from the China Statistical Yearbook, China Compendium of Statistics, China Statistical Yearbook for Regional Economy, China Price Statistical Yearbook, and China Labor Statistical Yearbook. The per capita GDP in this paper is deflated to actual value in 1992. In this study, the analysis is conducted by the Stata12.0 and the definition and descriptive statistics of each variable are shown in Table 1.
Table 1.
Variables declaration and descriptive statistic.
3.3. Estimation Methods
As mentioned above, existing studies have not considered endogeneity problems brought about by these indicators when adopting indicators related to resource dependence, which leads to a low reliability of the regression results. In this article, besides resource dependence, the lagged indices of explained variables in the dynamic regression model may also bring about endogeneity problems, and under this condition, if estimation is conducted using regression methods of the ordinary panel model, the results are not likely to satisfy the principles of non-bias and uniformity. Arellano and Bond [29] and Arellano and Bover [30] suggested the use of the generalized method of moments (GMM) to solve these problems. Therefore, dynamic panel GMM is adopted in this article to conduct the regression analysis. In the regression course, the lagged explained variables and resource dependence are considered as endogenous variables, and all the other explanatory variables are strictly regarded as exogenous variables.
Essentially, in the analysis process using dynamic GMM, the lagged values of explanatory variables are used as instrumental variables to replace the former variables in the regression, and thus, the usefulness of the estimated results lies on the effectiveness of the instrumental variables. This article offers two methods. The first one is to judge the effectiveness of over-identified constraints of instrumental variables by employing the Hansen test. If the null hypothesis cannot be rejected, it means that the selection of the instrumental variables is reasonable. The second one is to examine whether there is a second-order autocorrelation for residual terms, and if the null hypothesis cannot be rejected, it shows that there is no autocorrelation and that GMM estimation can be conducted.
3.4. Econometric Results and Analysis
Equation (2) is estimated using dynamic GMM estimation, and the results are shown in Table 2 and Table 3. First, the form of model specification is examined. Models 1, 2, 5, and 6 in Table 2 and Table 3 include both the quadratic term and cubic term of resource dependence in order to test whether there is a N-shaped or other correlation between resource dependence and economic growth. Models 3, 4, 7, and 8 include the quadratic term of resource dependence in order to test whether there is an inverted U-shaped or U-shaped correlation between resource dependence and economic growth. Then, in order to test that the resource price fluctuations are important explanatory variables in the research of resource curse, this article performs econometric regression taking resource price fluctuations into consideration and not, respectively.
Table 2.
Test results of resource curse effects without resource price fluctuations.
Table 3.
Test results of resource curse effects with resource price fluctuations. GMM: generalized method of moments.
In Table 2 and Table 3, model 1–4 are estimated results without resource price fluctuations and model 5–8 are estimated results with resource price fluctuations. Lastly, the GMM estimations include system GMM estimation and differential GMM estimation, and since the preconditions of the two estimations are different, their applications vary. To obtain the most accurate estimated results, this article used system GMM estimation and differential GMM estimation, respectively, in each specification form.
Table 2 and Table 3 show that the results of the Hansen test in all models are not significant, which indicates the effectiveness of instrumental variables. By comparing the estimation results of models 1–4 and models 5–8, it can be found that there is a second order autocorrelation for the residuals in models 1–4 at 5% level when the resource price is not included as an explanatory variable. This may be attributed to an inappropriate model selection, the omission of key explanatory variables. It may also suggest that the preconditions of GMM estimation are not met. However, taking the resource price into consideration, models 5–8 accept the null hypothesis of “no autocorrelations for disturbance terms” and the coefficients of resource price are all significant at 1% level, which shows that the autocorrelations in models 1–4 are caused by the omission of key explanatory variables. This further demonstrates that resource price is indeed an important influencing factor in the research of resource curse, and biased errors are likely to occur in the estimation results if it is neglected. In addition, the results of Table 2 and Table 3 also reveal that all the coefficients of cubic terms of resource dependence in models 1, 2, 5, and 6 are all insignificant, that is, there is no N-shaped correlation or other correlations between resource dependence and economic growth, whether taking the resource price fluctuations into consideration or whether adopting system GMM or differential GMM.
In conclusion, this article will focus on the analysis of models including the resource prices and quadratic terms of resource dependence and perform estimation with system GMM and differential GMM, respectively. The results are shown in model 7 and model 8. In model 7, although the coefficient of OPE is positive, it is insignificant at the 10% level. Furthermore, the coefficient of innovation input (RD) is negative, which is inconsistent with general economic theory. By contrast, in model 8, the coefficients of control variables, such as physical capital investment and human capital investment are all positive at the 1% level, which indicates that differential GMM is a better estimation method. Therefore, the results in model 8 are referenced and discussed in this article.
In model 8, the coefficient of resource dependence L is less than 0 and is insignificant at 5% level, and its quadratic term is greater than 0 and is significant at the 10% level, which shows that there is a U-shaped correlation between resource dependence and economic growth. This means that when the resource dependence is below the critical value, an increase in resource dependence will inhibit economic growth, and once it is over the critical value, instead, its increase will promote economic growth. The coefficient of resource price P is greater than 0 and is significant at 1% level, suggesting that the increase of resource price can promote economic growth, which supports the empirical analysis above. The coefficients of controlled variables, such as physical capital investment, human capital investment, the degree of opening-up and the innovation input, are all greater than 0 and are significant at 1% level, which is in line with general economic growth theory. In addition, the coefficients of lagged explained variables in models 1–8 are all greater than 0 and are significant at the 1% level, which is in favor of the specification of the dynamic model.
Further analysis shows that the majority of 28 provinces in China used in this study are on the left of the U-shaped curve. The inflection point calculated by resource dependence and the coefficient of its quadratic term is 7.5287%, that is, when the ratio of the extractive industry employment in the total employment is below 7.5287%, the increase of resource dependence will suppress economic growth, and the resource curse occurs. When the ratio is over 7.5287%, the increase in resource dependence will promote economic growth, and a resource blessing occurs. However, in this article, the resource dependence of all the other provinces in this sample period, except Heilongjiang province before the year of 1997, did not reach the inflection point, which means that although in theory there is a U-shaped relation between resource dependence and economic growth, there is a single negative relationship between them on the whole in the past two decades in China. This is consistent with previous literature [2,3,4,14,31,32]. Resource dependence is a potential cause of China’s unbalanced economic development. Abundant natural resources can lead to “Dutch disease” in Chinese provinces, as well as capital outflow, declining system quality, and insufficient motivation for people to receive education and innovation. In addition, the quality of institution is also one of the important reasons for resource curse, and the cause of low quality of institution is rent-seeking. Rent-seeking behavior caused by the abundance of natural resources will hinder economic growth in Chinese provinces as well.
Therefore, to more accurately estimate the correlation between resource dependence and economic growth in each province in the sample period and estimate the direct effects and total effects of the resource curse, a regression is conducted on the model without the quadratic term of resource dependence, and the results are shown in model 9 and model 10. In model 9, the coefficient of OPE is still insignificant, and the coefficient of RD remains negative, which indicates that the system GMM is not applied in this model. In model 10, the coefficients of each variable are significant and are in line with the expected ones, which prove once again that the differential GMM is a better estimation method. In the result of model 10, the coefficient of resource dependence is negative and is significant at 1% level, which suggests that the resource curse indeed existed in the provinces of China in the past two decades and that the dependency on natural resources clearly inhibited economic growth. Specifically, economic growth decreases 0.001% when resource dependence rises 1%. In addition, according to what Papyrakis and Gerlagh [31] have discussed, the coefficient of resource dependence in model 10 is the estimation of the direct effects of resource curse.
4. Indirect Effects and Total Effects Analysis of Resource Curse
4.1. Indirect Effects Estimation
Papyrakis and Gerlagh [31] distinguished the total effects of the resource curse between direct effects and indirect effects when studying the resource curse in regions of the United States and found that resource dependence can exert indirect negative effects on economic growth through physical capital investment, human capital investment and so on. Nevertheless, similar to other scholars, they did not take the impact of resource price fluctuations into consideration. In this article, the econometric model created by Papyrakis and Gerlagh is improved by adding the variable of resource price (see Equation (3)). This allows us to study the correlation between resource dependence and the variables of each transmission mechanism with taking resource price fluctuations into consideration:
Z represents a vector composed of transmission mechanisms variables, including physical capital investment (K), human capital investment (EDU), the degree of opening up (OPE), and innovation input (RD); L and P have the same meaning as in Equation (2), representing resource dependence and growth rate of resource price, respectively; i and t refer to provinces and year, respectively; β0~β3 are parameters to be estimated; and δit is the random disturbance term.
The dynamic GMM is still used to perform regression, and the results are shown in Table 4. We perform regressions with taking resource price fluctuations into consideration and not, respectively, to analyze the differences between them. Specifically, estimations of transmission mechanism omitting resource price fluctuations are listed in models 1, 3, 5, and 7, and estimations of the transmission mechanism taking resource price fluctuations into consideration are listed in models 2, 4, 6, and 8. In Table 4, the results of the Hansen test in all models are insignificant, which indicates that the selection of instrumental variables is effective and there is no second order autocorrelation between residual terms; therefore, the GMM estimation is appropriate. Moreover, the coefficients of lagged explained variables in models 1–8 are all greater than 0 and are significant at 1% level, which is in favor of the specification of dynamic model.
Table 4.
Results of transmission mechanism estimation.
The econometric results show that whether resource price fluctuations are taken into consideration or not, there is a negative correction at 1% level between resource dependence and the four transmission mechanisms (that is, the physical capital investment, human capital investment, the degree of opening up and innovation input) investigated in this article. This illustrates that an increase in resource dependence will crowd out the fixed-asset investment and human capital input, decrease the degree of opening-up of a regional economy and lower innovation input.
The higher the resource dependence, the lower the fixed asset investment. This is because local residents can get a substantial amount of resource income and therefore do not have a strong tendency to save or invest. Gylfason and Zoega [33] have noted in their research that resource dependence is negatively correlated to the optimal saving rate. Furthermore, compared with industrial products, the prices of resource products are volatile, which may increase economic fluctuation in resource-dependent regions, increase the risk and uncertainty for investors and thereby decrease the level of investment further. The increase of resource dependence will crowd out human capital investment and innovation input, since the demands of a resource department for high-skilled labor and technical innovation are low. Due to the low import demand of a resource department, resource dependence will also decrease the degree of opening-up, and yet in regions with high resource dependence, the small scale of the manufacturing industry also leads to low total trade volume.
Comparing the transmission mechanisms of each variable with taking resource price fluctuations into consideration and not respectively, it can be found that omitting resource price fluctuations will affect the accuracy of the estimation of transmission mechanisms. Specifically, for physical capital investment and innovation input, when considering resource price, the absolute value of the coefficient of resource dependence will decrease, suggesting that ignoring the resource price fluctuations will overestimate the impact of transmission mechanism. For human capital investment and the degree of opening-up, the absolute value of the coefficient of resource dependence will increase, indicating that ignoring the resource price fluctuations will underestimate the impact of transmission mechanisms. The fluctuation of resource price will also have an impact on the four variables of transmission mechanisms, as models 2, 4, 6, and 8 illustrate that the increase of resource price will inhibit physical capital investment, promote human capital investment and innovation input, and expand the level of opening to the outside world.
Combined with the estimated results in Table 2, Table 3, and Table 4, the indirect effects of each transmission mechanism can be estimated, and the results are shown in Table 5.
Table 5.
Indirect effects of four transmission mechanisms.
The second column in Table 5 is coefficient estimates of the corresponding variables of model 10 in Table 3; the third column in Table 5 is the coefficient estimates of resource dependence of models 2, 4, 6, and 8 in Table 2 and Table 3. Multiplying figures in the two columns, we get the indirect effects of resource dependence through the four transmission mechanisms, and the results show that resource dependence has negative indirect effects through the four transmission mechanisms: physical capital investment, human capital investment, the degree of opening up, and innovation input. Specifically, the main contributor is human capital investment (51.2%), and the next is physical capital investment (36.6%), the degree of opening-up (2.4%), and innovation input (9.8%). For this reason, in highly resource dependent regions, the local government should firstly increase financial investment in various types of education and formulate industrial policies to attract high-level talents, so as to improve the level of human capital in the region. Secondly, the local government should optimize the industrial structure and increase the proportion of manufacturing in the economy. Finally, the enterprises should introduce advanced technologies positively and improve the efficiency of “industry-university-research” cooperation to avoid the resource curse.
4.2. Total Effects of Resource Curse
The combination of direct effects and indirect effects of the resource curse are the total effects. model 10 in Table 3 shows the direct effect is −0.001, and the Table 5 shows the indirect effect is −0.0041, and the combined total effects are -0.0051, that is, the economic growth rate will decrease by approximately 0.51% under the resource curse through direct and indirect mechanisms when resource dependence rises by 1%. In addition, the indirect effect is much higher than the direct effect. The contribution of the former and the latter is 80.4% and 19.6%, respectively.
5. Conclusions
Traditional studies on the resource curse did not take the effects of resource price fluctuations into consideration and neglected endogeneity related to resource dependence. Based on panel data of provinces in China, this article, by establishing a regression model and using dynamic GMM estimation, takes a fresh look at the resource curse taking the resource price into account. We demonstrate that resource price fluctuations are indeed an important influencing factor. Neglecting resource price fluctuations will decrease the reliability of research results.
Taking resource price fluctuations into consideration, the study found that there is a U-shaped correlation between resource dependence and economic growth. We find the inflection point of resource dependence, which is measured by employment share of mining industries in employment, to be 7.5287%. Before reaching the inflection point, the increase in resource dependence restrains economic growth, and the resource curse occurs. However, when the increase in resource dependence is over the inflection point, it will promote economic growth, and resource blessing occurs. In the past two decades, provinces in China have all remained in the left of the U-shaped curve, which implies that there has been a single negative correlation between resource dependence and economic growth. In a word, resource curse occurs in all provinces in China, or Chinese economy is affected by the resource curse as a whole.
An analysis of the transmission mechanisms with taking resource price fluctuations into consideration shows that resource dependence has negative effects on four transmission mechanisms. It means that resource dependence will affect economic growth indirectly by crowding out the physical capital investment and human capital investment, decreasing the degree of opening-up and lowering innovation input. Moreover, neglecting resource price fluctuations will also affect the accuracy of the estimation of transmission mechanisms. Specifically, for physical capital investment and innovation input, when considering resource price, the absolute value of the coefficient of resource dependence will decrease, suggesting that ignoring the resource price fluctuations will overestimate the impact of transmission mechanism. For human capital investment and the degree of opening-up, when considering resource price, the absolute value of the coefficient of resource dependence will increase, indicating that ignoring the resource price fluctuations will underestimate the impact of transmission mechanisms. In addition, the resource price fluctuations have an impact on the four variables of transmission mechanisms as well. The increase of resource price will inhibit physical capital investment, promote human capital investment and innovation input, and expand the level of opening up.
As a final conclusion, we estimate the indirect effects of each transmission mechanism and the total effects of resource curse, and we find that human capital investment and physical capital investment are major transmission mechanisms of indirect effects and that indirect effects are considerably higher than direct effects in the total effects of resource curse. This indicates that the key of getting rid of the resource curse is eliminating the indirect effects.
The results in this article indicate that the resource price is indeed an important influencing factor when researching the resource curse and that an increase in resource price will promote economic growth to a certain degree. Nevertheless, the resource price could not keep rising all the time due to the business cycle, so the promotion is limited. In addition, the study of Koren and Tenreyro [34] has shown that resource price fluctuates substantially, which is harmful to long-term economic growth in resource dependent regions. Given this, this article proposes two major policy recommendations.
Firstly, the energy consumption structure should be diversified. Overdependence on traditional energy, such as petroleum, gas, and coal, threatens economic stability. When there is a large shift in resource price, the regional economy will be affected substantially. Therefore, measures should be taken to promote diversification of energy consumption structures and relevant policies should be made to support the exploitation and utility of new energy sources, such as solar energy, nuclear energy, and wind energy.
Secondly, the manufacturing industry in resource-dependent regions should be developed. In those regions, local government should set up development funds to promote the development of manufacturing industries and alleviate the impact of resource price fluctuations on the economy.
Although we have analyzed four transmission mechanisms of resource curse taking resource price fluctuations into consideration, we do not consider the policy factor, which is important in China because the strategy of resource development is controlled by the government. We leave this extension for future work.
Author Contributions
Conceptualization, H.W. and S.W.; methodology, S.W.; software, C.-F.Y.; formal analysis, S.-N.J. and Y.-J.L.; writing—original draft preparation, S.W. and C.-F.Y.; writing—review and editing, H.W. and S.-N.J.; funding acquisition, S.W.
Funding
This research was funded by Projects of Social Science Foundation of Xi’an, grant number 19J129; Scientific Research Program Funded by Shaanxi Provincial Education Department, grant number 19JK0701; Research Funds of Xi’an International Studies University, grant number 19XWD14; and the Key Project of the National Social Sciences Foundation of China, grant number 19AJY001.
Acknowledgments
The authors would like to thank the anonymous reviewers for their constructive comments and valuable suggestions on this article.
Conflicts of Interest
The authors declare no conflict of interest.
References
- Sachs, J.D.; Warner, A.M. Natural Resource Abundance and Economic Growth; National Bureau of Economic Research: Cambridge, MA, USA, 1995. [Google Scholar]
- Sachs, J.D.; Warner, A.M. Fundamental sources of long-run growth. Am. Econ. Rev. 1997, 87, 184–188. [Google Scholar]
- Sachs, J.D.; Warner, A.M. The big push, natural resource booms and growth. J. Dev. Econ. 1999, 59, 43–76. [Google Scholar] [CrossRef]
- Sachs, J.D.; Warner, A.M. The curse of natural resources. Eur. Econ. Rev. 2001, 45, 827–838. [Google Scholar] [CrossRef]
- Song, M.; Wang, J.; Zhao, J. Coal endowment, resource curse, and high coal-consuming industries location: Analysis based on large-scale data. Resour. Conserv. Recycl. 2018, 129, 333–344. [Google Scholar] [CrossRef]
- Lu, C.; Wang, D.; Meng, P.; Yang, J.; Pang, M.; Wang, L. Research on resource curse effect of resource-dependent cities: Case study of Qingyang, Jinchang and Baiyin in China. Sustainability 2019, 11, 91. [Google Scholar] [CrossRef]
- Douglas, S.; Walker, A. Coal mining and the resource curse in the eastern United States. J. Reg. Sci. 2017, 57, 568–590. [Google Scholar] [CrossRef]
- Atkinson, G.; Hamilton, K. Savings, growth and the resource curse hypothesis. World Dev. 2003, 31, 1793–1807. [Google Scholar] [CrossRef]
- Deller, S.C.; Schreiber, A. Mining and community economic growth. Rev. Reg. Stud. 2012, 42, 121–141. [Google Scholar]
- Deller, S. Does mining influence rural economic growth? J. Reg. Anal. Policy 2014, 44, 36–48. [Google Scholar]
- Sarmidi, T.; Hook Law, S.; Jafari, Y. Resource curse: New evidence on the role of institutions. Int. Econ. J. 2014, 28, 191–206. [Google Scholar] [CrossRef]
- Betz, M.R.; Partridge, M.D.; Farren, M.; Lobao, L. Coal mining, economic development, and the natural resources curse. Energy Econ. 2015, 50, 105–116. [Google Scholar] [CrossRef]
- Perez-Sebastian, F.; Raveh, O. The natural resource curse and fiscal decentralization. Am. J. Agric. Econ. 2015, 98, 212–230. [Google Scholar] [CrossRef]
- Kim, D.H.; Lin, S.C. Natural resources and economic development: New panel evidence. Environ. Resour. Econ. 2017, 66, 363–391. [Google Scholar] [CrossRef]
- Badeeb, R.A.; Lean, H.H.; Clark, J. The evolution of the natural resource curse thesis: A critical literature survey. Resour. Policy 2017, 51, 123–134. [Google Scholar] [CrossRef]
- Marchand, J.; Weber, J. Local labor markets and natural resources: A synthesis of the literature. J. Econ. Surv. 2018, 32, 469–490. [Google Scholar] [CrossRef]
- Zhang, Q.; Brouwer, R. Is China affected by the resource curse? A critical review of the Chinese literature. J. Policy Model. 2019, in press. Available online: www.sciencedirect.com/science/article/pii/S0161893819300900 (accessed on 10 November 2019). [CrossRef]
- Ploeg, F.V.D.; Poelhekke, S. Volatility and the natural resource curse. Oxf. Econ. Pap. 2009, 61, 727–760. [Google Scholar] [CrossRef]
- Brunnschweiler, C.N.; Bulte, E.H. The resource curse revisited and revised: A tale of paradoxes and red herrings. J. Environ. Econ. Manag. 2008, 55, 248–264. [Google Scholar] [CrossRef]
- Mehrara, M. Reconsidering the resource curse in oil-exporting countries. Energy Policy 2009, 37, 1165–1169. [Google Scholar] [CrossRef]
- Shao, S.; Yang, L. Natural resource dependence, human capital accumulation, and economic growth: A combined explanation for the resource curse and the resource blessing. Energy Policy 2014, 74, 632–642. [Google Scholar] [CrossRef]
- Lederman, D.; Maloney, W.F.; Dunning, T.; Shelton, C.A. In search of the missing resource curse. Economía 2008, 9, 1–57. [Google Scholar] [CrossRef]
- Gylfason, T.; Herbertsson, T.T.; Zoega, G. A mixed blessing: Natural resources and economic growth. Macroecon. Dyn. 1999, 3, 204–225. [Google Scholar] [CrossRef]
- Wood, A.; Berge, K. Exporting manufactures: Human resources, natural resources, and trade policy. J. Dev. Stud. 1997, 34, 35–59. [Google Scholar] [CrossRef]
- Stijns, J.-P.C. Natural resource abundance and economic growth revisited. Resour. Policy 2005, 30, 107–130. [Google Scholar] [CrossRef]
- Hamilton, K.; Ruta, G.; Tajibaeva, L. Capital accumulation and resource depletion: A Hartwick rule counterfactual. Environ. Resour. Econ. 2006, 34, 517–533. [Google Scholar] [CrossRef]
- Conrad, R.; Acemoglu, D.; Borjas, G.J.; Rodrik, D.; Rotemberg, J.J. The elusive curse of oil. Rev. Econ. Stat. 2009, 91, 586–598. [Google Scholar]
- Kellard, N.; Wohar, M.E. On the prevalence of trends in primary commodity prices. J. Dev. Econ. 2006, 79, 146–167. [Google Scholar] [CrossRef]
- Arellano, M.; Bond, S. Some tests of specification for panel data: Monte carlo evidence and an application to employment equations. Rev. Econ. Stud. 1991, 58, 277–297. [Google Scholar] [CrossRef]
- Arellano, M.; Bover, O. Another look at the instrumental variable estimation of error-components models. J. Econ. 1995, 68, 29–51. [Google Scholar] [CrossRef]
- Papyrakis, E.; Gerlagh, R. The resource curse hypothesis and its transmission channels. J. Comp. Econ. 2004, 32, 181–193. [Google Scholar] [CrossRef]
- Zidouemba, P.R.; Elitcha, K. Foreign direct investment and total factor productivity: Is there any resource curse? Modif. Econ. 2018, 9, 463–483. [Google Scholar] [CrossRef]
- Gylfason, T.; Zoega, G. Natural resources and economic growth: The role of investment. World Econ. 2006, 29, 1091–1115. [Google Scholar] [CrossRef]
- Koren, M.; Tenreyro, S. Volatility and development. Q. J. Econ. 2007, 122, 243–287. [Google Scholar] [CrossRef]

© 2019 by the authors. Licensee MDPI, Basel, Switzerland. This article is an open access article distributed under the terms and conditions of the Creative Commons Attribution (CC BY) license (http://creativecommons.org/licenses/by/4.0/).