Article

Risk Assessment and Regionalization of Fire Disaster Based on Analytic Hierarchy Process and MODIS Data: A Case Study of Inner Mongolia, China

1
College of Resources and Environmental Economics, Inner Mongolia University of Finance and Economics, Hohhot, Inner Mongolia 010070, China
2
Collage of Desert Control Science and Engineering, Inner Mongolia Agricultural University, Hohhot, Inner Mongolia 010011, China
3
College of Earth and Environmental Sciences, Lanzhou University, Lanzhou 730000, China
4
Shanghai Institute of Tourism, Shanghai Normal University, Shanghai 200234, China
*
Authors to whom correspondence should be addressed.
Sustainability 2019, 11(22), 6263; https://doi.org/10.3390/su11226263
Submission received: 17 September 2019 / Revised: 26 October 2019 / Accepted: 4 November 2019 / Published: 8 November 2019
(This article belongs to the Section Environmental Sustainability and Applications)

Abstract

:
Inner Mongolia, as a fragile ecological zone in northern China, is prone to severe fires due to natural forces and intensive human disturbances. The development of a fire risk assessment system at the finer spatial scale is not sufficient in this region. In this study, we obtained the data of burned areas and fire hotspots numbers for Inner Mongolia from the Terra/Aqua Moderate-resolution Imaging Spectroradiometer data (MCD45A1 and MOD14A1/MYD14A1, 2002~2016). These fire maps were used to determine the fire spatial and temporal variability, as well as the interactions with environmental controls (climatic, vegetation, topography, and anthropic characteristics) derived in geographic information system (GIS) layers. Based on this, the fire-causing variables were selected as the dependent variables for model building, whereas data on burned area and number of fire hotspots were used for model validation. The fire risk assessment map was then generated in a 500 × 500 m grid cell using an analytic hierarchy process approach and a GIS technique. This work could be easily used for the ultimate aim of supporting fire management.

1. Introduction

Fires are the important part of terrestrial ecosystems and play a significant role in affecting the patterns and successional status of ecosystems [1]. They can directly alter atmosphere circulation, biodiversity, and landscape function [2,3,4]. Natural and human-caused fires have modified the landscape over several centuries, and human activities (e.g., cultural burning, smoking, burning vegetation for land clearance and stripping vegetation) are responsible for the majority, whether intentionally or accidentally [5,6,7]. The burned area and fire frequency throughout the world seem to be rising, along with land type change and climate warming [8,9,10].
Much more research work about wildfires in China has been done by the experts and scholars both at home and abroad [11,12,13]. Previous research has mainly concentrated on the fire-prone floras, such as boreal forest in the Daxing’an Mountain areas [14,15] and sub-tropic forest areas in the southeast of China [16]. However, fire risk management, especially for the dispatch of fire-fighting forces, is usually performed by administrative units (e.g., province, city, county, township, or village). Therefore, there is an urgent need to establish a fire risk assessment model from the perspective of administrative units instead of ecoregion.
Regarding fire risk assessment, a standard, i.e., the rank of the regionalization on nationwide forest fire risk, was issued in 2008 by the China’s State Forestry Administration, but the other fire types, such as grassland fire and farmland fire, were not considered [17]. Inner Mongolia, as the second largest burned area province and the most important ecoregion in the border areas of northern China, has been severely afflicted by fires for centuries [18,19,20]. From the open-access data provided by the local government, it is evident that Inner Mongolia has experienced fires that have burned 4.61 × 10⁵ ha from 1998 to 2014, accounting for 11.9% of the total land area [21]. The main land cover types are forest and grassland in Inner Mongolia. The burned areas of forest and grassland reached 3444.65 and 1859.14 km2, respectively, according to the field investigations from 2002 to 2015 by the forestry department of Inner Mongolia (http://lcj.nmg.gov.cn/). Moreover, massive casualties and property losses have occurred due to the high fire frequency and large burned area. The Inner Mongolia statistics have indicated that the property loss caused by fire has been continuously increased from $1.92 million in 2001 to $18.13 million in 2014 (US $1 is around RMB 7.118 in 2019) [22]. A big fire of Daxing’an Mountains on 6 May, 1987 killed at least 211 and injured more than 266 people, and it completely destroyed many homes and farms. The direct economic loss was approximately $70.24 million [23]. Though fires have been a serious threat to people’s life and property in Inner Mongolia, there have been few studies devoted to fire monitoring and risk assessment at the pixel scale that have taken Inner Mongolia as a whole study area.
To date, there have been many models used for fire risk assessment in worldwide researches, such as the analytic hierarchy process (AHP) [24,25], logistic regression [26], and some machine learning methods (e.g., artificial neural network (ANN) [27,28,29,30], random forest (RF) [31], deep learning (DL) [32]). For example, Eskandari [24] obtained a fire risk model from a fuzzy AHP and a multi criteria decision making method in a geographic information system (GIS) framework to map the fire risk. Nieto [26] focused on the lightning-caused fires in central Spain and developed a probability model of occurrence based on meteorological, vegetation, and terrain variables. Mar [27] and Maeda [30] predicted the fire danger using an artificial neural network with the time-series Moderate-resolution Imaging Spectroradiometer (MODIS) images. Oliveira [31] compared the performance of the multiple regression and random forest methods to model the spatial patterns of fire occurrence in Mediterranean Europe. In these methods, the AHP, as a knowledge-based method, can quickly achieve fire risk mapping with a high accuracy when considering the importance of the indicators [25]. Therefore, the AHP method was employed to build the fire risk model in our research. In addition, the selection of fire risk factors in previous studies mainly focus on static variables and the number of variables is relatively small [33,34]. With the development of remote sensing technology, more appropriate continuous covariates—these are dynamic and account for the yearly changing characteristics, including mean temperature, precipitation anomaly, the normalized difference vegetation index (NDVI), vegetation water content, etc.—can be introduced into fire risk models to improve the accuracy of fire risk mapping [11,35].
The main objectives of this study are to (a) reveal the spatial–temporal distribution of fire hotspots numbers and burned areas based on MODIS products in Inner Mongolia from 2002 to 2016; (b) analyze the relationship between fire hotspots and environmental variables; and (c) generate a fire risk map with the AHP method and achieve the risk regionalization.

2. Materials and Methodology
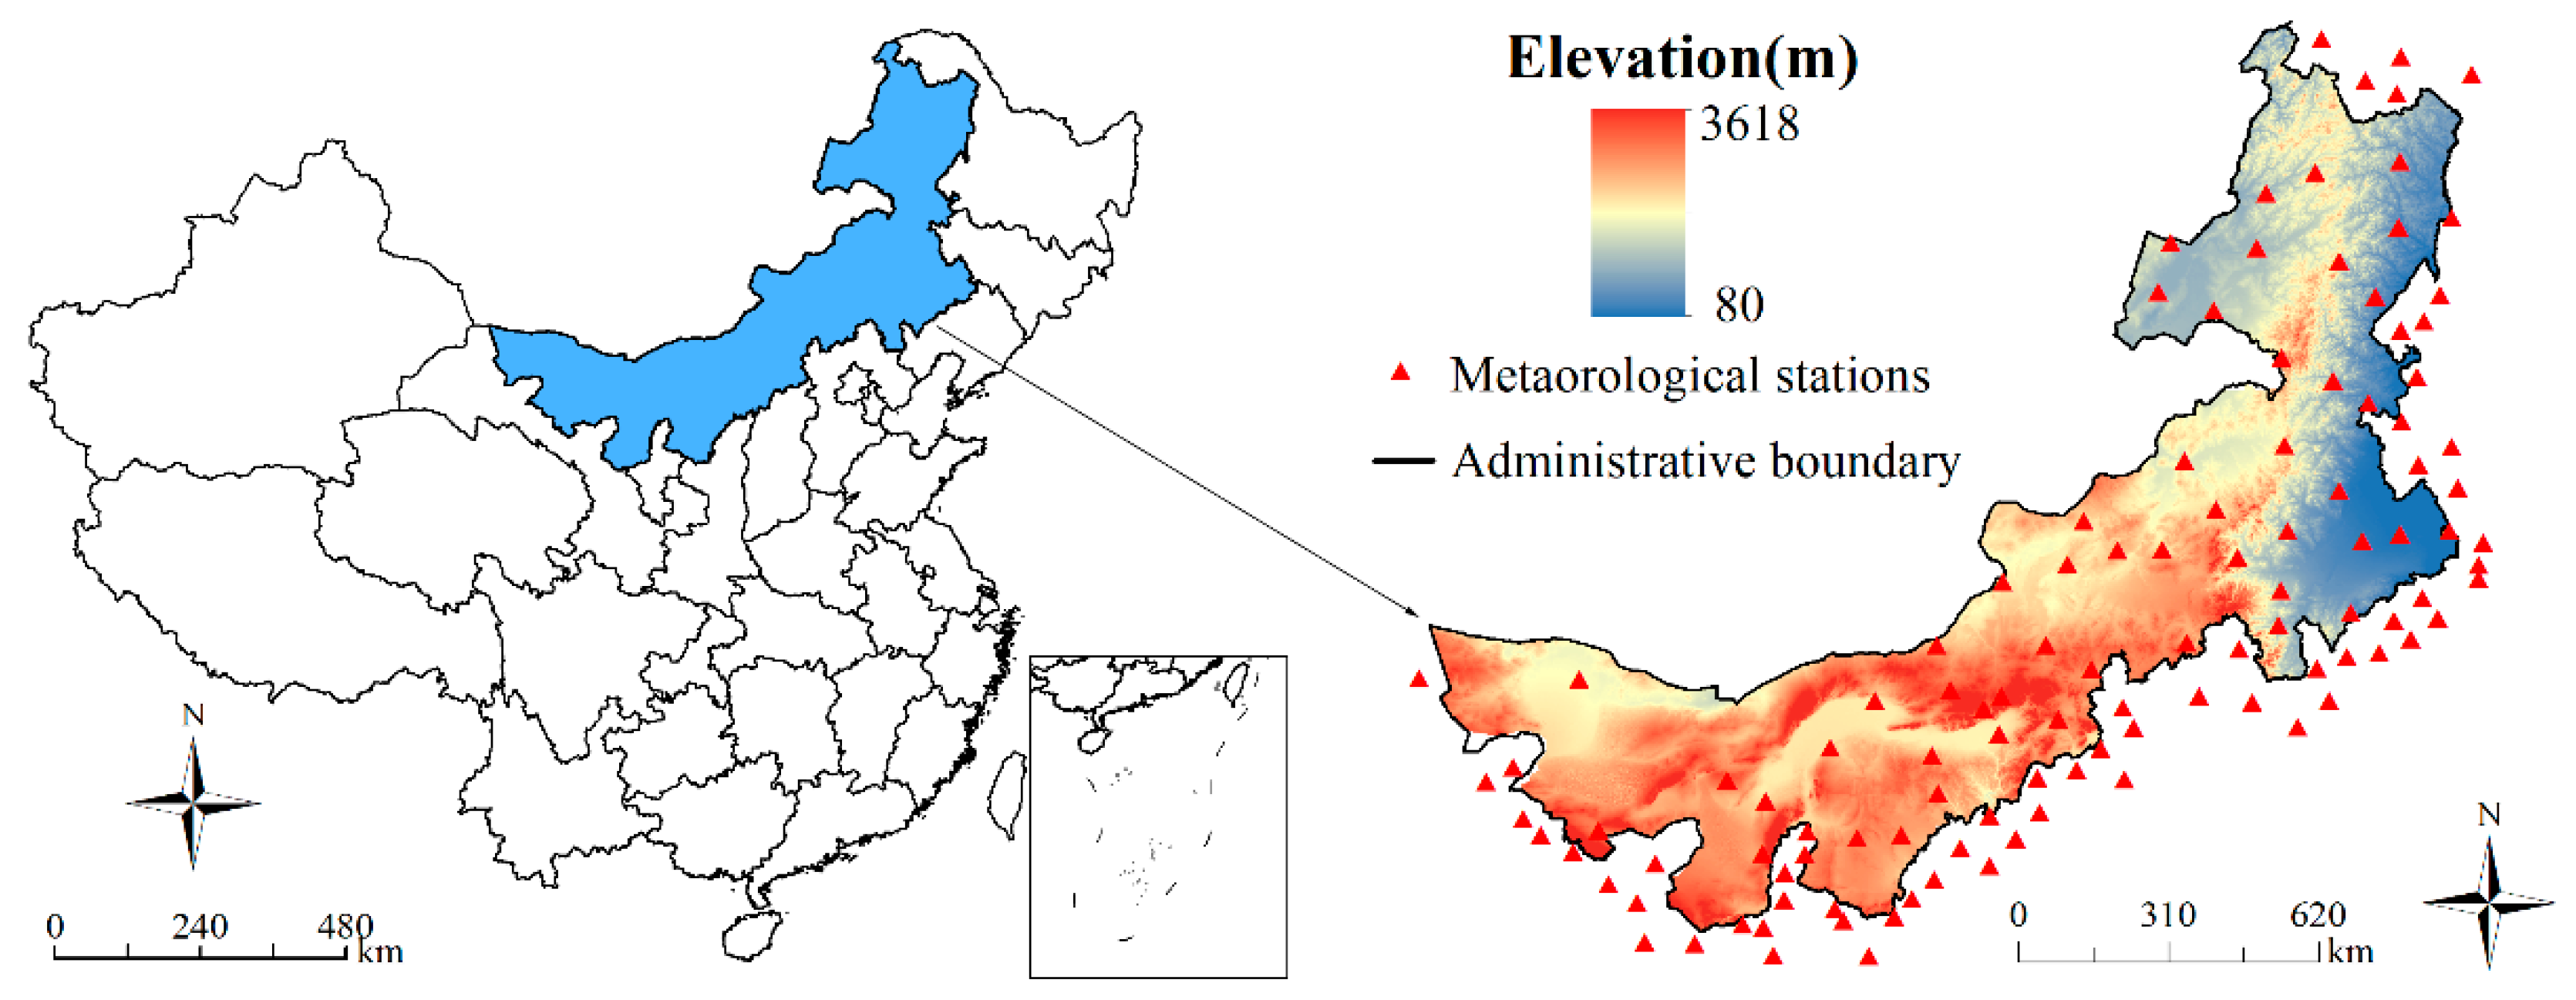
2.1. Study Area

Inner Mongolia (37°24′~53°23′ N, 97°12′~126°04′ E), located in the north of China, has a total area of 1.18 × 10⁶ km2 (Figure 1). In 2018, Inner Mongolia’s population was 25.34 million, with 62.7% of the population living in urban areas (http://www.nmg.gov.cn/col/col204/index.html). The elevation of this area varies greatly, with an average elevation of over 1000 m. It has a typical temperate continental monsoon climate with a cold and dry winter and a hot and rainy summer. The mean annual temperature ranges from −3.7 to 11.2 °C, while the annual precipitation ranges from 450 mm in the east to 50 mm in the west, with up to 60%~70% of annual rainfall occurring during the summer (June–August). The annual strong wind days are 10–40, with 70% occurring in spring. The two major vegetation communities on the plateau are grassland and forest, which occupy 74% and 21% of the province, respectively. The dominant vegetation types from northeast to southwest are forest, forest steppe, meadow steppe, typical steppe, desert steppe, steppe desert and desert.

2.2. Remote Sensing Data

2.2.1. Burned Area and Fire Hotspots Datasets

The burned area and number of fire hotspots were extracted from the MCD45A1 and MYD14A1/MOD14A1 product, which is available at the official National Aeronautics and Space Administration (NASA) website (http://ladsweb.nascom.nasa.gov) based on the Terra and Aqua platforms. The burn information from January 2002 to December 2016 was extracted. With the MODIS Reprojection Tool, the HDF images were converted into the GEO-TIFF format, the Sinusoidal projection were transformed to Alberts, and images were subset into tiles.
The MCD45A1 product is a monthly dataset with a spatial resolution of 500 m. It includes eight science datasets. Among them, the BA pixel QA data provided the quality assessment of the burned areas. This information was in regard to the pixel detection confidence, with values ranging from 1 to 4, where a value of 1 indicated a high confidence of detection and a value of 4 indicated the least confident level of detection [36]. In this study, only the pixels with values of 1 were used, and, in order to avoid the overestimation of the burned areas, we only considered the burned area pixels in the first month. If they were detected again in the next month, we ignored them.
MOD14A1/MYD14A1 datasets provided the point locations of active fires (i.e., fire hotspots). These datasets are produced every 8 days but contain daily information, and the fire mask are their principle components with individual 1 km pixels assigned to one of ten classes (Table 1). We only extracted pixels having a value of 8 and 9, which means that the pixels had nominal and high confidence in detecting active fires. Based on this dataset, fire hotspot information was extracted in Inner Mongolia from 2002 to 2016.

2.2.2. Validation Dataset

Landsat images were used to validate the burned areas mapped from MODIS (MCD45A1 dataset). These images were available at the website of United States Geological Survey (http://glovis.usgs.gov). Burned areas were identified by multi-temporal visual comparison of Enhanced Thematic Mapper plus and Thematic Mapper (ETM+/TM) imagery. Four fire cases were selected and fire scars were digitized manually in an ArcGIS environment. Information about fires and involved Landsat images are shown in the table below (Table 2).

2.3. Selection of Environmental Variables

Based on the extensive literature review and experts’ knowledge, we selected 10 environmental variables from several databases on natural and human aspects. These variables were divided into continuous covariates and categorical variables. Some continuous covariates were dynamic and accounted for the yearly changing characteristics in the study zone, such as climatic variables and vegetation features. These included mean temperature, precipitation anomaly, normalized difference vegetation index (NDVI), and vegetation water content during the fire season. Other variables used to characterize the landscape features were almost static year by year, such as topographic attributes and distance to settlements and roads (Table 3). All the variables were integrated in the GIS with ArcGIS 10.2 and transformed to a continuous scale at a 500 m resolution.

2.3.1. Climatic Variables

The daily temperature and precipitation data during 2002~2016 were obtained from the China Meteorological Data Service Center, including 95 meteorological stations distributed within and around Inner Mongolia (http://data.cma.cn/site/index.html). According to the locations of the meteorological stations, daily temperature and precipitation data were firstly integrated as monthly datasets based on the mean composite and summation methods, respectively. With the Kriging interpolation method, the spatial distributions of monthly temperature and precipitation were subsequently generated to calculate the mean temperature and precipitation anomalies during the fire season for each year. Secondly, the monthly temperature in the fire season was multiplied by a certain proportion (i.e., the burned area in each month divided by total burned areas of fire season in 15 years) to integrate yearly mean temperature based on the weighted average method. Meanwhile, the precipitation anomaly for each year was calculated as follows [37]:
Precipitation   anomaly   in   year   i = Mean   precipitation   for   all   fire   seasons   from   2002   to   2016 Fire   season   precipitation   in   year   i Standard   deviation   of   all   fire   seasons   from   2002   to   2016  

2.3.2. Vegetation Feature

Because vegetation influences fuel characteristics (e.g., fuel load, structure, and moisture), we selected the vegetation feature as an essential element in our model. We specifically chose three important indices (land use type, NDVI and vegetation water content) to reflect the vegetation condition of study area. The land use type information was derived, one image per year, from MCD12Q1 datasets with a spatial resolution of 500 m. The International Geosphere Biosphere Programme (IGBP) classification scheme, from five global land cover classification systems provided by NASA website, was used to illustrate the distribution of vegetation dynamic and land cover changes [38,39].
The NDVI data were extracted from the MOD13Q1 Vegetation Indices 16-Day dataset at a 500 m resolution. In order to remove the noise due to cloud contamination, the harmonic analysis of time series (HANTS) algorithm was used to construct the cloud-free NDVI data for 15 years.
Vegetation water content was calculated based on Equation (2), as proposed by [40].
V W C = { 0 , ( N D V I < 0.17 ) 1.9134 N D V I 2 0.3215 N D V I , ( 0.17 N D V I 0.5 ) 4.2875 N D V I 1.4529 , ( N D V I 0.5 )
where the NDVI is the maximum NDVI after harmonic analysis for each month.

2.3.3. Topographic Factors

We downloaded a digital elevation model (DEM) in the raster format with a spatial resolution of 90 m from the Geospatial Data Cloud (http://www.gscloud.cn/sources/?cdataid=302&pdataid=10) provided by the Computer Network Information Center, Chinese Academy of Sciences. Slope and aspect were derived from the DEM. Aspect was reclassified into mesic (NE, NW, N and E) and xeric (SW, SE, S and W) in areas with slope > 0 and flat in areas with slope = 0.

2.3.4. Human Influence

The digital roadway and resident point maps (scale of 1:2600000) were derived from a paper map of Inner Mongolia produced by the China Cartographic Publishing House in 2011 after they were scanned, calibrated and digitalized. The distances to roads and settlements were calculated as the Euclidean distance from each cell to the nearest roads or settlements.
After extracting these variables described above (Table 3), we tried to examine the relationship between environment controls and fire. Considering that it is difficult to establish the relationship between burned area and environmental controls, only the correlation between driving factors in fire season and fire hotspots numbers is discussed in this paper. According to the status of the variables, the paper deals with them in separate discussion. For continuous covariates (e.g., temperature (Tem), precipitation anomaly (Pre), NDVI, vegetation water content (VWC), elevation (Ele), slope (Slo), distance to roads (DisRd), and distance to settlement areas (DisSet)), we extracted the values of each fire hotspot and unveiled the relationship between continuous variables and fire hotspots. For categorical variables (e.g., land use type (LT) and aspect (Asp)), we compared the observed fire frequencies (the proportion of fire hotspots in particular class to the total fire hotspots) and the expected fire frequencies (the proportion of the area in particular class to the whole area). Then, a chi-square test was conducted to reveal the association of categorical variables and fire hotspots ([12]). Finally, the variables included in the model were determined.

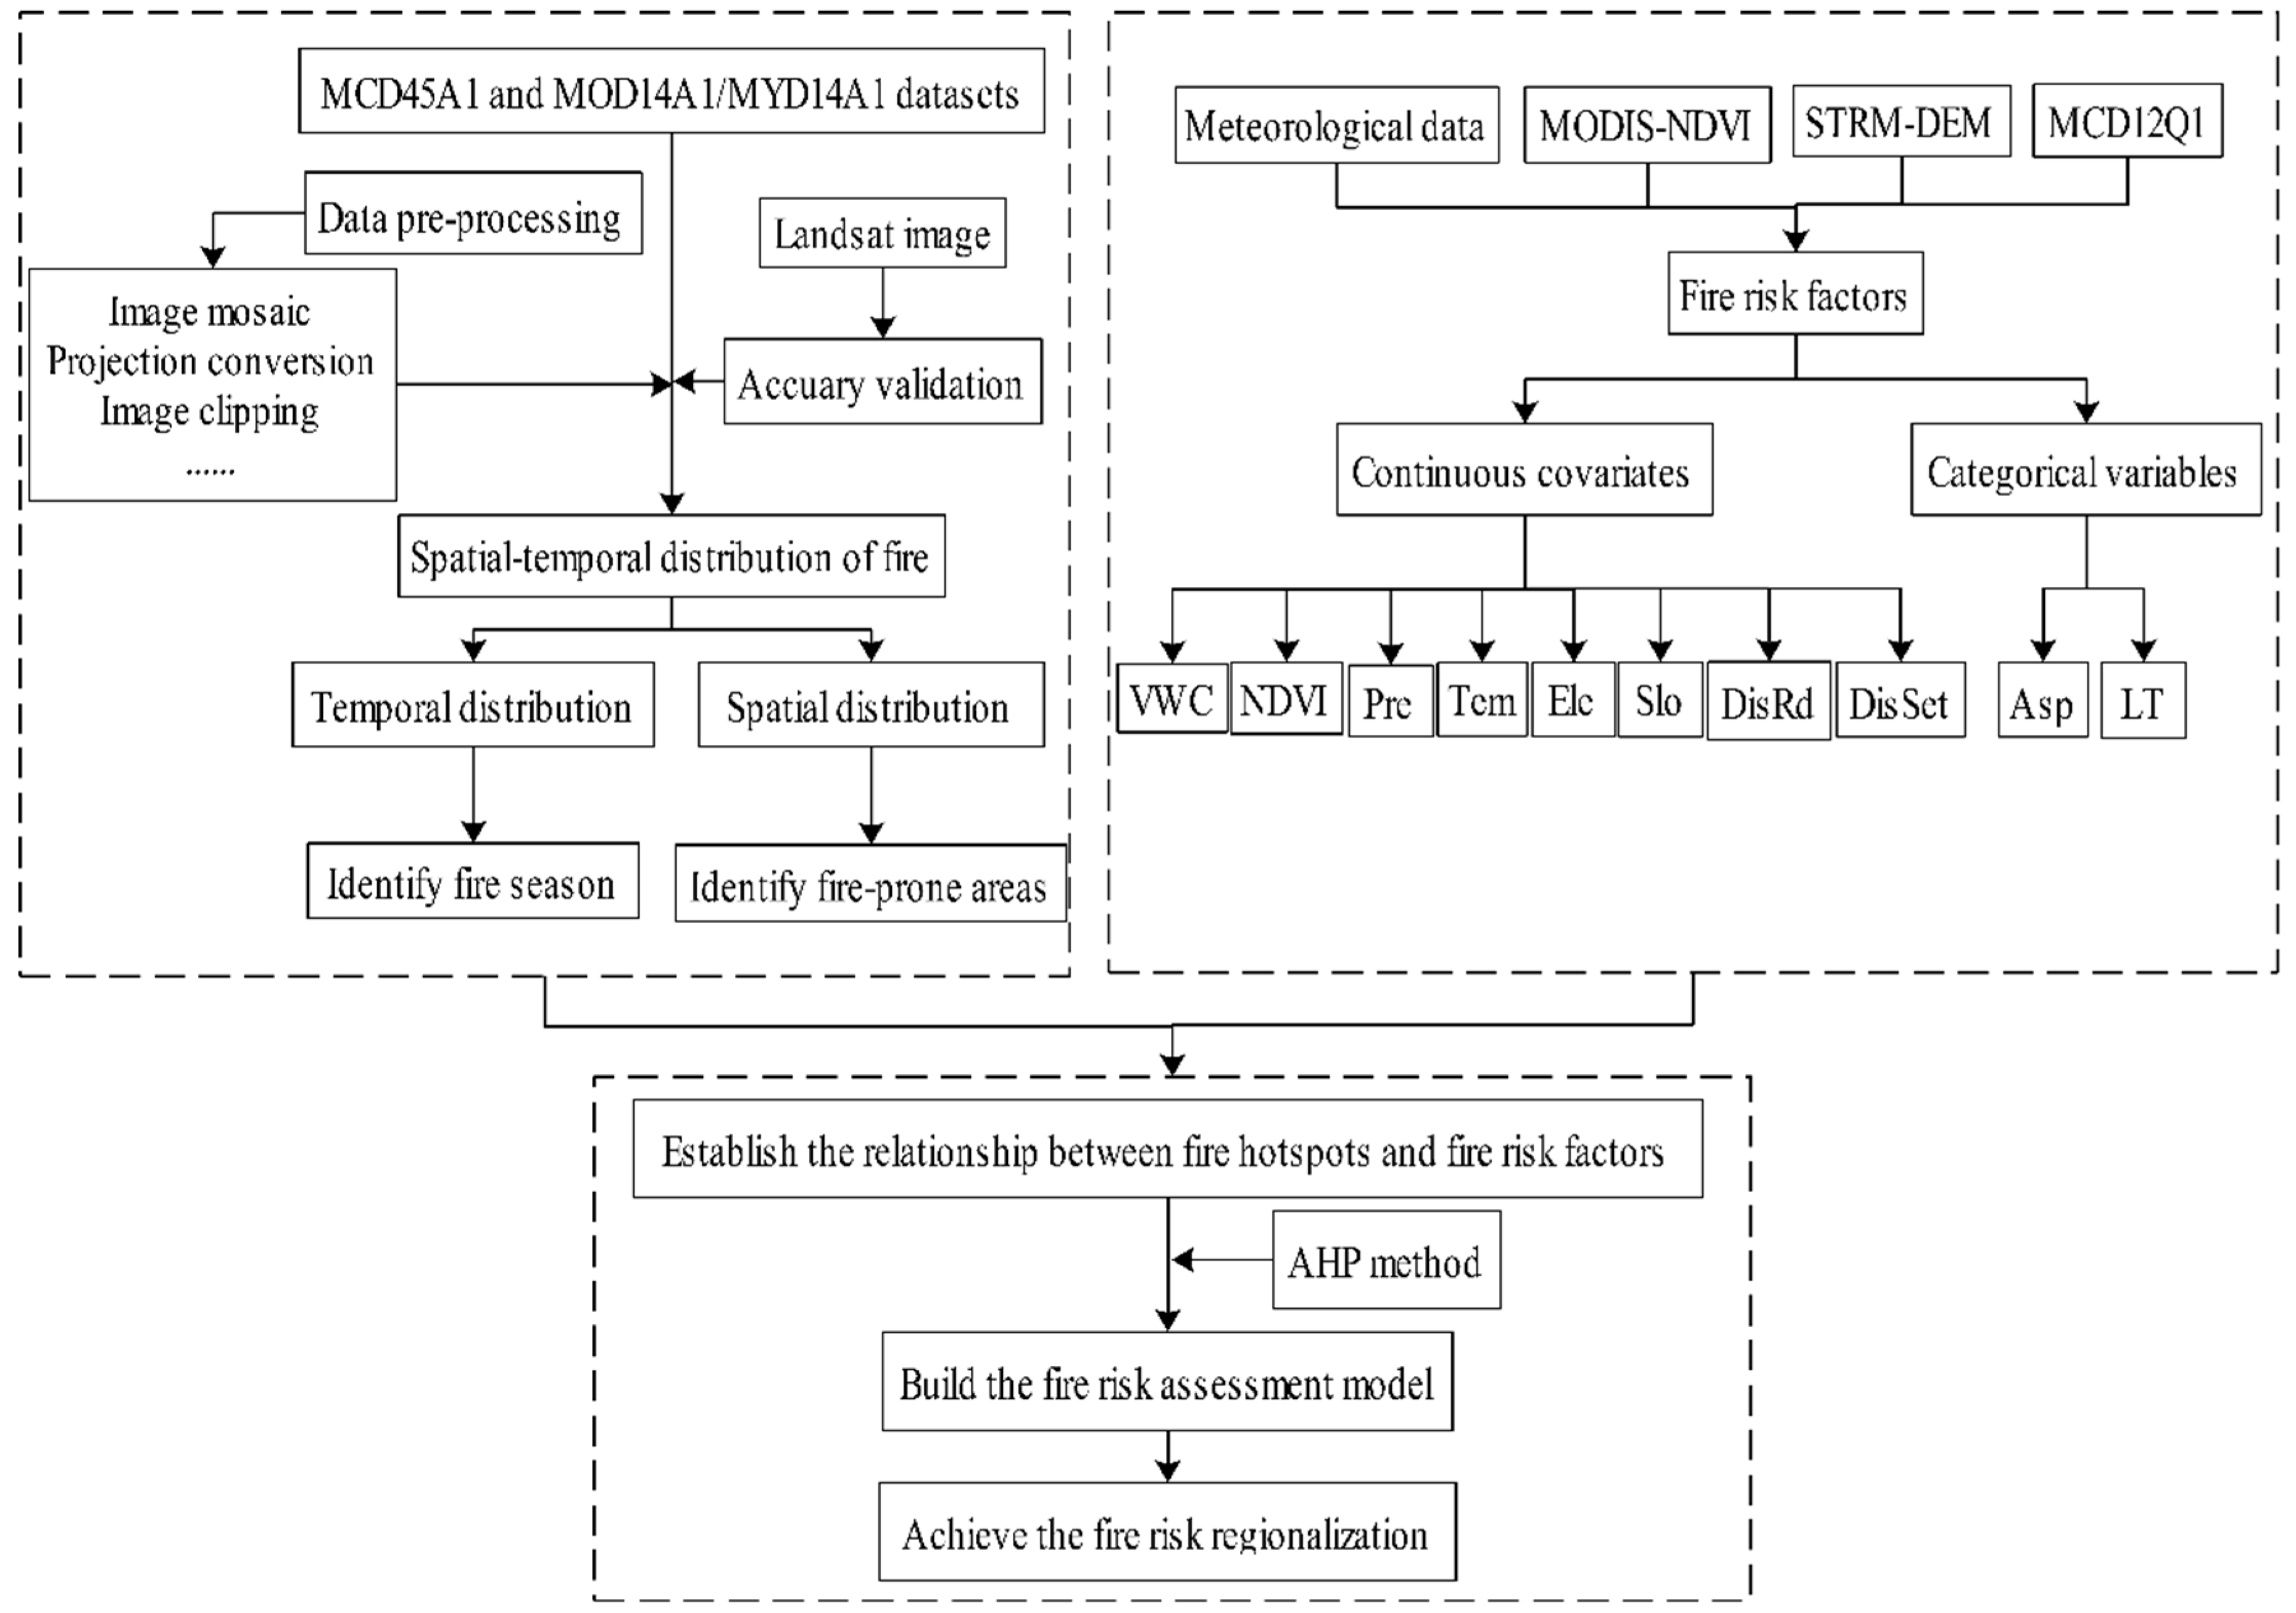
2.4. Generation of Fire Risk Maps

The flowchart of generation of fire risk maps is shown as follows (Figure 2), including three sections: (1) Identify the fire prone areas and fire season based on the analyses of spatial–temporal process of fire, (2) choose the fire risk factors, and (3) establish the relationship between fire hotspots and fire risk factors, build the fire risk assessment model, and achieve the fire risk regionalization.
In this study, the AHP method was used to construct the fire risk model based on the selection of environmental factors and experience from experts. The AHP is a combination of qualitative and quantitative methods that is often applied for decision-making problems [41]. Using the AHP, the following four steps are generally needed: establishing a hierarchical structure, constructing a comparison judgment matrix, calculating the relative weight of comparison elements and the combination weight of each layer element, and checking consistency. After constructing a comparison judgment matrix with the nine-scale method, the relative weights of the comparison elements were calculated with following formula:
M i = ( i = 1 n a i j ) 1 / n
w i = M i i = 1 n M i
where aij stands for the value of element in the i roll and j column of matrix, n stands for the dimension of matrix, and Mi stands for the metric average values in i roll.
In order to check the consistency of judgment matrix, the concordance index and ratio were calculated with following formula:
C I = ( λ m a x n ) / ( n 1 )
where λmax stands for the largest eigenvalues in the matrix and CI stands for the concordance index.
C R = C I / R I
where RI is the random consistency indicators and CR is the concordance ratio. When CR is lower than 0.1, the judgment matrix meet the consistency demand.
The normalization of all the variables is required before the fire risk model is built. For positive indexes (e.g., the changing trend of fire hotspots was similar with the environmental indexes), the data were normalized using Formula (7). For negative indexes (e.g., the changing trend of fire hotspots was contrary to the environmental indexes), the data were normalized Formula (8):
y i = ( x i x m i n ) ( x m a x x m i n )
y i = ( x m i n x i ) ( x m a x x m i n )
where xi is the actual value of the variables, xmax is the maximum value of xi, and xmin is the minimum value of xi.
It was known that some factors showed different influences in different value ranges. For those continuous variables, we adopted Formulas (7) and (8) based on the break point after we analyzed the relationship between fire hotspots and variables.
The fire risk model was built:
X = i 1 n w i · y i
where yi represents the value of each variables after standardization and wi represents the weight of each variables.
Eventually, we substituted values into the model, and the fire risk value for Inner Mongolia was computed as follows:
X = 0.2252 x 1 + 0.3647 x 2 + 0.0834 x 3 + 0.0888 x 4 + 0.0379 x 5 + 0.0218 x 6 + 0.0286 x 7 + 0.0820 x 8 + 0.0676 x 9
where x1 represents the NDVI, x2 represents vegetation water content, x3 is the land use type, x4 is the mean temperature, x5 is the precipitation anomaly, x6 is the elevation, x7 is the slope, x8 is the distance to settlements, and x9 is the distance to roads.

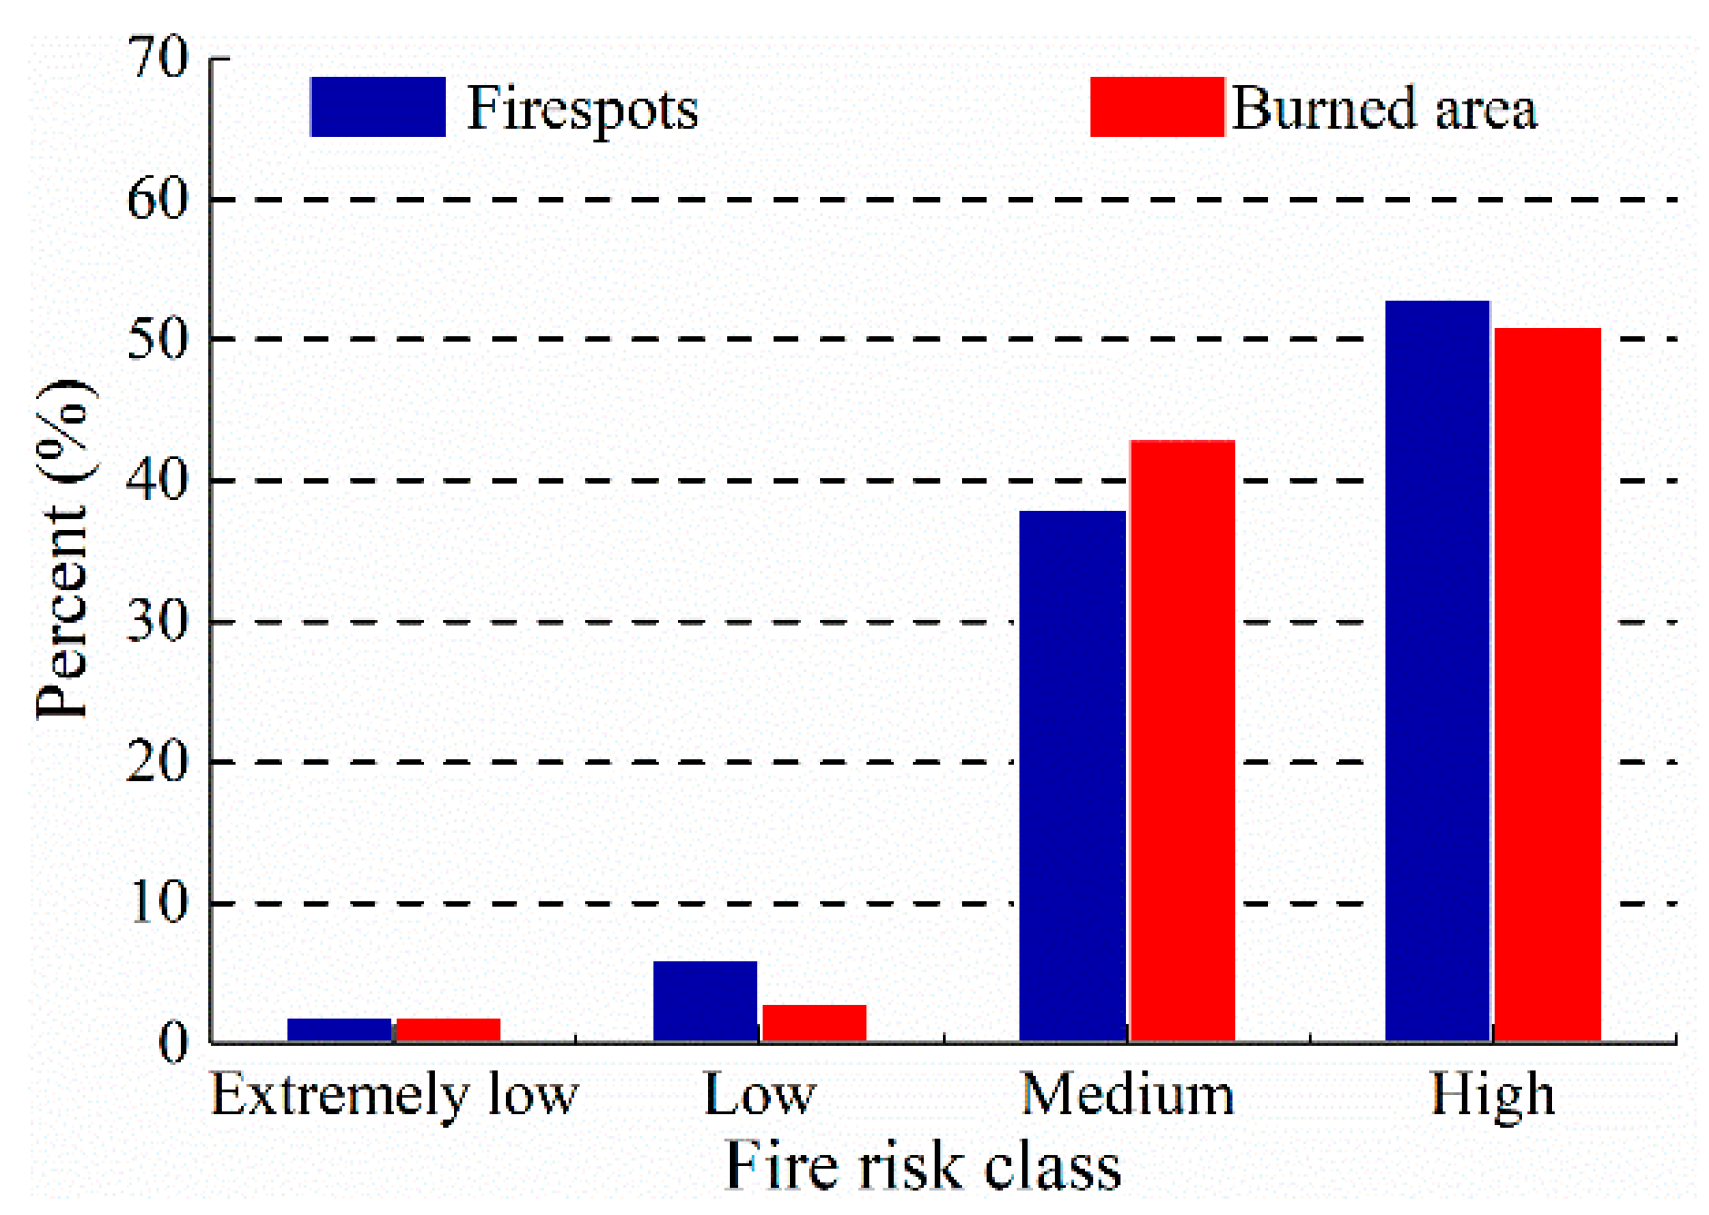
2.5. Validation Approach

In order to verify the accuracy of the fire risk assessments, we compared the fire risk classes with actual fire observations (burned areas and fire hotspots extracted from the MODIS datasets).

3. Results

3.1. Accuracy Verification of MODIS

We compared the burned areas as mapped from the MCD45A1 product with the fire scar sizes as digitized from Landsat for three grassland fires and one forest fire occurred in the study area. The burned areas extracted from Landsat images were 244, 37, 184, and 342 km2, while fire scars mapped from MODIS were 222, 32, 146, and 266 km2. Compared with the Landsat images, the error rates of the MCD45A1 dataset were 9%, 14%, 21% and 22%, respectively. Based on the error rate, our MCD45A1-derived product of burned areas proved to be working well, with accuracies above 70% for case study. In addition, grassland fire seemed to have a better estimate of the accuracy in fire mapping than forest fire. The reason for this phenomenon was probably that the occlusion of the tree crown made it difficult for sensors to detect the occurrence of surface fires.

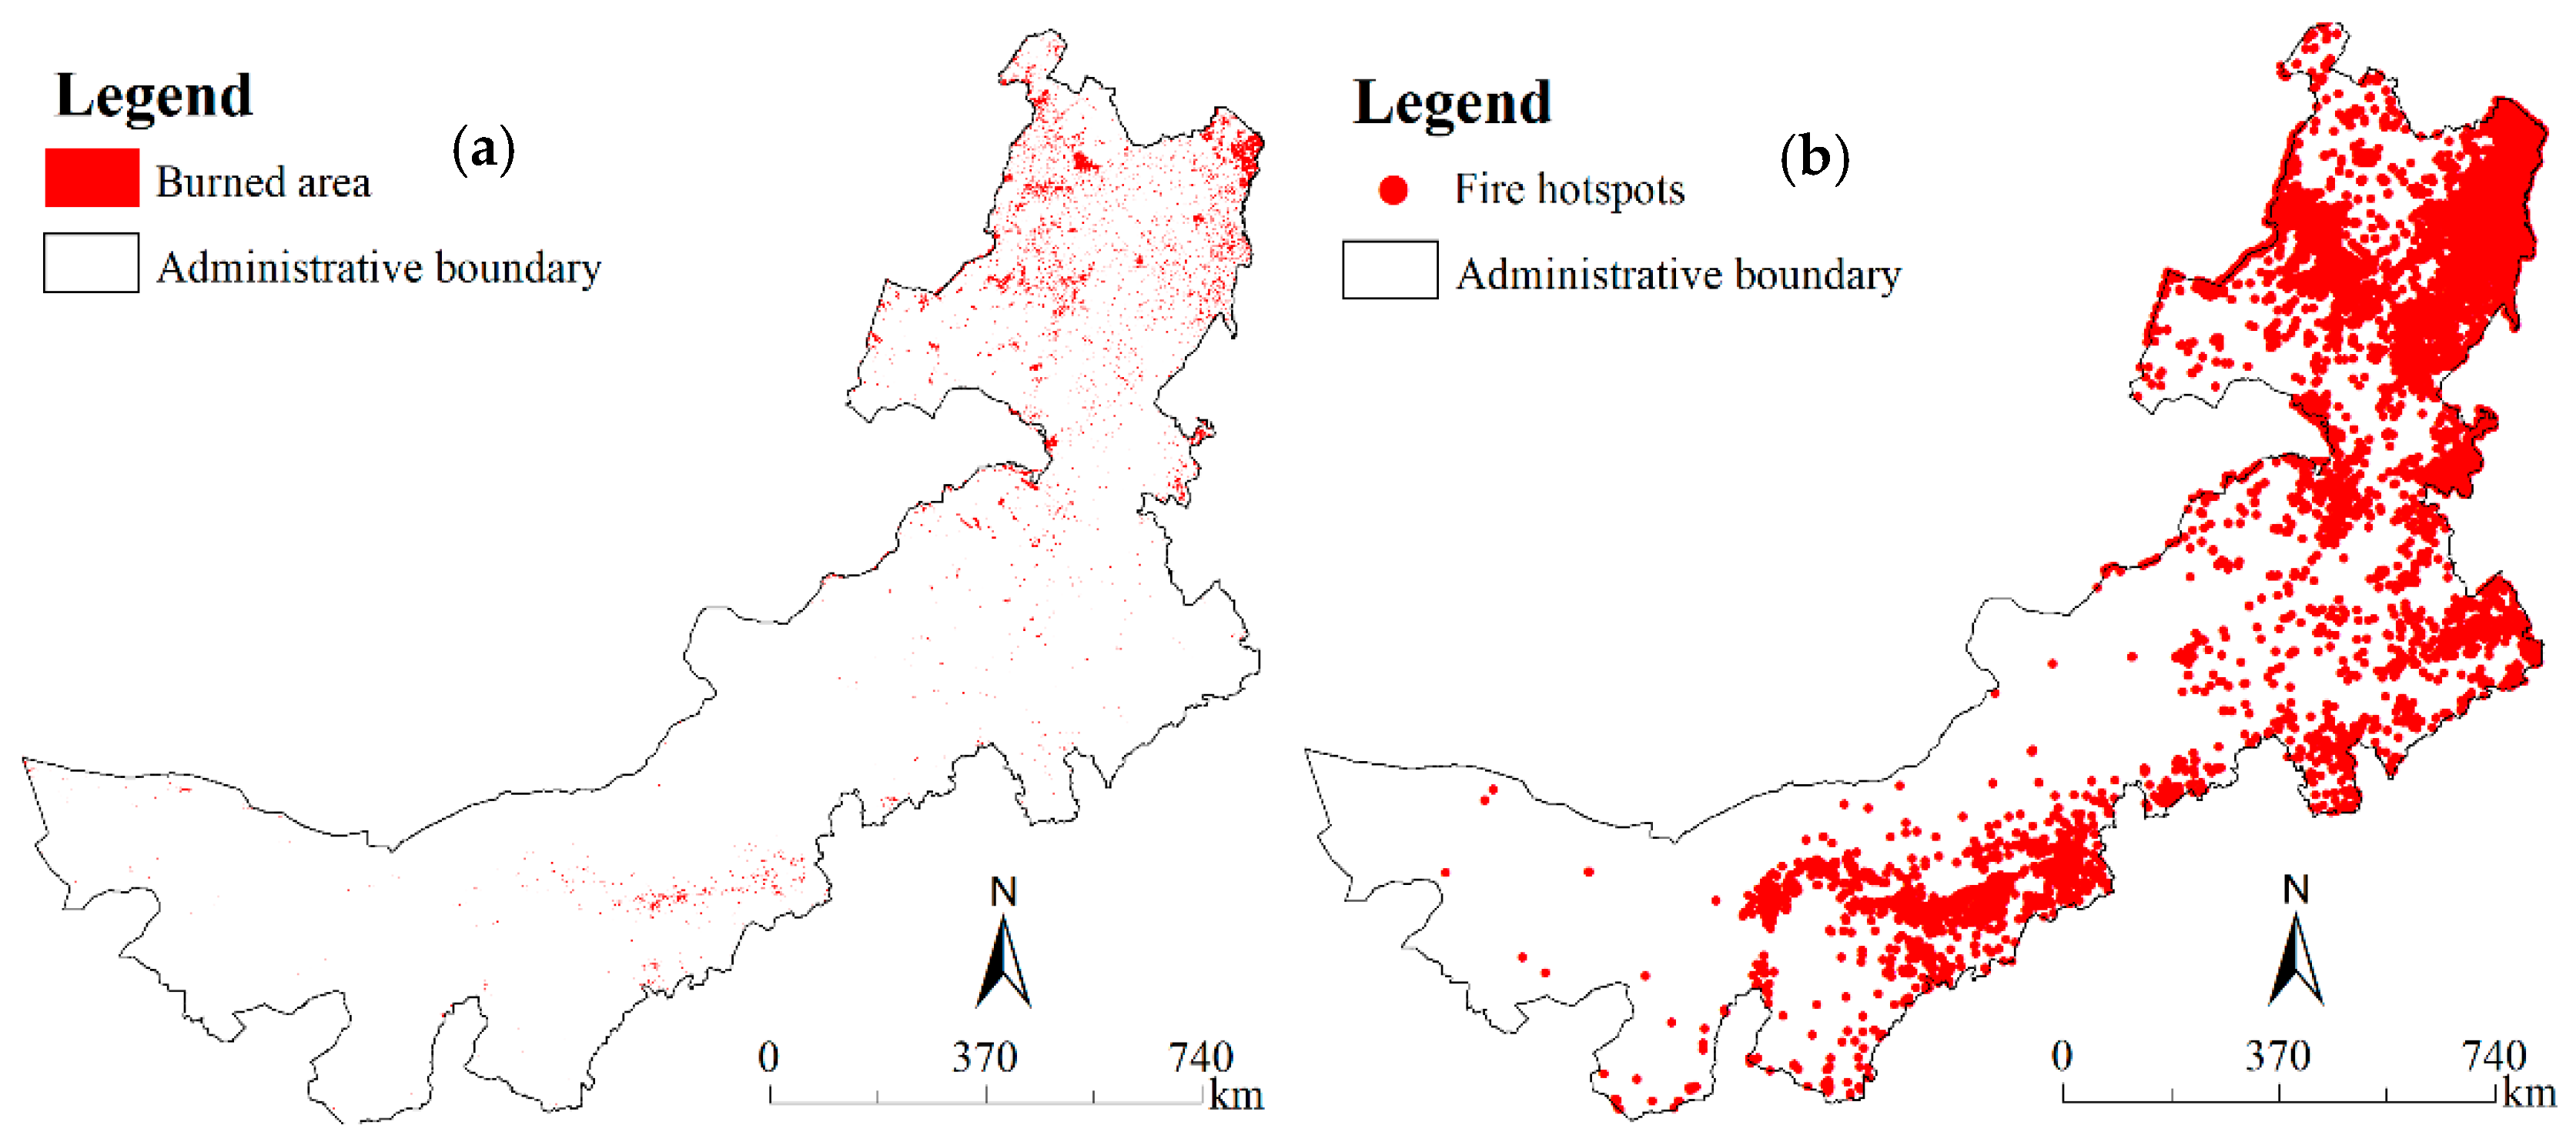
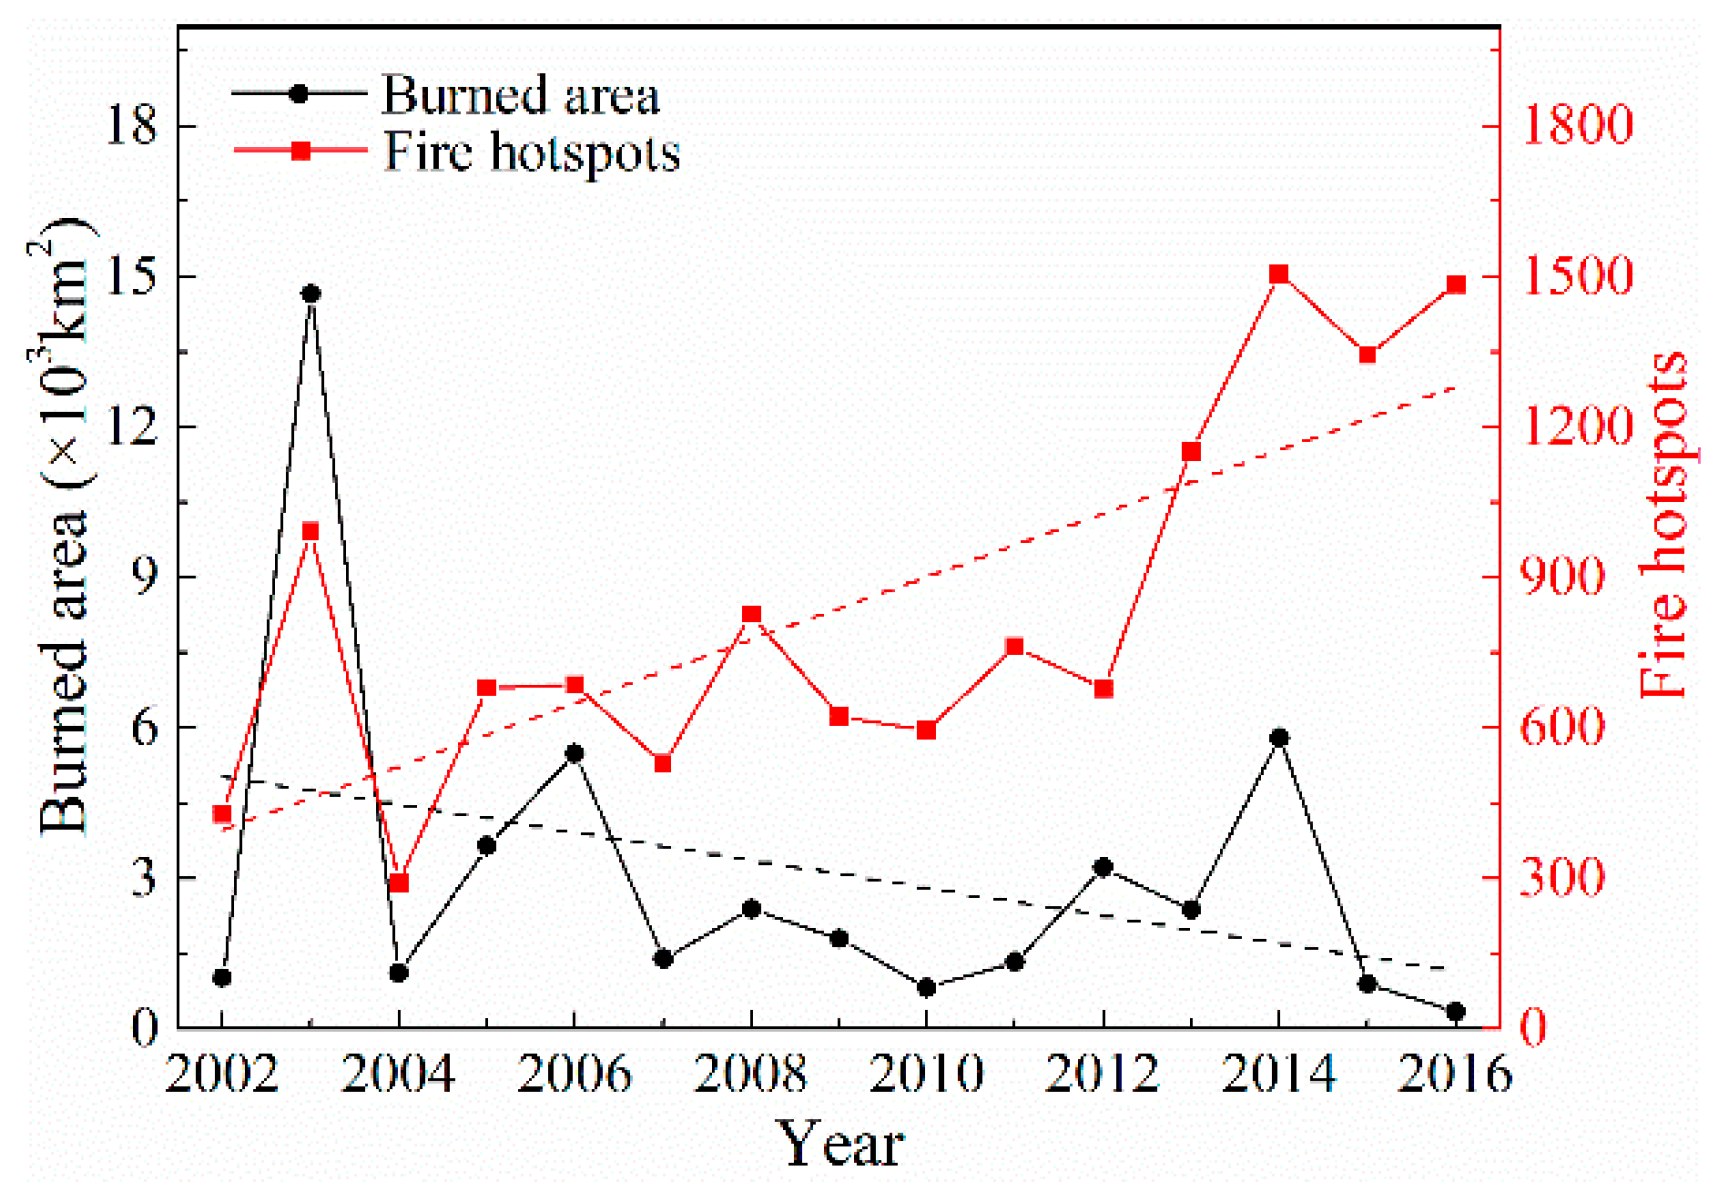
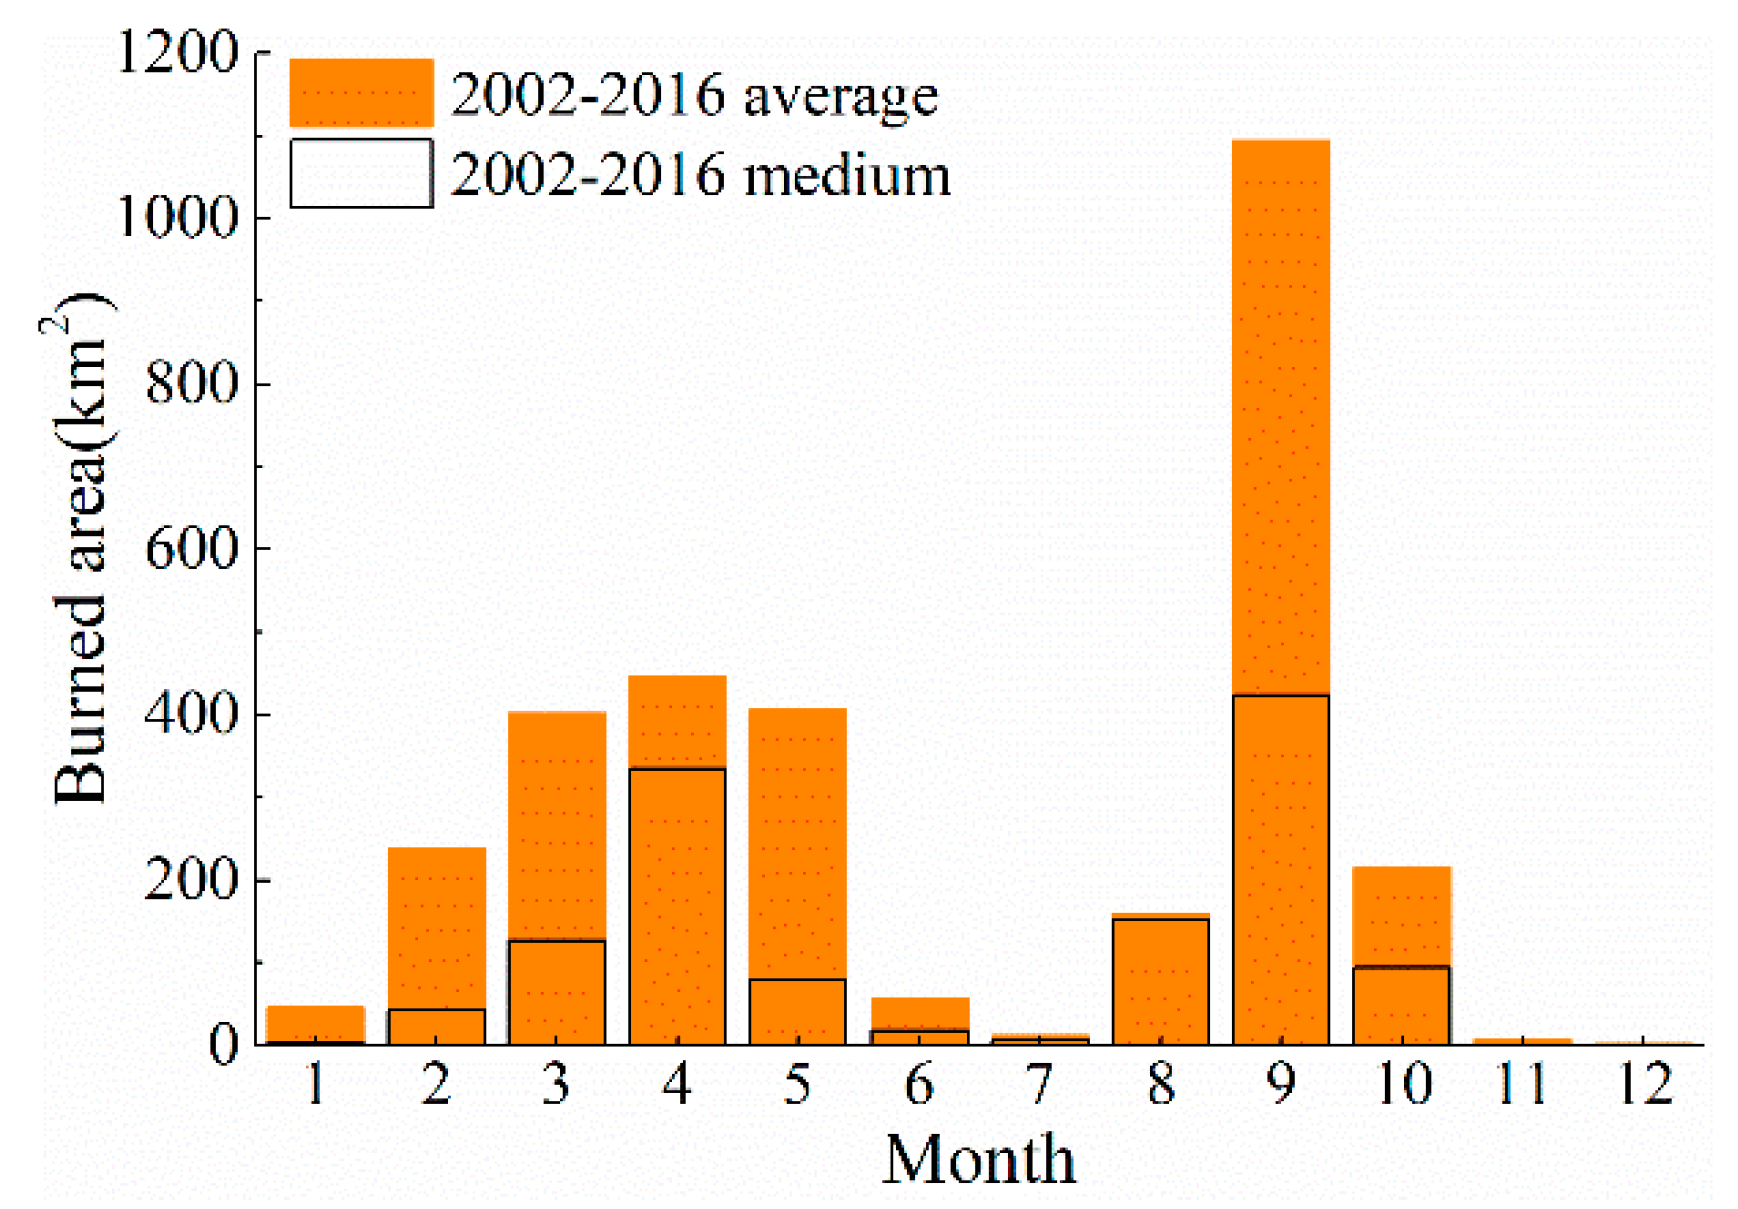
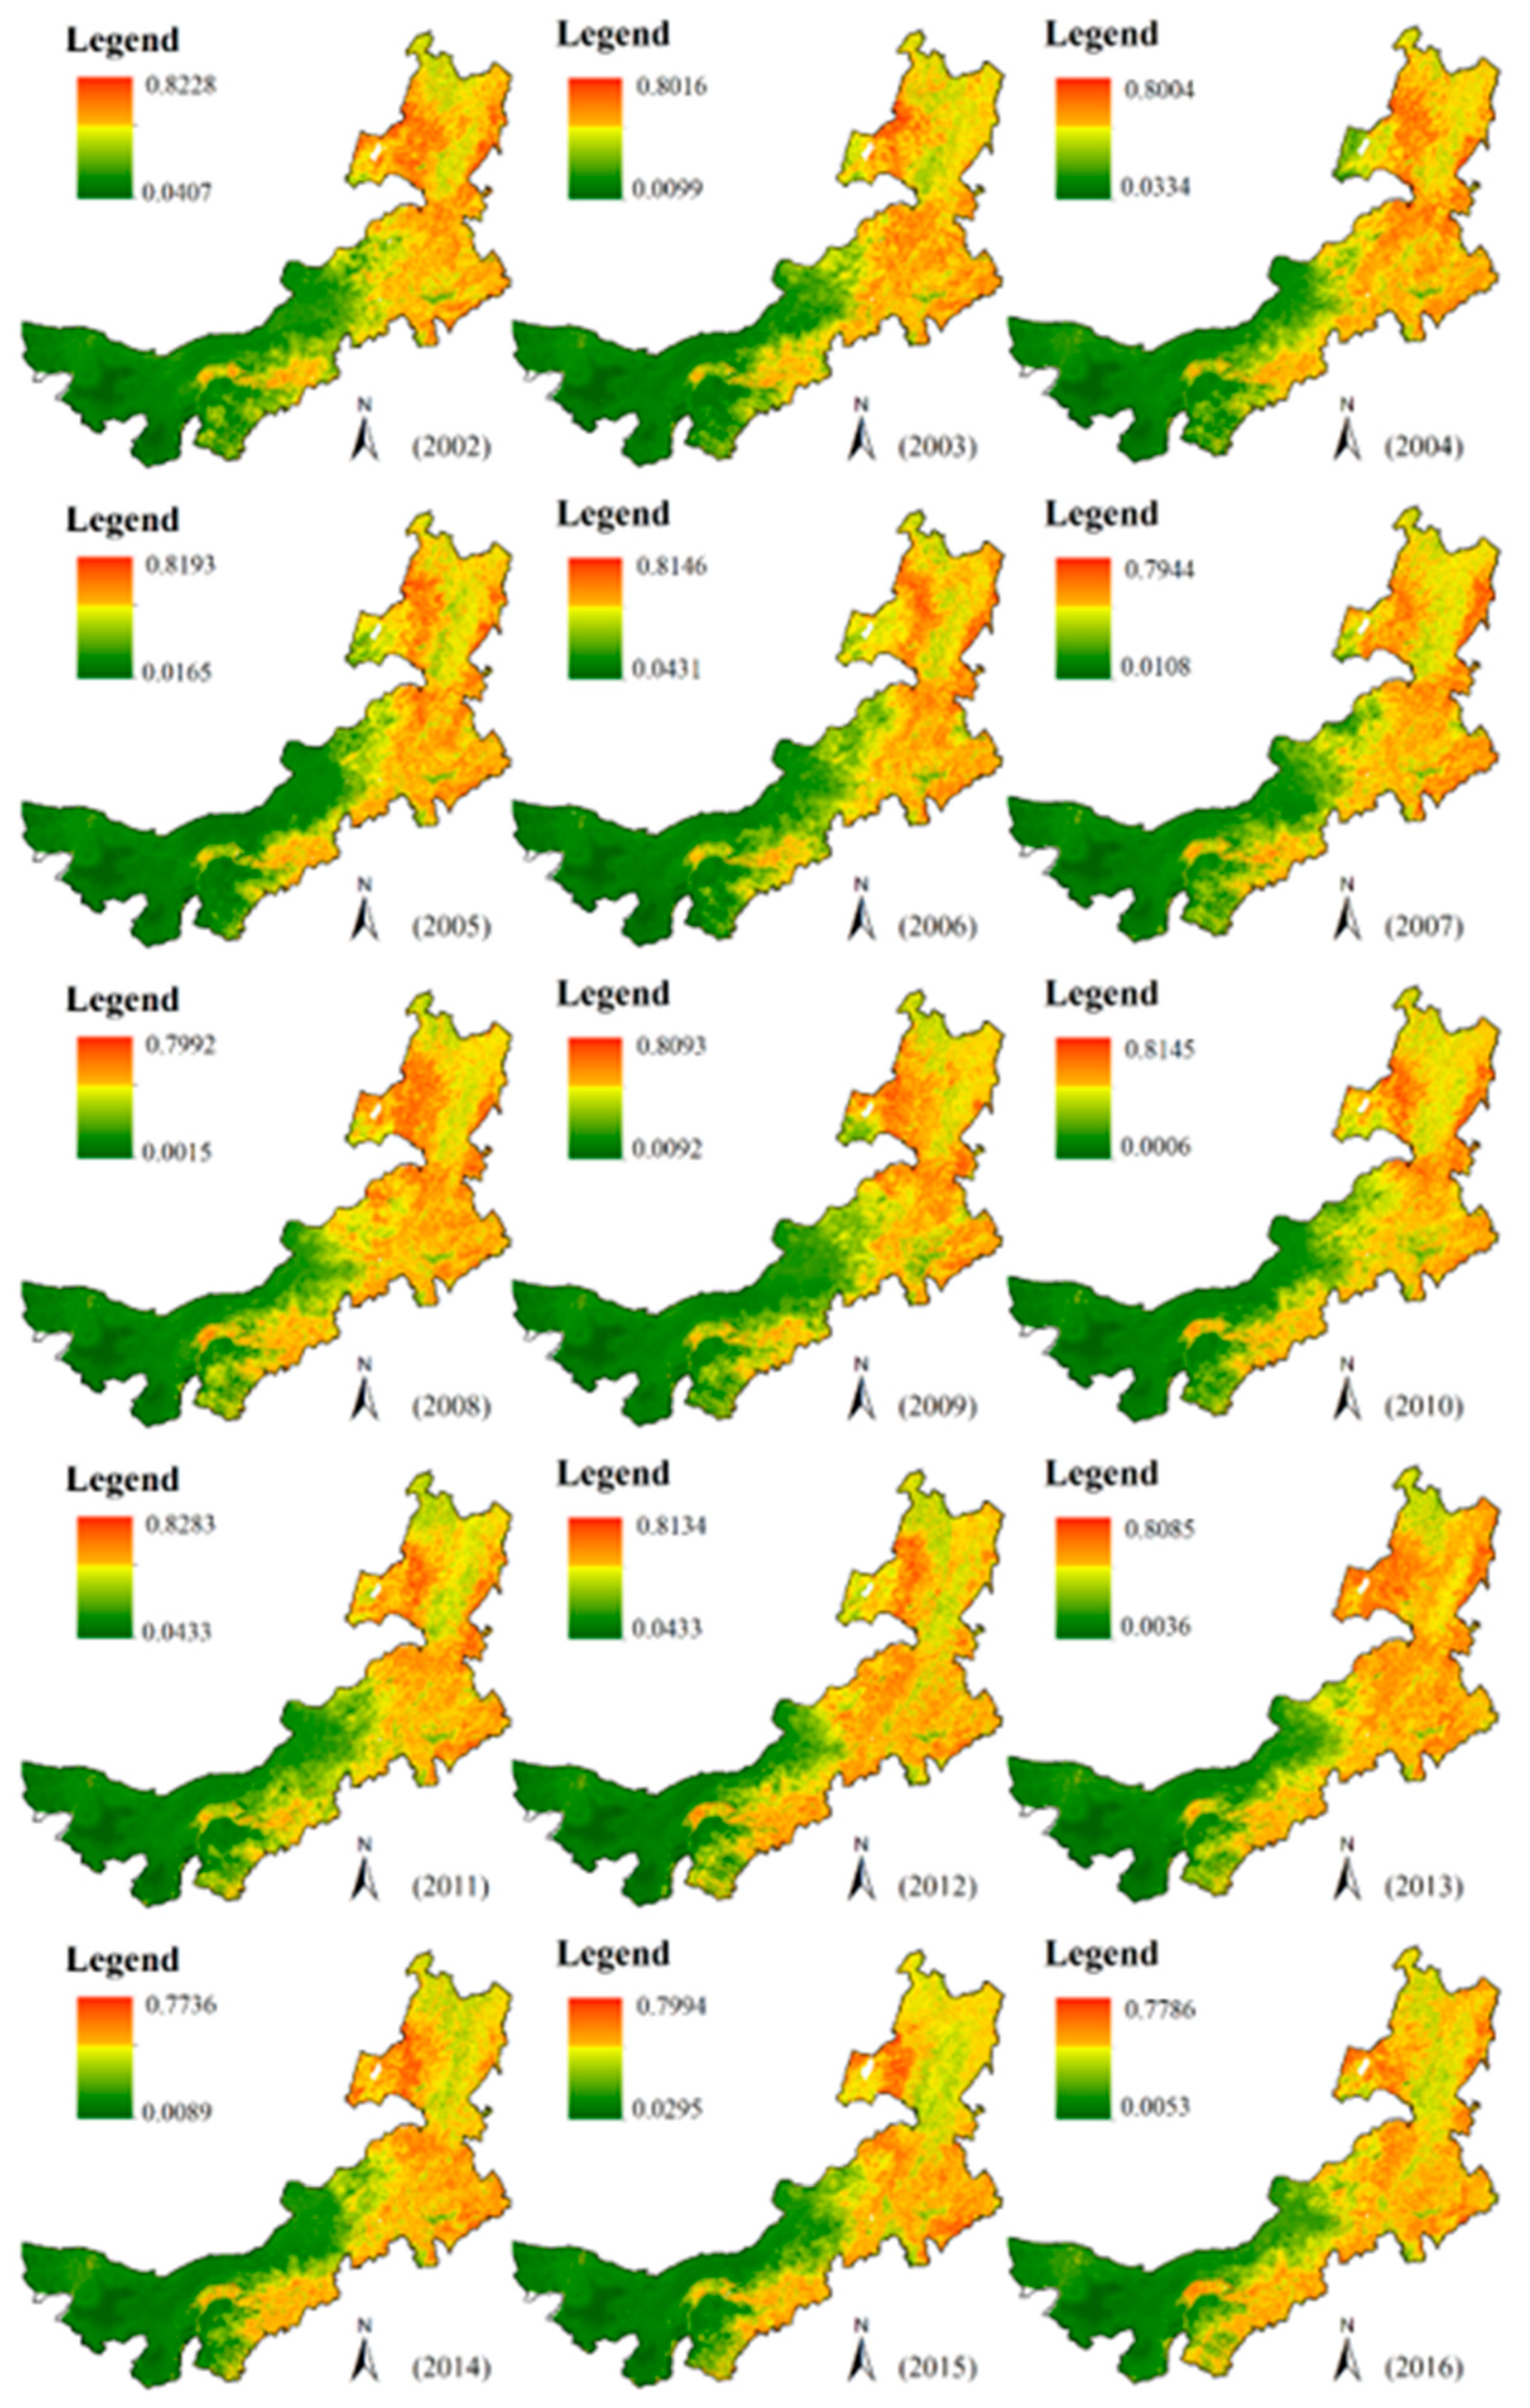
3.2. Spatial–Temporal Variability of Fires

The spatial distribution of burned areas and fire hotspots in Inner Mongolia between 2002 and 2016 derived from MODIS satellite data are displayed in Figure 3. We found that both burned areas and fire hotspots showed a gradual decrease from the northeast to the southwest. Most fires were concentrated in (1) the border region between China and Mongolia, (2) a forest–grassland belt and (3) typical arable zones (e.g., Hetao Plain). Much higher fire recurrence showed in these areas. Meanwhile, we observed fire (hotspots or burned scars) in one place once; sometimes, we could also find fire scars in the same place or nearby that had occurred earlier. This suggests that areas affected by fires can be expected to become more vulnerable to recurrent fires.
Burned areas and fire hotspots in Inner Mongolia presented a large variation between years (Figure 4). As a whole, the average burned area in the study zone over the 15-year period was 3089 km2, while the average number of fire hotspots was 793. The largest burned area occurred in 2003, with almost 15,000 km2 burned, while the lowest of 331 km2 occurred in 2016. The highest number of fire hotspots of over 1500 occurred in 2014, with the lowest number of 292 occurring in 2004. Over the time period considered in this study, the total area burned annually displayed a decreasing trend, while the trend in the number of fire hotspots was increasing.
The fire was found to be concentrated in two periods, between February to May and between August to October (Figure 5). September was the month with the most fires, followed by April, May, March, February, October and August. Based on this, we determined that these seven months were the fire season in Inner Mongolia.

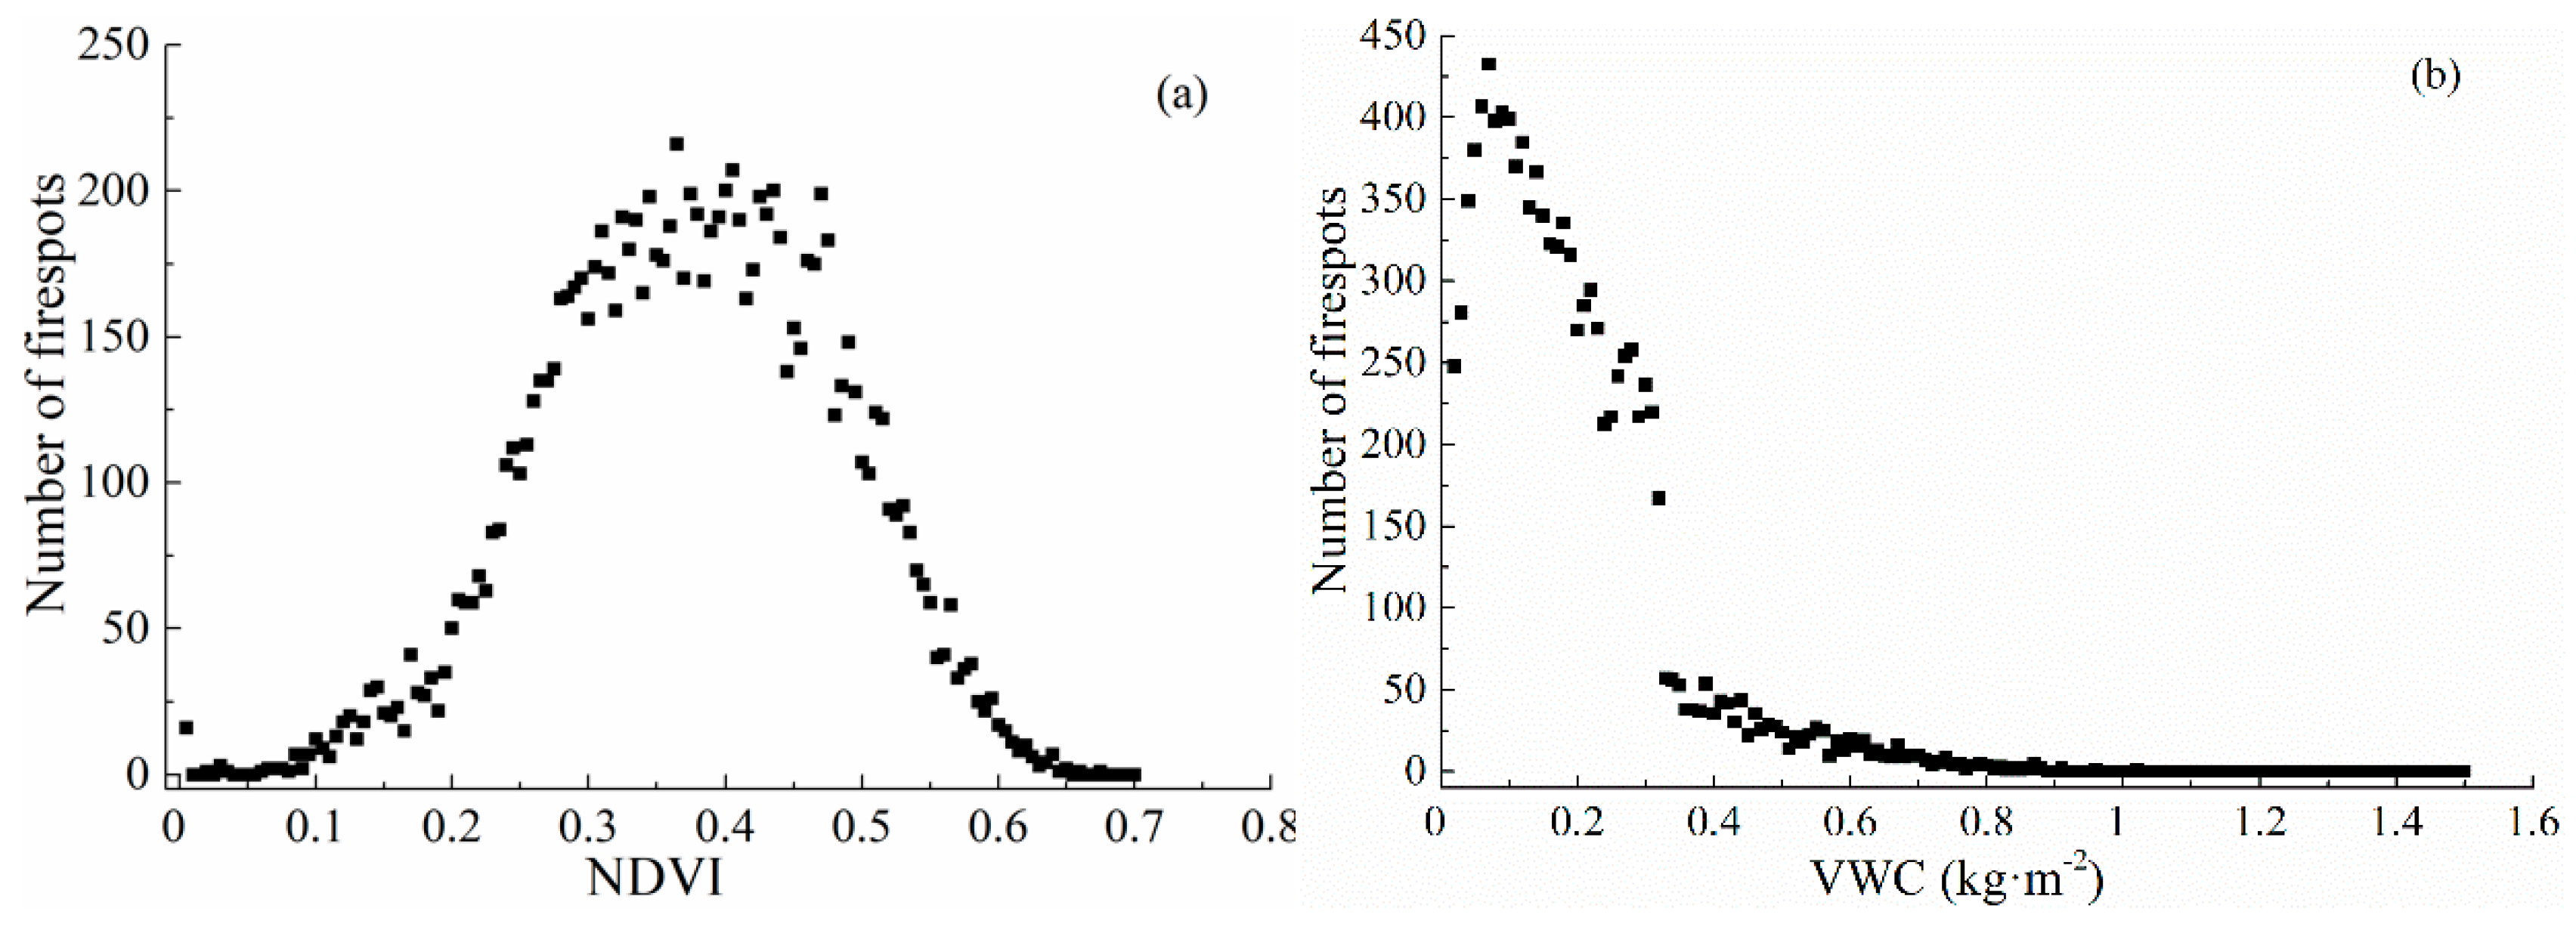
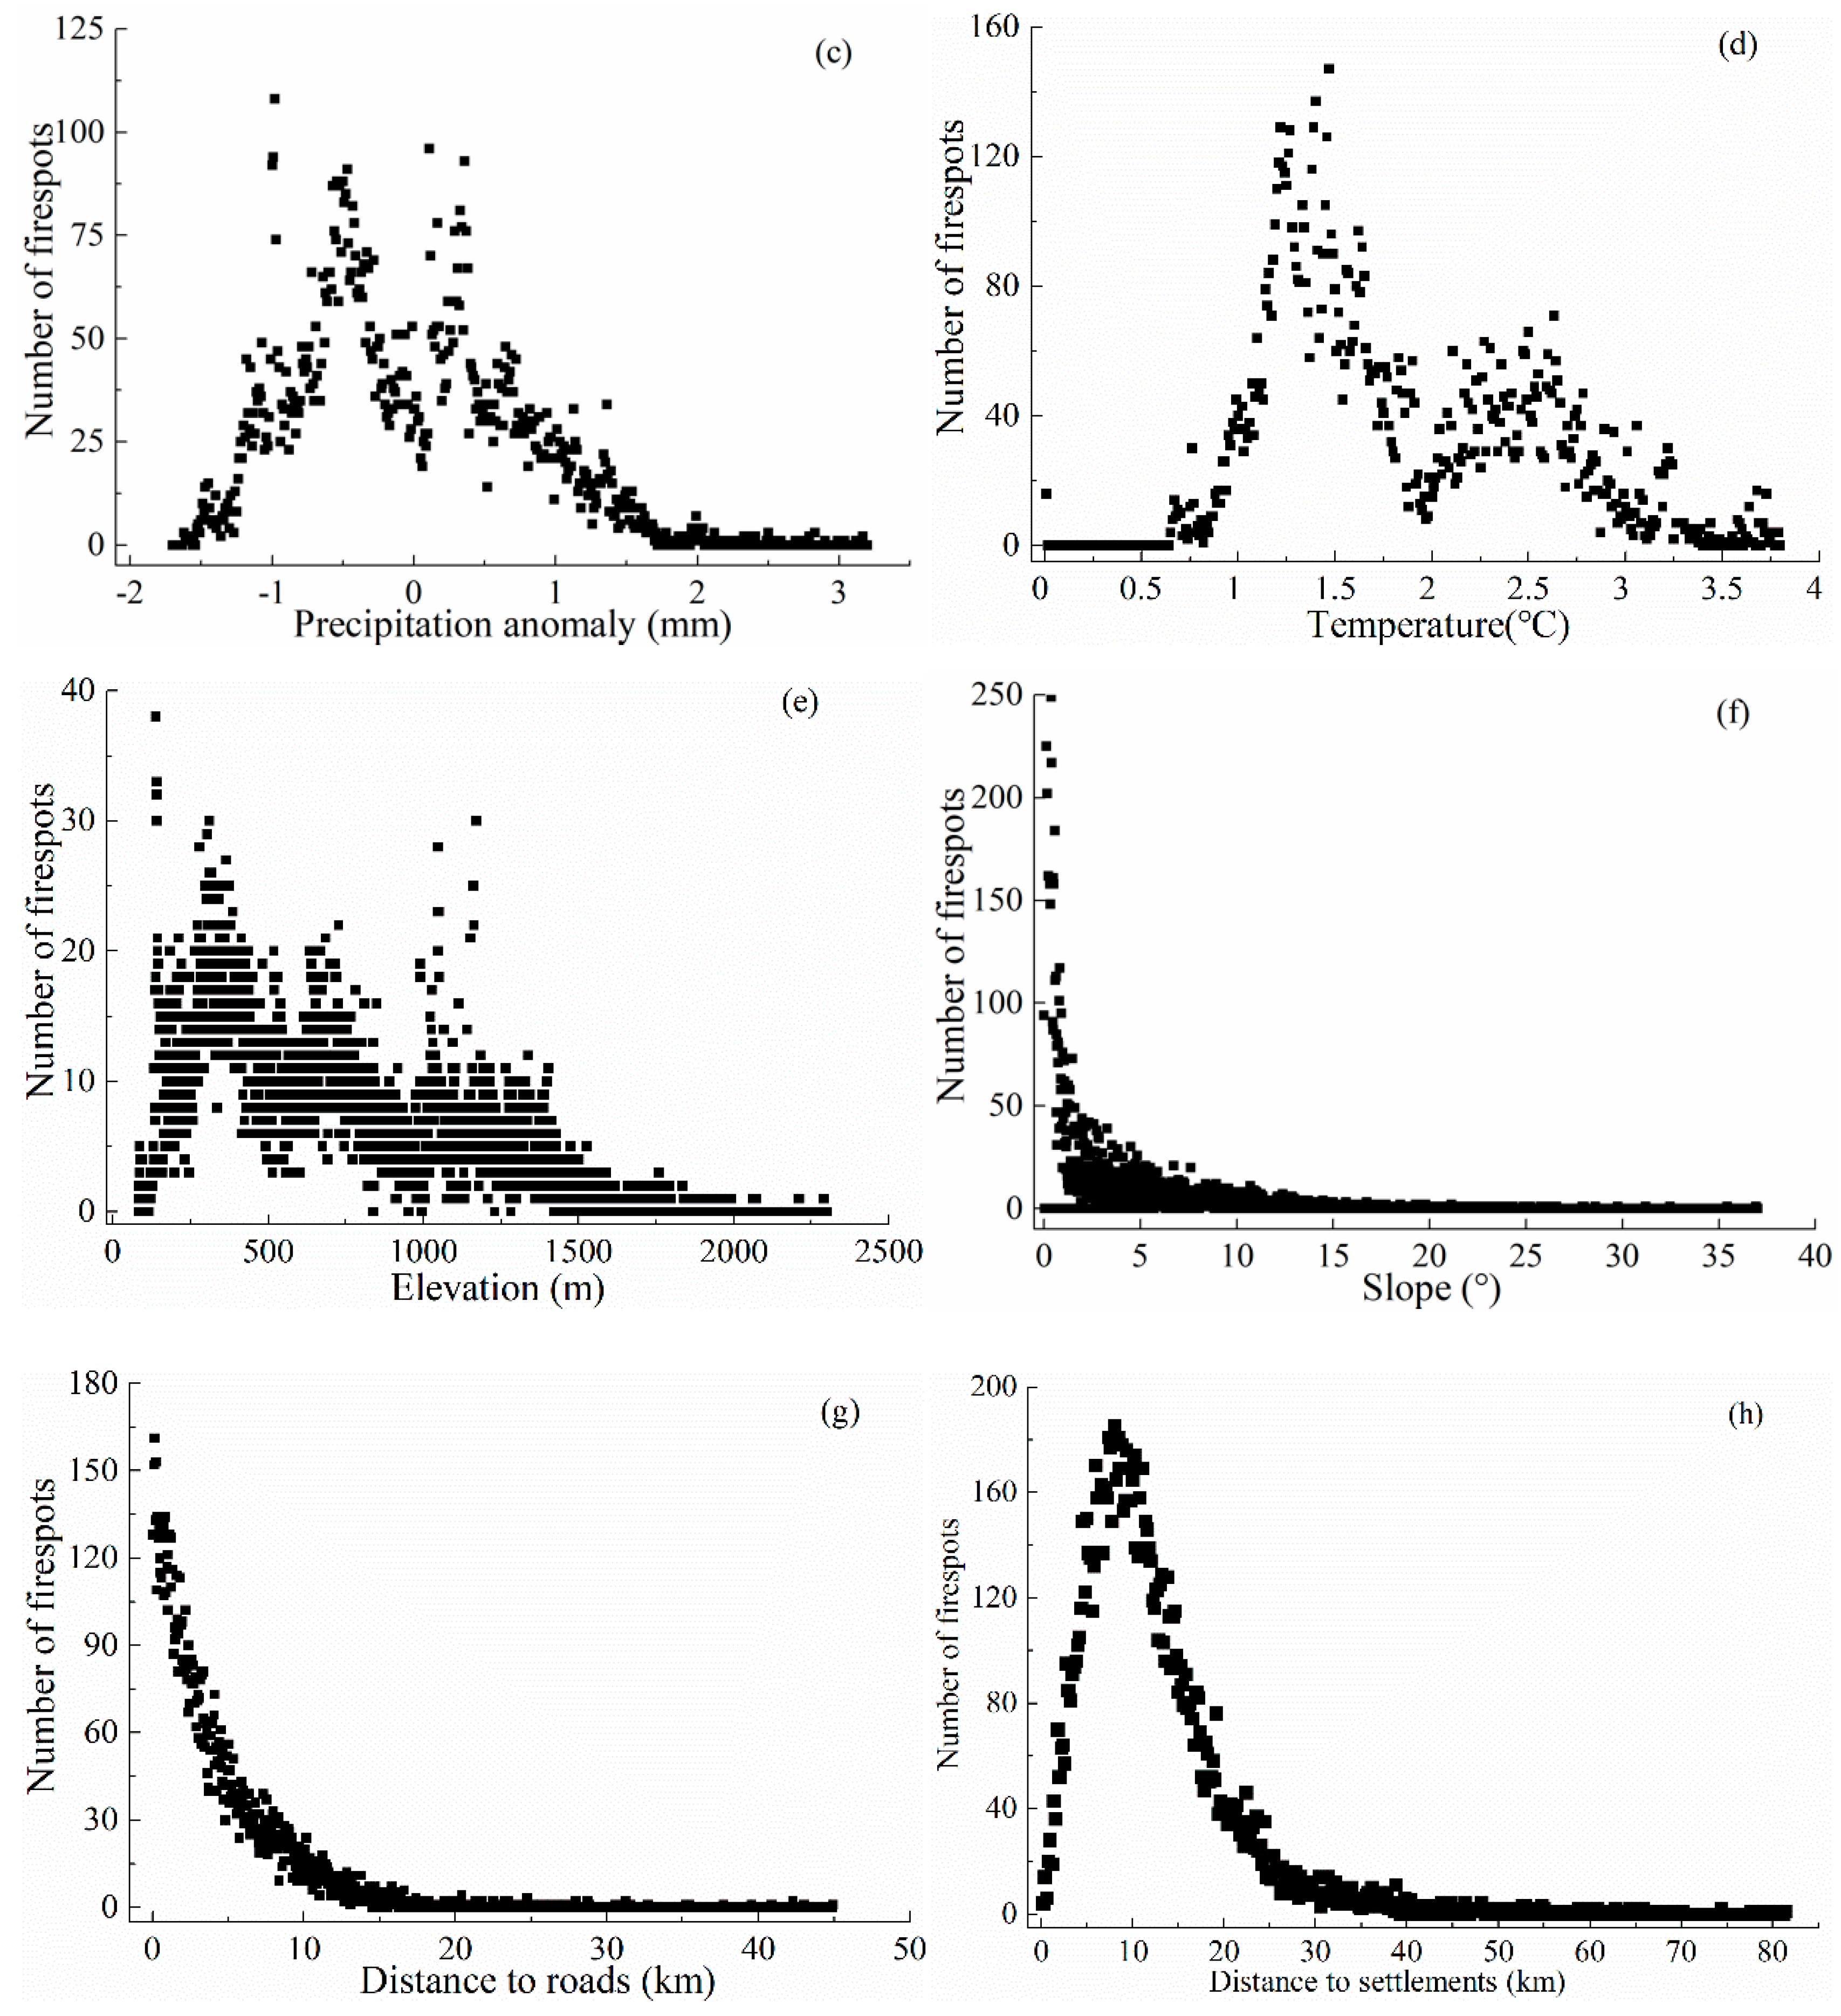
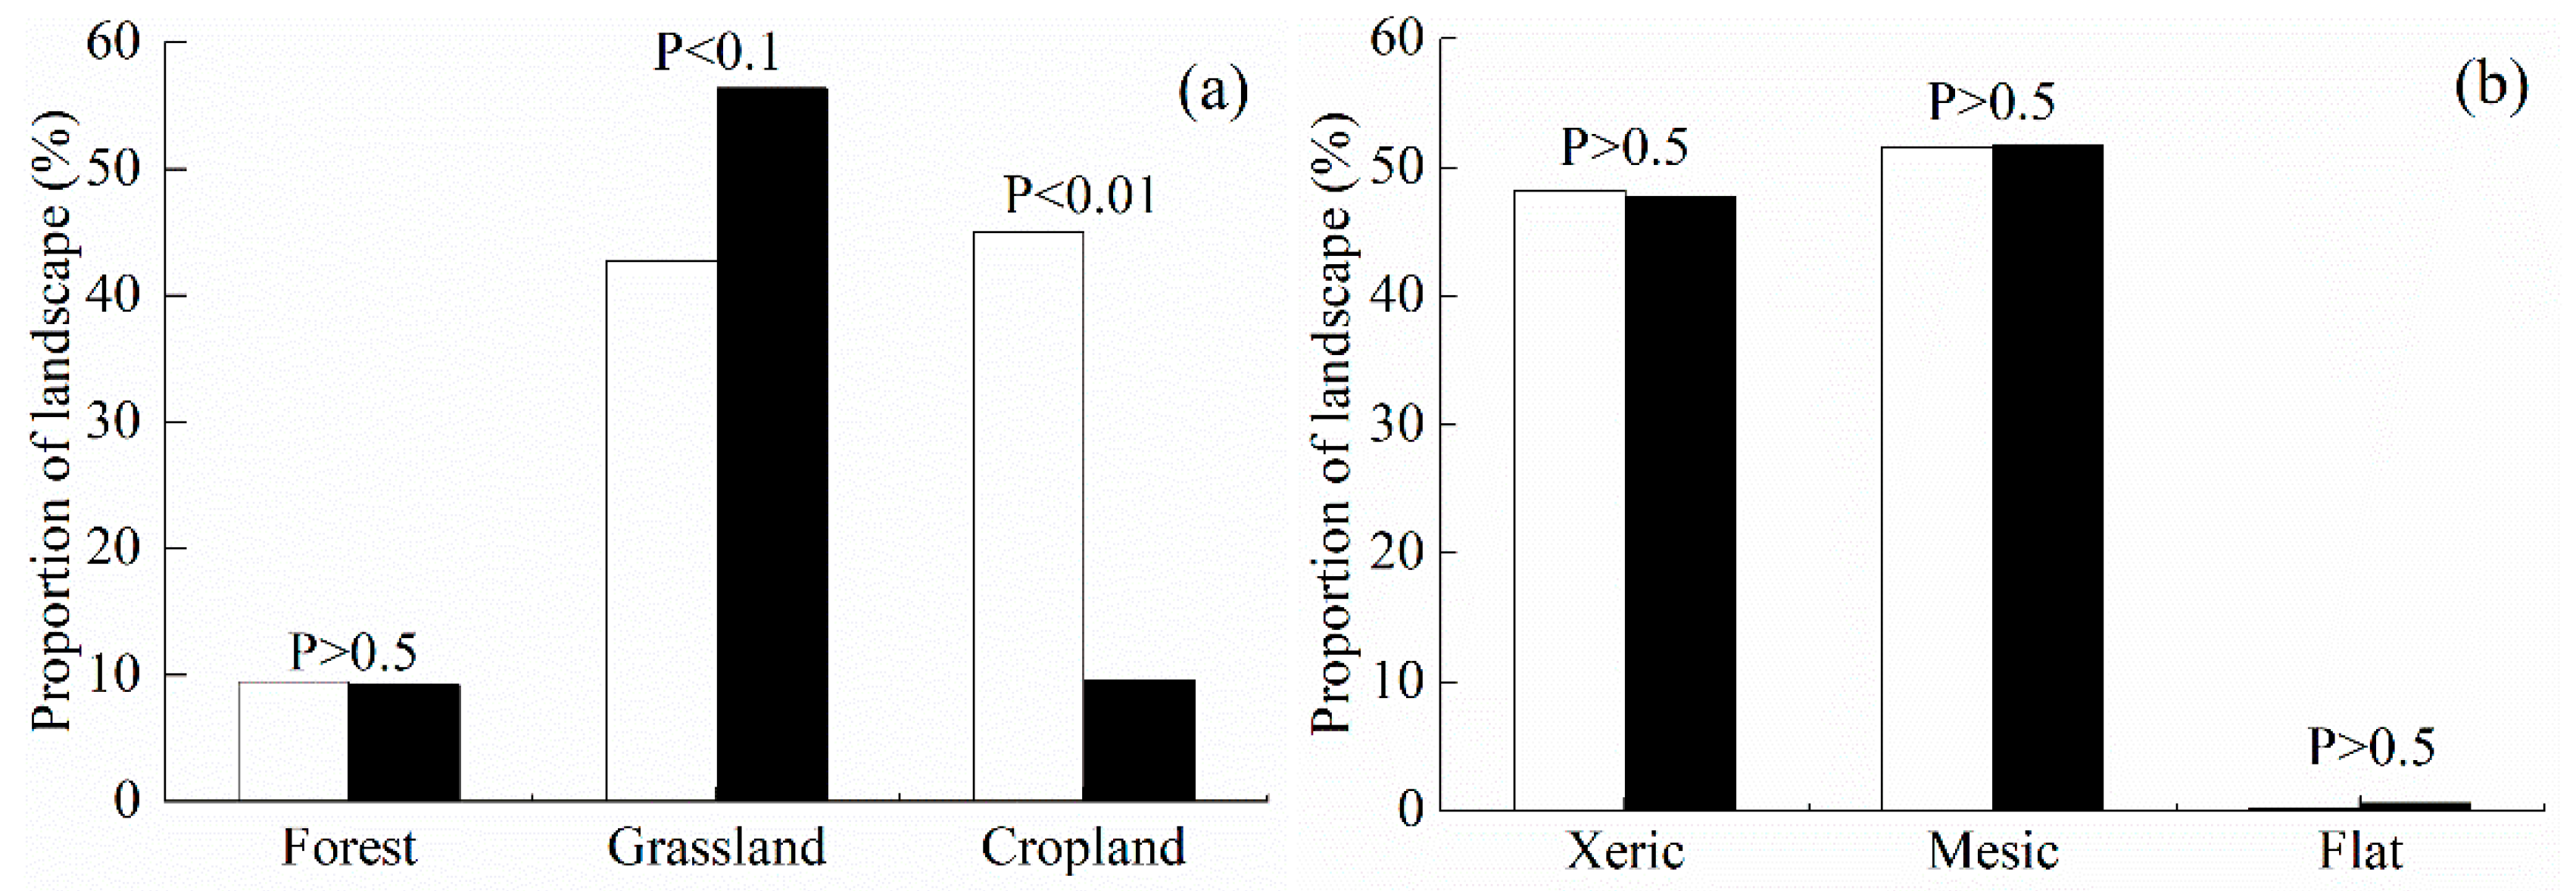
3.3. Correlation between Driving Factors and Fire Regime

The impact of the NDVI and the VWC on fire hotspots were similar, that is the fire hotspots tended to firstly increase and then decrease (Figure 6a,b). Climate variables showed a complex interaction with fire hotspots, where the number of fire hotspots showed a double-peak structure with the temperature and precipitation anomalies in fire season (Figure 6c,d). Otherwise, the effect of different topographic factors on the number of fire hotspots were different. Fire hotspots generally increased at first and then declined because the elevation was greater than 450 m despite a few upward blips (Figure 6e). Along with the increase of slope, the number of fire hotspots showed a downward trend all the time (Figure 6f). In addition, human infrastructure such as roads and settlements were strongly related with fire activity. Fire was found to always occur in areas near roads and settlements (Figure 6g,h).
Based on this, we found the relationship between certain factors and the number of fire hotspots did not present a simple increasing or decreasing trend (e.g., NDVI, vegetation water content, mean temperature, precipitation anomalies in fire season, elevation, and distance to settlements). They behaved differently within different ranges. Here, in order to achieve a better performance in subsequent model building, the turning points between these factors and fire hotspots were identified. The number of fire hotspots increased at first, reaching peaks at 0.38 and 0.11kg m−2, and then they decreased with the NDVI and vegetation water content, respectively (Figure 6a,b). There were two peaks at mean temperatures of 1.5 and 2.5 °C, while the precipitation anomalies in the fire season were −0.5 and 0.5 mm, respectively (Figure 6c,d). The breakpoint appeared in 450 m for elevation, although there were some fluctuations when the elevation was greater than 450 m (Figure 6e). There was a turning point in 10 km for the distance to settlements (Figure 6g).
As the categorical variables, land use type significantly affected the fire hotspots numbers (χ2 = 152.70, df = 3, P < 0.0001; Figure 7a), while aspect did not significantly affect the number of fire hotspots (χ2 = 0.27, df = 3, P > 0.5; Figure 7b). According to the result, we put land use type, the only categorical variable, into the fire risk model.

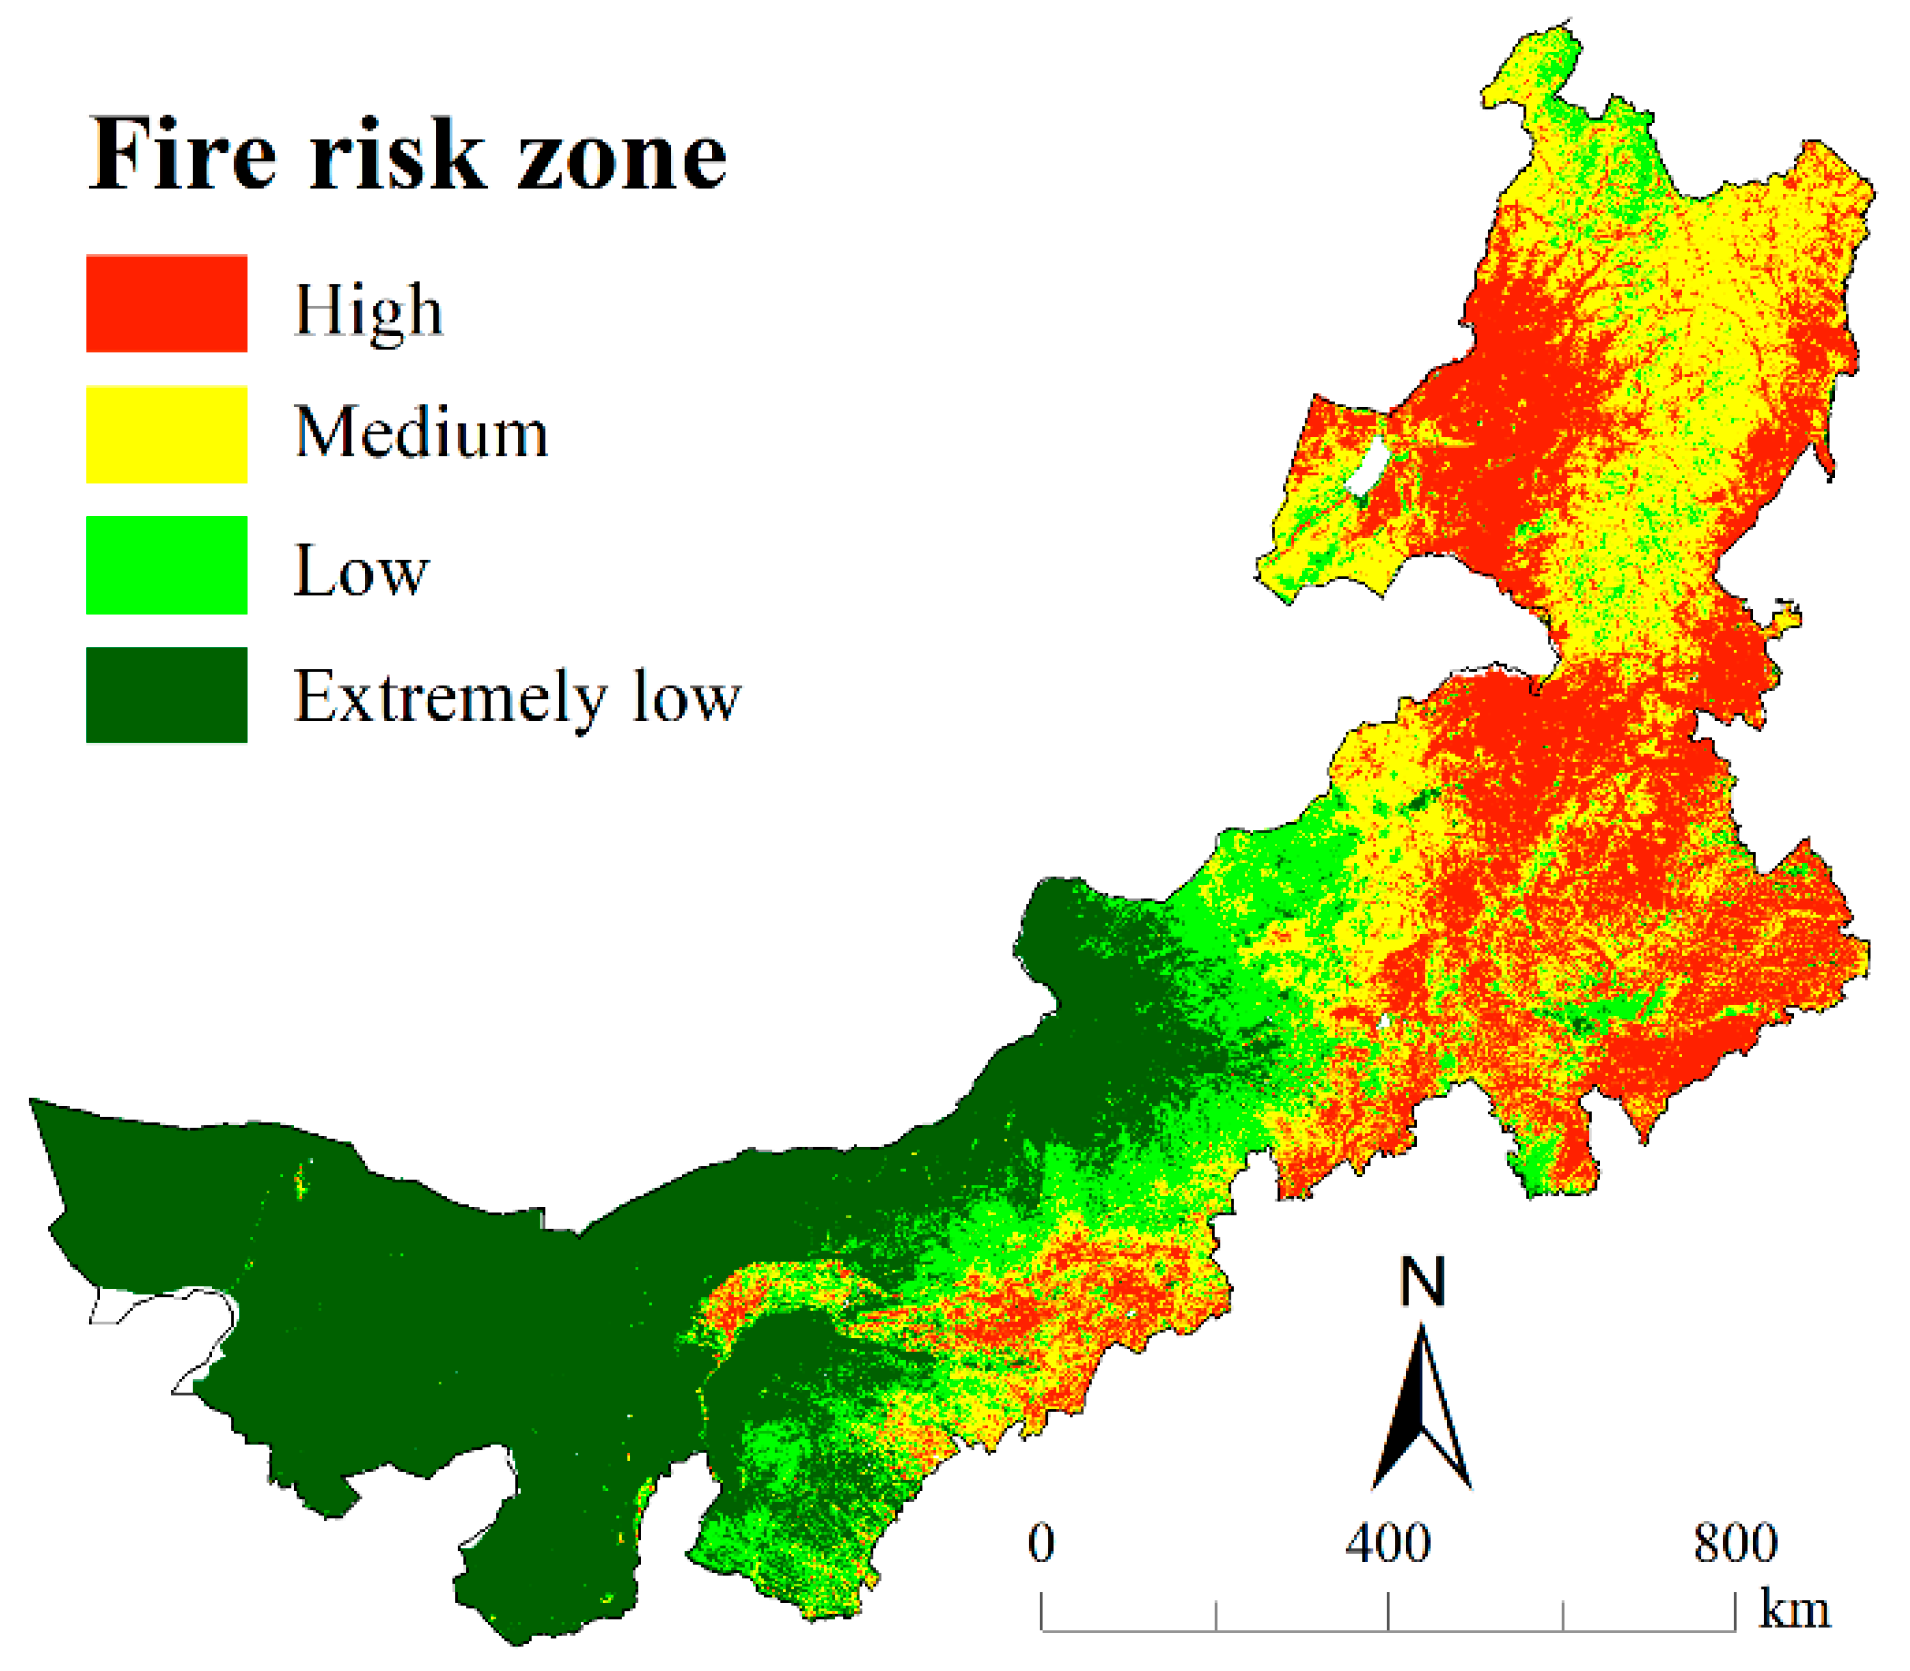
3.4. Fire Risk Mapping

Using all the variables except aspect and applying the model with Formula (10), the fire risk maps for Inner Mongolia were generated, one image per year (Figure 8). There was an obvious regional difference in distribution of fire risk, being higher in the northeast and lower in the southwest, which is generally consistent with the distribution of fire hotspots and burned areas extracted from the MODIS satellite data.
To be a better reference for the local fire department, the fire risk map was divided into four classes (extremely low risk, low risk, moderate risk, and high risk) based on the natural break method after taking the average value during the 15 years (Figure 9).
In order to fully verify the reliability of the zoning results, we summed the fire hotspots numbers and burned areas in each fire class, and we then calculated the percentage of fire hotspots and burned areas in each fire risk zone (Figure 10). Over 90% of fire hotspots and burned areas occurred in medium and high-risk areas.

4. Discussion

The spatial resolution of MODIS products was often considered too coarse for fire monitoring work for some small research areas. Initially, we intended to use fire record data collected by local governments. However, such a large study area made it difficult to collect the fire record data, which was not accessible to the public, especially for recent years’ data. Considering that MODIS products can effectively preform the monitoring of fire in large areas and the precise monitoring of fire on remote and less accessible mountain areas that may be ignored by local governments in fire data records, we chose the MODIS products as the main fire data sources. In addition, in order to test the applicability of MODIS in Inner Mongolia, we selected four cases to compare the accuracy of the burned areas from the MCD45A1 dataset and Landsat images. The results showed that the MCD45A1 dataset had a good performance in these four cases with an accuracy above 70%, though more verification work needs to be carried out in future research. Identifying fire risk factors is the first step for fire risk assessment, and, in this paper, we explored the influence of climatic (mean temperature and precipitation anomaly), vegetation (NDVI, vegetation water content, and land use type), topographic (elevation, slope, and aspect) and anthropic variables (distance to roads and distance to settlement areas) in the fire season on fire occurrences in Inner Mongolia. Through this work, a time-variant model for fire occurrence in Inner Mongolia has been developed. The model has a variety of uses in many fields and has been applied by many scholars. By adding a quantitative analysis, we were able to overcome the shortcomings of model in order to make the appraisement more objective.
Global and regional fire studies have shown that the interaction between fire and climate is quite complex. Bowman [42] perceived that climate was the leading driver, especially for large fires. Our results support the idea that fire is very related to climate. The influence of climate on fire has mainly manifested in the change of precipitation and temperature, which change the accumulation of fuel, thus affecting fire frequency and intensity [37]. However, how to deal with fire risk under future climate change have not been considered, although the Intergovernmental Panel on Climate Change (IPCC) has shown that there has been an upward trend in global mean surface temperature, and the average warming of land is greater than that of oceans under various climate scenarios [43].
Topography affects the formation of vegetation and the meteorological conditions in the local scale, and then it affects the occurrence and spread speed of fires. Fires often occur in low and flat areas. Some results have shown that the effect of slope on fire is mainly manifested in the direction that the slope receiving more solar radiation will develop in favor of fire occurrence and spread [44,45]. However, the results of our study are consistent with those of [46], showing that there is no significant positive or negative correlation between number of fire hotspots and slope.
The NDVI, land use type and vegetation water content were selected as factors to reveal vegetation status. Though the NDVI has been used in many current studies to characterize fuel loads [35,47,48,49], litter loads in combustibles (hay/withered grass) may be more accurate than the NDVI in reflecting the status of combustibles. However, due to the complexity of litter spectral characteristics, the inversion of litter loads on a large scale by remote sensing is not easy to obtain. For the same surface or local scale, the litter load and spectral characteristics can be well-measured in sampling points through field observation experiments, the relationship between the actual reflectance and remote sensing image reflectance can established, and we then can indirectly obtain the litter load. Nevertheless, it is difficult to establish such a correspondence on large scale (regional or global) because of the complex diversity of vegetation types.
Of all the forest and grassland fires which occurred in northeastern Inner Mongolia from 1980 to 2000, 61% were caused by human activity, 33% were not ascertained and only 6% of fires occurred due to natural factors (e.g., lightning stroke). The unexplained fires were also considered to be human-caused fires after we communicated with the staff in local fire protection offices [50]. Human-caused fire constituted the majority of fires. Our results revealed that the distance to roads showed an exponential relationship, while the distance to settlements exhibited a volcano type trend with the number of fire hotspots. The role of human being in fire has also been identified by several researchers [5,7,51,52]. Fire is more prone to happen near roads and settlements, and most fire hotspots were found to be nearly 10 km away from settlements in our research, By contrast, Tian and Zhao [53] pointed out that fire frequently occurred relatively near or far from settlements, particularly less than 1 km or more than 10 km. This inconsistency may be caused by different data sources or spatial scales. In addition, humans may exert a stronger influence on fire regimes due to the sustained population growth predicted by national census, which conducted by the Chinese government. Anthropogenic drivers are likely to be changed due to road network expansion, population increase and other development processes.
At present, China has issued the Rank of the Regionalization on Nationwide Forest Fire Risk (LY/T1 063-2008) [17] for fire risk assessment, and this provides a clear method for evaluating forest fire risk in Inner Mongolia. Fixed coefficients are given for the relative contribution of each index to the overall fire risk. Compared with the existing evaluation methods, we chose the grid cell as the basic unit and constructed the risk model combined with the relationship between fire and fire-caused factors. Different risk values were given to different vegetation types, so the fire risk assessment was no longer limited to forest fires. This provided a scientific basis for fire prevention planning according to local conditions, classified management in regional fire prevention practice, and fire risk management countermeasures.

5. Conclusions

Massive casualties and property losses have been occurred due to the high fire frequency and large burned area in Inner Mongolia. Therefore, there is an urgent need to propose a fire risk assessment framework. In this study, we presented a pixel-scale fire risk assessment scheme and achieved fire risk regionalization for Inner Mongolia during 2002~2016 based on the AHP method and MODIS burned area and active fire products. Before that, the spatial–temporal distribution of fire was first performed to identify the fire season and fire prone areas. The ten fire risk factors were chosen to establish the relationship between fire hotspots and fire variables. Our results indicate that the fire risk model has a better accuracy than the AHP method in the dynamic risk of fire occurrence predicting. The fire risk regionalization maps can provide a reference for fire management in Inner Mongolia. Moreover, it is noteworthy that the AHP method is vulnerable to subjective factors when determining the relative importance of fire risk factors. Thus, the machine learning methods such as DL, ANN, and RF can be applied to achieve the fire risk assessment with a higher accuracy in the future.

Author Contributions

Formal analysis, X.J., B.W. and G.T.; funding acquisition, Y.G.; methodology, X.J., S.W. and Z.Z.; resources, Y.G.; writing—original draft, X.J.

Funding

This study received financial support from The Key Research and Development Program of Inner Mongolia, China [Grant Nos. ZDZX2018058-3] and the Research Projects of China-Mongolia-Russia Economic Corridor Research Cooperative Innovation Center [Grant Nos. ZMEY201904].

Conflicts of Interest

The authors declare no conflict of interest.

References

  1. Chuvieco, E.; Martínez, S.; Román, M.V.; Hantson, S.; Pettinari, M.L. Integration of ecological and socio-economic factors to assess global vulnerability to wildfire. Glob. Ecol. Biogeogr. 2014, 23, 245–258. [Google Scholar] [CrossRef]
  2. Wan, S.; Hui, D.; Luo, Y. Fire Effects on Nitrogen Pools and Dynamics in Terrestrial Ecosystems: A Meta-Analysis. Ecol. Appl. 2001, 11, 1349–1365. [Google Scholar] [CrossRef]
  3. Calvo, L.; Tárrega, R.; Luis, E.D. Secondary succession after perturbations in a shrubland community. Acta Oecol. 2002, 23, 393–404. [Google Scholar] [CrossRef]
  4. Lloret, F.; Calvo, E.; Pons, X.; Díaz-Delgado, R. Wildfires and landscape patterns in the Eastern Iberian Peninsula. Landsc. Ecol. 2002, 17, 745–759. [Google Scholar] [CrossRef] [Green Version]
  5. Martinez, J.; Vega-Garcia, C.; Chuvieco, E. Human-caused wildfire risk rating for prevention planning in Spain. J. Environ. Manag. 2009, 90, 1241–1252. [Google Scholar] [CrossRef] [PubMed]
  6. Zumbrunnen, T.; Menendez, P.; Bugmann, H.; Conedera, M.; Gimmi, U.; Burgi, M. Human impacts on fire occurrence: A case study of hundred years of forest fires in a dry alpine valley in Switzerland. Reg. Environ. Chang. 2012, 12, 935–949. [Google Scholar] [CrossRef]
  7. Rodrigues, M.; de la Riva, J.; Fotheringham, S. Modeling the spatial variation of the explanatory factors of human-caused wildfires in Spain using geographically weighted logistic regression. Appl. Geogr. 2014, 48, 52–63. [Google Scholar] [CrossRef]
  8. Burgan, R.E.; Klaver, R.W.; Klaver, J.M. Fuel Models and Fire Potential from Satellite and Surface Observations. Int. J. Wildland Fire 1998, 8, 159–170. [Google Scholar] [CrossRef]
  9. Clark, J.S. Effect of climate change on fire regimes in northwestern Minnesota. Nature 1988, 334, 233–235. [Google Scholar] [CrossRef]
  10. Neary, D.G.; Klopatek, C.C.; Debano, L.F.; Ffolliott, P.F. Fire effects on belowground sustainability: A review and synthesis. For. Ecol. Manag. 1999, 122, 51–71. [Google Scholar] [CrossRef]
  11. Chang, Y.; Zhu, Z.L.; Chen, H.W.; Hu, Y.M.; Bu, R.C.; Feng, Y.T.; Wang, Z.C. Predicting fire occurrence patterns with logistic regression in Heilongjiang Province, China. Landsc. Ecol. 2013, 28, 1989–2004. [Google Scholar] [CrossRef]
  12. Liu, Z.H.; Yang, J.; Chang, Y.; Weisberg, J.P.; He, S.H. Spatial patterns and drivers of fire occurrence and its future trend under climate change in a boreal forest of Northeast China. Glob. Chang. Biol. 2012, 18, 2041–2056. [Google Scholar] [CrossRef]
  13. Chang, Y.; Zhu, Z.L.; Feng, Y.T.; Li, Y.H.; Bu, R.C.; Hu, Y.M. The spatial variation in forest burn severity in Heilongjiang Province, China. Nat. Hazards 2016, 81, 981–1001. [Google Scholar] [CrossRef]
  14. Fang, L.; Yang, J.; Zu, J.X.; Li, G.C.; Zhang, J.S. Quantifying influences and relative importance of fire weather, topography, and vegetation on fire size and fire severity in a Chinese boreal forest landscape. For. Ecol. Manag. 2015, 356, 2–12. [Google Scholar] [CrossRef]
  15. Hu, T.; Zhou, G. Drivers of lightning-and human-caused fire regimes in the Great Xing’an Mountains. For. Ecol. Manag. 2014, 329, 49–58. [Google Scholar] [CrossRef]
  16. Guo, F.T.; Su, Z.W.; Wang, G.Y.; Sun, L.; Tigabu, M.; Yang, X.J.; Hu, H.Q. Understanding fire drivers and relative impacts in different Chinese forest ecosystems. Sci. Total Environ. 2017, 605, 411–425. [Google Scholar] [CrossRef]
  17. NFGA. Rank of the Regionalization on Nationwide Forest Fire Risk (LY/T 1063--2008); Standards Press of China: Beijing, China, 2008. [Google Scholar]
  18. Zhang, J.; Fan, J.; Liu, X.; Yang, H.; Tong, Z. Assessment and Prediction of Grassland Fire Disaster in Hulunbeir. J. Catastrophol. 2010, 25, 35–38. [Google Scholar]
  19. Liu, G.; He, S.U.; Shilei, L.I. The Summarization on the Fire Accident of Grassland in Inner Mongolia. Grassl. China 1999, 4, 76–78. [Google Scholar]
  20. Zhao, F. Changes in the Occurring Date of Forest Fires in the Inner Mongolia Daxing’anling Forest Region Under Global Warming. Sci. Silvae Sin. 2009, 473, 377–403. [Google Scholar]
  21. Zhang, J. Forestry Statistical Yearbook of China; China Forestry Publishing House: Beijing, China, 2014. [Google Scholar]
  22. IMSY. Inner Mongolia Statistical Yearbook; China Statistical Publishing House: Beijing, China, 2014. [Google Scholar]
  23. Fang, H. Science Yearbook; Technology and Science Publishing House: Shanghai, China, 1988. [Google Scholar]
  24. Eskandari, S.; Chuvieco, E. Fire danger assessment in Iran based on geospatial information. Int. J. Appl. Earth Obs. Geoinf. 2015, 42, 57–64. [Google Scholar] [CrossRef]
  25. Hong, H.; Jaafari, A.; Zenner, E.K. Predicting spatial patterns of wildfire susceptibility in the Huichang County, China: An integrated model to analysis of landscape indicators. Ecol. Indic. 2019, 101, 878–891. [Google Scholar] [CrossRef]
  26. Nieto, H.; Aguado, I.; García, M.; Chuvieco, E. Lightning-caused fires in Central Spain: Development of a probability model of occurrence for two Spanish regions. Agric For. Meteorol. 2012, 162–163, 35–43. [Google Scholar] [CrossRef]
  27. Mar, B.; Eduardo, C.; Manuel, J.S.-T. Application of artificial neural networks and logistic regression to the prediction of forest fire danger in Galicia using MODIS data. Int. J. Wildland Fire 2012, 21, 1025–1029. [Google Scholar]
  28. Sakr, G.E.; Elhajj, I.H.; Mitri, G. Efficient forest fire occurrence prediction for developing countries using two weather parameters. Eng. Appl. Artif. Intell. 2011, 24, 888–894. [Google Scholar] [CrossRef]
  29. Vasilakos, C.; Kalabokidis, K.; Hatzopoulos, J.; Matsinos, I. Identifying wildland fire ignition factors through sensitivity analysis of a neural network. Nat. Hazards 2009, 50, 125–143. [Google Scholar] [CrossRef]
  30. Maeda, E.E.; Formaggio, A.R.; Shimabukuro, Y.E.; Arcoverde, G.F.B.; Hansen, M.C. Predicting forest fire in the Brazilian Amazon using MODIS imagery and artificial neural networks. Int. J. Appl. Earth Obs. Geoinf. 2009, 11, 265–272. [Google Scholar] [CrossRef]
  31. Oliveira, S.; Oehler, F.; San-Miguel-Ayanz, J.; Camia, A.; Pereira, C.M.J. Modeling spatial patterns of fire occurrence in Mediterranean Europe using Multiple Regression and Random Forest. For. Ecol. Manag. 2012, 275, 117–129. [Google Scholar] [CrossRef]
  32. Zhang, L.; Verma, B. A deep neural network and rule-based technique for fire risk identification in video frames. Pattern Anal. Appl. 2019, 22, 187–203. [Google Scholar] [CrossRef]
  33. Puri, K.; Areendran, G.; Raj, K.; Mazumdar, S.; Joshi, K.P. Forest fire risk assessment in parts of Northeast India using geospatial tools. J. For. Res. 2011, 22, 641–647. [Google Scholar] [CrossRef]
  34. Mundo, A.I.; Wiegand, T.; Kanagaraj, R.; Kitzberger, T. Environmental drivers and spatial dependency in wildfire ignition patterns of northwestern Patagonia. J. Environ. Manag. 2013, 123, 77–87. [Google Scholar] [CrossRef]
  35. Manzo-delgado, L.; Sánchez-Colón, S.; Álvarez, R. Assessment of seasonal forest fire risk using NOAA-AVHRR: A case study in central Mexico. Int. J. Remote Sens. 2009, 30, 4991–5013. [Google Scholar] [CrossRef]
  36. Levin, N.; Heimowitz, A. Mapping spatial and temporal patterns of Mediterranean wildfires from MODIS. Remote Sens. Environ. 2012, 126, 12–26. [Google Scholar] [CrossRef]
  37. Armenteras-Pascual, D.; Retana-Alumbreros, J.; Molowny-Horas, R.; Roman-Cuesta, R.M.; Gonzalez-Alonso, F.; Morales-Rivas, M. Characterising fire spatial pattern interactions with climate and vegetation in Colombia. Agric. For. Meteorol. 2011, 151, 279–289. [Google Scholar] [CrossRef]
  38. Ren, Z.C.; Zhu, H.Z.; Liu, X.N. Spatio-temporal differentiation of land covers on annual scale and its response to climate and topography in arid and semi-arid region. Trans. Chin. Soc. Agric. Eng. 2012, 28, 205–214. [Google Scholar]
  39. Wei, B.; Xie, Y.; Jia, X.; Wang, X.; He, H.; Xue, X. Land use/land cover change and it’s impacts on diurnal temperature range over the agricultural pastoral ecotone of Northern China. Land Degrad. Dev. 2018, 29, 3009–3020. [Google Scholar] [CrossRef]
  40. Jackson, J.T.; Vine, L.M.D.; Hsu, Y.A.; Oldak, A.; Starks, J.P.; Swift, T.C.; Isham, D.J.; Haken, M. Soil moisture mapping at regional scales using microwave radiometry: The Southern Great Plains hydrology experiment. IEEE Trans. Geosci. Remote Sens. 1999, 37, 2136–2151. [Google Scholar] [CrossRef]
  41. Saaty, T.L. The Analytic Hierarchy Process; McGraw Hill: New York, NY, USA, 1980. [Google Scholar]
  42. Bowman, D.M.J.S.; Balch, J.K.; Artaxo, P.; Bond, W.J.; Carlson, J.M.; Cochrane, M.A.; Antonio, C.M.D.; DeFries, R.S.; Doyle, J.C.; Harrison, S.P.; et al. Fire in the earth system. Science 2009, 324, 481–484. [Google Scholar] [CrossRef]
  43. IPCC. Summary for Policymakers of Climate Change 2013: The Physical Science Basis; Cambridge University Press: Cambridge, UK, 2013. [Google Scholar]
  44. Miller, J.D.; Thode, A.E. Quantifying burn severity in a heterogeneous landscape with a relative version of the delta Normalized Burn Ratio (dNBR). Remote Sens. Environ. 2007, 109, 66–80. [Google Scholar] [CrossRef]
  45. Tessler, N.; Wittenberg, L.; Malkinson, D.; Beeri, O.; Halutzy, A. Spatial and temporal patterns of vegetation recovery following sequences of forest fire in a Mediterranean landscape, Mt. Carmel Israel. Catena 2007, 71, 76–83. [Google Scholar]
  46. Hegeman, E.E.; Zachmann, J.L.; Dickson, G.B. Probabilistic models of fire occurrence across National Park Service units within the Mojave Desert Network, USA. Landsc. Ecol. 2014, 29, 1587–1600. [Google Scholar] [CrossRef]
  47. Pan, J.; Wang, W.; Li, J. Building probabilistic models of fire occurrence and fire risk zoning using logistic regression in Shanxi Province, China. Nat. Hazards 2016, 81, 1879–1899. [Google Scholar] [CrossRef]
  48. Wang, L.T.; Zhou, Y.; Zhou, W.Q.; Wang, S.X. Fire danger assessment with remote sensing: A case study in Northern China. Nat. Hazards 2013, 65, 819–834. [Google Scholar] [CrossRef]
  49. Lozano, J.F.; Suárez-Seoane, S.; Kelly, M.; Luis, E. A multi-scale approach for modeling fire occurrence probability using satellite data and classification trees: A case study in a mountainous Mediterranean region. Remote Sens. Environ. 2008, 112, 708–719. [Google Scholar] [CrossRef]
  50. Li, X. Study of Forest and Grasslands Conflagration Law and Early Warning in the North-East of Inner Mongolia; Chinese Academy of Agricultural Sciences: Beijing, China, 2007. [Google Scholar]
  51. Calvino-Cancela, M.; Chas-Amil, L.M.; García-Martínez, D.E.; Touza, J. Interacting effects of topography, vegetation, human activities and wildland-urban interfaces on wildfire ignition risk. For. Ecol. Manag. 2017, 397, 10–17. [Google Scholar] [CrossRef] [Green Version]
  52. Guo, F.; Innes, L.J.; Wang, G.; Ma, X.; Sun, L.; Hu, H.; Su, Z. Historic distribution and driving factors of human-caused fires in the Chinese boreal forest between 1972 and 2005. J. Plant Ecol. 2015, 8, 480–490. [Google Scholar] [CrossRef]
  53. Tian, X.R.; Zhao, F.J.; Shu, L.F.; Wang, M.Y. Distribution characteristics and the influence factors of forest fires in China. For. Ecol. Manag. 2013, 310, 460–467. [Google Scholar] [CrossRef]
Figure 1. Location of study area.
Sustainability 11 06263 g001
Figure 2. The flowchart map.
Sustainability 11 06263 g002
Figure 3. Spatial distribution of (a) burned areas and (b) fire hotspots in Inner Mongolia during 2002 and 2016 derived from MODIS sensor.
Sustainability 11 06263 g003
Figure 4. The annual variation of burned areas and fire hotspots in Inner Mongolia from 2002 to 2016.
Sustainability 11 06263 g004
Figure 5. Seasonal distribution of burned area in Inner Mongolia.
Sustainability 11 06263 g005
Figure 6. Correlation between driving factors and number of fire hotspots: (a) NDVI; (b) VWC; (c) precipitation anomaly; (d) temperature; (e) elevation; (f) slope; (g) distance to roads and (h) distance to settlements.
Sustainability 11 06263 g006aSustainability 11 06263 g006b
Figure 7. Proportion of observed frequency (solid bars) and expected frequency (open bars) for the fire occurrence: (a) land use type and (b) aspect. The P-value was reported from chi-square test to examine differences in the number of fire hotspots among the different categories.
Sustainability 11 06263 g007
Figure 8. Yearly composites from 2002 to 2016 of fire risk maps in Inner Mongolia.
Sustainability 11 06263 g008
Figure 9. Fire risk zones in Inner Mongolia.
Sustainability 11 06263 g009
Figure 10. Number of fire hotspots and burned area extracted from MODIS satellite data in each risk class (extremely low, low, medium, high) as estimated by fire risk map of Inner Mongolia.
Sustainability 11 06263 g010
Table 1. Specific content of 10 levels of fire mask.
Attribute ValueCorresponding MeaningAttribute ValueCorresponding Meaning
0Unprocessed pixel5Non-fire bare land pixel
1Unprocessed pixel6Unknown pixel
2Unprocessed pixel7low confidence, land or water
3Water pixel8middle confidence, land or water
4Cloud9high confidence, land or water
Table 2. The verification information of history fire and Landsat images.
Fire Time (Year-Month-Day)Fire PlaceFire TypeImage Selection Time (Year-Month-Day)Data SourceResolution (m)
2005-10-16East Wuzhumuqin CountyGrassland fire2005-10-22TM30
2006-05-25Hulunbuir, Mianduhe TownForest fire2006-06-03TM30
2012-04-19Chenba’erhu County, Wendu’er VillageGrassland fire2012-05-01ETM+30
2014-04-01West Wuzhumuqin County, Bayanhua TownGrassland fire2014-04-05ETM+30
Table 3. Environmental variables in Inner Mongolia.
CodeVariable NameData SourceTypeUnitsResolution
Climatic factors
TemMean temperature (fire season)China Meteorological Data Service CenterDynamic°C500 m
PrePrecipitation anomaly (fire season)China Meteorological Data Service CenterDynamicmm500 m
Vegetation features
LTLand use typesNational Aeronautics and Space AdministrationDynamicClass 1–17500 m
NDVINDVI (fire season)National Aeronautics and Space AdministrationDynamicDimensionless (range: −1–1)500 m
VWCVegetation water content (fire season)Calculated based on algorithm described by Thomas J. Jackson (1999)Dynamickg·m−2500 m
Topographic factors
EleElevationGeospatial Data CloudStaticm90 m
SloSlopeDerived from elevationStatic°90 m
AspAspectDerived from elevationStaticClass 1–890 m
Human influence
DisRdDistance to roadsPaper map of Inner Mongolia produced by China Cartographic Publishing HouseStaticm500 m
DisSetDistance to settlement areasPaper map of Inner Mongolia produced by China Cartographic Publishing House Staticm500 m

