Article

Effect of Trust in Domain-Specific Information of Safety, Brand Loyalty, and Perceived Value for Cosmetics on Purchase Intentions in Mobile E-Commerce Context

1
SKK Business School, Sungkyunkwan University, Seoul 03063, Korea
2
Department of Global Administration, SKK Business School/SAIHST (Samsung Advanced Institute for Health Sciences & Technology), Sungkyunkwan University, Seoul 03063, Korea
*
Author to whom correspondence should be addressed.
Sustainability 2019, 11(22), 6257; https://doi.org/10.3390/su11226257
Submission received: 8 September 2019 / Revised: 30 September 2019 / Accepted: 30 October 2019 / Published: 7 November 2019

Abstract

:
In 2016, the safety issues of humidifier disinfectants and some other safety incidents in personal cares caused chemical phobia syndrome in the Korean society. This series of events has created a trend for cosmetic consumers to undermine brand confidence and to self-check the safety of commercial cosmetic formulations through mobile apps. The purpose of this study is to examine the influence of trust in domain specific information on the safety rating of cosmetic ingredients on the perceived value and the purchase intention of the cosmetics. The results of structural equation modeling showed that involvement of skin safety (ISS) had a positive effect on trust in domain specific information on safety (TDSI) and brand loyalty (BL). TDSI showed a positive effect on the perceived safety value (PFV) and the perceived social value (PSV), and BL had a positive effect on the PSV. ISS, TDSI, and PSV had a positive effect on the purchase intention (PI) of green-grade cosmetics (GGC). As hypothesized, BL had an adverse effect on PI of GGC. Given the results, utilizing the signal of the domain specific information may be recommended to new entrants to the cosmetic business or manufacturers with relatively weak brand power.

Graphical Abstract

1. Introduction

Fueled by the global K-beauty syndrome, Korea’s cosmetics industry [1,2,3], the eighth largest in the world [
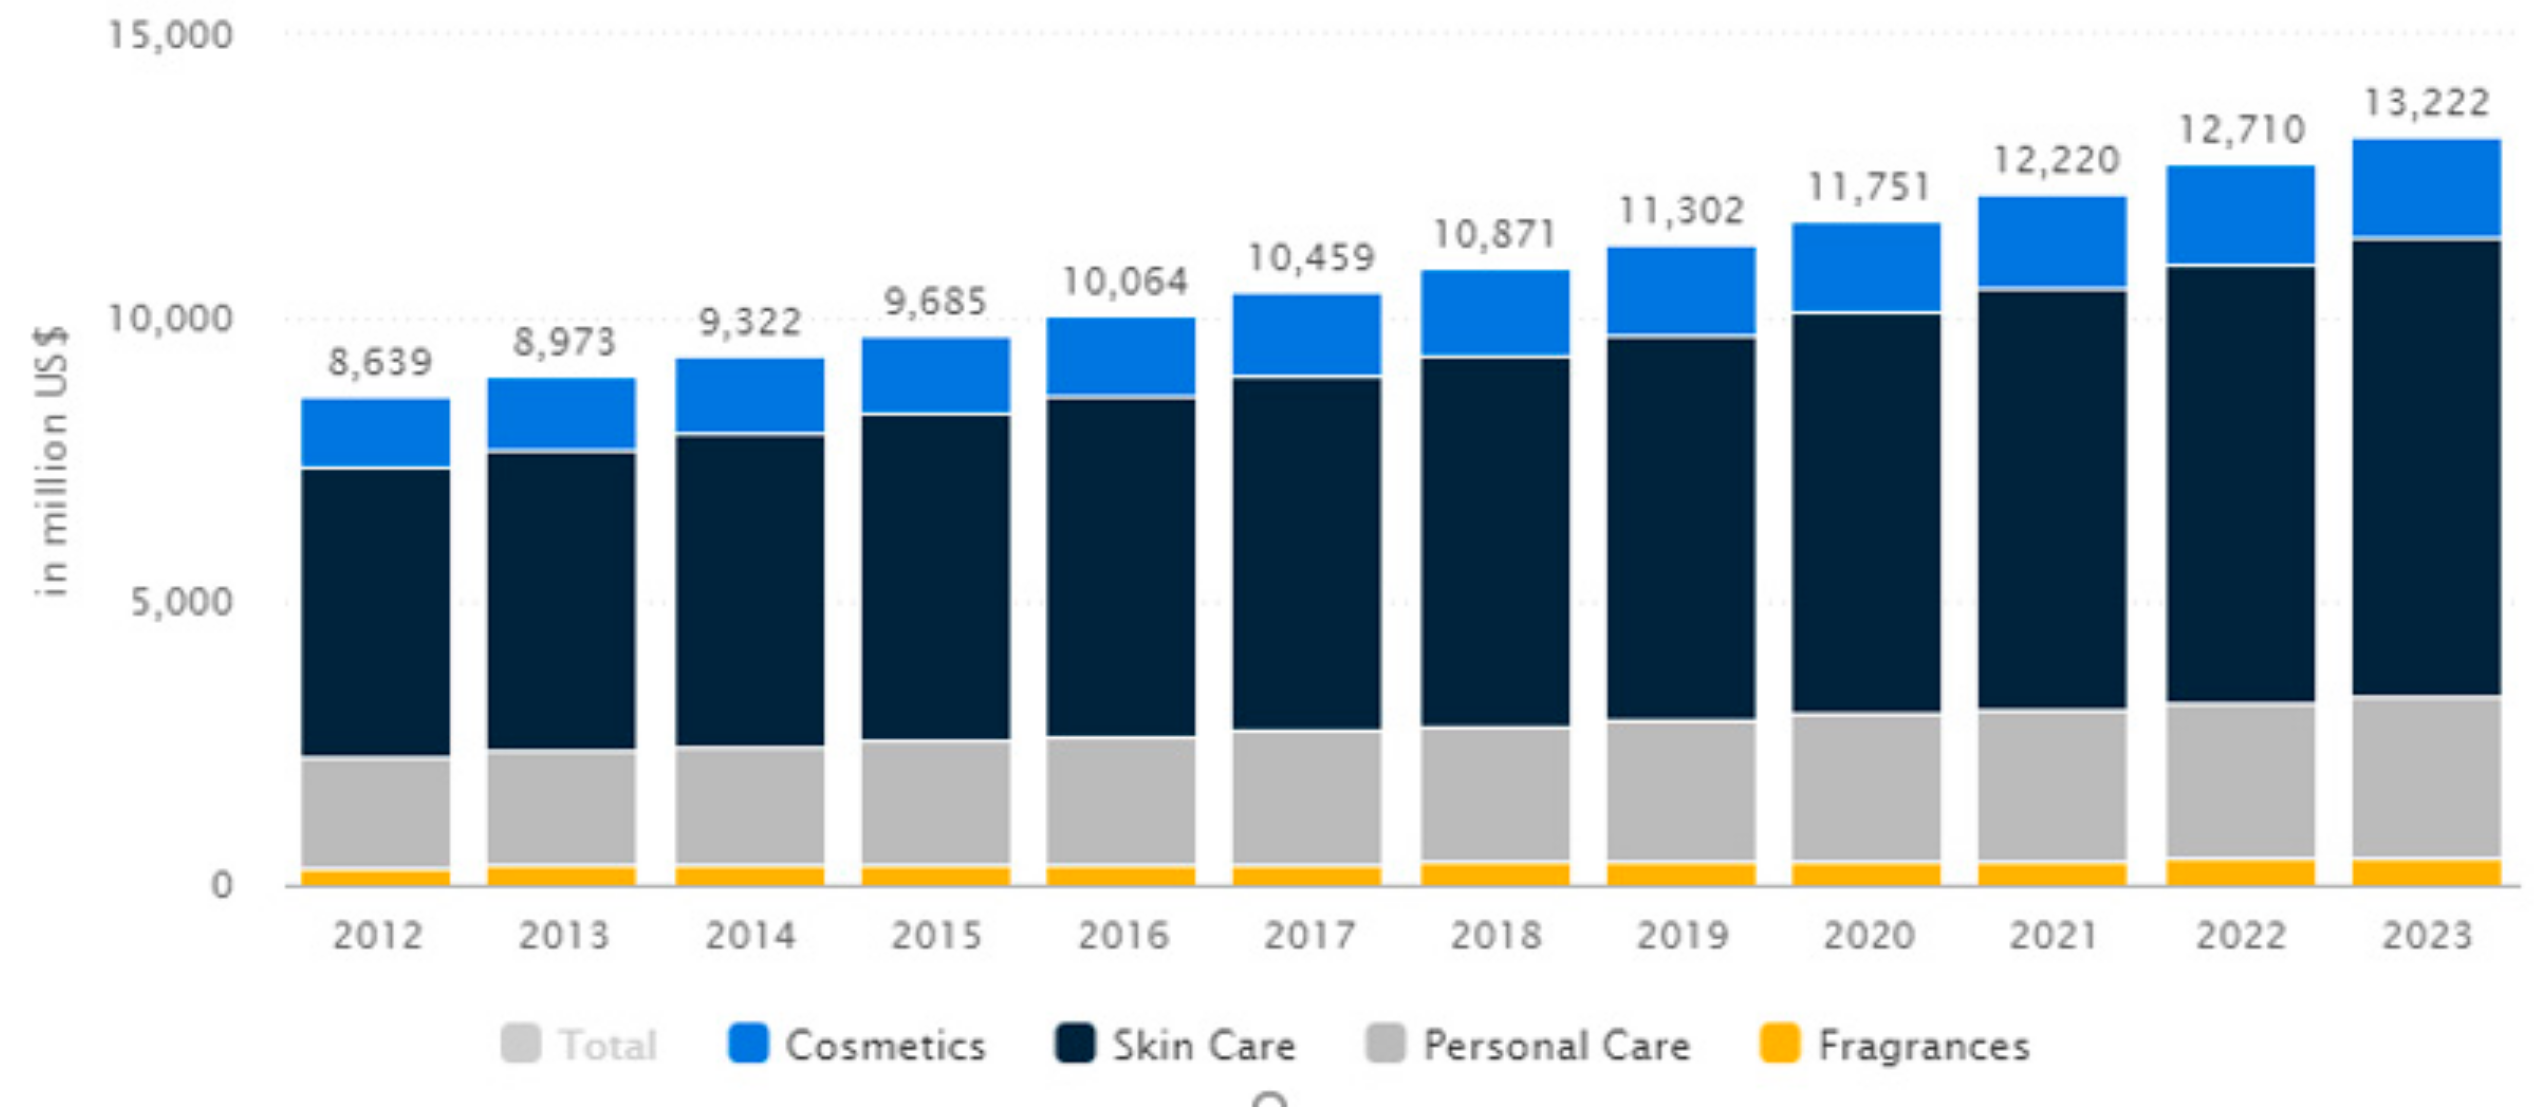
4], representing nearly 3.0% of the global market, in 2019 the revenue in the beauty and personal care market amounts was estimated to be $11.3 billion and the market is expected to grow annually by 4.0% (CAGR 2019–2023) (see Figure 1) [5]. The market’s largest segment is skin care with a market volume of 
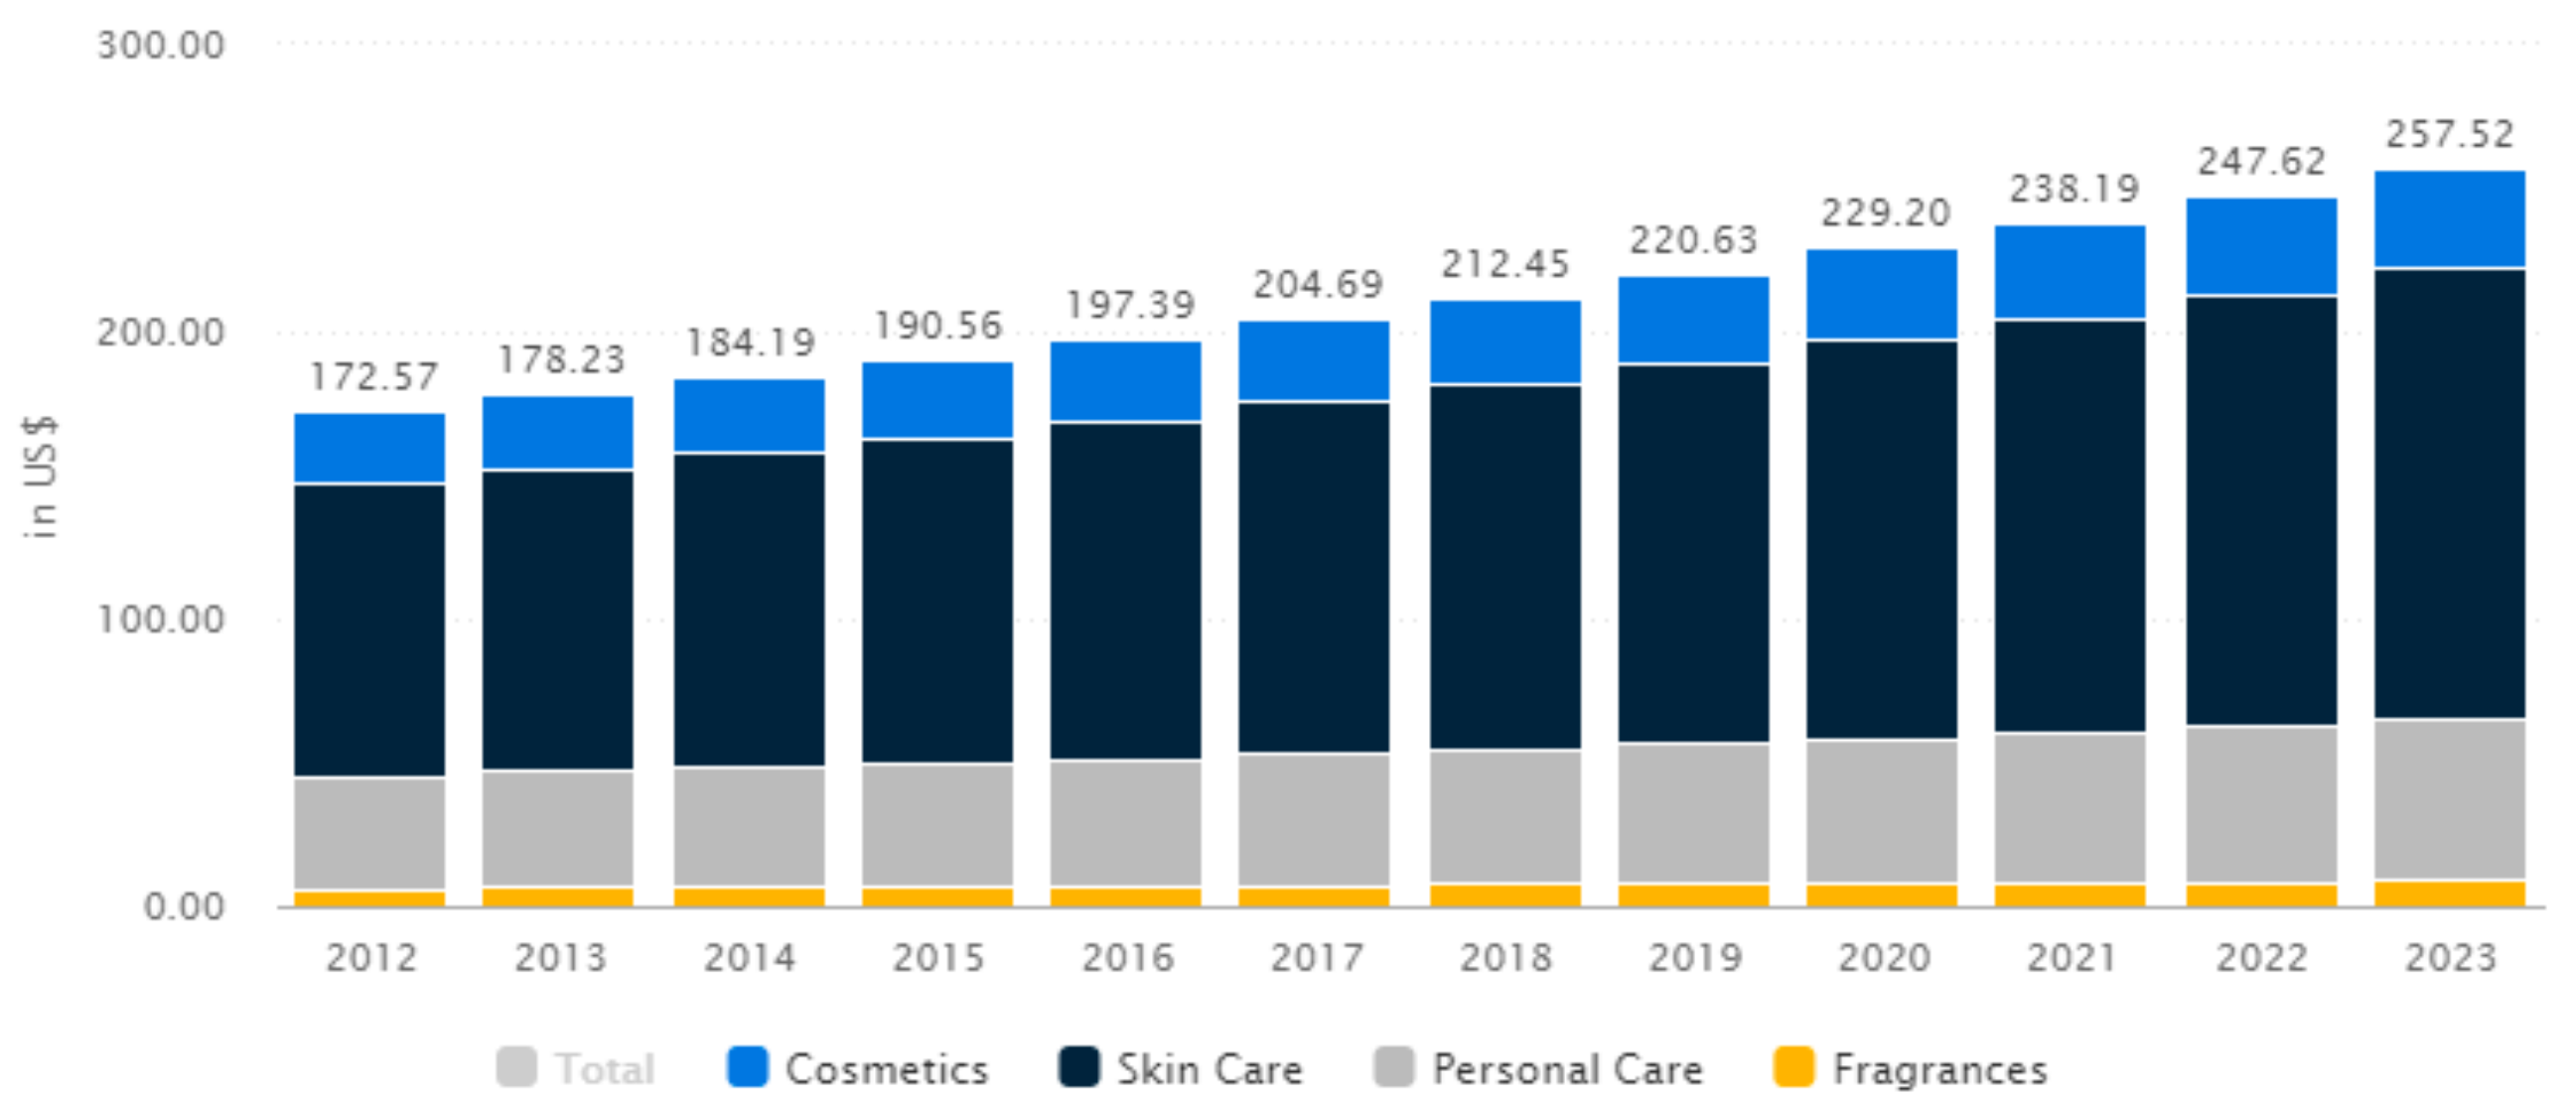
$6.8 billion in 2019. In relation to the total population figures, per person revenues of $220.63 are generated in 2019 (see Figure 2). According to the data from the Korea National Statistical Office, in 2018, the annual online shopping transaction value of cosmetics was about KRW9.84 trillion, of which the mobile shopping transaction value was about KRW5.51 trillion (1000 KRW is approximately equal to 0.75 Euro and 0.83 USD) [6].
Since the infant death scandal caused by a humidifier disinfectant in 2016 has been a shock to the Korean society, many harmful ingredients have been detected in various product groups and consumers are increasingly unable to trust the ingredients of products sold on the market [7,8,9]. The public anxiety about these consumer goods caused the emergence of a new terms such as “Checksumer,” Researsumer, and Smarsumer; consumers who search for various information and decide to make a purchase are “checksumer,” a combination of “check” and “consumer”; consumers researching and exploring areas of interest refer to researchers and consumers as “researsumer.” They are also known as “smarsumer,” a combination word of smart and consumer, who purchases the consumer goods after confirming the ingredients and raw materials of the product [10]. The emphasis of research about human safety of synthetic chemicals outweigh natural ingredients [11,12,13], while natural materials are still of toxicological concerns [14,15,16]. Through a simple Internet search or Mintel GNPD data [17], the number of ingredients in the cosmetics marketed is usually over 20. It is not so difficult to find cosmetics containing more than 40 ingredients. In this vein, the consumers’ loyalty and trust to famous and big brand cosmetics in terms of safety has been receded nowadays, and the external cue effect of brand loyalty is relatively weakening. Smartphone applications (apps) are beginning to emerge to alleviate these consumer anxieties. Typical examples are apps such as “Hwahae” and “Glowpick” that display the hazard ratings of cosmetic ingredients and identify ingredients that may be toxic or allergic to the skin [18]. For every product, the apps show a full list of the ingredients it contains with a one-to-ten scale indicator of harmfulness to the skin. These apps help consumers decode unfamiliar chemical ingredients and become increasingly clever and choose to rely on less subjective assessments [19].
Unlike medicines that are used only when health problems occur, cosmetics are a daily necessity concept, regardless of the presence or absence of a disease, so the ingredients of the product are exposed to the human body every day [20,21], and consequently, the human safety features as well as skin beauty features such as moisturizing, anti-aging, or sun protection are essential requirements for the purchase of cosmetics [22]. In line with this context, there are numerous studies on the safety of cosmetics. In other words, studies allied with the risks and regulations of trace harmful chemicals [16,20,21,23] and the association between organic/natural ingredients and the safety of cosmetics [24] (some of them argue that organic and natural cosmetics lead to positive effect on consumers’ purchase intentions [12,13,25] but on the other hand, contrary to general belief, there are many reports that natural cosmetic ingredients are not free from toxicity [26,27]) are visible. However, researches based on consumers’ perception of quality and their trust in accessible information of safety data to them actually and their purchase intentions related to the safety of cosmetics of consumers are rare.
Quality perceived by consumers are classified into intrinsic signal related to the physical composition of the product such as the flavor, color, texture, and durability of the product, and external signals associated with the brand name or product price or reputation of the store, which are product-related but not part of the physical product itself [28,29]. Consumers perceive products with these signals as precious products by utilizing excellent quality and performance as signals. In other words, good quality is one of the reasons consumers buy precious goods [30,31]. Quality is a functional value or utility value that represents the uniqueness, usefulness, reliability, and durability of a product, and quality-oriented consumers tend to be rational to focus on the highest level of products as well as finding the right price and quality combination for their purchase [32,33]. Signal theory also suggests that trustworthiness is a key determinant of brand signals for effectively communicating information [34]. This means that brands can be a trusty signal because they can implement the cumulative effort of a premarket communication strategy. In other words, brand trust is at the core of the brand as a signal [35,36]. Given the possibility of using the brand as a signal, brand trust and brand reputation can affect consumers’ brand purchase intentions, as they can increase their confidence in brand choices and improve their social status and self-worth via purchasing the brand [37]. However, other studies show that when faced with multiple signals, consumers can trust in a larger scope of signals to make decisions and the effect of other signals is attenuated [38,39]. As an example of the cosmetics industry, this can be explained by drawing two signals, brand and information of safety rating for all ingredients of cosmetic formulations provided by a domain-specific organization. In this case, the signals are not complementary to each other, but the brand and domain specific information are mutually independent and conflicting; only the larger scope out of the two signals influences the consumer decision-making and the other is weakened. As a result of a series of safety incidents in consumer products, Korean consumers’ brand confidence has weakened in line with the chemical phobia atmosphere in the society that caused safety problems in renowned brand/products by multinational chemical companies and big local cosmetic makers. Consequently, our research model was designed focusing on the signal of trust in domain-specific safety information for cosmetic ingredients while involving the variable of brand loyalty.
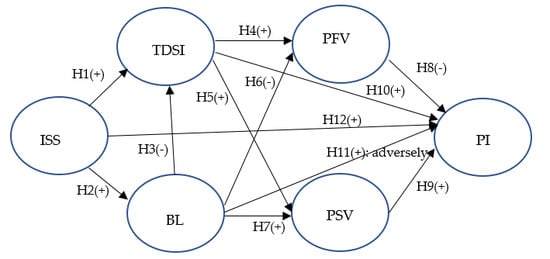
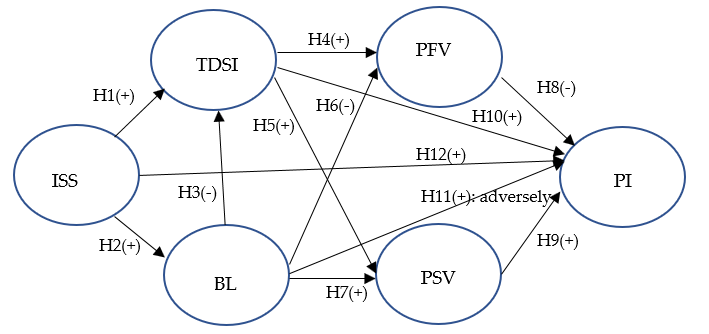
In the end, these contextual backgrounds motivated us to address the following three research questions. First, how will trust in domain specific information on the safety rating of cosmetic ingredients influence consumers’ perceived values and intentions to purchase cosmetics formulated with high safety grade ingredients (named as green-grade cosmetics here)? Second, how is individuals’ brand loyalty associated with their perceived values and purchase intentions for these green-grade cosmetics? Third, what decisions on marketing and sales strategies can cosmetic makers and e-commerce vendors make from the results of this study?

2. Literature Review and Hypothesis Development

2.1. Involvement in Skin Safety

Involvement is defined as the perceived personal relevance or the perceived personal importance of a particular object or issue in a particular situation on the basis of the individual consumers’ interests, needs, values, personal lifestyles, and concerns [40,41,42]. Depending on the degree, it is divided into high and low involvement. High involvement consumers have a more comprehensive and complex process than the low involvement consumers in decision-making and information processing [43]. For example, the high perceived risk of plastic surgery causes its consumers to be more concerned and worried and to seek information intensively, which is the case of high involvement.
Unlike medicines that are used only when a health problem occurs, cosmetics are personal care products that lead to daily exposures to chemicals [44]. Therefore, in general, when a consumer selects cosmetics, he/she shows high involvement in skin safety attribute as well as the aesthetic functions such as moisturizing, anti-aging, or sun protection effect. According to Environment California, Environmental Working Group and Friends of the Earth, it is reported that makeup, shampoo, skin lotion, manicures, and other personal care products incorporate chemical ingredients with deficiency in safety data [14]. Vitamin E, known as an antioxidant to prevent skin aging, has also been reported to induce allergic contact dermatitis [45,46], and a number of other studies mention the harmful effects of cosmetic ingredients [47,48,49]. Besides, recently, because of safety issues arising from multinational company’s famous brand products such as the talc issue in a baby powder [50] and a scandal caused by humidifier disinfectants [8], Korean consumers’ dependence on domain-specific information of human safety has increased, which leads to their inspecting the safety information of the ingredients before buying cosmetics [10]. Thus, we hypothesized as follow (see Figure 3).
Hypothesis 1 (H1).
Involvement in skin safety (ISS) will positively affect the trust in domain-specific information (TDSI) of safety.

2.2. Brand Royalty

Since the 1990s, many researchers have extended brand loyalty to the concept of multifaceted attributes that are outside of behavioral aspects, and can be viewed as brand loyalty consumers when they show preference for a particular brand beyond repetitive purchasing behavior [51,52,53,54]. This brand loyalty is seen in the high involvement product, in the case of relatively uncomplicated decision-making, and it is distinguished from simple repurchasing in that consumers include psychological attitudes along with their commitment to a particular brand [55].
Aaker (1991) defined brand loyalty as a key concept in marketing and defined the degree of attachment to a particular brand. Customers with a favorable attitude toward the brand are willing to pay more premium prices [51] and have word of mouth intentions for certain branded products [56]. Emotional factors, such as brand commitment are based on positive attitudes and preferences for a particular product [55]. According to Beatty et al. (1988) [57], brand commitment is an emotional and psychological attachment to a particular brand, which indicates an explicit willingness to maintain an ongoing relationship with that brand.
In addition, brand loyalty prevents sales churn and has a positive effect on the business retention. In other words, despite situational impacts and marketing activities related to triggering switching behavior, loyal customers deeply hold commitment to repurchase and keep patronizing their preferred products and services in the future [58]. Loyal customers respond more favorably to brands than non-loyal or switching consumers, allowing them to refuse to switch to another brand [59]. Given that the needs for skin safety is one of the key factors when consumers consider cosmetics purchases along with aesthetic orientation, the desire for exhibition and the needs for social value [60,61] those who are in high brand loyalty have a willingness to pay for premium brands that entail such values [51]. In this context, we hypothesized as follow (see Figure 3).
Hypothesis 2 (H2).
ISS will positively affect brand loyalty (BL).

2.3. Trust in Domain Specific Information

Trust has been defined as the willingness to be vulnerable to the actions of a party regardless of the ability to monitor or control the other party, depending upon the positive expectations that (s)he would perform certain actions that are important to the trustor, given the context of the trustor’s awareness of the risk related [62,63]; that is, the willingness to take risks could be one of several characteristics common to all trust situations [64,65]. Despite the distinction between risk and uncertainty in terms of distribution of results as it has been suggested that concepts of risk and uncertainty are different from each other [66,67] (“Risk” has a known probability, whereas lack of knowledge of the precise probability goes to “uncertainty”) [67]. Marketers have always allowed the use of both concepts as synonyms. An assumption of the reason is that in marketers’ perception, consumers never know the precise probability of the result [68]. The absence of uncertainty between the two parties indicates that no risks or threats were found in future interactions between the parties [69].
A well-known company or brand plays an important role in ensuring the performance of a product or service, while an unknown small company or brand needs to guarantee the performance of a product or services, which should be presented clearly and powerfully. It is helpful for small businesses or brands that are not well-known to endorse through a certain third-party that has a positive and reliable image and then can be intensely effective for consumer communications. Such endorsements, on the other hand, may be optionally helpful to a well-known company or brand, depending on the type of product [70]. For example, endorsement or information from domain-specific organizations can function as a sign of unobservable product quality (product performance, reliability, and durability). By evaluating products based on these experience characteristics, such information or endorsement can reduce consumer uncertainty and risk perception in the context of a purchase [71]. Recently, the increase in risk perception of human safety for cosmetic formulations among consumers in South Korea, many consumers trend to make self-checking of every ingredient’s safety ratings for the finished products through a mobile app (mostly provided by Environmental working group (EWG who is a NGO in US) prior to the purchase for the sake of reducing the uncertainty. The ingredients that are considered safe in these apps are generally referred to as green grades in the Korean cosmetics industry and consumers because they are displayed in green color through these mobile apps [72]. This behavior of incorporating information from a domain-specific organization into decision-making is similar in context to laypeople’s reliance on the knowledge of scientific experts in developing and making personal decisions about science-based problems [73]. This context led us to hypothesize as follows.
Hypothesis 3 (H3).
BL will have an adverse effect on TDSI of safety.

2.4. Perceived Values

Value is an evaluation of the consumer’s usefulness based on the perception of what is paid and received as a subjective feature of satisfaction with the utility or needs that result from consumption of a particular product or service [74], and perceived value can be defined as an overall assessment of the utility of a product based on the perception of what the customer has given and received. The value they perceive as received can vary from customer to customer [75]. Some customers weigh economics, some put quality first, others may want convenience. Such perceived value can be evaluated by the subjectivity of the customer and thus may be different depending on the consumer’s disposition or situation [76]. The view of perception deems that perceived value is the perceived preference and evaluation of customers’ product attributes and product usage goals [77].
Sweeney and Soutar (2001) suggested that consumer assessment of a product takes into account not only the quality and performance (functional value), but also the pleasure and enjoyment (emotional value) derived from the product and the social pressure on the product to communicate with others (social value). They identified four consumer value dimensions (emotional, social, quality/performance, and price/value for money) that significantly lead to buying attitudes and behavior. It also supported the expectation that consumers would be more willing to buy at a premium price if they thought the product was valuable [78]. Song et al. (2019) argued that consumers’ perceived values of social, monetary, and brand values play a positive role in the purchase intention of anti-pollution cosmetics [12]. On the other hand, since brand-loyal consumers show the behavior of sticking to a particular brand’s preference even if a situational factor inducing brand conversion occurs [52,57], it is assumed that their perception on safety value of green-grade cosmetics is relatively low. Ghazali et al. (2017) stated that the consumer perceived values, such as health, safety, hedonic, and environmental values are related to the intention to repurchase organic cosmetics [13]. Scandals regarding product safety have played an important role in driving up cosmetic consumers’ self-safety checking for every ingredient in cosmetic formulations through mobile apps such as Hwahae [79]; e.g., in 2016 the incident of the humidifier disinfectant incident in South Korea caused death and illness in many children [8]. Similarly, it was reported that the case of ovarian cancer being linked to the daily use of Johnson’s talcum-based baby powder and shower products [50] could alarm consumers into being more cautious of the products that they use daily. Ma et al. (2019) asserted that consumers show preference for high-end brands by associating safety with those brands [80]. Sheth et al. (1991) described that social value refers to an image that accordant with the norm of a friend or colleague of the consumer and/or the social image the consumer desires to project [81]. Social value, which represents the meaning or value of a product to society [12] as the utility derived from the product’s ability to enhance social self-concept has a certain subjectivity and denotes the impact of customer purchasing behavior on society [78]. Social value affects the consumer’s judgment about the perceived value of a product. A study by Kumar and Ghodeswar (2015) found that other people’s perceptions of their behavior had a significant impact on the decision to buy green products [82]. Social appeal influences development of consumers’ product preferences because consumers tend to buy products that follow social perceptions [13].
Brands are a particularly important means of satisfying consumer consumption. Brand coffee shop customers like Starbucks, for example, think their ego is related to their needs because their symbolic traits allow consumers to recognize themselves in the brand, give their identity meaningfully, or differentiate themselves from reference social groups [83]. Belk (1988) describes how possessions play an important role in indicating oneself, the expression of personal achievements of an individual, the expression of interpersonal relationships, the expression of cultural values and social status [84]. In addition, customers with a favorable attitude toward the brand are willing to pay more premium prices (Keller, 1993) and have word of mouth intentions for certain branded products [84]. In line with this, we seem to have a high social pride that consumers with high brand loyalty can meaningfully assign their identities or differentiate them from reference social groups. Based on this concept, brand loyalty is likely to be associated with the perceived social value of green-grade cosmetics [12,13]. Based on these theoretical backgrounds, the following hypotheses are put forward in this study (see Figure 3).
Hypothesis 4 (H4).
TDSI for safety will have a positive effect on the perceived safety value (PFV) of green-grade cosmetics (GGC).
Hypothesis 5 (H5).
TDSI for safety will have a positive effect on PSV of GGC.
Hypothesis 6 (H6).
BL will have an adverse effect on PFV of GGC.
Hypothesis 7 (H7).
BL will have a positive effect on PSV of GGC.

2.5. Purchase Intention of Green-Grade Cosmetics

Purchase intention refers to the possibility of a consumer purchasing the product or service, which is accompanied by changes in consumer psychology during this process [12]. It indicates to the expected future or planned future behavior of the consumer, and the belief, attitude, and value perception are highly correlated with the transition to the actual purchase of the product [85]. A positive consumer value attitude toward a product increases the likelihood of consumption, increasing the number and frequency of products purchased [86]. Many literatures have studied the perceived values and intentions of purchase from a variety of perspectives and most of them claim that perceived values can significantly influence the purchase intentions. In terms of products, Peng et al. (2018) stated that the higher the perceived value of consumers when buying a product, the higher the willingness to buy [87]. Song et al. (2019) found that social value had a significant positive effect on the purchase intention of anti-pollution cosmetics [12]. Shapiro et al. (2019) confirmed that perceived value showed a positive impact on purchase intentions and that it was a partial mediator between the relation of variables and purchase behavior [88]. Prentice et al. (2019) stated the mediating role of perceived value for social identification and purchase intention [89].
As denoted by Feng et al. domain-specific organization endorsement would lead to positive effect on perceived product quality, purchase intention, and positive word-of-mouth intention [90]. According to a study by Woodruff (1972), consumers perceive that neutral sources of information about brands or products are less uncertain than market-dominated or consumer-oriented sources [91]. Biased information further jeopardizes people’s trust in information sources [92]. Consumers use a reliable source to verify their positive attitude when authenticity is in doubt [93]. To meet a wide range of interrelated behaviors (e.g., media search, interpersonal search and deliberation search components), consumers often rely on sources such as opinion leaders because they are perceived to have more information and knowledge about the product [94]. As per Ghazali et al. since the need for safety is one of the key variables for the intention to purchase cosmetics, accordingly we assume that the trust in domain specific information on safety will influence the consumer’ purchase intention [13].
Kotler (1991) [54] identified four types of consumer loyalty to the brand. First, consumers who show hard-core loyalty and consistently buy only one brand. Second, consumers with split loyalty are loyal to several brands. Third, a consumer with shifting loyalty, who shows loyalty to one brand and then converts to another. Fourth, consumers who do not show loyalty to a particular brand are called switchers. According to Kotler, switchers are simply deal-prone, responsive to low prices, constantly looking for cheap products, or vanity-prone to look different from others. Aligning with these claims, loyalty toward a particular brand is speculated to have an adverse effect on the purchase intent for green-grade cosmetics, that is, toward effect on consumers’ purchase intention, the competitive relationship between the two external cues, BL and domain specific information, is inferred. Eventually, these antecedent studies led us to formulate the following hypotheses (see Figure 3).
Hypothesis 8 (H8).
PFV of GGC will have a positive effect on purchase intention (PI) of GGC.
Hypothesis 9 (H9).
PSV of GGC will have a positive effect on PI of GGC.
Hypothesis 10 (H10).
TDSI of safety will have a positive effect on PI of GGC.
Hypothesis 11 (H11).
BL will have an adverse effect on PI of GGC.
Hypothesis 12 (H12).
ISS will have a positive effect on PI of GGC.

3. Research Methodology

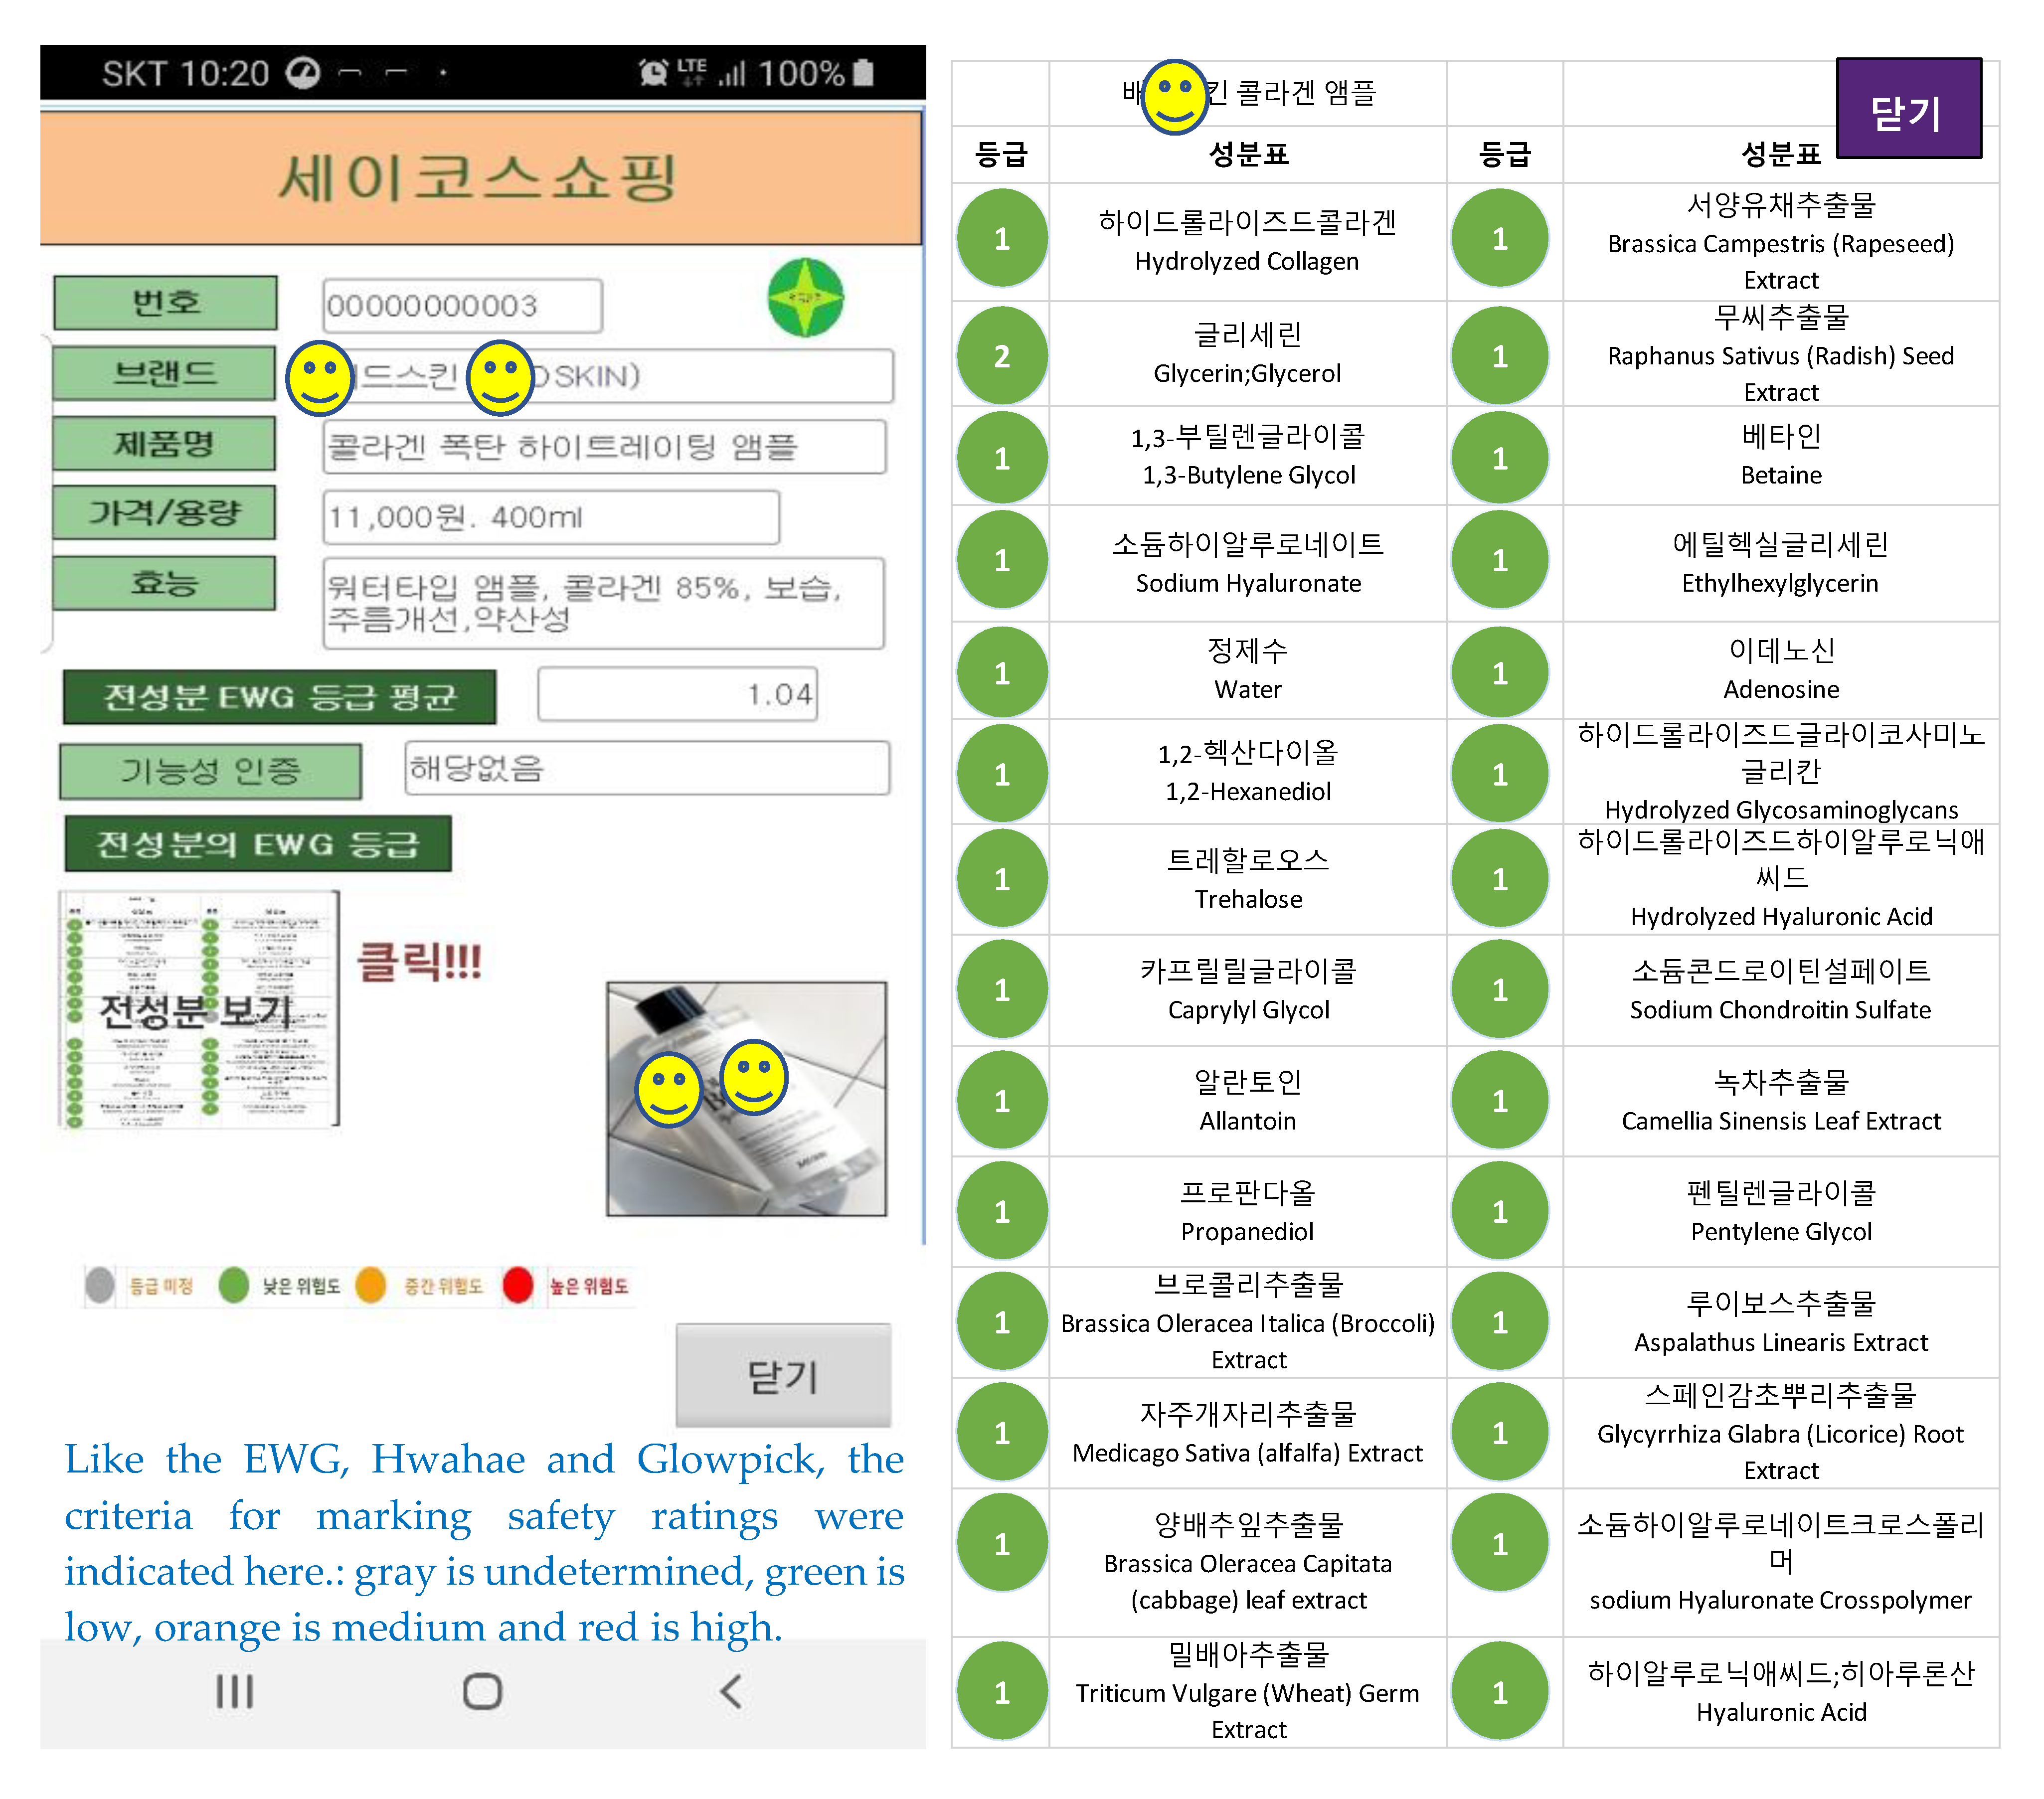
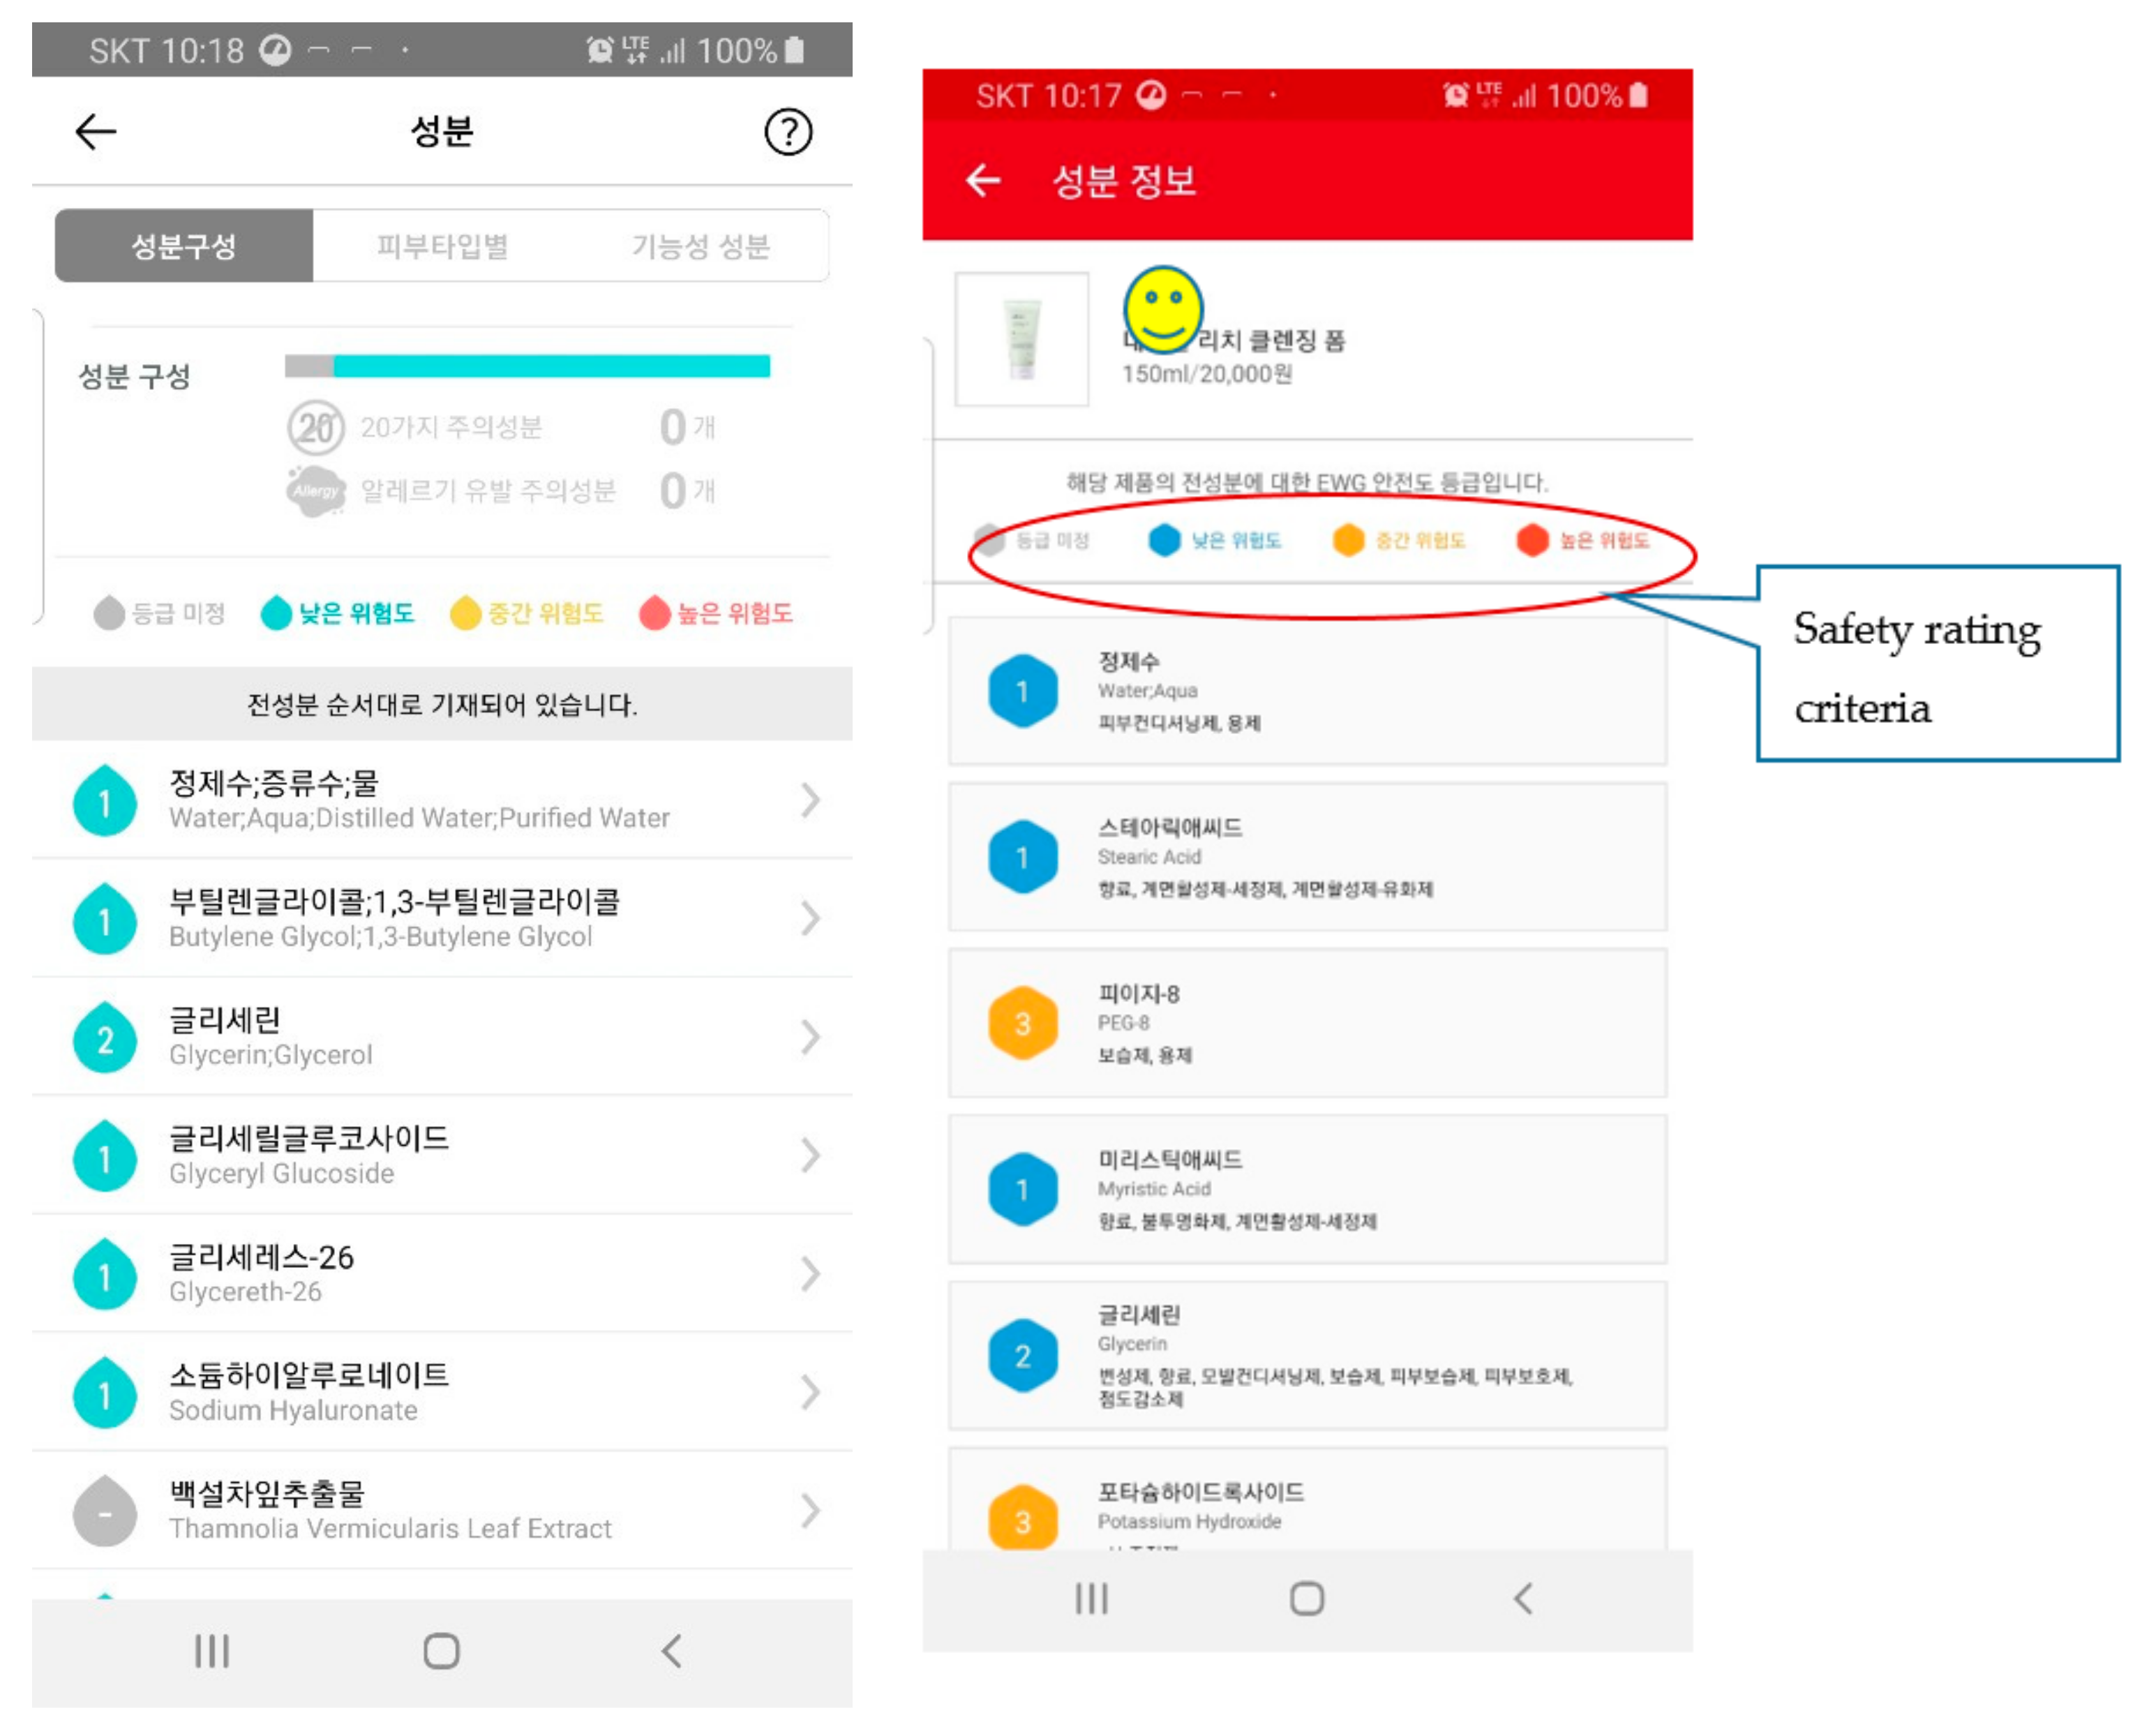
To test the research model, an experimental methodology was employed. First, a mobile app that resembles an actual mobile app available in the domain was created. Although not having a billing feature, the mobile app was designed to look analogous to regular mobile e-commerce. For the sake of making it easier for participants to concentrate on their apps without spending a long time before responding to the survey, the app was simplified and only seven cosmetics were included. Similar to the form provided by Hwahae and Glowpick, we have entered all the ingredients and their hazard ratings for the seven products (see 
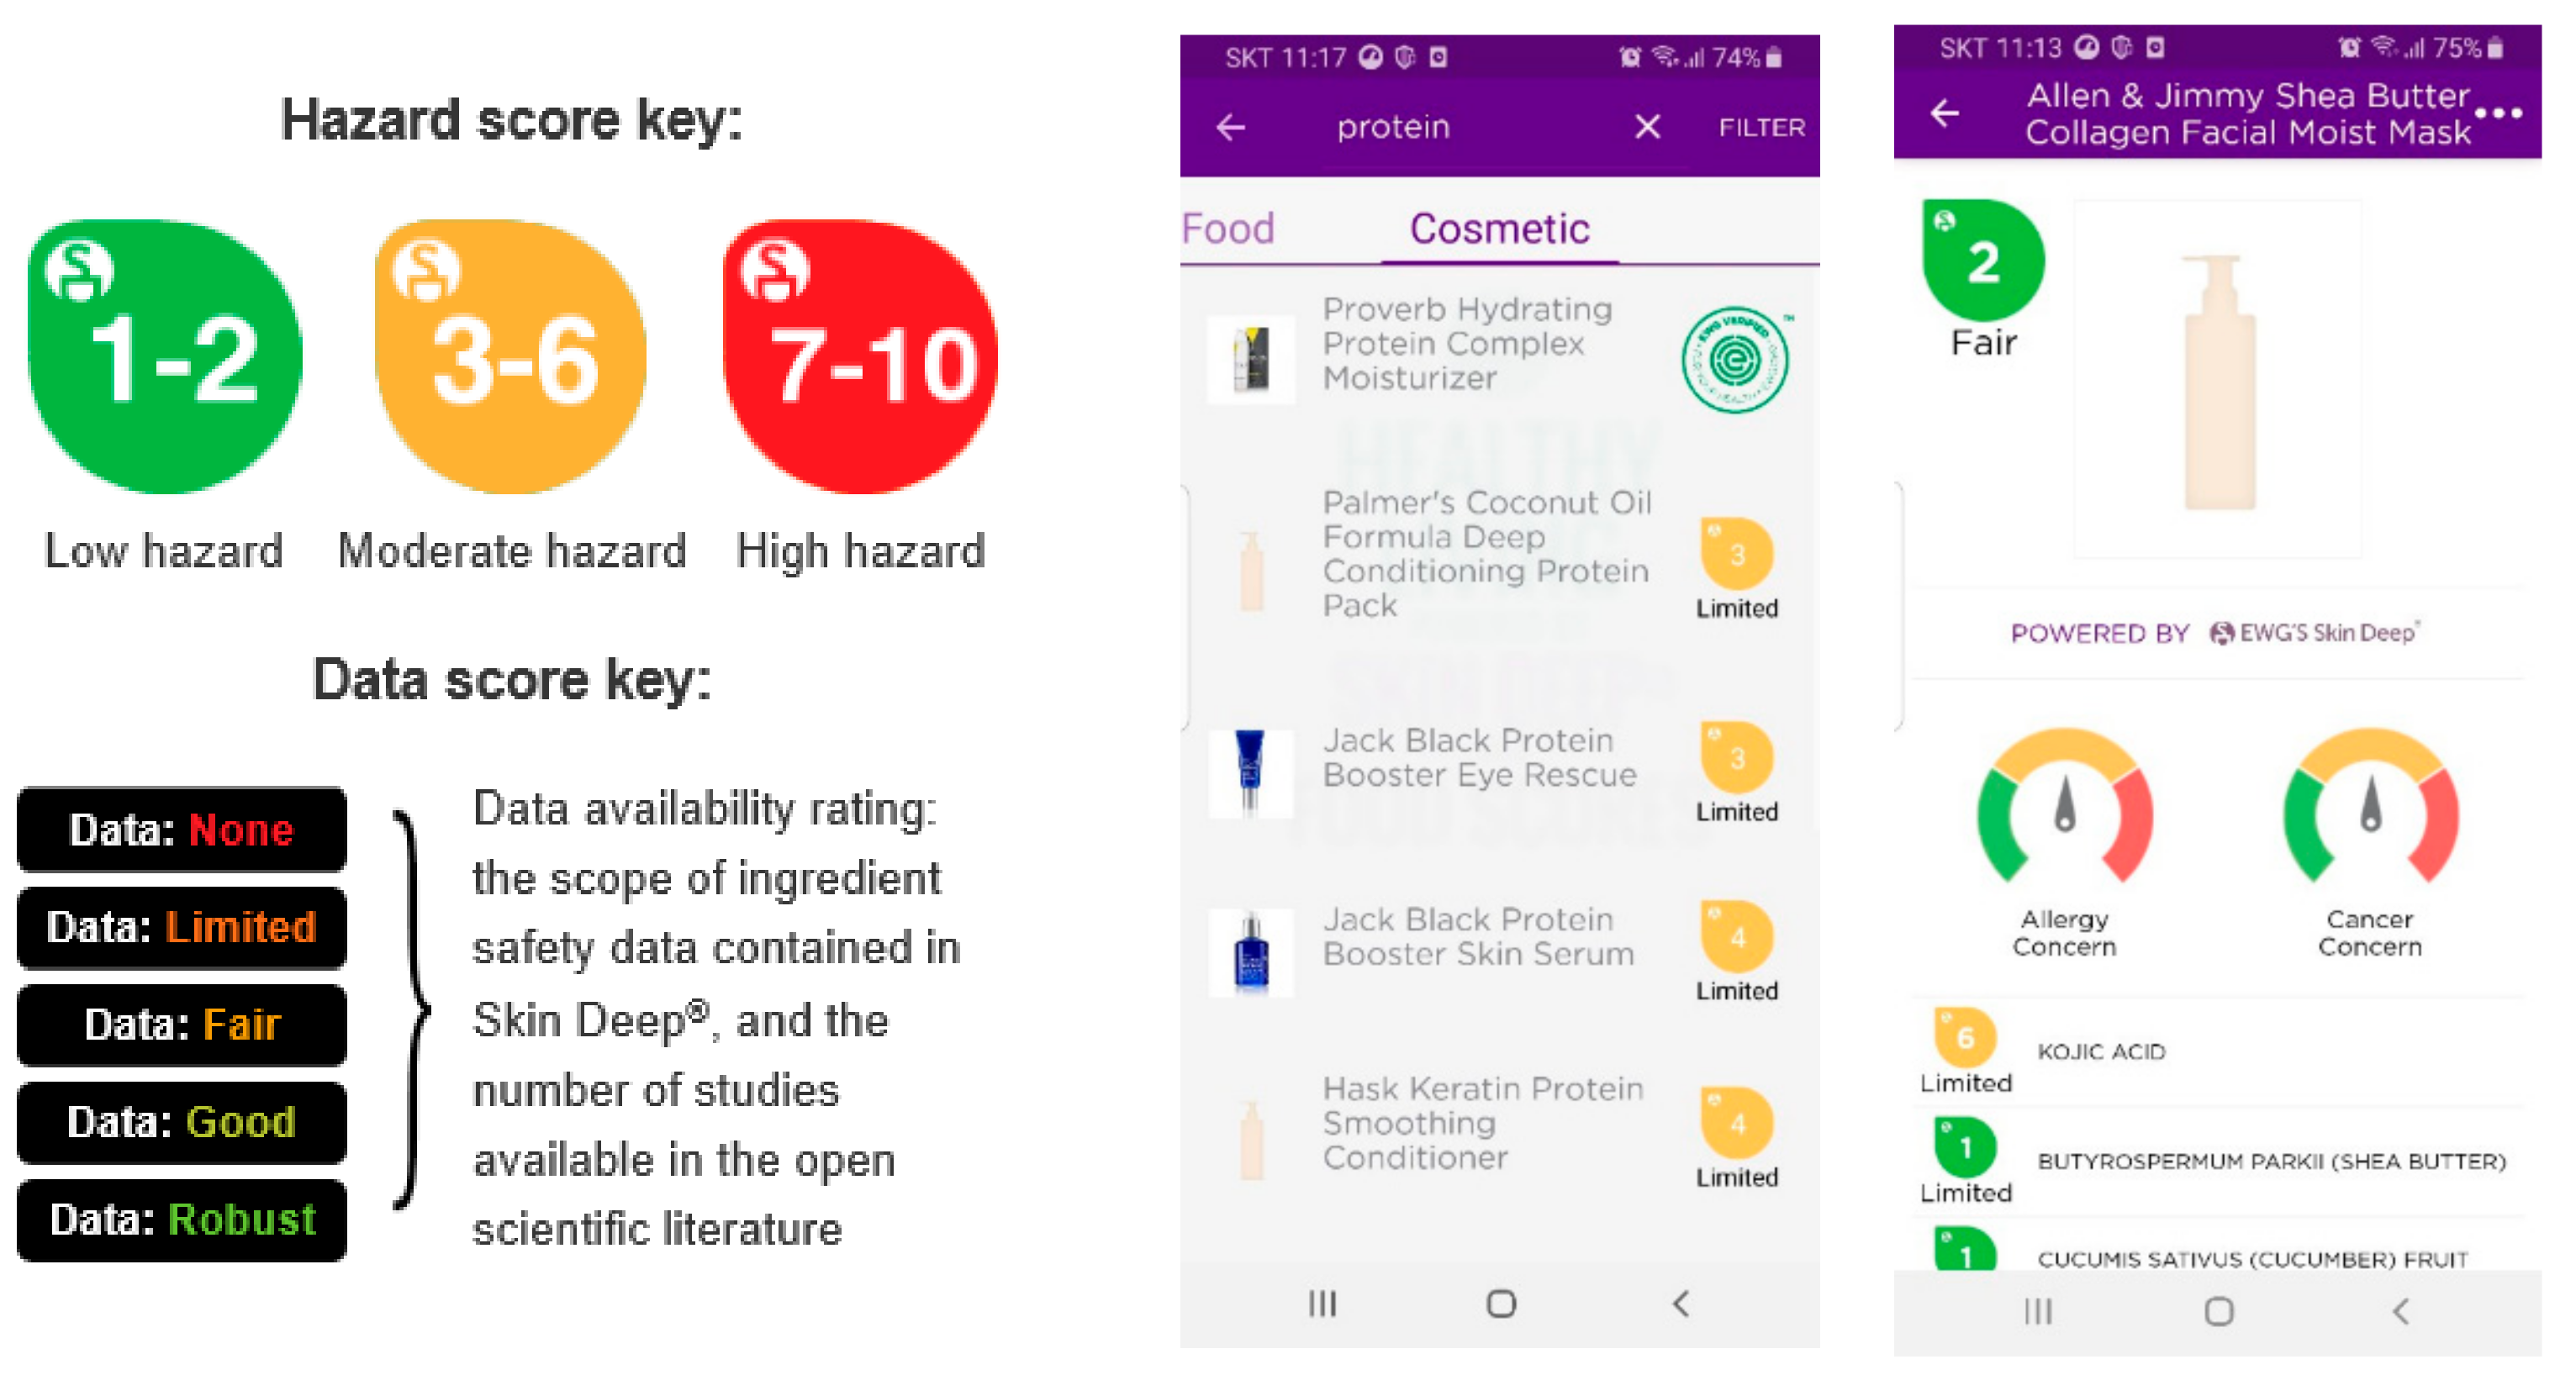
Figure 4). Since Hwahae and Glowpick’s hazardousness criteria of individual ingredients are based primarily on the EWG’s Skin Deep® Cosmetics Database provided by Environmental Working Group (EWG) [72,95] which is a non-profit, non-partisan organization with the purpose of establishment to protect human health and the environment, our study also identified the hazard classes of each ingredient utilizing EWG’s Skin Deep® Cosmetic database [95] (see Figure 5 and Figure 6). Two of the seven selected products were famous branded products made by Korean cosmetics companies which ranked first and second in sales; the two products were indie cosmetics that are on the rise, and the remaining goods were new launching products of startup companies. For the convenience of the experiment, some modifications were made to the product names and the components. However, the brand names were used without adjustment as they were in the market.
Similar to EWG’s method of marking as green-grades for high-safety cosmetics and their ingredients, in our study, such products or materials were called green-grade cosmetics or ingredients. In addition, we calculated the safety levels of individual commercial formulations by averaging the safety ratings of all the ingredients, and seven of the finished products with green- grade results were placed in the mobile e-commerce store developed for this study.

3.1. Data Collection and Sample

The population of this study included women in their late teens to fifties and men in their twenties to thirties who live in Seoul, Inchon, and Kyunggi-do of South Korea and purchase skin-care cosmetics through mobile apps. About 50% of the South Korea’s total population lives in Seoul [98], Incheon, and Gyeonggi-do, and these areas are also leading the trends as a center of South Korea’s economy and culture. Non-probability sampling was employed over a period of 24 days from 27 July to 19 August 2019. Purposive sampling [11] was employed by determining the specific sample on the basis of their relevance on the study and their experience on mobile commerce. The sample consisted of undergraduates, MBA students, and the alumni association members of a business school in Sungkyunkwan university of South Korea and their family, friends, company colleagues, and other acquaintances, who were recruited through multi-level online communication process. Each study participant was requested to download one of open apps and an experimental app and answer a questionnaire after reviewing the apps. The online survey was conducted using the Google Forms tool to collect data for the empirical analysis. A total of subjects was recruited and rewarded with a beverage coupon equivalent to about 4000 KRW. We analyzed data from 240 respondents who completed the entire survey; four incomplete answers were removed. High response rates meant no serious problems concerned with non-response bias [11]. In this study, female comprised 74.2% of the respondents, while the majority were between 18 and 30 years old (88.7%) and university students (66.3%) who are generally known as the generations that are sensitive to new trends and relatively active in utilizing mobile apps and mobile shopping. Based on the general conjecture that the main consumer groups buying cosmetics through mobile apps are women in their late teens and 20s, sampling for our study was conducted. As yet, we couldn’t rule out that these purchases are being made in other groups, so we decided to involve some percentage of other age groups and men into our experiments. Men’s responses, 25.8% of the total response rate, were used in our study, according to Euromonitor’s 2018 statistics (fee accessible service, [99]). Men’s cosmetics accounted for 17% of the general skin-care cosmetics sales in South Korea and respecting the advice of three cosmetics industry experts that the use of male consumers in sunscreen cosmetics and women’s cosmetics is increasing. Most non-college respondents have a bachelor’s degree or higher. In addition, for cosmetics purchases, 29.6% of respondents spend between KRW10,000 and KRW20,000 a month, and the other 29.6% spend between KRW20,000 and KRW50,000 a month. The descriptive statistics of the samples are listed in Table 1.
Instead of the mobile app registered in the market, the participants were required to download and use the trial version, so we hired four experimental assistants to recruit suitable participants and help them download the mobile app. Most of the communication between respondents and experimental assistants was through mobile messengers. Because this trial mobile app did not work on the IOS operating system and only runs on the Android environment, there was a limit to participate Apple phone users in our experiment.

3.2. Measures

They were asked to check out the Hwahae or Glowpick apps that are available from “Google play store” and to browse them for ten minutes (80.4% of the participants close Hwahae app; see Table 1) before downloading the research app that takes stock of seven commercial cosmetic formulations, e.g., three skin hydrating creams, two sunscreen creams, an eye cream, and a skin toner. Subsequently, the respondents were asked to look around the research app for five minutes before engaging in the survey. In the sense that potentially high non-response rates or reluctancy on taking required actions because of sort of concern about financial safety issues could occur when the participants were requested to make an actual decision of clicking on a purchase function key or feedback through transaction pages, a survey response method was utilized.
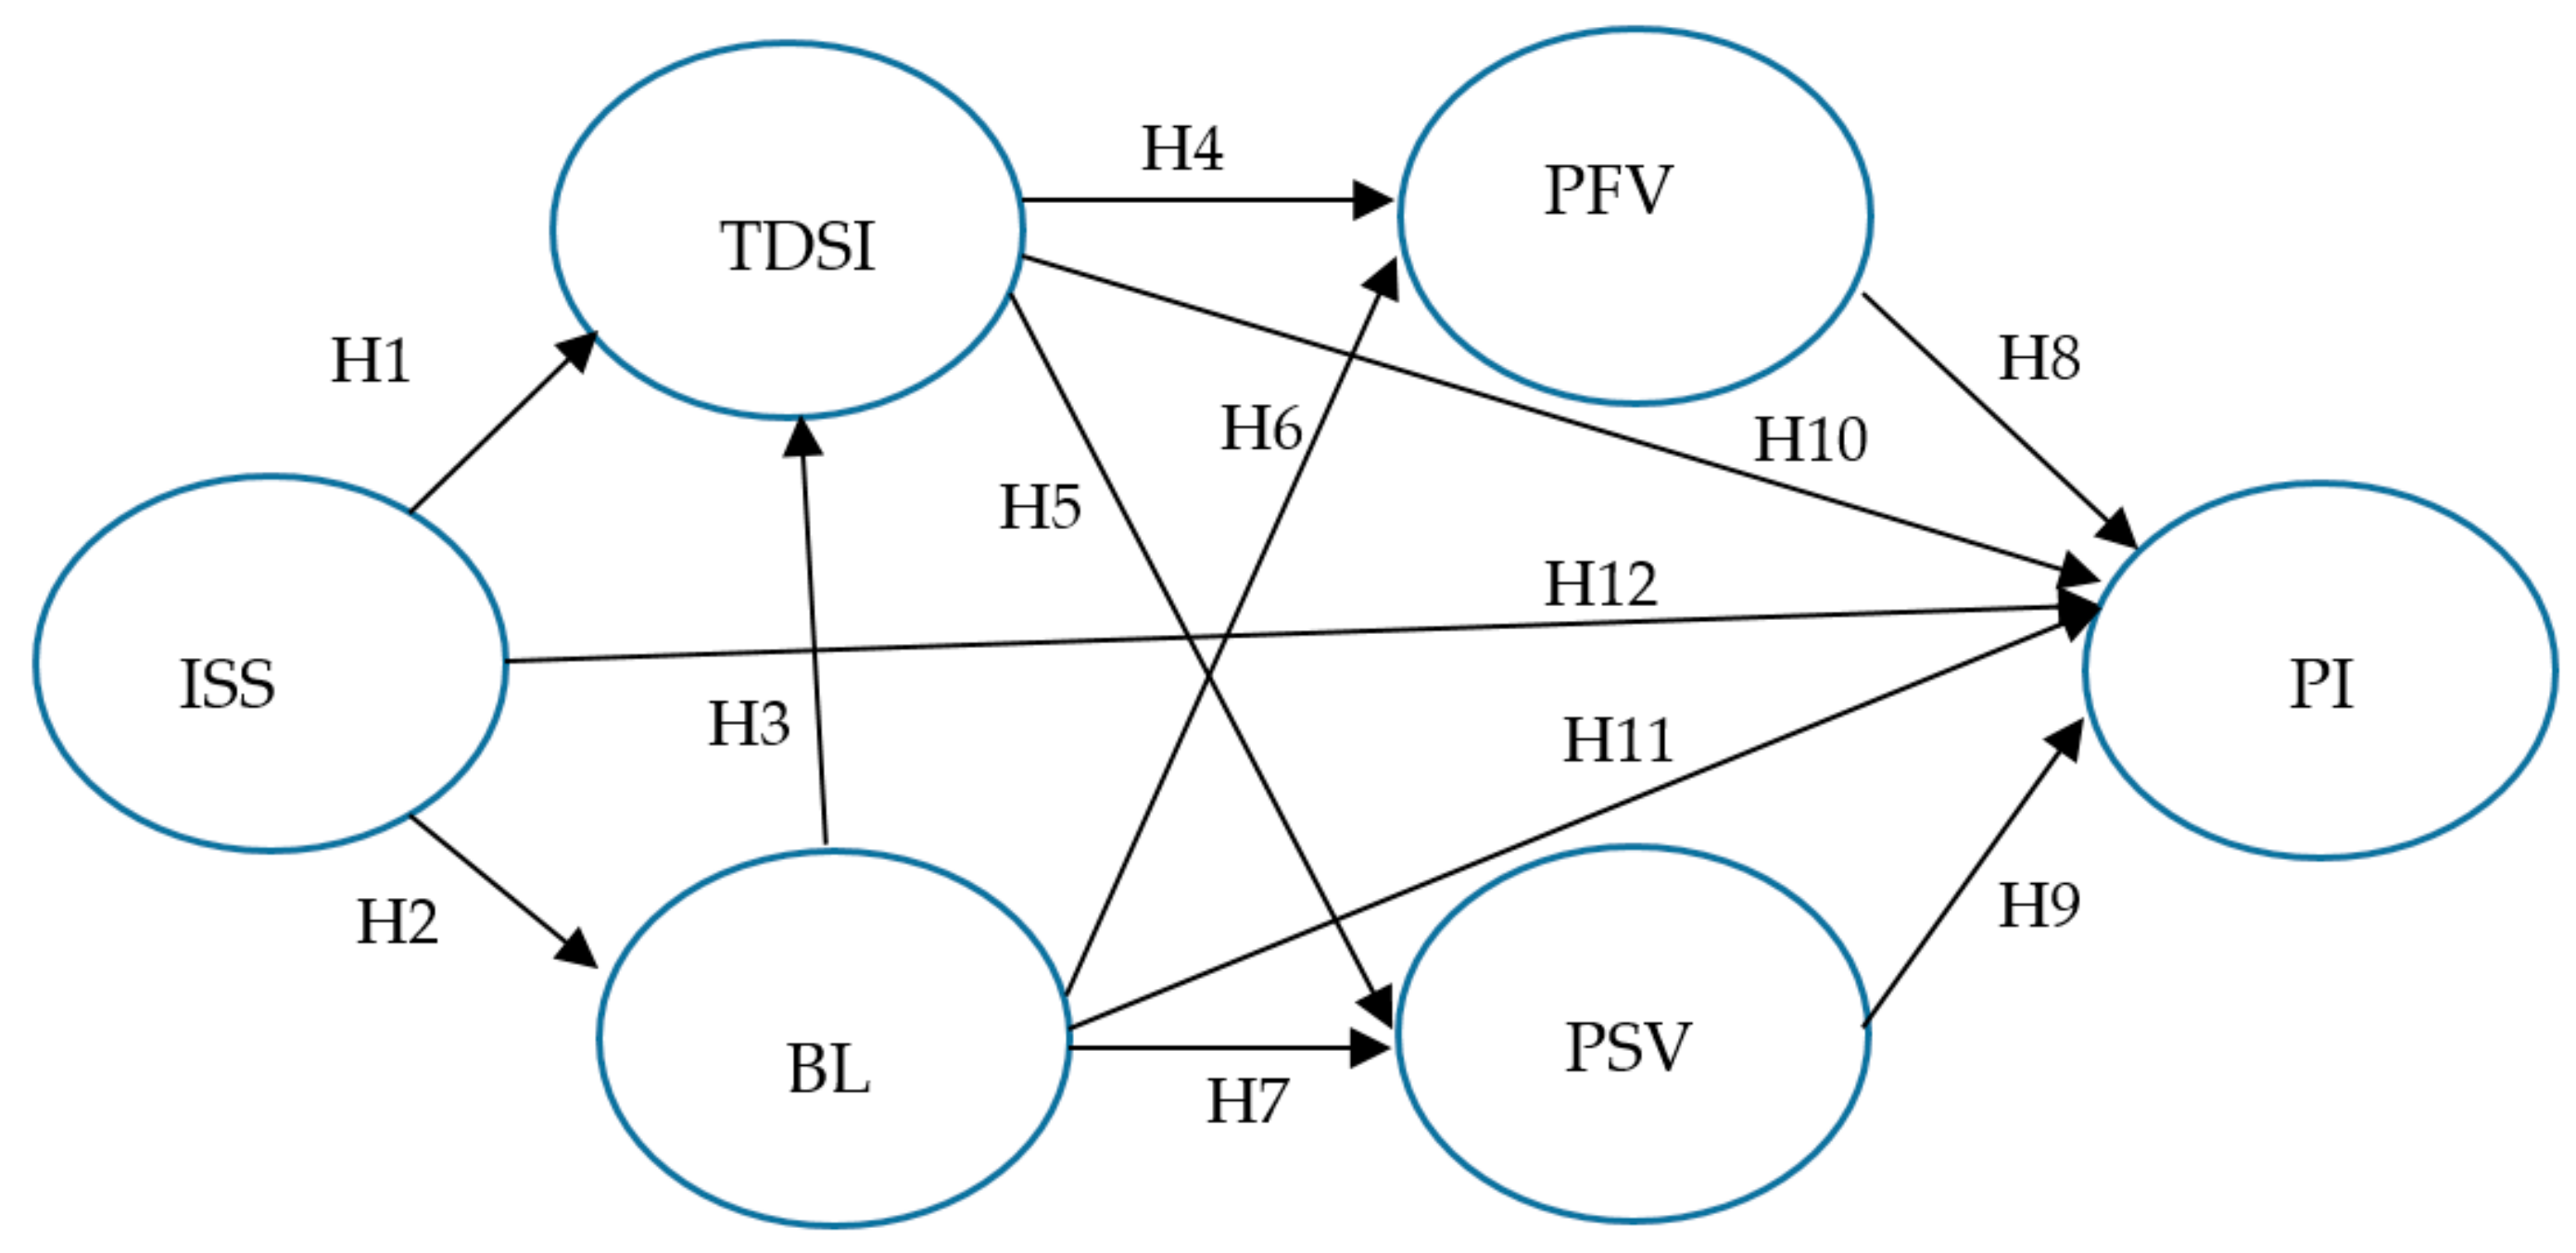
The reminder of the survey contained several items intended to measure TDSI, BL, PFV, PSV, PI, and individual characteristics (demographics). No control variable was specifically used since the study was designed so that the participants who are accustomed to using mobile app and have experience in purchasing cosmetics via mobile commerce, are supposed to respond after using the mobile apps. All items shown in Table 2 were measured on a seven-point Likert-type scale, ranging from “strongly disagree” (1) to “strongly agree” (7). Prior to analyzing the proposed research model, the first step was to verify the reliability and convergent validity of the survey items, and the factor loading values had to exceed the recommended minimum measurement (0.7) to evidence that every item is an appropriate explanation for the dimensionality of the factors [1,2]. In this study, after conducting the construct validity measurement using item loading, average variance extraction (AVE) and composite reliability (CR), we had to ensure that Cronbach’s α, factor loading, and CR were more than 0.7 and AVE was more than 0.5 [100,101], for the sake of validity acceptance [11,102].

3.3. Statistical Analyses

For the sake of testing the validity of the proposed research model, confirmatory factor analysis (CFA) was conducted employing structural equation modeling (SEM), run via AMOS software, which allows causality models with latent variables using maximum likelihood estimation [109,110]. The model validity, which stands for validity of the relationship between six latent variables with eleven hypothesized relationships, were tested utilizing CFA, while the model reliability was tested using Cronbach’s alpha. The model validity was assessed by inspecting the overall fit and construct validity; (1) besides, we calculated χ 2 / d f (relative chi-square), comparative fit index (CFI), Tucker Lewis index (TLI), incremental fit index (IFI), and root mean square error of approximation (RMSEA), to verify that the model showed acceptable fit [105]; (2) item loading, AVE, and CR were evaluated for the construct validity measures.

4. Results

4.1. Measurement Model

The analysis was conducted based on the 240 valid surveys, which were properly filled out by the respondents. Prior to AMOS analyses, an exploratory factor analysis (EFA) was performed for the purposes of reducing the number of variables in the construct using SPSS 18. Using varimax rotation, the latent root criterion of 1.0 was used for factor inclusion, and a factor loading cut-off was fixed at 0.70. This EFA procedure resulted in six factors with an eigen value of greater than 1 which explained 83.583% of the total variance. The Kaiser-Meyer-Olkin (KMO) measure of sampling adequacy was 0.903 (above target with KMO > 0.5), and the significance value of Bartlett’s test of sphericity was 0.000 (above target with p < 0.05). As represented in Table 3, it was confirmed that all single values of the factors loading in the proposed model exceeded the recommended minimum measurement (0.7), revealing the high loading of items in the specific construct. The resulting value indicates that the model was a pertinent explanation for the dimensionality [111,112]. Cronbach’s alphas for the constructs all reached a level of significance (>0.7), supporting that the model is reliable [11,112,113].
Table 3 also verifies that all of the six factors showed an adequate convergent validity, every latent variable had a composite reliability (CR) above 0.70 and an average variance extracted (AVE) above 0.50, indicating that both CR and AVE values exceeded the corresponding cut-off criteria [11,102]. Furthermore, each latent variable’s AVE was larger than all the corresponding squared correlation coefficients in every case, demonstrating that the constructs were distinct and fitly explained by their measurement scales (see Table 4). Therefore, convergence and discriminant validity have been ensured and been proven to be suitable for our measurement model [108,114].
We conducted CFA using AMOS 20.0 to test the measurement model. As SEM is appropriate for testing the proposed model, we used the maximum likelihood method to test the fit of the model. The model was found to provide a good fit with the data (χ2/df = 2.141, CFI = 0.961, TLI = 0.954, IFI = 0.961, RMSEA = 0.069) as illustrated in Table 5. The overall fit met the conventional cutoff criteria.

4.2. Structural Paths and Hypotheses Tests

Table 6 and Figure 7 delineate the standardized path coefficient and path significance for each of the hypotheses. ISS (β = 0.508, t = 7.716) had a significantly positive impact on both TDSI and BL, as hypothesized at H1 and H2. BL (β = 0.106, t = 1.735) did not affect TDSI of the skin safety levels for individual ingredients used in final cosmetic formulations. TDSI showed a strong effect on PFV and PSV for GGC with ingredients classified as low hazardousness for the skin according to guideline of EWG in United States which is a non-profit, non-partisan organization (β = 0.704, t = 11.299 for the test of H4 and β = 610, t = 9.992 for the test of H5). H7, in the same manner as H1, H2, H4, and H5, was accepted confirming that brand loyalty had a positive effect (β = 0.159, t = 2.907) on PSV for GGC. However, the effects of BL on PFV for GGC (β = 0.063, t = 1.195) and of PFV for GGC on purchase intention (PI) of GGC (β = 0.044, t = 0.490) were not significant; hence, H6 and H8 were not supported. As hypothesized at H9, H10, and H12, the positive effects of PSV for GGC (β = 0.255, t = 3.238), TDSI (β = 0.286, t = 2.580) and ISS (β = 0.165, t = 2.341) on PI of GGC, were supported from the test results. BL (β = −0.125, t = −2.519) indicated a negative effect on PI, which resulted in supporting H11.

5. Discussion

The aim of our study was to investigate the effects of factors such as involvement in skin safety, trust in domain specific information, and perceived safety and social values of green grade cosmetics, on purchase intention of green-grade cosmetics. Brand loyalty factor was also considered for our research model. For the sake of manipulating the respondents’ context as identical as possible, we created a simple mobile e-commerce app and used it as a stimulus for this study. Through the mobile shopping mall, we provided information on the safety ratings of all ingredients and their average safety level for individual cosmetic products according to a standard sourced by a non-profit, non-partisan organization (e.g., EWG’s Skin Deep® Cosmetic Guide) [95], and made up only the cosmetic products with high skin safety ratings (commonly referred to as green-grade cosmetics). Besides, in order to minimize the variance between the respondents’ understanding level of the research app and the proficiency of its use, respondents were instructed to preview the Hwahae and Glowpick apps, which provided a safety rating for each ingredients of cosmetic products in a similar way to the research app.

5.1. Key Findings

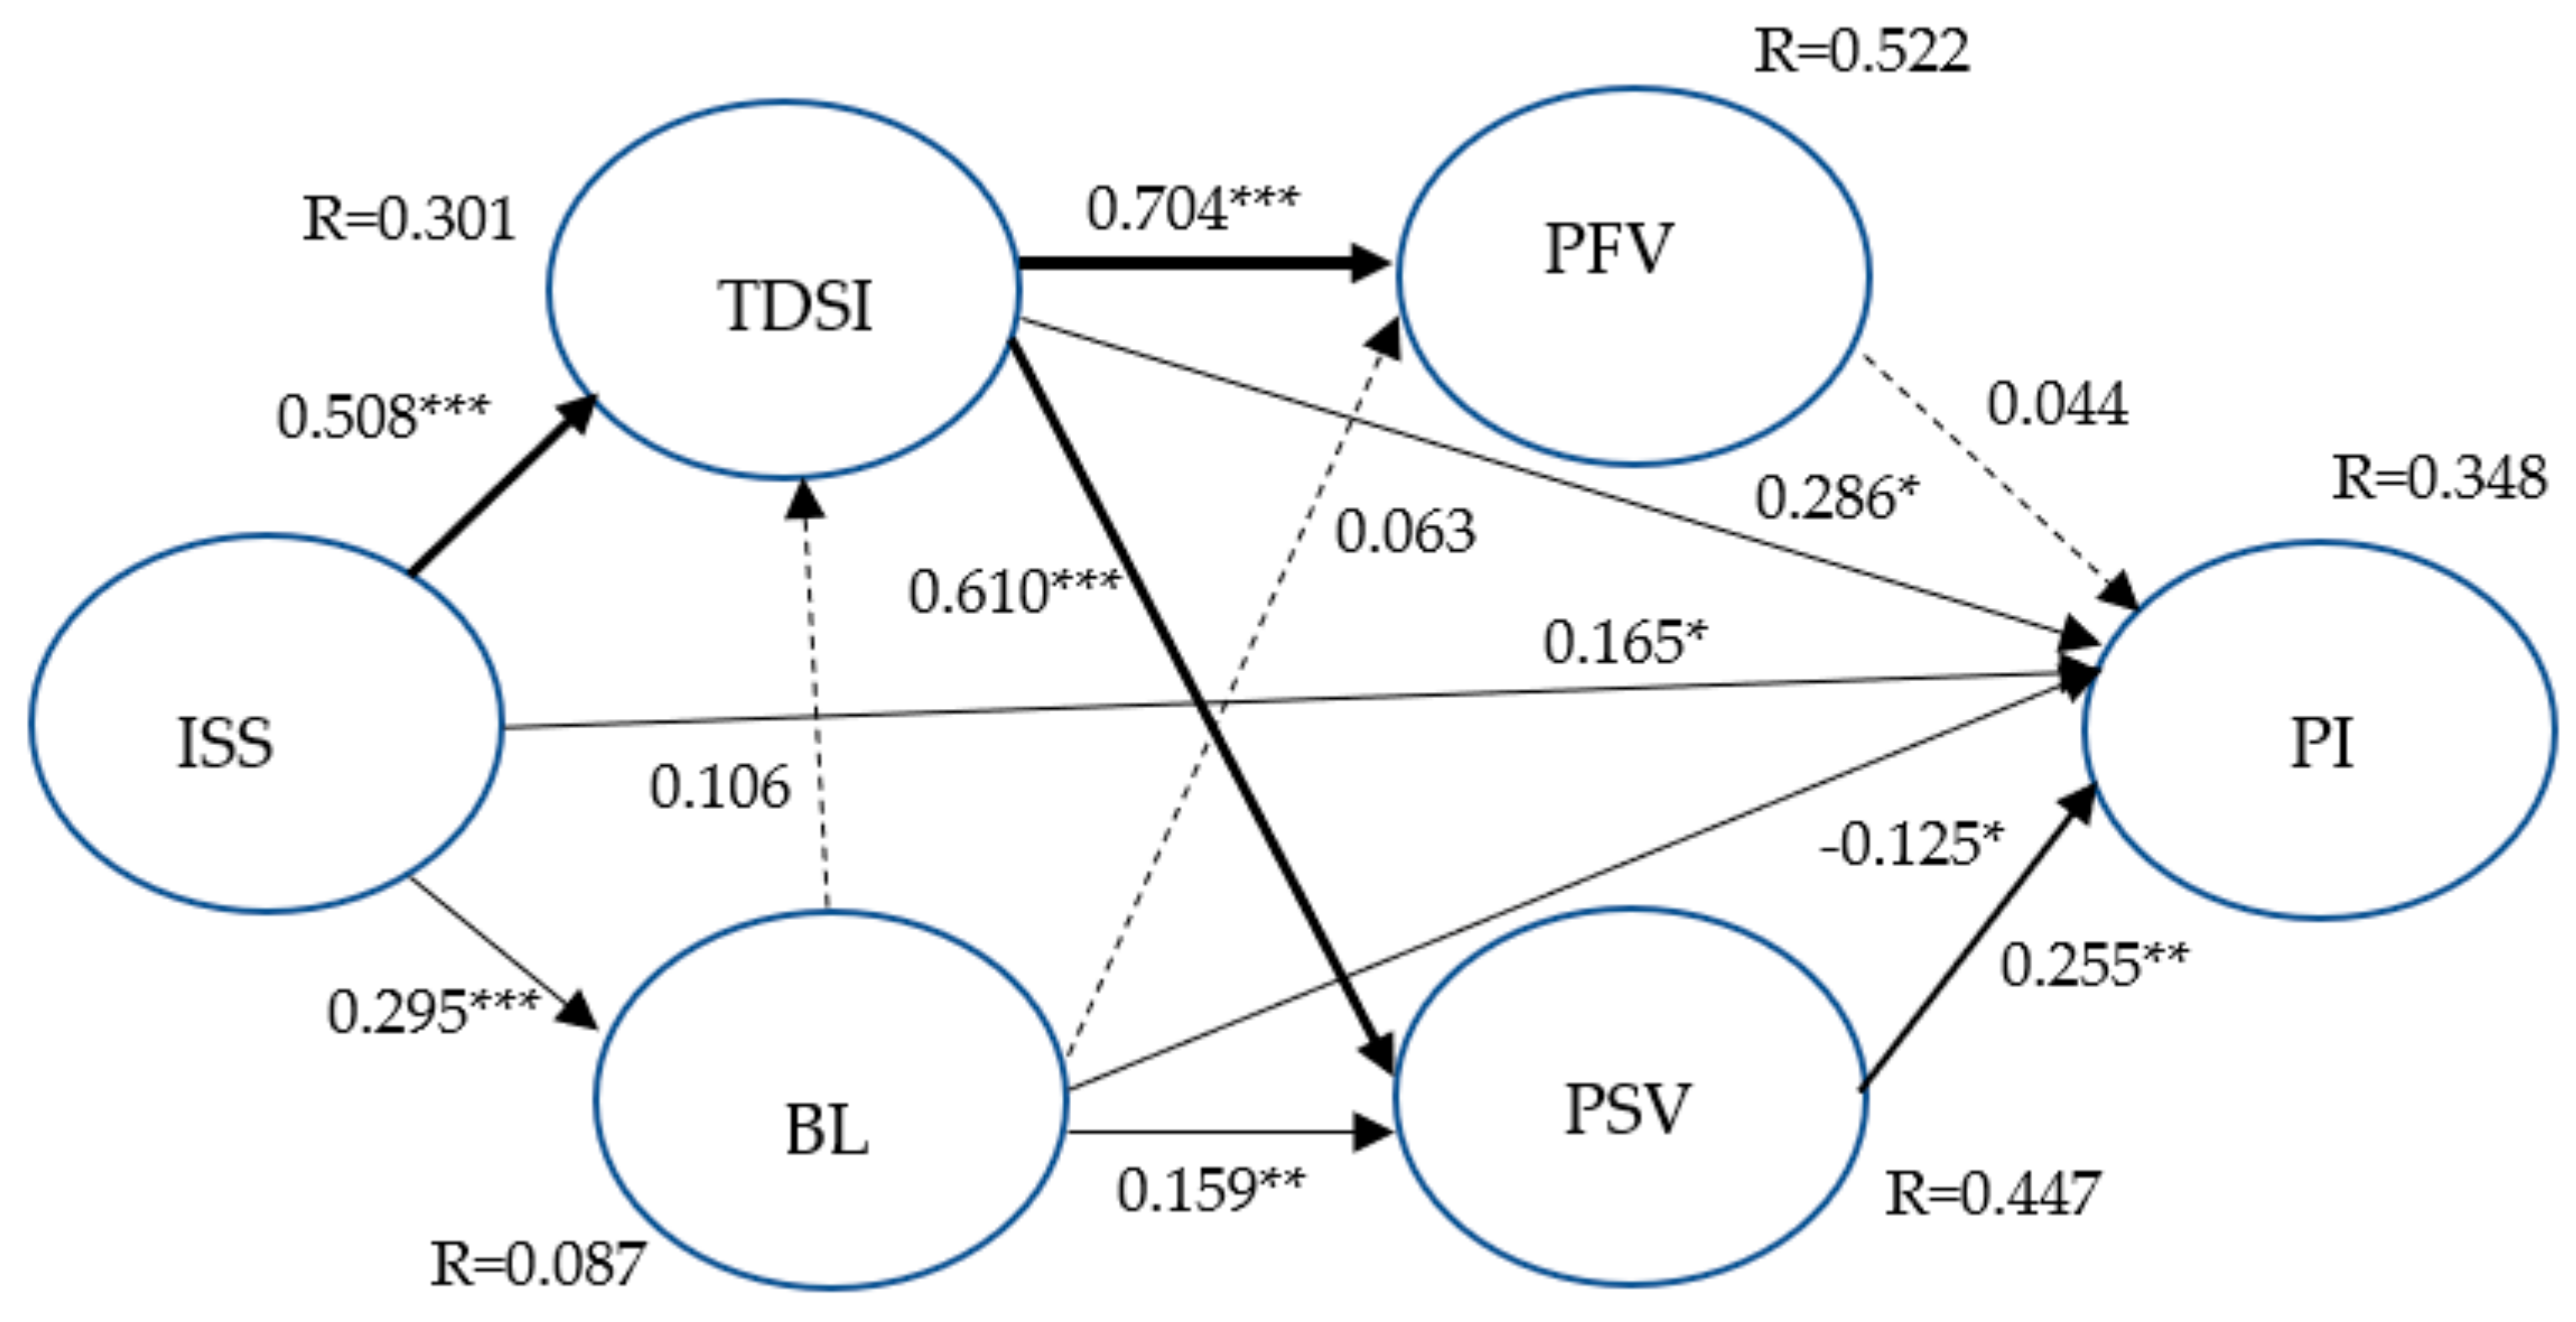
Involvement in skin safety (β = 0.508, t = 7.716) had a strong positive effect on trust in domain-specific information for safety rating of cosmetic ingredients; that is, it has been found that consumers who place more importance on skin safety when purchasing cosmetics show greater confidence in the information on the safety ratings of product ingredients from third-party agencies specialized in the cosmetics industry such as EWG. In addition, our finding indicated that the higher the level of involvement in skin safety, the higher the brand loyalty, as H1 was supported; it can be inferred that the expectation that a certain brand of cosmetics will be safe for the skin is a reason consumers are loyal to the brand. We speculated that based on the inference that consumers who show high loyalty to a particular brand are likely to be more largely engaged in quality of cosmetics, they will show greater trust on skin safety data of cosmetic raw materials rated according to certain criteria; however, there was no relationship between brand loyalty and trust in domain-specific information of skin safety for cosmetic ingredients, which was different from our assumption (H3 was rejected).
Trust in domain-specific information of the safety for cosmetic ingredients had a very strong positive effect on perceived safety value of green-grade cosmetics (β = 0.704, t = 11.299), but our test result showed that the perceived safety value did not affect the purchase intention (β = 0.044, t = 0.490). On the other hand, our test results verified that the trust in domain-specific information has a strong positive influence on perceived social value of green-grade cosmetics (β = 0.610, t = 9.992), and subsequently the perceived social values (β = 0.255, t = 3.238) affected the purchase intention of green-grade cosmetics at a significant level. Meanwhile, involvement in skin safety in skin safety of cosmetics (β = 0.165, t = 2.341) and trust in domain-specific information of skin safety for cosmetic ingredients (β = 0.286, t = 2.580) had a positive effect on the purchase intention of green-grade cosmetics. These findings suggest that although the perceived importance of consumers on skin safety and trust of the related information from specialized agencies in this domain are important factors in the purchase intention of green-grade cosmetics and the trust is also very important to the perceived safety value of their perceived green-grade cosmetics, the perceived safety value does not lead to the purchase intention of their green-grade cosmetics; instead, our test results state that their perceived social value for green-grade cosmetics directly effects the purchase intention of those products. These results imply that the purchase intention of green-grade cosmetics is not driven by the perceived safety value of safety for those cosmetics but motivated by perceived social value such as social recognition or pride in using the cosmetics with green concept.
Brand loyalty did not affect the perceived safety value (β = 0.063, t = 1.195) of green-grade cosmetics but was found to be a cause for the perceived social value (β = 0.159, t = 2.907) of such products. Besides, brand loyalty (β= −0.125, t= −2.519) had an adverse effect on the purchase intention of green-grade cosmetics. From these results, it is interpreted that consumers with higher brand loyalty put more weight on perceived social values, such as public recognition and solidarity as members of society, rather than just on the perceived safety value for green-grade cosmetics. Since consumers with higher brand loyalty show lower brand switching intention [101], it is inferred that despite the positive effect on perceived social value of brand loyalty, the factor has an adverse impact on the intention to purchase green-grade cosmetics, which may be an alternative to brand cosmetics.

5.2. Theoretical Implications

We originally designed a conceptual framework with PFV and PSV, including perceived emotion value (PEV) latent variables. However, the PEV factor was removed in consideration of the study purpose and model suitability, since the distinction of PEV and PFV variables was not clear and the construct validity was not secured, while processing the explanatory factor analysis (EFA). Although PFV did not have a significant effect on PI, PSV showed a positive effect on the dependent variable, so we conducted an additional analysis of our model by substituting PFV latent variable to perceived emotion value and verified its construct validity, reliability, and goodness of fit indices for the research model (see the results from Table A1, Table A2 and Table A3). Like PSV, perceived emotion value of green-grade cosmetics was found to positively influence the purchase intention of those products. It is interpreted that respondents perceive the terms green color and green-grade as “green” in a broader sense than the scope of safety of the ingredients, given that EWG ’s Skin Deep [72], our research app, Hwahae, and Glowpick are displaying and communicating with consumers on safe grades of cosmetic ingredients. It is inductively inferred that the broader meaning of the term “green” in an intuitive sense based on respondents’ life experiences acted as an important signal, and it had an important influence on the purchase intention of green-grade cosmetics. In other words, it is assumed that the word “green” and its color image acted as an environmental stimuli leading to emotional response, based upon stimulus-organism-responses (SOR) theory; “green” as an environmental stimulus (S) called emotional reactions (O), which in turn derived consumers’ purchase intention (R) [103,107,121].

5.3. Practical Implications

From our hypothesis testing, we ascertained that the higher the involvement in skin safety, the higher the trust in domain specific information, and the lower the brand loyalty and the greater the consumer’s intention to purchase green-grade cosmetics. Given those results, the following suggestions may be given to the stakeholders related to a cosmetic business: (1) New entrants to the cosmetic business or companies with relatively weak brand power will be able to facilitate consumer purchases by developing and promoting green-concept cosmetics while using information from human safety databases from domain specific organizations; (2) cosmetic manufacturers and sellers through mobile commerce will be encouraged to have consumer communications in a clear and compelling and legible sentence on the mobile shopping window with evidence on the skin safety of green-grade cosmetics; (3) manufacturers with relatively weak brand power are encouraged to identify credible specialist agencies that can ensure trust in the safety of cosmetic ingredients in terms of both breadth and depth, and are imperative to construct ample databases with diverse types of safety criteria and data, which convince consumers; (4) sellers via mobile commerce will also be able to build these databases, establish sellers’ criteria for green-grade cosmetics, and share this information with consumers and their suppliers (i.e., manufacturers) to increase transparency and persuasion, which may lead to stimulating consumers’ purchases and engaging more partners.
In addition, perceived social value also had a positive effect on the purchase intention of green-grade cosmetics, whereas perceived safety value of green-grade cosmetics was not a cause of purchase intention of the products. As stated in the previous section, consumers of green-grade cosmetics tend to purchase such products because of their social value such as social recognition, acceptance, and pride rather than the functional value of the product. These results may be interpreted that the functional value of the green-grade cosmetics’ safety attribute alone is difficult to meet the usefulness of consumers to determine their purchase. From the positive effects of social value on purchasing intentions, it is expected to lead business growth that e-commerce sellers and cosmetics manufacturers share a portion of their sales revenues with those located at bottom of pyramid (BOP) [122], e.g., through sponsoring low-income patients with skin diseases or certain organization such as international relief NGOs.

6. Limitations and Future Research

This study still has some limitations and shortcomings in this paper that need further exploration in the future. First, although the mobile commerce app was developed to realistically design the experimental situation, the data of the structures used in this study were self-reported and may contain some biases. The measurement of the variables, ISS, TDSI, BL, PFV, PSV, and PI, is based on subjective response. Because capturing consumers’ ideas and thoughts lack a longitudinal analysis of customer behavior, future research will call more direct data that encourage consumers to click on purchase function keys and write review texts in e-commerce mobile apps developed for research purposes. By analyzing those data, we will be able to gain a more comprehensive understanding of how domain specific information of safety data for cosmetics affects the purchase intention. Second, since we were limited in finding statistics showing the percentage of consumers purchasing cosmetic products through mobile shopping by age, gender, and income, rather than the optimal sample elements, we relied on a paid industry statistic such as Eurominitor data and advices from industry experts. Third, this trial mobile app did not work on the iOS operating system and only ran in the Android environment, so there was a limit to involving Apple phone users in the experiment. In the future study, research apps could actually register the Android and IOS app markets, improving the flexibility of sampling by allowing subjects to use them without inconvenience.

Author Contributions

K.C.L. supervised and reviewed the manuscripts and E.C. conducted literature review, data processing and analysis, and manuscript preparation.

Funding

This research received no external funding.

Conflicts of Interest

The authors declare no conflict of interest.

Appendix A

Table A1. Construct statistics replacing a factor, from PFV to PEV.
FactorItemFactor LoadingsCronbach’s αComposite Reliability (CR)Average Variance Extracted (AVE)
ISS10.870
ISSISS20.8450.9030.7950.564
ISS30.862
TDSITDSI10.7310.9240.7770.649
TDSI20.811
TDSI30.819
TDSI40.785
BL10.949
BLBL20.9480.9290.8370.636
BL30.840
PEV10.949
PEVPEV20.9480.8800.8260.614
PEV30.840
PSV10.781
PSV20.747
PSVPSV30.8640.9370.8430.519
PSV40.828
PSV50.828
PIPI10.9150.9570.9080.713
PI20.915
PI30.791
PI40.860
Note: ISS—involvement in skin safety; TDSL—trust in domain specific information; BL—brand loyalty; PEV—perceived emotion value; PSV—perceived social value; PI—purchase intention. The measurement items of PEV are as follows; PEV1: green-grade cosmetics would make me feel good; PEV2: I want to use green-grade cosmetics; PEV3: green-grade cosmetic product is the one that I would enjoy [107,108].
Table A2. Squared correlations between constructs, replacing a factor from PFV to PEV.
Latent VariablesAVE vs. Square of the Correlation Coefficients
123456
1ISS0.564 *
2TDSI0.2830.649 *
3BL0.0860.0650.636 *
4PFV0.2250.3920.0280.614 *
5PSV0.1470.4100.0990.4100.519 *
6PI0.1540.2810.0040.2750.2330.713 *
Note 1: The numbers in the diagonal row (in bold) AVE, indicating discriminant validity are proven, given every AVE is greater than all the corresponding squared correlation coefficients.
Table A3. Results of hypothesis testing.
HPathβS.E.C.R.Result
H1ISS → TDSI0.5130.0557.780 ***Supported
H2ISS → BL0.2950.0594.349 ***Supported
H3BL → TDSI0.1040.0581.713Rejected
H4TDSI → PEV0.6490.05710.497 ***Supported
H5TDSI → PSV0.6140.07810.053 ***Supported
H6BL → PEV−0.0040.050−0.069Rejected
H7BL → PSV0.1580.0672.898 **Supported
H8PEV → PI0.2120.0992.716 **Supported
H9PSV → PI0.1910.0712.439 *Supported
H10TDSI → PI0.2430.1202.353 *Supported
H11BL → PI−0.1320.065−2.262 *Supported
H12ISS → PI0.1340.0681.904 Supported
Note 1: χ 2 / d f —2.563; CFI—0.950; TLI—0.942; IFI—0.950; RMSEA—0.081 (approximately meeting the cutoff value); ***: p < 0.001; **: p < 0.01; *: p < 0.05, = 0.057.

References

  1. Jin Kwon, Y. The Emergence of K-beauty: Rituals and Myths of Korean Skin Care Practice. In Proceedings of the International Textile and Apparel Association (ITAA) Annual Conference, Cleveland, OH, USA, 5–9 November 2018. [Google Scholar]
  2. Jung, J. Young women’s perceptions of traditional and contemporary female beauty ideals in China. Family Consum. Sci. Res. J. 2018, 47, 56–72. [Google Scholar] [CrossRef]
  3. Lee, S.; Sung, B.; Phau, I.; Lim, A. Communicating authenticity in packaging of Korean cosmetics. J. Retail. Consum. Serv. 2019, 48, 202–214. [Google Scholar] [CrossRef]
  4. Export of Cosmetics to Korea. Available online: https://2016.export.gov/southkorea/doingbusinessinskorea/leadingsectorsforusexportsinvestment/cosmetics/index.asp (accessed on 31 August 2019).
  5. Beauty & Personal Care, South Korea. Available online: https://www.statista.com/outlook/70000000/125/beauty-personal-care/south-korea (accessed on 30 August 2019).
  6. Statistics Korea-Online Shoping in July 2019. Available online: http://kostat.go.kr/portal/eng/pressReleases/3/1/index.board?bmode=list&bSeq=&aSeq=&pageNo=1&rowNum=10&navCount=10&currPg=&searchInfo=&sTarget=title&sTxt= (accessed on 29 September 2019).
  7. Daily, O.J. Baby Suits to Prepare for the Summer Vacation for Checksumer. Available online: https://newsbeezer.com/koreaeng/baby-suits-to-prepare-for-the-summer-vacation-for-checksumer/ (accessed on 31 August 2019).
  8. Kim, P.; Leem, J.-H. The humidifier disinfectant scandal: The need for vigorous government oversight of chemicals and household products to secure public safety. Environ. Health Toxicol. 2016, 31, 1–2. [Google Scholar] [CrossRef] [PubMed]
  9. Kim, J.H.; Kim, T.; Yoon, H.; Jo, A.; Lee, D.; Kim, P.; Seo, J. Health risk assessment of dermal and inhalation exposure to deodorants in Korea. Sci. Total Environ. 2018, 625, 1369–1379. [Google Scholar] [CrossRef]
  10. Kim, H. Do You Know “Persumer” or “Checksumer”—Humidifier Sterilizer Wave, Lay New Word. Available online: https://translate.google.com/translate?hl=en&sl=ko&u=http://news.kmib.co.kr/article/view.asp%3Farcid%3D0923575284&prev=search (accessed on 31 August 2019).
  11. Chin, J.; Jiang, B.C.; Mufidah, I.; Persada, S.F.; Noer, B.A. The investigation of consumers’ behavior intention in using green skincare products: A pro- environmental behavior model approach. Sustainability 2018, 10, 3922. [Google Scholar] [CrossRef]
  12. Song, Y.; Guo, S.; Zhang, M. Assessing customers’ perceived value of the anti-haze cosmetics under haze pollution. Sci. Total Environ. 2019, 685, 753–762. [Google Scholar] [CrossRef]
  13. Ghazali, E.; Soon, P.C.; Mutum, D.S.; Nguyen, B. Health and cosmetics: Investigating consumers’ values for buying organic personal care products. J. Retail. Consum. Serv. 2017, 39, 154–163. [Google Scholar] [CrossRef]
  14. Barrett, J.R. Chemical Exposures: The Ugly Side of Beauty Products. Environ. Health Pers. 2005, 113, A24. [Google Scholar] [CrossRef]
  15. Soto, M.L.; Falqué, E.; Domínguez, H. Relevance of natural phenolics from grape and derivative products in the formulation of cosmetics. Cosmetics 2015, 2, 259–276. [Google Scholar] [CrossRef]
  16. Nohynek, G.J.; Antignac, E.; Re, T.; Toutain, H. Safety assessment of personal care products/cosmetics and their ingredients. Toxicol. Appl. Pharmacol. 2010, 243, 239–259. [Google Scholar] [CrossRef]
  17. Mintel’s Global New Products Database. Available online: https://www.gnpd.com/sinatra/anonymous_frontpage/?cookie_test=yes# (accessed on 30 January 2019).
  18. Kim, S. Hwahae Places First in the Korean Beauty App Category. Available online: http://www.techforkorea.com/2017/08/02/hwahae-places-first-in-the-korean-beauty-app-category/ (accessed on 31 August 2019).
  19. An App that Helps You Find the Safest Makeup. Available online: http://koreajoongangdaily.joins.com/news/article/article.aspx?aid=3027940 (accessed on 31 August 2019).
  20. Marto, J.; Pinto, P.; Fitas, M.; Gonçalves, L.M.; Almeida, A.J.; Ribeiro, H.M. Safety assessment of starch-based personal care products: Nanocapsules and pickering emulsions. Toxicol. Appl. Pharmacol. 2018, 342, 14–21. [Google Scholar] [CrossRef] [PubMed]
  21. Lee, B.M.; Kwon, S.; Cho, Y.M.; Kim, K.B.; Seo, K.; Min, C.S.; Kim, K. Perspectives on trace chemical safety and chemophobia: Risk communication and risk management. J. Toxicol. Environ. Health. 2019, 82, 113–127. [Google Scholar] [CrossRef] [PubMed]
  22. Lee, J.; Hwang, J.S. The effect of cosmetic consumption need on buying motive, brand satisfaction, attachment, and loyalty. J. Korean Soc. Cloth. Textiles 2013, 3, 882–893. [Google Scholar] [CrossRef]
  23. Lores, M.; Llompart, M.; Alvarez-Rivera, G.; Guerra, E.; Vila, M.; Celeiro, M.; Lamas, J.P.; Garcia-Jares, C. Positive lists of cosmetic ingredients: Analytical methodology for regulatory and safety controls—A review. Analytica Chimica Acta 2016, 915, 1–26. [Google Scholar] [CrossRef] [PubMed]
  24. Bom, S.; Jorge, J.; Ribeiro, H.M.; Marto, J. A step forward on sustainability in the cosmetics industry: A review. J. Clean. Prod. 2019, 225, 270–290. [Google Scholar] [CrossRef]
  25. Liobikienė, G.; Bernatonienė, J. Why determinants of green purchase cannot be treated equally? The case of green cosmetics: Literature review. J. Clean. Prod. 2017, 162, 109–120. [Google Scholar] [CrossRef]
  26. Moreira, L.C.; de Ávila, R.I.; Veloso, D.F.M.C.; Pedrosa, T.N.; Lima, E.S.; do Couto, R.O.; Lima, E.M.; Batista, A.C.; de Paula, J.R.; Valadares, M.C. In vitro safety and efficacy evaluations of a complex botanical mixture of Eugenia dysenterica DC. (Myrtaceae): Prospects for developing a new dermocosmetic product. Toxicol. In Vitro 2017, 45, 397–408. [Google Scholar] [CrossRef]
  27. Marrelli, M.; Conforti, F.; Toniolo, C.; Nicoletti, M.; Statti, G.; Menichini, F. Hypericum perforatum: Influences of the habitat on chemical composition, photo-induced cytotoxicity, and antiradical activity. Pharm. Biol. 2014, 52, 909–918. [Google Scholar] [CrossRef]
  28. Olsen, N.V.; Menichelli, E.; Meyer, C.; Næs, T. Consumers liking of private labels. An evaluation of intrinsic and extrinsic orange juice cues. Appetite 2011, 56, 770–777. [Google Scholar] [CrossRef]
  29. Dawar, N.; Parker, P. Marketing universals: consumers’ use of brand name, price, physical appearance, and retailer reputation as signals of product quality. J. Market. 1994. [Google Scholar] [CrossRef]
  30. Nia, A.; Lynne Zaichkowsky, J. Do counterfeits devalue the ownership of luxury brands? J. Prod. Brand Manag. 2000, 9, 485–497. [Google Scholar] [CrossRef]
  31. O’Cass, A.; Frost, H. Status brands: Examining the effects of non-product-related brand associations on status and conspicuous consumption. J. Prod. Brand Manag. 2002, 11, 67–88. [Google Scholar] [CrossRef]
  32. Workman, J.E.; Cho, S. Gender, fashion consumer groups, and shopping orientation. Family Consum. Sci. Res. J. 2012, 40, 267–283. [Google Scholar] [CrossRef]
  33. Schade, M.; Hegner, S.; Horstmann, F.; Brinkmann, N. The impact of attitude functions on luxury brand consumption: An age-based group comparison. J. Bus. Res. 2016, 69, 314–322. [Google Scholar] [CrossRef]
  34. Tirole, J. The Theory of Industrial Organization; MIT Press: Cambridge, MA, USA, 1988; ISBN 0262200716. [Google Scholar]
  35. Rao, A.R.; Ruekert, R.W. Brand Allience as Signals of Product Quality. Sloan Manag. Rev. 1994, 36, 87–97. [Google Scholar]
  36. Steenkamp, J.B.E.M.; Batra, R.; Alden, D.L. How perceived brand globalness creates brand value. J. Int. Bus. Stud. 2003, 34, 53–65. [Google Scholar] [CrossRef]
  37. Baek, T.H.; Kim, J.; Yu, J.H. The differential roles of brand credibility and brand prestige in consumer brand choice. Psychol. Market. 2010, 27, 763–785. [Google Scholar] [CrossRef]
  38. Hu, X.; Wu, G.; Wu, Y.; Zhang, H. The effects of web assurance seals on consumers’ initial trust in an online vendor: A functional perspective. Decis. Support Syst. 2010, 48, 407–418. [Google Scholar] [CrossRef]
  39. Utz, S.; Kerkhof, P.; Van Den Bos, J. Consumers rule: How consumer reviews influence perceived trustworthiness of online stores. Electron. Commer. Res. Appl. 2012, 11, 49–58. [Google Scholar] [CrossRef]
  40. Griffith, D.A.; Krampf, R.F.; Palmer, J.W. The role of interface in electronic commerce: Consumer involvement with print versus on-line catalogs. Int. J. Electron. Commer. 2001, 5, 135–154. [Google Scholar] [CrossRef]
  41. Zaichkowsky, L.L. Measuring the involvement construct. J. Consum. Res. 1985, 12, 341–352. [Google Scholar] [CrossRef]
  42. Kang, J.; Liu, C.; Kim, S.H. Environmentally sustainable textile and apparel consumption: The role of consumer knowledge, perceived consumer effectiveness and perceived personal relevance. Int. J. Consum. Stud. 2013, 37, 442–452. [Google Scholar] [CrossRef]
  43. Park, D.H.; Lee, J.; Han, I. The effect of on-line consumer reviews on consumer purchasing intention: The moderating role of involvement. Int. J. Electron. Commer. 2007, 11, 125–148. [Google Scholar] [CrossRef]
  44. Park, G.H.; Nam, C.; Hong, S.; Park, B.; Kim, H.; Lee, T.; Kim, K.; Lee, J.H.; Kim, M.H. Socioeconomic factors influencing cosmetic usage patterns. J. Expo. Sci. Environ. Epidemiol. 2018, 28, 242–250. [Google Scholar] [CrossRef]
  45. Corazza, M.; Minghetti, S.; Borghi, A.; Bianchi, A.; Virgili, A. Vitamin E contact allergy: A controversial subject. Dermatitis 2012, 23, 167–169. [Google Scholar] [CrossRef] [PubMed]
  46. Kosari, P.; Alikhan, A.; Sockolov, M.; Feldman, S.R. Vitamin E and allergic contact dermatitis. Dermatitis 2010, 21, 148–153. [Google Scholar] [CrossRef]
  47. González-Muñoz, P.; Conde-Salazar, L.; Vañó-Galván, S. Allergic contact dermatitis caused by cosmetic products. Actas Dermo Sifiliograficas 2014, 105, 822–832. [Google Scholar] [CrossRef]
  48. Liao, C.; Kannan, K. Widespread occurrence of benzophenone-type uv light filters in personal care products from China and the United States: An assessment of human exposure. Environ. Sci. Technol. 2014, 48, 4103–4109. [Google Scholar] [CrossRef]
  49. Hamilton, T.; de Gannes, G.C. Allergic contact dermatitis to preservatives and fragrances in cosmetics. Skin Ther. Lett. 2011, 14, 16. [Google Scholar]
  50. Bross, T.; Feeley, J. J&J Must Pay $72 Million Over Talc Tied to Woman’s Cancer. Available online: https://www.bloomberg.com/news/articles/2016-02-23/j-j-ordered-to-pay-72-million-over-talc-tied-to-ovarian-cancer (accessed on 30 August 2019).
  51. Keller, K.L. Conceptualizing, measuring, and managing customer-based brand equity. J. Market. 1993, 57, 1–22. [Google Scholar] [CrossRef]
  52. Aaker, D.A. Managing Brand Equity; The Free Press: New York, NY, USA, 1991. [Google Scholar]
  53. Oliver, R.L. Whence consumer loyalty? J. Market. 1999, 63, 33–44. [Google Scholar] [CrossRef]
  54. Barich, H.; Kotler, P. A framework for marketing image management. Sloan Manag. Rev. 1991, 32, 94–105. [Google Scholar]
  55. Assael, H. Consumer Behaviour and Marketing Action; South-Western College Publishing 235: Cincinnati, OH, USA, 1995. [Google Scholar]
  56. Boulding, W.A.K. A consumer-side experimental examination of signaling theory: Do consumers perceive warranties as signals of quality? J. Consum. Res. 1998, 20, 111–123. [Google Scholar] [CrossRef]
  57. Beatty, S.E.; Homer, P.; Kahle, L.R. The involvement—Commitment model: Theory and implications. J. Bus. Res. 1998, 16, 149–167. [Google Scholar] [CrossRef]
  58. Oliver, R.L. Satisfaction: A Behavioral Perspective on the Consumer; McGraw-Hill: New York, NY, USA, 1997. [Google Scholar]
  59. Grover, R.; Srinivasan, V. Evaluating the multiple effects of retail promotions on brand loyal and brand switching segments. J. Market. Res. 1992, 29, 76–89. [Google Scholar] [CrossRef]
  60. Asgari, O.; Hosseini, M.S. Exploring the antecedents affecting attitude, satisfaction, and loyalty towards Korean cosmetic brands. J. Distrib. Sci. 2015, 13, 45–70. [Google Scholar] [CrossRef]
  61. Alhedhaif, S.; Lele, U.; Kaifi, B.A. Brand loyalty and factors affecting cosmetics buying behavior of saudi female consumers. J. Bus. Stud. Quart. 2016, 7, 24–38. [Google Scholar]
  62. Rousseau, D.M.; Sitkin, S.B.; Burt, R.S.; Camerer, C. Not so different after all: A cross- discipline view of trust. Acad. Manag. Rev. 1998, 23, 393–404. [Google Scholar] [CrossRef]
  63. Kee, H.W.; Knox, R.E. Conceptual and methodological considerations in the study of trust and suspicion. J. Confl. Resol. 1970, 14, 357–366. [Google Scholar] [CrossRef]
  64. Mayer, R.C.; Davis, J.H.; Schoorman, F.D. An Integrative Model of Organizational Trust. Acad. Manag. Rev. 1995, 20, 709–734. [Google Scholar] [CrossRef]
  65. Johnson-George, C.; Swap, W.C. Measurement of specific interpersonal trust: Construction and validation of a scale to assess trust in a specific other. J. Person. Soc. Psychol. 1982, 43, 1306–1317. [Google Scholar] [CrossRef]
  66. Peter, J.P.; Ryan, M.J. An Investigation of Perceived Risk at the Brand Level. J. Market. Res. 1976, 13, 184–188. [Google Scholar] [CrossRef]
  67. Knight, F.H. Risk, Uncertainty and Profit; Houghton-Mifflin: New York, NY, USA, 1921. [Google Scholar]
  68. Mitchell, V. Consumer perceived risk: Conceptualisations and models. Eur. J. Market. 1999, 33, 163–195. [Google Scholar] [CrossRef]
  69. Pearce, W.B. Trust in interpersonal communication. Speech Monogr. 1974, 41, 236–244. [Google Scholar] [CrossRef]
  70. Dean, D.H.; Biswas, A. Third-party organization endorsement of products: An advertising cue affecting consumer prepurchase evaluation of goods and services. J. Advertis. 2001, 30, 41–57. [Google Scholar] [CrossRef]
  71. Guan, L.; Lala, V. Role of trust and involvement in the effectiveness of digital third-party organization endorsement. Atl. Market. J. 2017, 6, 56–74. [Google Scholar]
  72. User’s Guide to Skin Deep®. Available online: https://www.ewg.org/skindeep/users-guide-to-skin-deep/ (accessed on 25 August 2019).
  73. Hendriks, F.; Kienhues, D. Trust in science and the science of trust. In Trust and Communication in a Digitized World: Models and Concepts of Trust Research; Blöbaum, B., Ed.; Springer: Berlin, Germany, 2016. [Google Scholar]
  74. Dodds, W.B.; Monroe, K.B. The effect of brand and price information on subjective product evaluations: Metasearch for University of St.Gallen, library. Adv. Consum. Res. 1985, 12, 85–90. [Google Scholar]
  75. Hellier, P.K.; Geursen, G.M.; Carr, R.A.; Rickard, J.A. Customer repurchase intention. Eur. J. Market. 2003, 37, 1762–1800. [Google Scholar] [CrossRef] [Green Version]
  76. Zeithaml, V.A. Consumer perceptions of price, quality, and value: A means-end model and synthesis of evidence. J. Market. 1988, 52, 2–22. [Google Scholar] [CrossRef]
  77. Flint, D.J.; Woodruff, R.B.; Gardial, S.F. Exploring the phenomenon of customers’ desired value change in a business-to-business context. J. Market. 2002, 66, 102–117. [Google Scholar] [CrossRef]
  78. Sweeney, J.C.; Soutar, G.N. Consumer perceived value: The development of a multiple item scale. J. Retail. 2001, 77, 203–220. [Google Scholar] [CrossRef]
  79. Koh, B. Chemical Aversion Grows among Health-Conscious Consumers in S. Korea. Available online: https://en.yna.co.kr/view/AEN20161102006000315 (accessed on 30 August 2019).
  80. Ma, H.; Bradshaw, H.K.; Janakiraman, N.; Hill, S.E. Spending as protection: The need for safety increases preference for luxury products. Market. Lett. 2019, 30, 45–56. [Google Scholar] [CrossRef]
  81. Sheth, J.N.; Newman, B.I.; Gross, B.L. Why we buy what we buy: A theory of consumption values. J. Bus. Res. 1991, 22, 159–170. [Google Scholar] [CrossRef]
  82. Kumar, P.; Ghodeswar, B.M. Factors affecting consumers’ green product purchase decisions. Market. Intell. Plann. 2015, 33, 330–347. [Google Scholar] [CrossRef]
  83. Cha, M.K.; Yi, Y.; Bagozzi, R.P. Effects of customer participation in corporate social responsibility (CSR) programs on the CSR-brand fit and brand loyalty. Cornell Hospit. Quart. 2016, 57, 235–249. [Google Scholar] [CrossRef]
  84. Belk, R.W. Possessions and the extended self. J. Consum. Res. 1988, 15, 139–168. [Google Scholar] [CrossRef]
  85. Anderson, J.C.; Narus, J.A. Business marketing: Understand what customers value. Harvard Bus. Rev. 1998, 76, 53–65. [Google Scholar]
  86. Parasuraman, A.; Berry, L.; Zeithaml, V. A Understanding customer expectations of service. Sloan Manag. Rev. 1991, 32, 39–45. [Google Scholar]
  87. Peng, L.; Zhang, W.; Wang, X.; Liang, S. Moderating effects of time pressure on the relationship between perceived value and purchase intention in social E-commerce sales promotion: Considering the impact of product involvement. Inf. Manag. 2019, 56, 317–328. [Google Scholar] [CrossRef]
  88. Shapiro, S.L.; Reams, L.; So, K.K.F. Is it worth the price? The role of perceived financial risk, identification, and perceived value in purchasing pay-per-view broadcasts of combat sports. Sport Manag. Rev. 2019, 22, 235–246. [Google Scholar] [CrossRef]
  89. Prentice, C.; Han, X.Y.; Hua, L.L.; Hu, L. The influence of identity-driven customer engagement on purchase intention. J. Retail. Consum. Serv. 2019, 47, 339–347. [Google Scholar] [CrossRef]
  90. Feng, J.; Wang, K.Y.; Peracchio, L.A. How third-party organization (TPO) endorsement advertising works: Do consumers perceive tpo endorsement as signals of quality? Adv. Consum. Res. 2008, 35, 616–623. [Google Scholar]
  91. Woodruff, R.B. Brand Information Sources, Opinion Change, and Uncertainty. J. Market. Res. 1972, 9, 414–418. [Google Scholar] [CrossRef]
  92. Birnbaum, M.H.; Stegner, S.E. Source credibility in social judgment: Bias, expertise, and the judge’s point of view. J. Person. Soc. Psychol. 1979, 37, 48–74. [Google Scholar] [CrossRef]
  93. Sternthal, B.; Dholakia, R.; Leavitt, C. The persuasive effect of source credibility: Tests of cognitive response. J. Consum. Res. 1978, 4, 252–260. [Google Scholar] [CrossRef]
  94. Stokburger-Sauer, N.E.; Hoyer, W.D. Consumer advisors revisited: What drives those with market mavenism and opinion leadership tendencies and why? J. Consum. Behav. 2009, 8, 100–115. [Google Scholar] [CrossRef]
  95. EWG’s Skin Deep Cosmetic Guide. Available online: https://www.ewg.org/skindeep/ (accessed on 22 January 2019).
  96. Products Containing PROTEIN (View Older Products). Available online: https://www.ewg.org/skindeep/browse.php?containing=705337&showproducts=1&notold=1 (accessed on 25 August 2019).
  97. Sea Kind Glow Body Wash Ocean Breeze. Available online: https://www.ewg.org/skindeep/product/710315/Sea_Kind_Glow_Body_Wash_Ocean_Breeze/ (accessed on 25 August 2019).
  98. Korean Statistical Informantion Service. Available online: http://kosis.kr/eng/statisticsList/statisticsListIndex.do?menuId=M_01_01&vwcd=MT_ETITLE&parmTabId=M_01_01&statId=2008001&themaId=#SelectStatsBoxDiv (accessed on 29 September 2019).
  99. Euromonitor Beauty and Personal Care in South Korea. Available online: http://www.portal.euromonitor.com/portal/analysis/tab (accessed on 10 October 2019).
  100. Nunnally, J.C.; Bernstein, I.H. Psychometric theory. Am. Educ. Res. J. 1994, 5, 1–83. [Google Scholar]
  101. Zhang, X.; Ding, X.; Ma, L.; Wang, G. Identifying factors preventing sustainable brand loyalty among consumers: A mixed methods approach. Sustainability 2018, 10, 4685. [Google Scholar] [CrossRef]
  102. Chin, J.; Lin, S.C. A behavioral model of managerial perspectives regarding technology acceptance in building energy management systems. Sustainability 2016, 8, 641. [Google Scholar] [CrossRef]
  103. Mavlanova, T.; Benbunan-Fich, R.; Lang, G. The role of external and internal signals in E-commerce. Decis. Support Syst. 2016, 87, 59–68. [Google Scholar] [CrossRef]
  104. Lee, S.J.; Ahn, C.; Song, K.M.; Ahn, H. Trust and distrust in e-commerce. Sustainability 2018, 10, 1015. [Google Scholar] [CrossRef]
  105. Nyadzayo, M.W.; Matanda, M.J.; Rajaguru, R. The determinants of franchise brand loyalty in B2B markets: An emerging market perspective. J. Bus. Res. 2018, 86, 435–445. [Google Scholar] [CrossRef]
  106. Spiteri, J.M.; Dion, P.A. Customer value, overall satisfaction, end-user loyalty, and market performance in detail intensive industries. Ind. Market. Manag. 2004, 33, 675–687. [Google Scholar] [CrossRef]
  107. Xiao, L.; Guo, F.; Yu, F.; Liu, S. The effects of online shopping context cues on consumers’ purchase intention for cross-border E-Commerce sustainability. Sustainability 2019, 11, 2777. [Google Scholar] [CrossRef]
  108. Yu, S.; Lee, J. The effects of consumers’ perceived values on intention to purchase upcycled products. Sustainability 2019, 11, 1034. [Google Scholar] [CrossRef]
  109. Byrne, B.M. Structural Equation Modeling with Amos: Basic Concepts, Applications, and Programming; Routledge: Abington, UK, 2016. [Google Scholar]
  110. Kardos, M.; Gabor, M.R.; Cristache, N. Green marketing’s roles in sustainability and ecopreneurship. Case study: Green packaging’s impact on Romanian young consumers’ environmental responsibility. Sustainability 2019, 11, 873. [Google Scholar] [CrossRef]
  111. Vinodkumar, M.N.; Bhasi, M. Safety climate factors and its relationship with accidents and personal attributes in the chemical industry. Saf. Sci. 2009, 47, 659–667. [Google Scholar] [CrossRef]
  112. Shook, C.L.; Ketchen, D.J.; Hult, G.T.M.; Kacmar, K.M. An assessment of the use of structural equation modeling in strategic management research. Strateg. Manag. J. 2004, 25, 397–404. [Google Scholar] [CrossRef]
  113. Turaga, R.M.R.; Howarth, R.B.; Borsuk, M.E. Pro-environmental behavior: Rational choice meets moral motivation. Ann. N. Y. Acad. Sci. 2010, 1185, 211–224. [Google Scholar] [CrossRef]
  114. Fornell, C.; Larcker, D.F. Structural equation models with unobservable variables and measurement error: Algebra and statistics. J. Market. Res. 1981, 18, 382–388. [Google Scholar] [CrossRef]
  115. Loo, R. A psychometric evaluation of the general decision-making style inventory. Person. Individ. Differ. 2000, 29, 895–905. [Google Scholar] [CrossRef]
  116. Wheaton, B.; Muthén, B.; Alwin, D.F.; Summers, G.F. Assessing reliability and stability in panel models. Soc. Methodol. 1977, 8, 84–136. [Google Scholar] [CrossRef]
  117. Byrne, B.M. Structural Equation Modeling with EQS and EQS/Windows: Basic Concepts, Applications, and Programming; Sage Publications: Thousand Oaks, CA, USA, 1994. [Google Scholar]
  118. Hu, L.; Bentler, P.M. Cutoff criteria for fit indexes in covariance structure analysis: Conventional criteria versus new alternatives Li-tze. Struct. Equat. Model. Multidiscip. J. 1999, 6, 1–55. [Google Scholar] [CrossRef]
  119. Browne, M.W.; Cudeck, R. Alternative ways of assessing model fit. In Testing Structural Equation Models; Bollen, K.M., Long, J.S., Eds.; Sage Publications: Newsbury Park, CA, USA, 1993; pp. 136–162. [Google Scholar]
  120. Hu, L.; Bentler, P.M. Fit indices in covariance structure modeling: sensitivity to underparameterized model misspecification. Psychol. Meth. 1998, 3, 424–453. [Google Scholar] [CrossRef]
  121. Mavlanova, T.; Benbunan-Fich, R.; Koufaris, M. Signaling theory and information asymmetry in online commerce. Inf. Manag. 2012, 49, 240–247. [Google Scholar] [CrossRef]
  122. Agarwal, N.; Chakrabarti, R.; Brem, A.; Bocken, N. Market driving at bottom of the pyramid (BoP): An analysis of social enterprises from the healthcare sector. J. Bus. Res. 2018, 86, 234–244. [Google Scholar] [CrossRef]
Figure 1. Revenue for Beauty & PC South Korea (in million USD). Source: Statista August 2019 [5].
Sustainability 11 06257 g001
Figure 2. Average revenue per capita, Beauty & PC South Korea (in million USD). Source: Statista August 2019 [5].
Sustainability 11 06257 g002
Figure 3. The hypothesized model. Note: ISS-involvement in skin safety; TDSI-Trust in domain specific information; BL-brand loyalty; PFV-perceived safety value; PSV-perceived social value; PI-purchase intention.
Sustainability 11 06257 g003
Figure 4. The simple mobile commerce app developed for the study that represent its safety rating criteria (left) and an example table listing safety ratings for all the ingredients (right).
Sustainability 11 06257 g004
Figure 5. Safety rating criteria and the rationale of EWG’s Skin Deep® Cosmetics Database (left), pages of Health living app created by EWG aligned with the sub-web pages of EWG’s Skin Deep® Cosmetics Database [96,97]; a screenshot showing a list of raw materials and finished products that contain the search term (middle) and another screenshot of all ingredients of the specific commercial cosmetic formulation clicked on (right).
Sustainability 11 06257 g005
Figure 6. Mobile app window from Hwahae (left) and Glowpick (right) showing all ingredients, safety ratings and the criteria.
Sustainability 11 06257 g006
Figure 7. Results of the structural model (***: p < 0.001; **: p < 0.01; *: p < 0.05). Note: R indicates R-squared value. ISS—involvement in skin safety; TDSI—trust in domain specific information; BL—brand loyalty; PFV—perceived safety value; PSV—perceived social value; PI—purchase intention.
Sustainability 11 06257 g007
Table 1. Descriptive statistics of respondent characteristics (N = 240, 1000 KRW is approximately equal to 0.75 Euro and 0.83 USD).
Demographics and App ChosenCharacteristics Count%
GenderFemale17874.2
Male6225.8
Age18–3021388.7
31–552711.3
OccupationStudent17572.9
Office worker3715.4
Others2811.7
Education levelhigh school graduation or less125.0
In college15966.3
College5723.8
Graduate104.2
Doctor20.8
Monthly cosmetic purchase amount<10,000 KRW4016.7
10,000–20,000 KRW7125.6
20,000–50,000 KRW7125.6
50,000–100,000 KRW4719.6
>100,000 KRW114.6
Mobile app 1 experiencedHwahae19380.4
Glowpick4719.6
1 Before using the mobile-shopping app designed for experiments, participants were requested to take a look at one of two representative apps (Hwahae and Glowpick) in Korea, which provides safety grade information on cosmetic ingredients.
Table 2. Construct statistics.
ConstructMeasurementReference 1
ISS- I definitely consider skin safety when using cosmetics.[42]
- I have some concern about skin safety when I buy cosmetics.
- I confirm that there is no harm to skin before I buy cosmetics.
TDSI- The information on the safety of cosmetic ingredients from an organization specialized in the cosmetics industry reassures me.[103,104]
-I trust the safety grading method for the cosmetic ingredients from an organization specialized in the cosmetics industry.
- I trust that the safety grading method for cosmetic ingredients by an organization specialized in the cosmetics industry is fair and reasonable.
- I believe the safety grading method for cosmetic ingredients by an organization specialized in the cosmetics industry has good scientific evidence.
BL- I buy only branded cosmetic products.
- I am a loyal customer for the cosmetic product I buy.[51,105,106]
- I will stick to the same cosmetic product despite price increase.
PFV- Green-grade cosmetics are safe on my skin.[107,108]
- Green-grade cosmetics are reliable in terms of human safety.
- Green-grade cosmetics fulfill my needs on skin safety well.
- Green-grade cosmetics cause little skin irritation
PSV- Using Green-grade cosmetics would make a good impression on other people.[107,108]
- Using Green-grade cosmetics would improve the way I am perceived.
- Green-grade cosmetics would give its owner social approval.
- Green-grade cosmetics would help me feel socially accepted.
- Green-grade cosmetics would give its owner self-esteem.
PI- Regardless of the brand, I can purchase green-grade cosmetics.
- Regardless of the brand, I will purchase green-grade cosmetics.
[107,108]
Regardless of the brand, I am willing to recommend green-grade cosmetics to others.
- Regardless of the brand, I will seriously consider purchasing green-grade cosmetics.
1 The measurement items were slightly modified from the original questionnaire we referenced to suit our study.
Table 3. Construct statistics.
FactorItemFactor LoadingsCronbach’s α Composite Reliability (CR)Average Variance Extracted (AVE)
ISSISS10.8670.9030.7950.564
ISS20.849
ISS30.837
TDSITDSI10.7290.9240.8790.646
TDSI20.793
TDSI30.791
TDSI40.757
BLBL10.9490.9290.8350.632
BL20.948
BL30.838
PFVPFV10.7560.8800.8270.547
PFV20.759
PFV30.768
PFV40.793
PSVPSV10.7680.9370.8420.516
PSV20.753
PSV30.852
PSV40.829
PSV50.842
PIPI10.9130.9570.8940.713
PI20.918
PI30.796
PI40.864
Note: ISS—involvement in skin safety; TDSI—trust in domain specific information; BL—brand loyalty; PFV—perceived safety value; PSV—perceived social value; PI—purchase intention.
Table 4. Squared correlations between constructs.
Latent VariablesAVE vs. Square of the Correlation Coefficients
123456
1ISS0.564 *
2TDSI0.2820.651 *
3BL0.0870.0650.636 *
4PFV0.2190.5000.0590.551 *
5PSV0.1460.4080.0990.3610.520 *
6PI0.1540.2810.0040.1930.2330.713 *
Note: The numbers in the diagonal row (in bold) AVE, indicating discriminant validity were proven, given every AVE was greater than all the corresponding squared correlation coefficients.
Table 5. Goodness of fit indices for the research model.
MeasureProposed Research ModelRecommended Cut-Off for Good Fit
χ 2 / d f 2.141<3 [115,116]
CFI0.961>0.93 [117,118]
TLI0.954>0.90 [118]
IFI0.961>0.90 [118]
RMSEA0.069<0.08 [119,120]
χ 2 —chi-square, d f —degrees of freedom, χ 2 / d f —relative chi-square, CFI—comparative fit index, TLI—Tucker-Lewis index, IFI—incremental fit index, and RMSEA—root mean square error approximation.
Table 6. Results of hypothesis testing.
HPathβS.E.C.R.Result
H1ISS → TDSI0.5080.0557.716 ***Supported
H2ISS → BL0.2950.0594.355 ***Supported
H3BL → TDSI0.1060.0581.735Rejected
H4TDSI → PFV0.7040.05611.299 ***Supported
H5TDSI → PSV0.6100.0789.992 ***Supported
H6BL → PFV0.0630.0461.195Rejected
H7BL → PSV0.1590.0672.907 **Supported
H8PFV → PI0.0440.1140.490Rejected
H9PSV → PI0.2550.0723.238 **Supported
H10TDSI → PI0.2860.1302.580 *Supported
H11BL → PI−0.1250.067−2.519 *Supported
H12ISS → PI0.1650.0692.341 *Supported
Note: ISS-involvement in skin safety; TDSL-Trust in domain specific information; BL-brand loyalty; PFV-perceived safety value; PSV-perceived social value; PI-purchase intention; ***: p < 0.001; **: p < 0.01; *: p < 0.05.

