Article

Moving Towards the Circular Economy/City Model: Which Tools for Operationalizing This Model?

by
Luigi Fusco Girard
1,2,* and
Francesca Nocca
1,*
1
Department of Architecture, University of Naples Federico II, 80134 Naples, Italy
2
Institute for Research on Innovation and Services for Development (IRISS), National Research Council (CNR), 80134 Naples, Italy
*
Authors to whom correspondence should be addressed.
Sustainability 2019, 11(22), 6253; https://doi.org/10.3390/su11226253
Submission received: 24 September 2019 / Revised: 30 October 2019 / Accepted: 31 October 2019 / Published: 7 November 2019

Abstract

:
As the world continues to urbanize, identifying and implementing new urban development models and strategies is necessary to face sustainable development challenges. To this end, the circular economy model can be implemented in cities in order to operationalize and achieve human sustainable development managing simultaneously, in a systemic perspective, the social inequalities issue and the ecological and economic crisis. Today there are many cities that are defining themselves as a “circular city” but, to date, a clear definition of this does not exist. In the transition towards the circular city, tools (such as evaluation, governance, financial, business tools) play a fundamental role. The aim of this paper is (after an analysis of the concept of the circular city and its implementation, starting from literature, official documents and reports) to identify and analyze tools for implementing the circular city model. In particular, a set of indicators to assess (positive and/or negative) impacts of projects and initiatives of the circular city agenda is identified.

1. Introduction

We live in a world of growing cities. They are home to an ever-increasing percentage of the world’s population (today 55% of the world population). According to Eurostat [1], 72% of the European population currently lives in cities and metropolitan areas and it is foreseen that, by the year 2050, this percentage will reach 80%. As the world continues to urbanize, sustainable development challenges will be increasingly concentrated in cities and this is where we need to find new solutions. They increasingly require identifying and implementing new models and development strategies.
Current economic and urbanization trends place significant pressure on urban resources, systems and infrastructures, and demand new approaches in governing, financing and monitoring urban performances. Identifying and implementing new development models and strategies is necessary to face many challenges related to the overall increase in costs.

2. The Circular Economy Model

The circular economy offers a perspective to reduce the costs coming from the transformation of the agglomeration economies into agglomeration dis-economies and to operationalize sustainable development principles.
The current economy can be largely considered as linear: virgin materials are taken from nature and used to produce goods, which are then consumed and eventually disposed of. In a world characterized by finite resources (as also highlighted during the Paris Climate Conference—COP21—and Marrakech Climate Change Conference—COP22), this model cannot work in the long run, and there is evidence that it is reaching its limits.
We need to move towards a more virtuous economic model and, at the moment, we are only at the beginning of this journey.
The circular economy model, based on the principle that in nature nothing is “waste” and everything can become a “resource”, is proposed to operationalize sustainable development principles. The circular economy can be defined as “restructuring the industrial systems to support ecosystems through the adoption of methods to maximize the efficient use of resources by recycling and minimizing emissions and waste” [2]. It refers to how resource flows can be closed [3].
To date, 114 definitions of the circular economy exist in literature [4]. The United Nations have introduced as goal 12 of the 2030 Agenda [5] and in the paragraphs 71–74 of the New Urban Agenda [6], the outcome document of the Habitat III conference (October 2016), the notion of the circular economy as a general development model that produces impacts on natural and social contexts, while generating new economic wealth. This stimulates an indefinite enlargement of the lifetime of resources and their use values and promotes circuits of cooperation among different actors.
The United Nations Environment Programme (UNEP) in 2016 recognized the role of the circular economy to achieve sustainable development. The circular economy represents “a tangible set of solutions for reaching sustainable patterns of production and consumption” [7,8]. It affects the economy, jobs and the environmental system.
The European Commission has adopted a package for supporting the European Union’s (EU) transition to the circular economy, including legislative proposals aimed at stimulating the European route towards the circular economy [9]. The objective of this package is to boost economic growth, making it more sustainable and competitive in the long term. It considers a circular economy as a means of contributing to innovation, growth and job creation [9].
According to the Ellen MacArthur Foundation’s definition, the circular economy, that provides multiple value-creation mechanisms, is based on three principles: preservation and enhancement of natural capital; optimization of resources by circulating products, components, and materials; fostering system effectiveness by revealing and designing out negative externalities [10]. The Ellen MacArthur Foundation also identifies six business actions to support the aforementioned three principles: regenerate, share, optimize, loop, virtualize, exchange [10].
In the general interpretation, a circular economy is mainly referred to as waste cycle management. However this approach should be overcome and transferred from a sectorial approach (waste management) to the comprehensive city organization, its economy, its social system, its governance in order to improve urban productivity [11,12,13,14]. It can be recognized as a general development model, able to turn the linear urban metabolism into a new urban circular metabolism, in which input and output flows are “closed”.
The circular economy produces sustainable growth, good health and decent jobs and, at the same time, is able to save the environment and its natural resources. The shift from a linear economy to a circular economy (through an integrated action) represents a great contribution to the achievement of the Sustainable Development Goals (SDGs), with particular reference to SDG no. 12 about responsible consumption and production [15].
The aim of this paper is to identify and analyse approaches and tools for operationalizing the circular city model. After an analysis of the concept of the circular city and its implementation starting from literature, official documents and reports (Section 2.1), a set of indicators to assess the performance of the circular city is deduced (Section 3). Then, three case studies are described in order to show the concrete benefits of the implementation of this model (Section 4). The deduced indicators are critically analysed (Section 5) and enriched with other proposed indicators related to aspects neglected in the analysed documents (scientific papers and reports), focusing attention in particular on port areas (Section 5.1 and Section 5.1.1), cultural heritage (Section 5.2), community wellbeing and health (Section 5.3) and operational tools (Section 5.4 and Section 5.4.1).

2.1. What Is a Circular City: An Overview

The circular economy offers a great opportunity to increase urban productivity and to date there are some good practices of circularization of processes at different scales (industrial symbiosis, etc.) in which some benefits are achieved: reduction of materials and energy costs, reduction of carbon emissions, etc. [16].
The concept of the circular economy can be implemented in cities in order to achieve human sustainable development. Today there are many cities that are defining themselves as a “circular city”.
But what is a circular city? To date, a clear definition does not exist and there are many discussions around this definition. There are different definitions and circular cities are implementing this model in different ways [17].
The circular city model recognizes the importance of organizing the city’s systems in an analogy to the organization of natural systems (where “nothing is waste”). It incorporates the principles of the circular economy, establishing an urban system that is regenerative and accessible [10,18], but it is not a simple sum of urban circular economy projects [19,20]. The closure of loops is a fundamental concept at the basis of such city: linear processes are turned into circular ones. The idea of eliminating (or at least minimizing) waste and the rational and efficient use of energy are highlighted in many definitions [21,22,23,24,25,26,27,28,29,30]. The circular city model can be able to reduce CO2 emissions by 55% by 2020, to make themselves natural gas-free by 2040, to use renewable energies, to recycle all waste, and to maintain existing built heritage by taking all materials from the demolition of old buildings [31].
The circular city is a metaphor for a new way of looking at the city and of organizing it. The idea is that in the circular city linear processes can be (partly) replaced by circular processes and that long-term connections can be established between flows [25]. These flows (i.e., people, food, waste) are at the basis of the city’s metabolism that represents the engine for the functioning of the city and its economy [25,32]. A circular approach makes cities independent, rich, and resilient [10,24,33,34].
Sukhdev et al. (2018) [22] underline the role of digital technology to enable the circular city. It is also highlighted in some circular city reports, such as those of the cities of Glasgow, Rotterdam, Amsterdam [33,34,35,36]. The adjective “smart” recurs several times in circular city reports (in particular in those of Amsterdam and Rotterdam) in relation to the implementation of the circular city model. This adjective is intended exclusively with reference to the use of technologies (sensors, digital platforms, etc.) [33,34,36,37,38], and not to the wise use of resources.
It is also recognized that the successful transition towards the circular city model requires behavioural changes [34,39]. There is a need of a change in community lifestyle in order to successfully implement the circular city model. This aspect, although considered in many circular cities, is not highlighted much in their reports, while more and more space is left to the technical aspects of the circularization.
Flexibility (for example in the built-environment sector), cooperative behaviour, integration, recycling are key concepts of the circular city. The greenery and the urban gardens are also recognized as elements for enhancing the environment of the circular city [20,27,40,41]. Furthermore, innovative business models are necessary to implement this new urban model [18,28,37,38].
The Ellen MacArthur Foundation recognizes the circular city as a city in which, in particular, the built environment is designed in a modular and flexible manner; energy systems are resilient and renewable, consequently reducing costs and producing positive impacts on the environment; the urban mobility system is accessible, affordable and effective; and the production systems encourage the creation of “local value loops” [10].
The contribution of the circular city model implementation to the quality of citizens’ lives [10,18] is considered little in literature, but is underlined several times in the reports of circular cities, in particular in terms of production of new jobs and new businesses [24,33,34,36,37,38]. Employment is a key word related also to the wellbeing concept: it contributes to make people “feel good”, not only because of economic aspects, but because it lets people be in a relationship with each other [42,43].
Most of the definitions of the circular cities focus their attention on material and energy flows. The strategic actions are mainly related to the production of goods and services (product design, eco-design and use of eco-compatible materials, eco-compatible production processes, etc.), to the prolongation of the use value of resources (through reuse, repair, etc.) and waste management. They are referred to as tangible resources, neglecting the intangible ones. In particular, they are referred to as:
-
a built environment designed in a modular and flexible way;
-
renewable-energy systems and efficient use of energy;
-
an accessible, economical, clean and effective urban mobility system;
-
recycling and transformation of waste into a resource;
-
production systems that encourage local loops closure and waste minimization.
As Williams states (2019) [35], looping actions in circular cities are related to different themes (and related to different challenges), that are socio-cultural, economic and financial, information, regulatory, political, institutional, technical and design, and environmental. She recognizes that circular-city implementation is an issue related not only to technical questions, but it is related also to a systemic change in society and in restructuring our economy and governance systems.
As has emerged from some circular cities (as Paris and Antwerp), urban planning plays a fundamental role: it contributes to stimulating circular processes at different scales through a systemic approach and evoking the approaches of industrial ecology [3], that is, paying attention to the analysis of flows and synergies that are feasible thanks to spatial proximity [44]. Urban planning can, therefore, significantly contribute to trigger flows of energy, materials, services, people to catalyse economic (and not only) development [34]. The engagement of citizens in urban planning is fundamental [39].
The circular city is a model that allows the two fundamental nodes of the metropolitan cities to be tackled together in a systemic perspective: social inequalities and the ecological crisis.
The circular city is able to “hold together”, at the same time, the objective of ecological/environmental sustainability with the goal of social justice, that is, the reduction of social inequalities. In other words, it aims at systemic/holistic management of the dichotomy between environmental issues and social issues, to guarantee the social wellbeing and quality of life of all its inhabitants.
The above means taking care of both natural ecosystems (i.e., the health of natural ecosystems) and the health and well-being of the inhabitants, in light of their multiple interdependencies. It means rejecting the trade-off between environmental health and people’s well-being (and, therefore, the well-being of future generations).

3. The Need for Tools for Implementing the Circular City
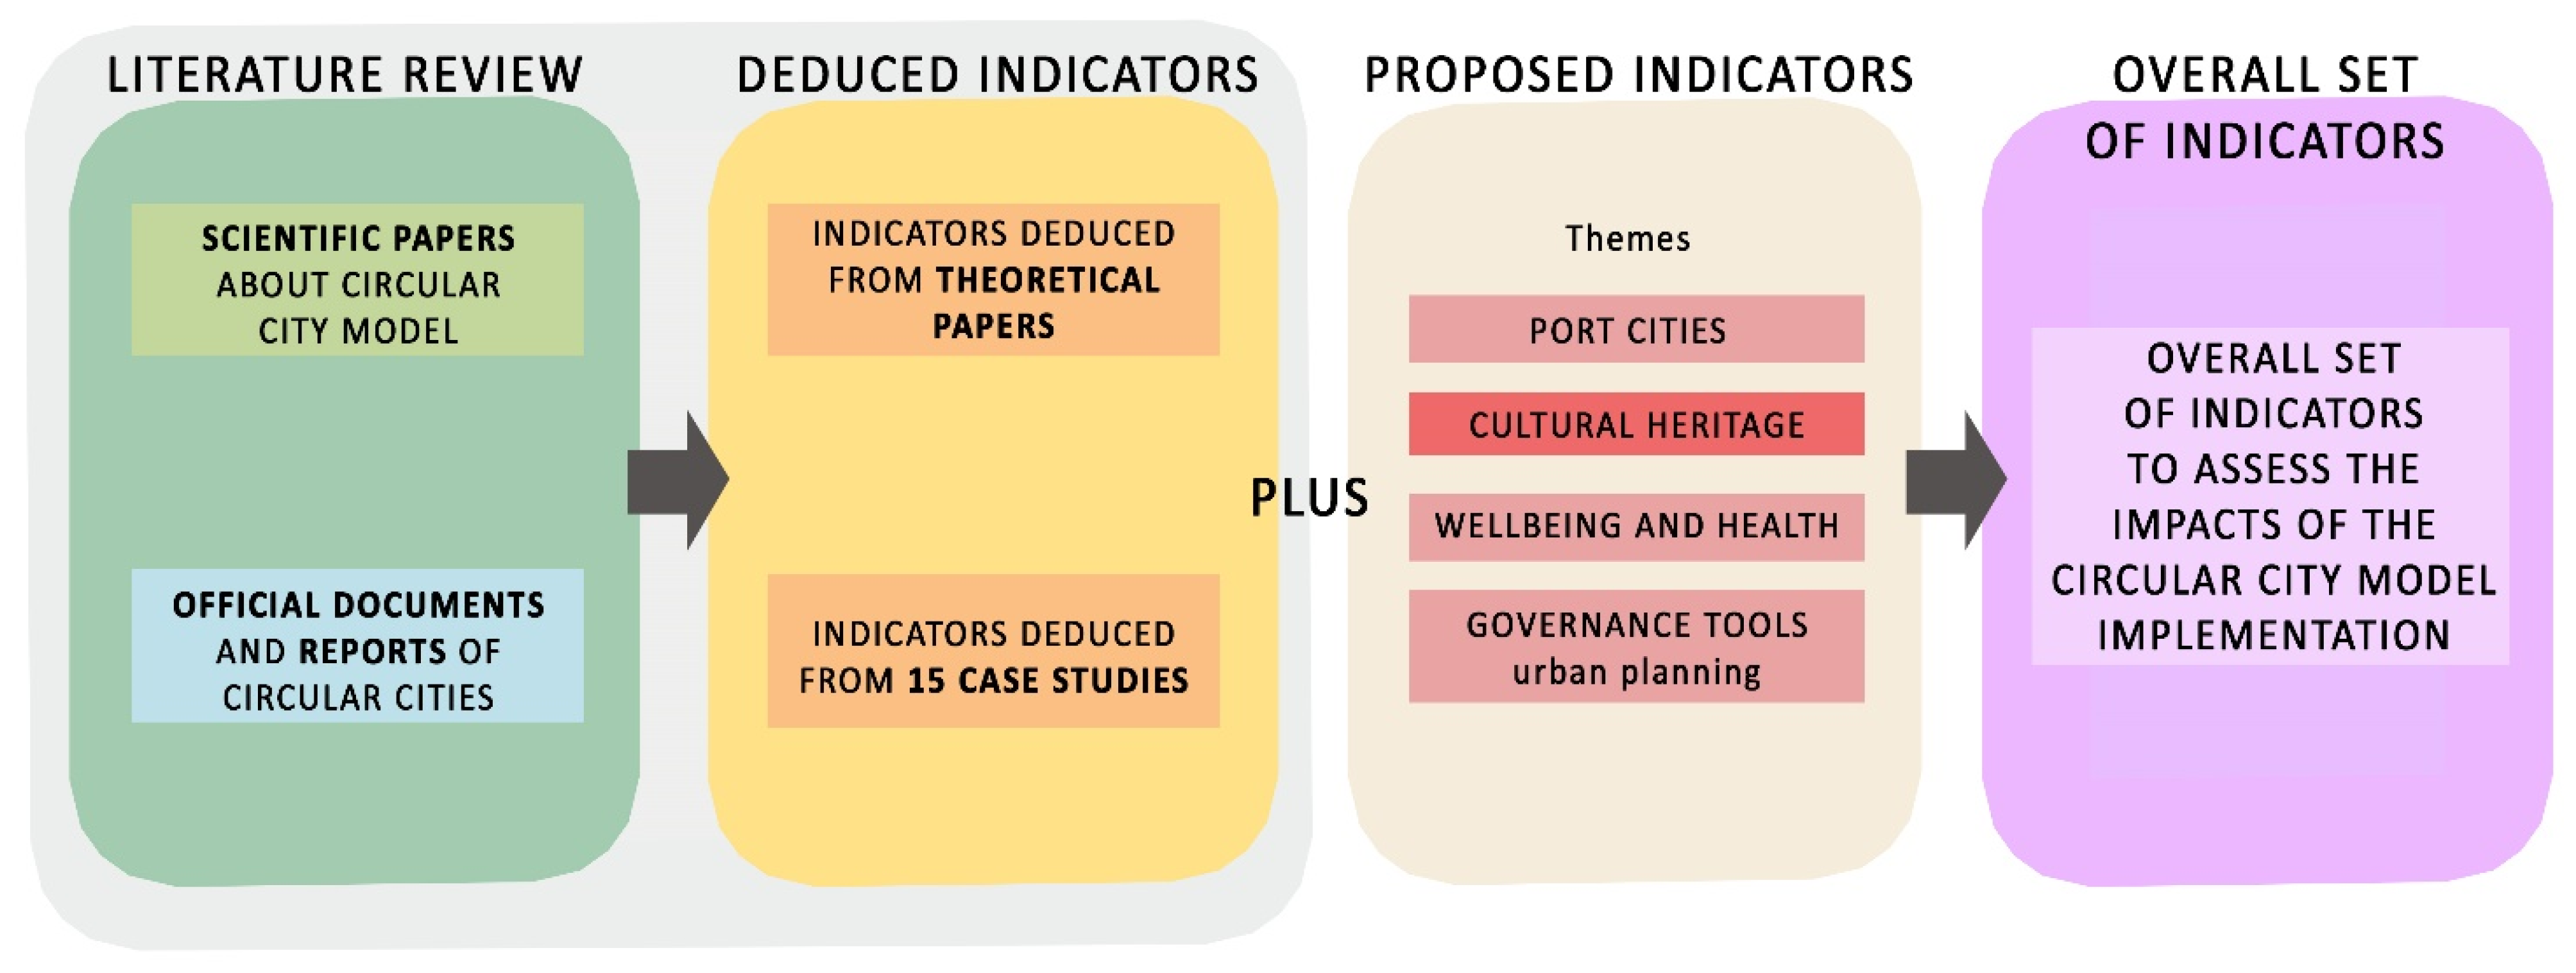
In the transition towards the circular city, tools (such as evaluation, governance, financial, business tools) play a fundamental role.
Attention is here concentrated on the evaluation tools for assessing and monitoring the efficiency/effectiveness of the circular cities, that is to assess (positive and/or negative) impacts of projects and initiatives of the circular city agenda.

3.1. Methodology

The research work of this paper has been based on a literature review, considering both scientific papers explicitly dealing with the topic of the circular city and the official documents and reports of cities that are concretely implementing this model (Figure 1). Starting from this analysis, indicators for circular cities are deduced.
The indicators have been divided in two sets of indicators. The first one has been deduced from theoretical papers; so, they are indicators that could be useful to assess the circular city, but it is not said that they are easily usable. Often, these indicators are not applicable due to the lack of data [45].
The second set is referred to as the indicators deduced from case studies; so, these have already been (almost always) effectively used. The case study research is appropriate to investigate the circular city model because it is in its initial phase and rather complex [20].
The indicators deduced from cities include indicators related to cities that are defining themselves explicitly as “circular city” and that have produced systematized reports on their strategies and indicators related to cities that are moving towards this direction but that have not produced documents related to a general local strategy/agenda—but that are implementing individual projects and initiatives related to the circularization of processes (and thus they are for the purpose of this study). These cities are shown with an asterisk in Table 1. Both of the sets of indicators are, in turn, divided in three categories: indicators related to the environmental dimension, indicators related to economic and financial dimensions, and indicators related to the social and cultural dimensions.
Fourteen cities (Table 1) have been selected according to the following criteria. First of all, we have chosen cities that are implementing a circular city programme/strategy/agenda; so, not singular projects, but a circular global strategy at city level. Among them, we have selected first of all metropolitan cities and port cities (considering that the circular economy has born in the port areas). Another selection criterion has been related to data availability: we have chosen cities that provide data to assess the impacts of the circular model implementation in their reports.
The greater complexity and difficulty in this work have been the gathering of data and indicators (able to capture the relevant aspects of the circular city) because many documents are lacking in transparency and clarity of data. Indicators have emerged many times, but only at theoretical level. Furthermore, although some of them are available, the data to feed them is not [45]. Data are not always systematized in reports of circular cities and they are often not explicitly written. Cities also use different indicators and unit of measure and, therefore, the impacts are difficult to compare.
As emerged from the analysis of the documents, some experiences of circular cities are systematized and so their “reading” is more immediate and clear, while others are not systematized, but the indicators are still reasonably deducible.
The indicators have been grouped into two tables in which, for each, the unit of measure, the reference scale and the bibliographic reference have been indicated. Where the unit of measure is not clear or does not emerge, the indicator is reported with a double asterisk. The three scales considered are those identified (and explained) in the following paragraph: micro, meso and macro scales.

3.2. Indicators Deduced from the Analysis of Circular Cities and Literature

Indicators to assess the efficiency of the circular economy model are necessary to support the transition towards the circular city model. Currently, there is not a set of indicators for assessing how a city is effective in moving towards circularity, nor are there tools for supporting it. However, it is necessary to demonstrate the multidimensional benefits of the circular economy in order to convince policy-makers, community and companies that investing in a circular economy is convenient. To this end, as explained in Section 3.1, a list of indicators has been deduced from papers, document and reports (Table 2 and Table 3). They are the indicators through which cities are assessing and monitoring their transition to/implementation of the circular city model. Although it is a rich list of indicators, they present some weaknesses and limitations, analyzed below and in the following paragraphs.
Indicators referred to recycling (one of the aspects of the circular city) are today the most available, while indicators for measuring circularity strategies almost do not exist. As emerged from Table 2 and Table 3, to date the indicators identified to assess circular economy models are mainly focused on technical flows and materials cycles because “their circularity” and benefits for associated businesses are easier to understand. They are mainly specific for industries and production chain (as emerged from case studies as London, Glasgow, Amsterdam, Marseille). The indicators used by each city are mainly related to the production chains triggering more flows in the city (food, construction, etc.).
The unit of measure or how to estimate the data are not clear for some indicators emerging from the case studies. These indicators are mentioned, but not assessed, in the reports.
The deduced matrix of indicators is very rich, but some emerged indicators risk not being significant if they are not contextualized in the specific city and in relation to the circular city model. On the other hand, some indicators are instead very specific and should be generalized to be included in the general matrix of indicators reflecting the characteristics of the circular city. They should be contextualized, from time to time, according to the specificities of the context.
Furthermore, some significant aspects of the implementation of the circular city model are neglected and, therefore, require deepening and integration (Section 5). It is necessary to decide what is relevant and what can be measured in circular cities [45,51].
In the deduced matrix of indicators there are two groups of indicators: indicators related to the intensity of the circular processes (representing the minority) and indicators related to the impacts of these processes on the city. They should be distinguished. So, first of all, it needs to be specified that the indicators should be referred both to the “circularity level” (i.e., ratio between the total of saved material and the total consumed material) and to the impacts of the “circularity” produces (environmental and socio-economic effects, i.e., cost reduction, employment, etc.). There are two different groups of indicators.
In addition, another necessary classification should refer to the difference between indicators related to the transition process and those related to the achievement of circularity strategy, considering the (long) time that the transition process can take (as the European Network of the Heads of Environment Protection Agencies EPA Network - underlines) [7,52]. So, the indicators related to the circular economy model can be classified distinguishing the transition process steps and the achievement of the circular model.
Furthermore, three categories can be recognized on the base of the reference level:
-
Micro-level (Mi)—company level, building level, citizens level;
-
Meso-level (Me)—companies’ network level, eco-industrial park, neighbourhood level, city level;
-
Macro-level (Ma)—regional level, national level, international level.
All stakeholders need to be considered in the evaluation process. Stakeholders’ categories that can be considered in the circular economy model are, for example, individual company, private institutions, community, public institutions, etc. Each stakeholder plays a role and has responsibilities in the circular economy/city implementation. It needs to identify solutions at positive sum-game, able to produce multidimensional benefits for all stakeholders.
This consideration implies the necessity of indicators to be understandable to different stakeholders, which is fundamental for the implementation of the model. They allow raising awareness of performance and potentiality of circularity. Comparability is another key word for the indicators. Clear definitions and common understanding are fundamental for making data comparable among different cities, in order to have a common ground for comparing results and monitoring cities in the “journey” towards this new model.
As said before, the indicators are fundamental both for evaluating circular strategy implementation and for monitoring the “journey” towards this new model. In this way, it is possible to understand if a city is going in the right direction or if additional measures are necessary.
Some important indicators (such as resource input and waste utilization), although significant, cannot be easily measurable because of the lack of urban statistical systems that should be improved.

4. Benefits from Circular Economy Implementation: Empirical Evidence

Before proposing indicators for enriching the set of indicators deduced from literature review and reports of circular cities (see Table 2 and Table 3), in the following paragraphs three case studies demonstrating the benefits produced by circular economy implementation are described, with a particular focus on the industrial symbiosis [3] as a part of the wide concept of the circular economy and its implementation [53,54,55]:
-
Kalundborg (Denmark);
-
Kawasaki (Japan);
-
Dunkirk (France).
They are three best practices related to industrial symbiosis that show empirically that connecting enterprises produces positive impacts in economic, social and environmental terms.
The industrial symbiosis is a business model, based on sharing by-products improving resource efficiency and creating value from waste, for circular economy implementation [53,54,55]. The three case studies summarized in the following paragraphs demonstrate that symbioses/synergies/cooperation produce economic, social, and environmental benefits.

4.1. Empirical Evidence from Kalundborg, Denmark

Kalundborg is a Danish city with a population of 16,523, the main town of the municipality of the same name. It is situated on the northwestern coast of the Zealand island, on the opposite side from Copenhagen.
The Kalundborg industrial cluster in Denmark is one of the most famous examples of industrial symbiosis and it is often used as a reference case in literature [56,57,58]. Kalundborg Eco-Industrial Park is an industrial symbiosis network situated in Kalundborg (Denmark) in which companies collaborate to use each other’s by-products and share resources (Table 4 and Table 5).
Symbiosis in Kalundborg is the strategy adopted by local companies to face the challenge of guaranteeing businesses survival and expansion despite a limited supply of groundwater. The creation of the pipeline bringing water from the lake to the local refinery involved several stakeholders in the area that have started of a long-term collaboration. The pipeline represents a key component of the network.

4.2. Empirical Evidence from Dunkirk, France

Dunkirk is a town located in the north of France. It is the fifth most populated town in the “Hauts-de-France” region (88,000 inhabitants in 2016).
Dunkirk is located in an area where there are numerous heavy industries (from metalworking to energy production etc.) which for decades have produced negative impacts on the environment (so it is an area with high levels of pollution). In this context, Ecopal (association of Economy and Ecology Partners in Local Action), one of the first associations dedicated to industrial ecology in France, plays an essential role [61,62,63,64] (Table 6 and Table 7). The Ecopal was created in 2001 for promoting and encouraging, through pooling services assistance, industrial ecology and industrial symbiosis in Dunkirk [62].

4.3. Empirical Evidence from Kawasaki, Japan

Kawasaki is a city located in Tokyo metropolitan area (Japan). With a population of 1.42 million (2016), it is the ninth most-populous city in Japan. Kawasaki plays a central role in the Tokyo Bay area, where there are clustered heavy industries.
Kawasaki was one of the first Japanese cities to initiate an Eco-Town Project [66,67]. Their project was approved in 1997 and the government has made an investment of 25 billion JPY. The government has funded six waste-recycling facilities to promote and encourage the exchange of by-products.
The challenge at the basis of the implementation of Industrial Symbiosis in Kawasaki was the necessity of the municipality to find a solution to dispose of municipal solid waste in a sustainable way while enhancing the local economy [57] (Table 8 and Table 9).

5. A Proposal for the Circular City Model Implementation

The indicators emerged from the analysis of case studies Table 2 and Table 3) neglect some precious and particular aspects that can play a significant role in the circular-city model implementation and characterization: the port, the landscape of the cities, community wellbeing and health, governance. They are analysed individually in the following paragraphs.

5.1. The Port in a Circular City: Proposed Indicators

An element neglected in literature and in many concrete analysed experiences, but that can play a fundamental role in the implementation of the circular city model, is the conflicted or reciprocal (circular) relation between the city and the port. The “port” is a generator of external effects.
The circularity between the city and the port in general is not realized as there is often a conflict between the development strategy (which considers economic, social, cultural and environmental goals) and the development dynamics of the port areas that are oriented to the maximization of the “teu”, and thus exclusively to economic and financial objectives. It is interesting to note that most of the circular cities are port cities and these, in turn, are also the cities characterized by a particular landscape.
A port area (as emerges, for example, from the Antwerp, Rotterdam, Marseille, Amsterdam experiences) can represent another significant element of the circular city. Port cities and port areas have a particular development potential and can assume an important role to achieve sustainable development and implement the circular city model, combining in a circular and synergistic approach port economy, logistic, industrial activities with cultural heritage/landscape regeneration (starting from local cultural resources). Port cities become cities of symbioses, that is a city “finding synergies between urban systems” [70]: symbiosis between industrial/logistic economy and touristic economy, industrial system and urban system, cultural heritage/landscape conservation and economic development, etc. [70,71].
The first implementations of the circular economy processes have taken place in port areas, as Kalundborg (Denmark), Muroran (Japan), Kawasaki (Japan), etc. These areas have played a central role in the implementation of this model [16,68,72].
There are many good experiences in the circularization of economic processes in North America (Oakland), Australia (Adelaide, Kwinana), China, and in the Europe. In Germany (i.e., Freiburg), Denmark (Kalundborg), France (Dunkerk), England, the Netherlands, and Switzerland, the circular processes have produced net benefits, such as the reduction of the costs of materials and the reduction of carbon emissions [73]. These good practices demonstrate that cooperative behavior is economically convenient: many economic benefits are related to waste and pollution reduction, new job opportunities and reduction of environmental impacts. In Japan, new experiences of urban symbiosis following the positive practices in 26 cities are planned [68,74].
Port cities offer a lot of opportunities (i.e., in Amsterdam and Rotterdam ports) to make circular economy concrete, through recycling, sharing, re-using, designing, up-cycling [71]. The port area is the place where flows are maximized; for example, it is the place where many flows of the globalized economy arrive at and depart from, the focal point that connects every country in the world. Commercial, industrial, logistic, tourist and fishing activities are concentrated in a port area, making it a driving force for economic wealth.
The port cities are those in which the greatest quantity of wealth is produced. At the same time, greater negative impacts on the environment (i.e., air pollution), and therefore on health, are produced because industrial plants are not very symbiotic. The pollution here is stronger than in other cities. This aspect is analysed in the following paragraph (Section 5.1.1). In port areas there are also “wastescapes” [75], that is, landscapes that do not attract, but reject, producing negative impacts on the following aspects: visual-perceptive, acoustic, hygienic-sanitary, olfactory and psychological.
Many cities are starting from the port to implement the circular model (Rotterdam, Amsterdam, Marseille, etc.). Each port authority of these cities has its own policy to make circular economy principles operational, on the base of the port profile. In the city of Antwerp, for example, the port (one of the largest ports in the European Union) is recognized as a key area for the implementation of the circular city model: it is recognized as the perfect place to apply the principles of the circular economy [76].
Furthermore, port areas contribute to the particular beauty of a landscape which expresses the combination of human and natural creativity and contributes to the identity of the city. Landscape is playing an increasingly central role in economic global competition. The majority of the most beautiful urban landscapes all over the world are port cities/areas: Bergen, Venice, Genoa, Istanbul, Liverpool, Malta, Naples, Oporto, Saint Petersburg, etc. The landscape represents a fundamental “ingredient” in the management of the city–port relationship and therefore in the circular city implementation. The quality of natural and cultural landscape is important for regeneration processes, but alone it is not enough. It has to be integrated with human and social landscape that is able to trigger virtuous circularization processes and synergies, contributing to the human dimension of urbanization [71].
The circular city is the city that recognizes a fundamental role to the port and the port–city relationship, putting them in a synergistic relationship and in which industrial activities, industrial and urban activities are linked through symbiotic relationships, exchanging material, waste, etc.
For all the aforementioned reasons, some indicators of the circular city are proposed below in reference to the role of the port (Table 10). These are partially deduced from the Japanese experience, that is the 26 Japanese Eco-Towns introduced by the Japan’s Eco-Town Program in 1997 for the integration of industrial symbiosis and urban symbiosis. Some of these indicators have already been deduced from the literature and from the previously analyzed case studies (see Table 2 and Table 3).

5.1.1. Environmental Impacts of Ports

Port areas are the place where economic wealth is produced but, at the same time, they are source of environmental negative impacts. Often, in these areas, there are unused and abandoned industrial plants. The activities are, therefore, relocated and ports remain unused, in decontamination, with consequent waste of soil (contrary to the principles of the circular economy). Instead, where these plants work and port activities are functioning, negative impacts are produced, especially in environmental terms. Ports can influence environmental quality both locally and at a more regional level [77,78] due to the emissions and impacts related to the port activities, shipping traffic, and intermodal transport serving the port hinterland [79,80]. The impacts affect not only the port itself, but also the sea and the territory located in the immediate proximity of the ports.
For example, in Venice (Italy) the port contributes for 31% yearly to the pollution of the entire city; on this 31%, cruise ships and passengers contribute 12% [81].
The Organization for Economic Cooperation and Development (2011) [79] states that the environmental impacts of ports are related both to problems caused by port activities itself and problems caused at sea by ships calling at the port and emissions from inter-modal transport networks serving the port hinterland. It is estimated that more than 50,000 Europeans die prematurely every year because of pollution produced from shipping [82].
The Ports of Los Angeles and Long Beach, as an example, produce positive impacts on the employment (they employ about 1498 workers and support 1.4 million jobs throughout California) but, at the same time, they produce many negative impacts. They are called “Diesel Death Zones”. In fact, in 2009 they accounted for 10% of particulate emissions, 7% of nitrogen oxides emissions, and 42% of sulphur dioxide emissions in the South Coast Air Basin. The California Air Resources Board estimates that “there are 3700 premature deaths per year directly attributed to the ports and goods movement activities statewide and approximately 120 deaths per year associated with diesel particulate matter emissions from activities at the Port of Los Angeles and Long Beach. The economic cost associated with these deaths as well as for medical care for illnesses and missed school and work days is an estimated $30 billion annually” [83].
So, as the case of Los Angeles ports shows, environmental costs turn then into economic costs for the cities.
Air pollution not only refers to CO2 emissions, but also to NOX, SOX and PM that contribute to produce negative impacts on the environment and thus also on the health of the community. It was observed that a certain correlation exists between ship emissions and concentration measured at pedestrian level especially for SO2 [84]. In the port of Barcelona, as a further example, during 2015, a sample of 30 cruise vessel has produced 41.750 tons of CO2, 955 tons of NOX, 900 tons of SOX and 94 tons of PM [85].
These substances have disastrous effects on human health. In the Table 11 the impacts that these substances have on health are shown, as highlighted by the Auckland Regional Public Health Service [86]:
Thanks to the circular city model, these substances are reduced. In addition to this reduction, some of these substances can also become part of a wealth-production process. As highlighted for example by the VASCO2 research project by the Port Authority of Marseille, the carbon dioxide from the industries can be reused for the production of biomass [87,88,89,90].
Due to the implementation of some fuel legislation, in some European ports the PM concentration is decreasing, but this does not exclude the production of other pollutants, such as polycyclic aromatic hydrocarbons. The latter have a damaging effect on human health; indeed, the International Agency for Research on Cancer (IARC) recognizes the carcinogenic effect on humans of polycyclic aromatic hydrocarbons. The concentration of these substances in ports is considerable. Just consider, as an example, that the contribution of total concentrations of polycyclic aromatic hydrocarbons in the ports of Venice and Brindisi (Italy) are, respectively, 82% and 56% with different proportions due to different weather conditions.
As underlined in the EU-funded PERSEUS research project, there are 17 significant environmental aspects of ports divided in 7 categories: emissions to air, releases to water, emission to soil, resources consumption, water production, noise and effects on biodiversity [91] (www.perseus-net.eu).
Furthermore, in a recent study elaborated by the European Sea Ports Organisation (ESPO) and EcoPorts among 90 ports from European Union, ten key environmental priorities of the European ports’ managing bodies for 2018 have been identified [92]:
(1)
Air quality
(2)
Energy consumption
(3)
Noise
(4)
Relationships with the community
(5)
Ship waste
(6)
Port development (land)
(7)
Climate change
(8)
Water quality
(9)
Dredging operation
(10)
Garbage/port waste
Among others, air quality is the first (out of 10) environmental priority in ports from since 2013. As highlighted in the document, this may be read together with the advance of the relationship with local community in position 4 of the list as air quality has been increasingly a worry for citizens of port cities (and urban areas in general).
Every year, 400,000 premature deaths in the EU are caused by air pollution and the latter generates hundreds of billions of euros in health-related external costs. This is the reason why European Commission is enforcing the existing legislation and opening of infringement procedures against member states that exceed the limits of key air pollutants (as NO2 and PM10) [92].
The second priority issue of the European ports is the energy consumption (which is also emissions related) that has been placed in the top 3 issue for EU ports since 2013. As ESPO underlines, the reason could be linked to the direct relation between energy consumption and the carbon footprint of the ports and climate change.
Mitigation and adaptation to climate change emerged in the Top 10 for the first time in 2017 in the last position and has moved to position 7 in 2018. Many ports are recognizing their negative contribution to climate change and, therefore, are adopting measures to achieve the goals of the Paris Agreement. Noise remains the third priority. This is also related to the next priority, the relationship with the local community [92]. Furthermore, also ship waste have climbed in the top 10 list of environmental priorities compared to 2017. This is probably due to the new EU Directive on Port Reception Facilities for ship waste [92]. Moreover, it is important to underline that waste represents one of the highest priority monitoring issue by ports since 2013. This indicates the willingness of ports to contribute to addressing the issue of marine waste (that is becoming a great worry for a local community).
Public authorities are adopting various policy instruments to reduce negative environmental impacts produced by ports. Strategies and actions for reducing negative impacts of ports are related, for example, to technological innovation, more efficient and innovative organization of port activities, incentive and promotion of local products in order to reduce global maritime traffic and, therefore, of port movements [93]. In the Italian Guidelines for the elaboration of Environmental Energy Planning Documents for Port Systems, for instance, some strategies to reduce negative impacts of ports are suggested such as energy efficiency and efficient use of resources, cold ironing, diffusion of LNG (liquefied natural gas) ships, development of electricity production from renewable sources in the port area, use of storage systems, “smart” management, electric mobility, energetic efficiency of buildings and areas within the port area, energetic efficiency of organizational processes within the port area, and actions related to the opportunities offered by waste management of the port and ships [94].
The Impact Project [83] has identified some policy recommendations to increase environmental justice and improve the health of residents living near the ports. Port management must include accurate health, environmental and socio-economic impact information, establishing, as suggested for example in many reports, a community advisory committee [83]. Ports should establish actions and programs for achieving environmental sustainability, for example by inviting ships which are anchored to the quay to use the electricity of the port itself rather than to remain with their own engine running, by supporting the use of less-impacting technologies, etc. Ports must reduce their negative health and community impacts, for example, creating a buffer zone between port operations and spaces for the community, creating a Public Health Care Fund for mitigating current and future impacts, limit noise through lower lights and limit light pollution through sound barriers [83] (www.projectimpact.usc.edu).
Implementing and supporting public activities in the perspective of the circular economy, in order to support urban development, impacts on health deriving from pollutants linked to port activities and cannot be neglected. The indicators able to capture these impacts are shown in the Section 5.3.

5.2. Cultural Landscape in Circular City: Proposed Indicators

The quality of the landscape depends on the density of the circular processes because through them it is possible to avoid non-use, underutilization, waste and therefore degradation of spatial-territorial resources in which areas not used progressively turn into waste deposits.
The component of the built environment that has historical, artistic and cultural values “escapes” literature and concrete analysed experiences, although cultural heritage/landscape can play a significant role in the implementation of the circular city.
As highlighted above, in the circular approach resources are re-used, recycled, recovered, regenerated and shared. Among resources, cultural heritage/landscape should be considered.
Adopting a circular model means understanding the complex relationships among different values of the resources and the role and needs of different stakeholders. In the landscape perspective, the circular economy allows conserving the use-value (through the regeneration of resources) and “intrinsic” values of heritage.
Cultural heritage conservation/valorization and circular economy are intertwined because they both prolong the use values in an indefinite time. The reuse, rehabilitation, restoration of cultural heritage/landscape are part of the circular-economy processes. In fact, there is a close relationship between conservation of cultural heritage (through its functional reuse) and circular economy. Both of them aim to extend the life cycle of the building as much as possible. The reuse of cultural heritage takes place through circular economy processes and, vice versa, one of the sectors through which the circular economy can be implemented is represented by cultural heritage/landscape conservation.
Adaptive reuse is defined by Douglas as “any building work and intervention aimed at changing its capacity, function or performance to adjust, reuse or upgrade a building to suit new conditions or requirements” [95]. The adaptive reuse is consistent with circular economy principles. In particular, it contributes to “decouple growth from resources consumption” and allow conserving resource values as long as possible. The adaptive reuse produces impacts, and thus external effects, in a multidimensional perspective transforming this activity from a cost to an investment [12]. It produces multidimensional benefits: cultural benefits (conserving “alive” a symbol of community identity), economic benefits (in terms of increase of productivity) [96,97], environmental benefits (i.e., reduction of resource consumption) and social benefits (i.e., employment) [42].
The circular economy allows conserving the use-value of heritage, through the regeneration of resources, and intrinsic one. Adaptive reuse allows using cultural heritage in the present as in the future also saving its memory and, at the same time, adapting its functions to needs of the community, within a threshold that does not compromise its “complex value”.
It allows reducing the use of materials, of new land and building, to regenerate existing goods through new functions, to keep them “alive” [98].
The functional reuse not only refers to fixed capital, but also to knowledge, in terms of values, language, significance, skills. Through functional re-use, we are able to regenerate values, keeping them in time. Heritage reuse can contribute to revitalizing the local economy with jobs, new businesses, tax revenues and local expenditure, to provide valuable wildlife habitat and recreational amenities, as well as to regenerate values [42].
There are many good practices related to the concept of circularization in cultural heritage/landscape field, as in Dublin, Liverpool, Hamburg, etc. The empirical evidence shows that circular economic processes are able to produce a reduction of costs (management and operating costs, environmental and socio-cultural costs) and the non-used cultural heritage represents a “cost”. Its creative functional re-use can reduce this “cost”, transforming it in an investment.
Empirical evidence confirms that creative/productive activities prefer historic districts/assets for their localization [99,100,101,102,103,104]. So, cultural heritage can become a hub of creative activities.
The conditions of successful adaptive reuse are based on a “tripod” (EU Horizon 2020 Clic project, [105]):
(1)
Autopoietic principle—self-organizing capacity of cultural heritage, that is the ability to renew itself;
(2)
Symbiotic principle—relationship of mutual interdependence between the asset and the external context;
(3)
Generative principle—capacity of the reused cultural heritage to generate external effects.
The inputs of adaptive reuse are both tangible (water, waste, energy, materials, soil, goods) and intangible (values, creativity, technologies). The outputs of this activity are related to economic, social, environmental, and cultural dimensions.
Adaptive reuse is able to produce external effects that partially impact on the context and partially are able, in turn (in a circular perspective), to “come back” (from the context) to cultural heritage. It is able to produce economic impacts on the context that, in turn, become input again for cultural heritage. This economic value, in fact, can be “re-used” to support the activities included in the space/place.
Adaptive reuse is able to produce social values. They are referred, in particular, to the production of jobs. Producing jobs, adaptive reuse improves wellbeing and quality of life of the community that, in turn, become inputs for productivity. This is because if people are in a state of wellbeing, they are also more productive. This concept has been understood from some entrepreneurs, as Olivetti, Bata and Ferrero. They have understood the importance of the added social value produced by their own entrepreneurial activity and have provided evidence, pursuing “that great project of social commitment known as welfare capitalism” [106].
Cultural heritage adaptive reuse is able to produce also environmental values, in particular in terms of avoided costs (reduction of energy consumption, waste reduction, etc.). It produces benefits such as land-saving use due to building reuse (rather than demolished) and the reduction in CO2 emissions thanks to restoration of a building rather than rebuilding it. Thereby, cultural heritage can help to face the climate change challenge, for example, “through the protection and revitalization of the huge embedded energy in the historic building stock” [107]. This environmental value comes back to cultural heritage also as economic value. The avoided costs linked to a more efficient building can be used, for example, to support the aforementioned creative hub.
Cultural values produced through adaptive reuse are linked to the capacity to generate and regenerate relationships. Part of these relationships impacts on the context and part of them become input for activities in cultural heritage. In cultural heritage there is a potential as a “connective infrastructure” [108], that is as an infrastructure “keeping society more cohesive” (now highly fragmented especially in big cities), creating and regenerating bonds and relationships. Regenerating cultural heritage contributes to regenerating the “connective infrastructure” [108], which in turn feeds the productivity of the activities within cultural heritage.
In brief, the circular city is the city that recognizes a key role of the cultural landscape to conserve/valorize (through circular processes) as a competitive resource. The construction of new buildings is reduced, using underused or abandoned cultural heritage (thus reducing the use of resources). So, cultural heritage is efficiently re-used producing economic, social, environmental and cultural benefits. The circular city invests in cultural heritage conservation/valorization, recognizing it as an investment for the community and not a cost.
As emerged from above, cultural heritage represents an important factor in the circularization processes of the circular city. So, indicators related to this factor should integrate the above. Here below a proposal of these indicators also in reference to the first outcomes of the EU Horizon 2020 Clic projects [105] (www.clicproject.eu) (Table 12).

5.3. Community Wellbeing and Health in Circular City: Proposed Indicators

The circular city model can contribute to the human sustainable development because the circular economy is closer to the cycles of nature and its rhythms/times [17,43]. In the concrete experiences analysed in this research, this humanistic dimension is lacking unlike those related to energy, resources, etc. In the implementation of this new development model, we must not forget to consider the human dimension, also according to the paradigm shift (humanization of our cities) underlined in particular in paragraph 26 of the New Urban Agenda [6]. If we think about how to design or trigger circular processes without considering human needs, “circular outcomes might not be the expected ones” [109].
The circular economy needs to be more inclusive putting the human being at the core of its processes. As Lemille (2017) [109] underlines in his diagram, we need rethinking the role of human beings in the cycles of the “butterfly diagram” [10], in the biological and technological nutrients ones. Circular human flow has to be integrated into the “butterfly diagram” in order to preserve and enhance human value [109]. Decisions taken considering human well-being as an integral part of the economic framework can provide healthier access to our economy as well as experiences designed to fulfil our needs [109].
But what is this humanistic dimension related to? It is focused on human wellbeing, health, living conditions. These aspects are very lacking in the emerged indicators related to the circular city model implementation.
The circular city is the human city. It is the city that attributes a fundamental role to its inhabitants, their living conditions, health, and wellbeing. It is the city that recognizes the impacts that the organization of physical space has on health. It is the city that reduces negative impacts on health by multiple actions, as that related to the reduction of pollution.
So, considering that the human right to the highest attainable standard of health is recognized by the Charter of the United Nations (Universal Declaration of Human Rights, 1948) and the World Health Organization (WHO) Constitution, it is important to understand the impacts (and the distribution of these impacts) of the circular economy on human health (particularly in relation to pollution and contamination) and wellbeing.
Promoting well-being (both of residents and tourists) does not mean (only) promoting economic wealth, but also promoting social cohesion, satisfaction of needs, and human rights. Unlike health, a concept linked to medicine and, therefore, to parameters that are always the same, the concept of well-being is multidimensional and changes over time, in space and between cultures [43]. In the common belief, well-being is associated with a good quality of life, but the latter is not the only indicator of well-being [43]. It is also associated with a happy, healthy and comfortable life. Furthermore, well-being is also linked to people’s degree of satisfaction with life, which depends on different factors such as family life, work and health.
The Equitable and Sustainable Wellbeing (BES) Report [110] proposed by the Italian National Institute of Statistics (ISTAT) can represent a reference framework for the evaluation of the wellbeing dimension in the circular city. The ISTAT identifies the economic, social and environmental factors affecting the quality of life. In particular, in the report, the ISTAT has identified 12 dimensions (and 130 indicators) of wellbeing: health; education and training; work and life balance; economic well-being; social relationships; politics and institutions; safety; subjective well-being; landscape and cultural heritage; environment; innovation, research and creativity; quality of services. It can be considered an effective tool to promote wellbeing in order to integrate the traditional economic dimension, considering equity and sustainability issues able to give a more complete point of view about society’s development.
Furthermore, the WHO recently published a report about the relationship between circular economy and health [15].
It highlights that the implementation of the circular economy model can produce health benefits, both direct (for health care systems) and indirect (thanks to the reduction of negative impacts on the environment). However, there are risks of unintended health effects related to the circular economy (for example impacts produced by processes using hazardous materials) that should not be overlooked in the implementation plans [15].
Human health is influenced by policies and actions that go beyond the health sector [15]. For example, strategies related to sustainable production and consumption (resulting in less material output or fewer material products consumed) produce impacts (positive/negative, direct/indirect) on human health of affected groups (distributional issues). The WHO identifies some indicators related to the impacts of the circular economy implementation on health [15]. Some of them are included in the following proposed indicators (Table 13).
In brief, the circular city is the city that invests in the health, wellbeing and quality of life of the inhabitants. It contributes to make the life of its inhabitants healthier and happier. The circular city contributes to the production of new jobs to achieve full and productive employment and decent work for all (in line with Goal 8 of SDGs) and making the city more inclusive.

5.4. Governance Tools in Circular Cities

As the 2030 Agenda for Sustainable Development underlines, there is a need to move from principles to actions. To this end, many tools are necessary. Among them, governance, financial, and business tools are absolutely required. They need integrated evaluation processes. To date, there is no long-term or comprehensive empirical information available at the implementation stage, but some characteristics of good governance to guide a city in the transition towards the circular model can be deduced from the analysed case studies. Good governance can contribute to reduce/eliminate the barriers to the implementation [35].
Starting from the analysed case studies in this research, it can be deduced that the governance in the circular city is:
-
collaborative governance;
-
adaptive governance;
-
experimental governance;
-
reflexive governance.
The circular city has collaborative governance that promotes culture from the bottom. In the circular city, public bodies collaborate with different actors and stakeholders (citizens, businesses, civil society, etc.) in order to join demands for action ensure good governance practices based on transparency, legitimacy, and openness principles.
This collaborative approach allows reducing barriers and constraints in circular city implementation. Furthermore, collaborative governance contributes to the distribution of responsibilities dividing risks, failures and successes, shifting from thinking as “I” to thinking as “We”.
Circular governance is reflexive governance that is a concept suggesting a change in perspective underlying policies and planning. Reflexive governance is understood as governance that shifts from the tactical use of institutional frameworks to new mechanisms for facing the new challenges (environmental, social and economic challenges) [111]. It is intended as a self-critical reflection, that is as far-sighted and, at the same time, self-critical governance that analyses and monitors its own results. Reflective governance is based on continuous feedback processes. Such governance necessarily implies institutional and social change.
The governance of the circular city is also experimental governance that allows experimentation, thus including the risk of failure. It is based on the logic of the experiment. In this perspective, the municipalities assume the role as promoter, enabler or partner. Since the governance is also reflexive, it is linked to learning from and being aware of failures and including them in governance debates.
The governance of the circular city is also adaptive governance. It promotes the satisfaction of human needs considering changes in behaviours, objectives, and social, economic and environmental contexts. Consequently, the governance of the circular city is not static and blocked in its inflexibility and technocratic character, but is based on dynamic changes, identifying from time to time the impediments to change and developing, at the same time, remedies for these barriers.
The current institutional capital (rules, norms, standards) should be reviewed and strengthened to make the model really effective. A renovation of legislative and regulations framework is necessary for supporting the transition towards circularity. Furthermore, through governance tools, it is possible to identify financial tools able to stimulate new business models. But, in any case, it requires a strong role of ex ante, ongoing, and ex post evaluation.

5.4.1. Urban Planning in Circular (Port) City

All circular processes and synergies can be implemented in the space of the city/territory through urban planning that represents the institutional tool able to change the existing city organization into a new one based on symbioses and circularization principles.
Urban planning for the circular economy should be inspired by the approaches and tools of industrial ecology which is attentive to the analysis of urban metabolism flows [3,112]. Therefore, it should: promote the conditions of spatial/geographical proximity between resource flows, to achieve synergistic and symbiotic exchanges (i.e., between agricultural production and biological nutrients, compost, bio-gas, etc.) thanks to geographical-spatial proximity, also through infrastructures that guarantee a circular mobility system for people and goods; enhance the coastal areas, transforming these areas into spaces of centrality, public spaces of high quality, attractive to people and activities; provide processes for collecting urban meteoric waters and reusing them for non-potable purposes; production of regulations to reduce urban/territorial sprawl; identification or production of particular common assets (libraries, public spaces, places, gardens, monuments, etc.) that can be managed with forms of cooperative/solidarity economy; and promote regulations aimed at stimulating reuse, recovery, repair and maintenance of existing resources, and the use of local materials for (new) buildings.
Closing of loops is an aspect of the circular city and spatial planning can provide physical space (for implementing and testing) and infrastructure for businesses and initiatives that are able to close nutrient cycles and recover nutrients at a high value.
In the planning field, circularization of processes is also linked to multi-function and flexibility, recovering of abandoned areas through their transformation in focal area for triggering circular economy (spaces of co-working, co-housing, public spaces etc.).
As the city of Amsterdam underlines, spatial planning should allow for flexible zoning [38]. To this end, circular criteria in land issues to evaluate economic, social and environmental performance should be included in public procurement and tendering processes, from the renovation of a building, redevelopment of neighborhoods, to the construction of new infrastructural projects, buildings and public spaces.
Public space is a key element of regenerative planning strategies. Public spaces (open areas, green areas, squares, streets, gardens, etc.) are examples of common goods in which many functions are concentrated: social functions, economic functions, cultural functions. Many public spaces are characterized by historic, cultural, landscape, aesthetic, symbolic values that determine the spirit itself, the soul of the city, to be conserved and valorized. Public space characterized by high quality determines a specific increase in real estate values that should be considered also in terms of value capture. Urban planning can help in making new public spaces as catalysts of relationships that can transform into bonds, and thus into new value-creation processes.
Port areas can be good entrance points for urban-planning strategies aimed at circular city model implementation. For example, as said before, urban planning can contribute to stimulate virtuous processes between the port and the city and also between the metropolitan city and the rural territory, through a systemic approach and thanks to the geographic proximity [44].
Planning should move towards the implementation of the regenerative metropolitan city model, particularly in complex and vulnerable port metropolitan cities. The regenerative model reshapes the interpretation of the sustainable city: not only conserving all forms of capital, but regenerating the different forms of capital, imitating the wisdom of natural systems, by closing the loops. This model is characterized by circular organizational processes. The regenerative model regenerates not only resources, energy, water, natural ecosystems on which the human life depends, but also the various relationships that allow the systems to work, and on which wellbeing of populations depends.
As underlined by the European Union, the flow of waste deriving from the construction and demolition processes is among the heaviest and most voluminous ones produced in the EU. This waste accounts for 25–30% of all waste produced in the EU [113].
So, in this sector many circular strategies can be implemented to contribute to reduce production of waste and other negative impacts (environmental, economic, etc.). There is a wide range of circular opportunities for the construction sector, from small scale refurbishment projects to large scale infrastructure and regeneration projects.
The urban fabric (including infrastructure, buildings and spaces) has to be flexible and adaptable to changing local conditions over time, to new needs, uses and activities, “avoiding technological lock-in and wasting resources” [114]. Furthermore, the city has to be able to adapt to physical changes required to face important challenges, such as climate change, adopting for example green and blue infrastructure that can contribute to regulating CO₂ emissions, flooding and the heat island effect. Also infrastructure and urban morphology can allow adaptation to changing conditions [114].
In a circular city, a built environment is designed in a modular and flexible manner; building materials are reused and recycled; the use of virgin material is minimized and the use of healthy materials is incentivized for improving the life quality of the residents. Flexible and shared spaces are incentivized. Buildings are used (where possible) to generate, rather than consume, power and food. They imitate the functioning of nature’s cycles, facilitating the closure of water, materials and energy cycles [10,114].
Buildings are used (if possible) to generate, rather than consume, energy and food.
The city of Amsterdam identifies 4 strategies for improving the circularity of the construction sector [38]:
-
“Smart design: commit to smart design of buildings in order to make them more suitable for repurposing and for the reuse of materials;
-
Dismantling and separation: efficient dismantling and separation of waste streams enables high value reuse;
-
High-value recycling: high-value recovery and reuse of materials and components;
-
Marketplace and resource bank: exchanging commodities between market players”.
Adaptable and modular buildings are consistent with the principles of the circular economy because they have a longer lifetime, which means that fewer materials are necessary for rebuilding, allowing to modify according to changing conditions or needs. Adaptability and modularity allow a more efficient use of land, because buildings can change their function and can be used for multiple purposes (prolonging their use value).
Different stakeholders play a role in this processes, from regional, national and international governments, businesses, non-profit organizations and interest groups, utility and public service providers, knowledge/educational institutions, and civil society [38].
The above has repercussions at the regulation level. Public bodies, for example, should provide greater flexibility for modular and adaptable design in regulations for land use.
Considering that buildings represents a great demand for energy as their heating, lighting and powering are responsible for 30% of total energy consumption (most of which still originates from fossil fuels), some strategies able to reduce the total consumption and cost of energy are necessary.
To this end, the implementation of the circular retrofitting can be considered. Circular retrofitting includes dismountable, adaptable and reusable solutions that not only maximise energy efficiency, but also minimise waste reduction. It ensures that the improvements to the energy efficiency of buildings do not cause an increase in virgin material consumption and waste production [38].
Sometimes, edifices are demolished and replaced with new buildings that are resource-intensive and a source of pollution. To avoid this negative impacts, a systematic study of renovation scenarios, compared with demolition and reconstruction scenarios (including financial, social and environmental impacts) can be developed in order to show “that is more convenience renovate rather than demolish” [38].
The reuse of unused, abandoned and resulting spaces through urban planning can play a strategic role in the implementation of this new city model. Their reuse is in line with the principles of the circular economy (reducing waste and prolonging the use value of resources) and can also represent the physical space in which to activate new flows (i.e., Amsterdam and Glasgow that start from vacant land and empty building). Therefore, the places of abandonment and marginality play a strategic role, becoming key places for urban transformation and regeneration (in coherence with the “leave no one behind” principle of Agenda 2030 [5]—understood both in reference to people and to places—and with the New Urban Agenda [6]).
The municipal administration is a key player to promote the above considerations in urban planning. So, a circular city requires an integrated vision/management of the many existing planning tools at the municipal level [34].
Another value chain playing an important role in circular city implementation and that can be supported through governance tools is the food chain. The promotion of local and sustainable food production practices (i.e., permaculture) in urban and peri-urban areas can support the development of a circular and resilient food system enhancing, at the same time, local biodiversity [31]. Strengthening the direct relations between the producers of local food and the related consumers can not only stabilise food security and price volatility, but also allows the restitution of the nutrients to local agricultural land or the use in chemical, food-producing or pharmaceutical processes, all the while minimising transportation demands [31].
Urban planning can contribute to this end, including for example (peri-) urban farming in spatial planning, and provide spaces for testing circular farming techniques.
As direct financial support, specific criteria can be considered in procurement to make plant-based and locally-produced food the standard in government buildings and schools.
As said before, the circular city model is the “territorialization” of the circular economy model. The circular economy is the economy of nature.
The Pact of Amsterdam [115], which represents the European contribution to the implementation of the UN 2030 Agenda for Sustainable Development—in particular to Goal 11 “Make cities inclusive, safe, resilient and sustainable”—and the global New Urban Agenda as part of the Habitat III process (point 8 of the Pact), considers among its priorities the “circular economy” and the “sustainable use of land and Nature-Based solutions”. According to the International Union for Conservation of Nature (IUCN) definition, nature-based solutions (NBS) are “actions to protect, sustainably manage, and restore natural or modify ecosystems, that address societal challenges effectively and adaptively, simultaneously providing human well-being and biodiversity benefits” [116].
They are also, and above all, actions which are inspired by or supported by nature. They are energy efficient and resilient to change, but they have to be able to adapt themselves to local conditions in order to be successful. Nature-based solutions can help society to face economic, social and environmental challenges in sustainable ways. They are an example of solutions that the urban plan can implement to face climate change.
Considering the many challenges that cities are facing today (climate change, depletion of resources, etc.), a holistic approach is needed to make cities more sustainable. The implementation of nature-based solutions can play an important role in this transition because they can provide ecosystem services able to produce benefits for urban biosphere (i.e., regulation of micro-climates, water treatment) [117,118].
The integration between the concept of the circular economy with the concept of nature-based solutions can increase the benefits for urban areas. Studies have also identified positive health relations between distance to urban green spaces and health benefits, highlighting that the proximity to urban green spaces [119] and viewing greenery [120,121] can produce positive health impacts. The proximity to green spaces also contributes to reducing depression, cardiovascular problems, obesity and improving mental health [122].
In many cases, the assessment of impacts could not be feasible on an urban scale since a single project produces changes that are too small; while the amount of pollutants that green areas are able to capture can be significant at the micro-scale, the influence on the quantity of pollutants caused by a single project is not perceptible at the urban level. Although the impacts of individual NBS projects can be small, if aggregated they can produce significant positive effects on the urban scale [122].
A circular economy focuses on “closing the loop” and, thus, increasing resources, efficiency of energy use and reduction of pollution emissions. However, to achieve sustainability with climate change adaptation it is necessary to enhance the sustainability potential; it is necessary a deep understanding of ecosystem processes and their dynamics, through an aware use of ecosystem properties as a management tool (especially the nature-based solutions). So, the circular city model “incorporates” the concept of nature-based solutions.
Research shows that the green areas produce significant co-benefits [122,123] in the urban environment such as, for example, increased real estate values, positive health effects, improved water management or recreational services [122]. NBS strategies can contribute cost-effectively to reduce environmental problems in urban areas. Moreover, NBS produce co-benefits that can save money at household and government level and create economic opportunities for “Green businesses” [124]. Furthermore, the introduction of NBS contributes to producing employment opportunities [125].
Urban planning can promote to increase (or avoiding the loss of) the amount of green areas encouraging the use of vegetation (for both direct and indirect carbon storage) in urban areas (i.e., street trees, green roofs and facades), planting trees in private domestic gardens, along the streets, in urban parks, the building of green walls and roofs to reduce temperature in cities and maintaining existing green infrastructure.
Urban planning is based on choices about space and territory uses to each specific impacts correspond to. Evaluation methods (ex-ante, ongoing and adaptive) represent an essential support for urban planning choices. Therefore, it is necessary to develop a matrix of indicators for each impact dimension (economic, financial, social, environmental, cultural) and, by these, to compare design alternatives in pairs.
In brief, the circular city is characterized by a flexible zoning and urban fabric, able to modify its spatial organization according to changes in society. The adaptability and flexibility of the urban environment supported by urban planning allow a more efficient use of land, because buildings and spaces can change their functions and can be used for multiple purposes (prolonging their use value). Indicators about urban planning in circular cities are included in the following table (Table 14).

6. Discussion and Conclusions

As highlighted in the previous paragraphs, tools play a fundamental role in the circular city model implementation. As circular cities are a new phenomenon, to date “evaluating” their success (or failure) is a complex process, above all because many initiatives are in an initial stage (and so, for example, there is still a lack of data). As the circular cities evolve and change over time, they have to be continuously managed and their effectiveness monitored.
This study would like to represent a step for elaborating an evaluation framework for assessing circular cities. It is an integrated evaluation framework [17] (Figure 2) including the different impact dimensions: economic, financial, environmental, social ones.
The circular city should be attentive not only to the cycle of waste and to the resources flows, but it should place the human being (and therefore his health and well-being) at the center of its policies. The circular city strategies have to be more concentrated on human-centered development. Furthermore, more attention should be paid to certain aspects, to date neglected or not thoroughly investigated, such as cultural heritage, and the port that can play a significant role in triggering circular processes in the cities. The strategies to implement the circular city necessarily need adequate planning tools able to encourage circularization.
In order to include the aforementioned neglected aspects in the evaluation tools for circular city model implementation and monitoring, further indicators have been proposed here to be included in the general matrix (annexes) deduced from analysed case studies.
Considering that the circular city is organized on three pillars (public, private and social) [17], the related evaluation framework has to integrate the evaluation models that concern these three different systems. We need an evaluation tool that integrates “traditional tools” that were born and are used in the linear economy field with tools characterized by a matrix linked to the circular-economy model.
The matrix of indicators that has emerged can be used in this framework to compare alternative urban transformation solutions. The assessment framework of the circular city should be characterized by an iterative learning-by-doing process including three steps: evaluation, monitoring and adaptation.
In this way, we can review and eventually improve our actions in order to achieve more efficient outcomes.
Monitoring allows analysing the projects after the implementation. In this way, if the outcomes are not the expected ones, it is possible to review and adapt the interventions to better face the challenges. This could result in several feedback loops over time (dynamic aspect). The discipline of evaluations helps not only to compare alternatives already given, but also to produce continuously new solutions by aiming towards a game with a positive sum in which all subjects gain benefits.
Considering the city as a living dynamic system and that “lives” in an ever-changing context (climate, social, economic changes, etc.), the assessment framework for circular city model has to be “dynamic” in order to capture impacts in changing conditions over short, medium and long term.
As indicators emerged from the analysis of literature, documents and reports are mainly related to technical aspects of the circularization, other ones have been proposed to enrich the list that has emerged in this research. They stress aspects neglected in the implementation of the circular city model, but which instead play an important role in this process: cultural heritage/landscape (with particular reference to the adaptive reuse), port area (with particular reference to its capacity of triggering circular processes and closing—material and non-material—loops), community wellbeing and health (according to the paradigm shift highlighted in the Agenda 2030 by United Nations), governance and evaluation tools (as necessary tools to make circular city principles operational, that is for the transition towards this new “circular city”).
As has emerged above, the circular economy also incorporates external effects as it takes as a reference not only the effects on the economic dimension, but also on the social and environmental ones (differently from the linear economy which considers only economic ones). These impacts can be both positive and negative (i.e., gentrification or use of toxic substances for recycling processes) and should be considered to orient choices. If they are positive, they should be amplified; if they are negative, they should be reduced as much as possible by re-orienting the choices.
Evaluation of the impacts of circular-economy projects on health represents an added value to decision-making, considering that that human health is significantly influenced by policies and actions in many fields (including those involved in the transition to a circular economy) that are beyond the health care sector and affect health through different pathways [15]. In this perspective, the Health Impact Assessment [126,127] becomes a fundamental tool to support urban planning [15,128,129]. Health conditions represent a fundamental aspect in the circular city model because it reduces costs that, in the vision of the human-centred development, are related to morbidity, malaise, etc.
Considering the indicators that have emerged from the literary review and reports of circular cities and also those proposed, the assessment of the circular city is a multi-dimensional issue and so the general evaluation framework necessarily has to consider all involved dimensions: economic, environmental, cultural and social dimensions. Moreover, not everything characterizing a circular city can be assessed in a quantitative way. Unlike most physical and monetary flows, many social and environmental aspects are partially “measurable” and require qualitative and subjective indicators. So, circular model implementation necessarily requires an integrated evaluation tool able to capture the multidimensional impacts that it is able to produce and considering all the subjects/actors involved in its implementation (Figure 2). It involves tangible and intangible, quantitative and qualitative values, short and long term, economic, social and environmental aspects, in a multi-criteria and multi-group logic.
Multi-criteria and multi-group evaluations are key hybrid tools [11] to manage and compare the positive and negative impacts [130,131,132] and to balance them for the different impacts for all stakeholders (public, private, financial, social and civil). This evaluation tool has to be able to overcome the limitations of the current economic approach [133], “capturing” also the relational aspects.
Furthermore, the current institutional capital (rules, norms, standards) often represents an obstacle for the implementation of this model. It should be reviewed and strengthened to make the model really effective. A renewal of the legislative and regulatory framework for supporting the shift towards circularity is necessary [134].
As underlined above, the circular city is to date still a concept open for debate, that is identified by different perspectives in literature and in practice. Although some cities are implementing the circular model, there is still ambiguity around this concept. Consequently, debate and research on tools (and, in particular, on evaluation tools) to implement it represents a fertile activity. Furthermore, being a process still in its initial stage, the circular cities (cities that are being defined as such) are still few in number. This certainly represents a limitation for the present study. The analysis of further cities will allow integrating the indicators that have emerged for the evaluation and monitoring of circular cities.

Author Contributions

The paper is the result of a joint work by both authors.

Funding

This research was founded by the Ministry of Education, University and Research (MIUR) under the Research Project of Relevant National Interest (PRIN) program (Project title: “Metropolitan cities: territorial economic strategies, financial constraints and circular regeneration”).

Conflicts of Interest

The authors declare no conflict of interest.

References

  1. Eurostat—Statistics Explained. Available online: https://ec.europa.eu/eurostat/statistics-explained/index.php/Urban_Europe_-_statistics_on_cities,_towns_and_suburbs_-_executive_summary (accessed on 18 February 2019).
  2. Preston, F. A Global Redesign? Shaping the Circular Economy; Chatham House: London, UK, 2012. [Google Scholar]
  3. Chertow, M.R. Industrial symbiosis: Literature and taxonomy. Annu. Rev. Energy Environ. 2000, 25, 313–337. [Google Scholar] [CrossRef]
  4. Kirchherr, J.; Reike, D.; Hekkert, M. Conceptualizing the circular economy: An analysis of 114 definitions. Resour. Conserv. Recycl. 2017, 127, 221–232. [Google Scholar] [CrossRef]
  5. United Nations. Transforming Our World: The 2030 Agenda for Sustainable Development; Unied Nations: New York, NY, USA, 2015. [Google Scholar]
  6. United Nations. Draft Outcome Document of the United Nations Conference on Housing and Sustainable Urban Development (Habitat III); United Nations: New York, NY, USA, 2016. [Google Scholar]
  7. Potting, J.; Nierhoff, N.; Montevecchi, F.; Antikainen, R.; Colgan, S.; Hauser, A.; Günther, J.; Wuttke, J.; Jørgensen, K.B.; Hanemaaijer, A. Input to the European Commission from European EPAs about Monitoring Progress of the Transition Towards a Circular Economy in the European Union; PBL Netherlands Environmental Assessment Agency: Amsterdam, The Netherlands, 2017. [Google Scholar]
  8. European Commission. Available online: https://ec.europa.eu/commission/commissioners/2014-2019/vella/blog/achieve-sustainable-development-goals-sdgs-we-must-change-our-linear-economic-model_en (accessed on 18 June 2018).
  9. European Commission. Communication from the Commission to the European Parliament, the Council, the European Economic and Social Committee and the Committee of the Regions. Closing the Loop—An EU Action Plan for the Circular Economy; European Commission: Brussels, Belgium, 2015. [Google Scholar]
  10. Ellen MacArthur Foundation. Growth Within: A Circular Economy Vision for a Competitive Europe; Ellen MacArthur Foundation: Cowes, UK, 2015. [Google Scholar]
  11. Fusco Girard, L.; De Rosa, F.; Nocca, F. Verso il piano strategico di una città storica: Viterbo. BDC Bollettino del Centro Calza Bini 2014, 14, 11–38. [Google Scholar]
  12. Angrisano, M.; Biancamano, P.F.; Bosone, M.; Carone, P.; Daldanise, G.; De Rosa, F.; Franciosa, A.; Gravagnuolo, A.; Iodice, S.; Nocca, F.; et al. Towards operationalizing UNESCO Recommendations on “Historic Urban Landscape”: A position paper. Aestimum 2016, 69, 165–210. [Google Scholar] [CrossRef]
  13. Fusco Girard, L. The Cultural Base of Cities for Shaping a Better Future. In Proceedings of the International Meeting New Urban World Future Challenges, Rabat, Maroc, 1–2 October 2012; pp. 164–171. [Google Scholar]
  14. Ravetz, J.; Fusco Girard, L.; Bornstein, L. A research and policy development agenda: fostering creative, equitable, and sustainable port cities. BDC Bollettino del Centro Calza Bini 2012, 12, 67–69. [Google Scholar]
  15. World Health Organization. Circular Economy and Health: Opportunities and Risks; World Health Organization: Genewa, Switzerland, 2018. [Google Scholar]
  16. Fujita, T.; Ohnishi, S.; Liang, D.; Fujii, M. Eco-industrial development as a circularization policy framework toward sustainable industrial cities. Lesson and suggestions from the eco town program in Japan. BDC Bollettino del Centro Calza Bini 2013, 13, 35–52. [Google Scholar] [CrossRef]
  17. Fusco Girard, L.; Nocca, F. Circular city model and its implementation: towards an integrated evaluation tool. BDC Bollettino del Centro Calza Bini 2018, 18, 11–32. [Google Scholar]
  18. World Economic Forum. White Paper. Circular Economy in Cities. Evolving the Model for a Sustainable Urban Future; World Economic Forum: Cologny, Switzerland, 2018. [Google Scholar]
  19. European Investment Bank. The EIB Circular Economy Guide Supporting the Circular Transition; European Investment Bank: Kirchberg, Luxembourg, 2018. [Google Scholar]
  20. Marin, J.; De Meulder, B. Interpreting Circularity. Circular City Representations Concealing Transition Drivers. Sustainability 2018, 10, 1310. [Google Scholar] [CrossRef]
  21. Prendeville, S.; Bocken, N. Circular Cities: Mapping Six Cities in Transition. Environ. Innov. Soc. Transitions 2017, 26, 171–194. [Google Scholar] [CrossRef]
  22. Sukhdev, A.; Vol, J.; Brandt, K.; Yeoman, R. Cities in the Circular Economy: The Role of Digital Technology; Ellen MacArthur Foundation: Cowes, UK, 2018. [Google Scholar]
  23. Koenders, D.; de Vries, S. Tien Agendapunten voor de Circulaire Stad. 2015. Available online: https://circulairestad.nl/ (accessed on 10 May 2019).
  24. Circle Economy. Circular Prague; Circle Economy: Amsterdam, The Netherlands, 2019. [Google Scholar]
  25. Agenda Stad. The Perspective of the Circular City; Agenda Stad: Amsterdam, The Netherlands, 2015. [Google Scholar]
  26. International Renewable Energy Agency (IRENA); ICLEI—Local Governments for Sustainability. Steps To Achieving 100% Renewable Energy Use Malmö, Sweden; International Renewable Energy Agency (IRENA), ICLEI—Local Governments for Sustainability: Malmö, Sweden, 2018.
  27. Argo Ambiente, Energie, Comunicazioni. Available online: https://www.argoit.com/it/sezione_id,3/newssez_id,278/che-cos-e-l-economia-circolare-la-citta-circolare-verso-un-futuro-piu-green/comunicati.html (accessed on 12 April 2019).
  28. Cities in Transition. Available online: http://www.citiesintransition.eu/ (accessed on 12 March 2019).
  29. UCL Circular Cities Research Hub. Available online: https://www.ucl.ac.uk/bartlett/planning/research/ucl-circular-cities-research-hub (accessed on 2 April 2019).
  30. Circular Cities Hub. Available online: http://circularcitieshub.com/ (accessed on 8 March 2019).
  31. Circle Economy. Building Blocks for the New Strategy Amsterdam Circular 2020–2025; Circle Economy: Amsterdam, The Netherlands, 2019. [Google Scholar]
  32. Gravagnuolo, A.; Angrisano, M.; Fusco Girard, L. Circular Economy Strategies in Eight Historic Port Cities: Criteria and Indicators Towards a Circular City Assessment Framework. Sustainability 2019, 11, 3512. [Google Scholar] [CrossRef]
  33. LWARB. London’s Circular Economy Route Map—Circular London; LWARB: London, UK, 2017. [Google Scholar]
  34. Mairie de Paris. White Paper on the Circular Economy of Greater Paris; Mairie de Paris: Paris, France, 2017. [Google Scholar]
  35. Williams, J. Circular Cities: Challenges to Implementing Looping Actions. Sustainability 2019, 11, 423. [Google Scholar] [CrossRef]
  36. Circle Economy. Circular Glasgow. A Vision and Action Plan for the City of Glasgow; Circle Economy: Amsterdam, The Netherlands, 2016. [Google Scholar]
  37. Gemeente Rotterdam. Roadmap Circular Economy Rotterdam; Gemeente Rotterdam: Rotterdam, The Netherlands, 2016. [Google Scholar]
  38. Circle Economy. Circular Amsterdam: A Vision and Action Agenda for the City and Metropolitan Area; Circle Economy: Amsterdam, The Netherlands, 2016. [Google Scholar]
  39. Urban Innovation Actions. The Urban Lab of Europe! Available online: https://www.uia-initiative.eu/en (accessed on 15 April 2019).
  40. Circular Change. Roadmap towards the Circular Economy in Slovenia; Circular Change: Ljubljana, Slovenia, 2018. [Google Scholar]
  41. Forum PA. Available online: https://www.forumpa.it/citta-territori/citta-circolari-dalle-scelte-sostenibili-nuove-opportunita-di-sviluppo/ (accessed on 3 February 2019).
  42. Nocca, F. The role of cultural heritage in sustainable development: multidimensional indicators as decision-making tool. Sustainability 2017, 9, 1882. [Google Scholar] [CrossRef]
  43. Nocca, F.; Fusco Girard, L. Towards an integrated evaluation approach for cultural urban landscape conservation/regeneration. Region 2017, 5, 33–51. [Google Scholar] [CrossRef]
  44. Fusco Girard, L.; Cerreta, M.; De Toro, P. Towards a local comprehensive productive development strategy: A methodological proposal for the Metropolitan City of Naples. Qual. Innov. Prosper. 2017, 21, 223–240. [Google Scholar] [CrossRef]
  45. Cavaleiro de Ferreira, A.; Fuso-Nerini, F. A Framework for Implementing and Tracking Circular Economy in Cities: The Case of Porto. Sustainability 2019, 11, 1813. [Google Scholar] [CrossRef]
  46. Eurocities. Full Circle. Cities and the Circular Economy; Eurocities: Brussels, Belgium, 2017. [Google Scholar]
  47. Croci, E. Circular cities: setting the agenda. In Proceedings of the International Conference Circular Cities: Promoting Sustainable Innovation in Urban Systems and Service Within the Energy-Food-Water-Climate Nexus, Milan, Italy, 12 March 2018. [Google Scholar]
  48. Enel (Ente nazionale per l’energia elettrica). Cities of Tomorrow. Circular Cities. 2018. Available online: https://www.enel.com/content/dam/enel-com/media/document/cities-of-tomorrow_it.pdf (accessed on 10 January 2019).
  49. Owen, A.; Liddell, J. Implementing a circular economy at city scale—A challenge for data and decision making, not technology. In Proceedings of the International SEEDS Conference 2016: Sustainable Ecological Engineering Design for Society, Leeds, UK, 14–15 September 2016. [Google Scholar]
  50. Gladek, E. Circular Cities: Hello Jobs, Goodbye Waste. 2018. Available online: https://envisioncharlotte.com/wp-content/uploads/2018/03/20180201_S_Charlotte_EcoNetworkSeries_EN_Eva.pdf (accessed on 28 December 2018).
  51. European Academies’ Science Advisory Council (EASAC). Indicators for a Circular Economy; European Academies’ Science Advisory Council (EASAC): Halle, Germany, 2016. [Google Scholar]
  52. Fusco Girard, L.; Nocca, F. From linear to circular tourism. Aestimum 2017, 70, 51–74. [Google Scholar] [CrossRef]
  53. European Commission. Communication from the Commission—Towards a Circular Economy: A Zero Waste Programme for Europe; COM(2014) 398 final; European Commission: Brussels, Belgium, 2014. [Google Scholar]
  54. Bocken, N.M.P.; Short, S.W.; Rana, P.; Evans, S. A literature and practice review to develop sustainable business model archetypes. J. Clean. Prod. 2014, 65, 42–56. [Google Scholar] [CrossRef]
  55. Baldassarre, B.; Schepers, M.; Bocken, N.; Cuppen, E.; Korevaar, G.; Calabretta, G. Industrial Symbiosis: Towards a design process for eco-industrial clusters by integrating Circular Economy and Industrial Ecology perspectives. J. Clean. Prod. 2019, 216, 446–460. [Google Scholar] [CrossRef]
  56. Moller, P. Kalundborg Symbiosis. A network of Public-Private Partnerships. In Proceedings of Circular Economy Conference, Tallin, Estonia, 17–18 September 2018. [Google Scholar]
  57. MAESTRI. Resource and Energy Efficiency for Process Industries. Available online: https://maestri-spire.eu/ (accessed on 3 May 2019).
  58. Kalundborg Symbiosis. Available online: http://www.symbiosis.dk/ (accessed on 20 March 2019).
  59. Ellen MacArthur Foundation. Available online: https://www.ellenmacarthurfoundation.org/ (accessed on 18 June 2019).
  60. CTCI Foundation. Available online: http://www.ctci.org.tw/8831/ (accessed on 5 September 2019).
  61. Beaurain, C.; Varlet, D. Quelques pistes de réflexion pour une approche pragmatiste de l’écologie industrielle: l’exemple de l’agglomération dunkerquoise. Développement Durable Territ. 2014, 5, 1–25. [Google Scholar] [CrossRef]
  62. Morales, M.E.; Diemer, A. Industrial Symbiosis Dynamics, a Strategy to Accomplish Complex Analysis: The Dunkirk Case Study. Sustainability 2019, 11, 1971. [Google Scholar] [CrossRef]
  63. Zaoual, A.R.; Lecocq, X. Orchestrating circularity within industrial ecosystems: Lessons from iconic cases in three different countries. Calif. Manag. Rev. 2018, 60, 133–156. [Google Scholar] [CrossRef]
  64. Projet Comethe: Ecologie Industrielle. Available online: http://www.comethe.org/ (accessed on 7 November 2018).
  65. ORÉE Association. Available online: http://www.oree.org/index.html (accessed on 12 September 2019).
  66. Ohnishi, S.; Dong, H.; Geng, Y.; Fujii, M.; Fujita, T. A Comprehensive Evaluation of Industrial & Urban Symbiosis by Combining MFA, Carbon Footprint and Emergy Methods—Case of Kawasaki, Japan. Ecol. Indic. 2017, 73, 513–524. [Google Scholar]
  67. Geng, Y.; Fujita, T.; Chen, X. Evaluation of innovative municipal solid waste management through urban symbiosis: a case study of Kawasaki. J. Clean. Prod. 2010, 18, 993–1000. [Google Scholar] [CrossRef]
  68. Van Berkel, R.; Fujita, T.; Hashimoto, S.; Geng, Y. Industrial and urban symbiosis in Japan: Analysis of the eco-town. J. Environ. Manag. 2009, 90, 1544–1556. [Google Scholar] [CrossRef]
  69. Krese, G.; Dodig, V.; Lagler, B.; Strmčnik, B.; Podbregar, G. Global trends in implementing the industrial symbiosis concept in the steel sector. In Proceedings of the International Multidisciplinary Scientific Geoconfeence, Albena, Bolgaria, 11 October 2018. [Google Scholar]
  70. SymbioCity Sustainability by Sweden. Available online: http://www.symbiocity.se/ (accessed on 10 May 2019).
  71. Fusco Girard, L. Toward a Smart Sustainable Development of Port Cities/Areas: The Role of the Historic Urban Landscape Approach. Sustainability 2013, 5, 4329–4348. [Google Scholar] [CrossRef]
  72. Dong, H.; Fujita, T.; Geng, Y.; Dong, L.; Ohnishi, S.; Sun, L.; Dou, Y.; Fujii, M. A review on eco-city evaluation methods and highlights for integration. Ecol. Indic. 2016, 60, 1184–1191. [Google Scholar] [CrossRef]
  73. Fusco Girard, L. The role of cultural urban landscape towards a new urban economics: new structural assets for increasing economic productivity through hybrid processes. Hous. Policies Urban Econ. 2014, 1, 3–27. [Google Scholar]
  74. Fujita, T. Eco Future Initiative in Japan as Challenges to Show Green Innovation from Cities—Industrial Symbiosis as Policy System for Circularization of Port Cities. In Proceedings of the Port Cities as Hotspots of Creative and Sustainable Local Development, Naples, Italy, 1–2 September 2012. [Google Scholar]
  75. Amenta, L.; Attademo, A.; Remøy, H.; Berruti, G.; Cerreta, M.; Formato, E.; Palestino, M.F.; Russo, M. Managing the Transition towards Circular Metabolism: Living Labs as a Co-Creation Approach. Urban Plan. 2019, 4, 5. [Google Scholar] [CrossRef]
  76. Sustainable Port of Antwerp. Available online: https://www.sustainableportofantwerp.com/en/ (accessed on 18 June 2019).
  77. Gupta, A.K.; Gupta, S.K.; Patil, R.S. Environmental management plan for port and harbor. Clean Technol. Environ. Policy 2005, 7, 133–141. [Google Scholar] [CrossRef]
  78. Dinwoodie, J.; Truck, S.; Knowles, H.; Benhin, J.; Sansom, M. Sustainable development of maritime operations in port. Bus. Strateg. Environ. 2012, 21, 111–126. [Google Scholar] [CrossRef]
  79. OECD. Environmental Impacts of International Shipping, The Role of Ports; OECD: Paris, France, 2011; ISBN 9789264097339. [Google Scholar]
  80. Lam, J.; Notteboom, T. The Greening of Ports: A Comparison of Port Management Tools Used by Leading Ports in Asia and Europe. Transp. Rev. 2014, 34, 169–189. [Google Scholar] [CrossRef]
  81. Medicina Democratica. Movimento di Lotta Per la Salute. Available online: https://www.medicinademocratica.org/wp/?p=5437 (accessed on 3 July 2019).
  82. Forbes Now. Available online: https://www.forbes.com/sites/jamesellsmoor/2019/04/26/cruise-ship-pollution-is-causing-serious-health-and-environmental-problems/#7acd1a4837db (accessed on 20 March 2019).
  83. Environmental Health Centers. Importing Harm: U.S. Ports’ Impacts on Health and Communities the Impact Project Policy Brief Series; Environmental Health Centers: Washington, DC, USA, 2012. [Google Scholar]
  84. Murena, F.; Mocerino, L.; Quaranta, F.; Toscano, D. Impact on air quality of cruise ship emissions in Naples, Italy. Atmos. Environ. 2018, 187, 70–83. [Google Scholar] [CrossRef]
  85. de Melo Rodríguez, G.; Alcaldea, E.M.; Murcia-González, J.C.; Saurí, S. Evaluating air emission inventories and indicators from cruise vessels at ports. World Marit. Univ. 2016, 16, 405–420. [Google Scholar] [CrossRef]
  86. Auckland Regional Public Health Service. Available online: http://www.arphs.health.nz/ (accessed on 8 August 2019).
  87. Dagnet, F. PIICTO, an innovative circular economy platform of the port. In Proceedings of the 15th World Conference Cities and Ports “Crossovers”, Rotterdam, The Netherlands, 5–7 October 2016. [Google Scholar]
  88. Nicolas, M. Using industrial ecology for energy transition of Marseilles-Fos’s port city. In Proceedings of the Conference of E-harbours Movement in Amsterdam Metropolitan Area Energy Transition in Ports and Cities, Amsterdam, The Netherlands, 22 April 2015. [Google Scholar]
  89. PortSEurope. Available online: https://www.portseurope.com/ (accessed on 16 July 2019).
  90. Marseille Fos. Le Port Euroméditerranéen. Available online: https://www.marseille-port.fr/fr/Accueil/ (accessed on 10 September 2019).
  91. Policy-oriented marine Environmental Research for the Southern European Seas (PERSEUS Project). Available online: http://www.perseus-net.eu/site/content.php (accessed on 15 July 2019).
  92. ESPO—European Sea Ports Organisation. ESPO Environmental Report 2018. EcoPortsinSights 2018; ESPO—European Sea Ports Organisation: Brussels, Belgium, 2018. [Google Scholar]
  93. Marletto, G. L’impatto ambientale dei porti: una tassonomia. In Economia dei Trasporti e Logistica Economica: Ricerca per L’innovazione e Politiche di Governance, Atti della IX Riunione Scientifica della Società Italiana Degli Economisti dei Trasporti; Forte, E., Ed.; Giordano Editore: Naples, Italy, 2008. [Google Scholar]
  94. Ministry of Environment and for the Protection of Land and Sea Linee Guida per la Redazione dei Documenti di Pianificazione Energetico Ambientale dei Sistemi Portuali; Ministry of Environment and for the Protection of Land and Sea: Rome, Italy, 2018.
  95. Douglas, J. Building Adaptation; Butterworth Heinemann: Oxford, UK, 2006. [Google Scholar]
  96. Ost, C. Mapping Heritage Economics for Spatial Analysis in Historic City Cores. In The Economics of Uniqueness. Investing in Historic City Cores and Cultural Heritage Assets for Sustainable Development; Licciard, G., Amirtahmasebi, R., Eds.; The World Bank: Washington, DC, USA, 2012; pp. 245–283. [Google Scholar]
  97. Nijkamp, P. Economic Valuation of Cultural Heritage. In The Economics of Uniqueness. Investing in Historic City Cores and Cultural Heritage Assets for Sustainable Development; Licciardi, G., Amirtahmasebi, R., Eds.; The World Bank: Washington, DC, USA, 2012; pp. 75–106. [Google Scholar]
  98. Pinto, M.R.; De Medici, S.; Senia, C.; Fabbricatti, K.; De Toro, P. Building reuse: Multi-criteria assessment for compatible design. Int. J. Des. Sci. Technol. 2017, 22, 165–193. [Google Scholar]
  99. Smit, A.J. The influence of district visual quality on location decisions of creative entrepreneurs. J. Am. Plan. Assoc. 2011, 77, 167–184. [Google Scholar] [CrossRef]
  100. Bullen, P.A.; Love, P.E.D. Adaptive reuse of heritage buildings. Struct. Surv. 2011, 29, 411–421. [Google Scholar] [CrossRef]
  101. Conejos, S.; Langston, C.; Smith, J. Improving the implementation of adaptive reuse strategies for historic buildings. In Proceedings of the Le Vie dei Mercanti S.A.V.E. HERITAGE: Safeguard of Architectural, Visual, Environmental Heritage, Naples, Italy, 21 June 2011. [Google Scholar]
  102. Della Lucia, M.; Trunfiob, M. The role of the private actor in cultural regeneration: Hybridizing cultural heritage with creativity in the city. Cities 2018, 82, 35–44. [Google Scholar] [CrossRef]
  103. Esmaeilpoorarabia, N.; Yigitcanlar, T.; Guaraldab, M. Place quality in innovation clusters: An empirical analysis of global best practices from Singapore, Helsinki, New York, and Sydney. Cities 2018, 74, 156–168. [Google Scholar] [CrossRef] [Green Version]
  104. Hani, U.; Azzadinaa, I.; Corintias Pamatang, M.S.; Setyagunga, E.H.; Ishiib, T. Preserving cultural heritage through creative industry: A lesson from Saung Angklung Udjo. Procedia Econ. Financ. 2012, 4, 193–200. [Google Scholar] [CrossRef]
  105. CLIC—Circular Models Leveraging Investments in Cultural Heritage Adaptive Reuse. Available online: https://www.clicproject.eu/ (accessed on 15 July 2019).
  106. Zamagni, S.; Venturi, P.; Rago, S. Valutare l’impatto sociale. La questione della misurazione nelle imprese sociali. Impresa Sociale 2015, 6, 77–97. [Google Scholar]
  107. European Parliament. Research for CULT Committee—Best Practices in Sustainable Management and Safeguarding of Cultural Heritage in the EU. In Policy Department for Structural and Cohesion Policies Directorate-General for Internal Policies PE 601.988; European Parliament: Brussels, Belgium, 2018. [Google Scholar]
  108. Fusco Girard, L.; Nocca, F.; Gravagnuolo, A. Matera: City of nature, city of culture, city of regeneration. Towards a landscape-based and culture-based urban circular economy. Aestimum 2019, in press. [Google Scholar]
  109. Lemille, A. Circular Human Flows. Enhancing Humans as an Integral Part of Circular Economic Flows. 2017. Available online: https://medium.com/@AlexLemille/circular-human-flows-9106c8433bc8 (accessed on 18 June 2019).
  110. Italian National Institute of Statistic (ISTAT). Il Benessere Equo e Sostenibile in Italia. BES Report 2015; Italian National Institute of Statistic (ISTAT): Rome, Italy, 2015; ISBN 9788845818769. [Google Scholar]
  111. Feindt, P.; Weiland, S. Reflexive governance: Exploring the concept and assessing its critical potential for sustainable development. Introduction to the special issue. J. Environ. Policy Plan. 2018, 20, 661–674. [Google Scholar] [CrossRef]
  112. Cerceau, J.; Mat, N.; Junqua, G.; Lin, L.; Laforest, V.; Gonzalez, C. Implementing industrial ecology in port cities: International overview of case studies and cross-case analysis. J. Clean. Prod. 2014, 74, 1–16. [Google Scholar] [CrossRef]
  113. European Commission. Available online: https://ec.europa.eu/environment/waste/construction_demolition.htm (accessed on 26 July 2019).
  114. Williams, J. Circular Cities, Strategies, Challenges and Knowledge gaps. A Summary Report of the Expert Workshop, September 2016; UCL: London, UK, 2016. [Google Scholar]
  115. European Union. Urban Agenda for the EU Pact of Amsterdam. 2016. Available online: https://ec.europa.eu/regional_policy/sources/policy/themes/urban-development/agenda/pact-of-amsterdam.pdf (accessed on 13 July 2018).
  116. Cohen-Shacham, E.; Walters, G.; Janzen, C.; Maginnis, S. Nature-Based Solutions to Address Global Societal Challenges; IUCN: Gland, Switzerland, 2016. [Google Scholar]
  117. COST (European Cooperation in Science and Technology). COST Action CA17133. Implementing Nature-Based Solutions for Creatinf a Re Resourceful Circular City (Circular City Re.Solution); COST (European Cooperation in Science and Technology): Brussels, Belgium, 2018. [Google Scholar]
  118. Kabisch, N.; Frantzeskaki, N.; Pauleit, S.; Naumann, S.; Davis, M.; Artmann, M.; Haase, D.; Knapp, S.; Korn, H.; Stadler, J.; et al. Nature-based solutions to climate change mitigation and adaptation in urban areas: perspectives on indicators, knowledge gaps, barriers, and opportunities for action. Ecol. Soc. 2016, 21, 39. [Google Scholar] [CrossRef]
  119. Maas, J.; Verheij, R.A.; Groenewegen, P.P.; de Vries, S.; Spreeuwenberg, P. Is Green Space in the Living Environment Associated with People’s Feelings of Social Safety? J. Epidemiol. Community Health 2006, 60, 587–592. [Google Scholar] [CrossRef]
  120. Dravigne, A.; Waliczek, T.M.; Lineberger, R.D.; Zajicek, J.M. The effect of live plants and window views of green spaces on perceptions of job satisfaction. Hortic. Sci. 2008, 43, 183–187. [Google Scholar] [CrossRef]
  121. Ulrich, R. View through a window may influence recovery from surgery. Science 1984, 224, 420–421. [Google Scholar] [CrossRef]
  122. Raymond, C.M.; Berry, P.; Breil, M.; Nita, M.R.; Kabisch, N.; de Bel, M.; Enzi, V.; Frantzeskaki, N.; Geneletti, D.; Cardinaletti, M.; et al. An Impact Evaluation Framework to Support Planning and Evaluation of Nature-Based Solutions Projects; Centre for Ecology and Hydrology: Wallingford, UK, 2017. [Google Scholar]
  123. Pearce, D.; Moran, D.; Biller, D. Handbook of Biodiversity Valuation: A Guide for Policy Makers; Organisation for Economic Co-operation and Development: Danvers, MA, USA, 2002. [Google Scholar]
  124. Organisation for Economic Co-operation and Development—OECD. Green Growth in Cities; Organisation for Economic Co-operation and Development: Danvers, MA, USA, 2013. [Google Scholar]
  125. Raymond, C.M.; Frantzeskaki, N.; Kabisch, N.; Berry, P.; Breil, M.; Nita, M.R.; Geneletti, D.; Calfapietra, C. A framework for assessing and implementing the co-benefits of nature-based solutions in urban areas. Environ. Sci. Policy 2017, 77, 15–24. [Google Scholar] [CrossRef]
  126. European Centre for Health Policy. Health Impact Assessment. Main Concepts and Suggested Approach. Gothenburg Consensus Paper; European Centre for Health Policy: Brussels, Belgium, 1999. [Google Scholar]
  127. World Health Organization. Available online: https://www.who.int/hia/en/ (accessed on 11 June 2019).
  128. Mueller, N.; Rojas-Rueda, D.; Basagaña, X.; Cirach, M.; Cole-Hunter, T.; Dadvand, P.; Donaire-Gonzalez, D.; Foraster, M.; Gascon, M.; Martinez, D. Urban and transport planning related exposures and mortality: A health impact assessment for cities. Environ. Heal. Perspect 2017, 125, 89–96. [Google Scholar] [CrossRef]
  129. Giles-Corti, B.; Vernez-Moudon, A.; Reis, R.; Turrell, G.; Dannenberg, A.L.; Badland, H.; Foster, S.; Lowe, M.; Sallis, J.F.; Stevenson, M. City planning and population health: A global challenge. Lancet 2016, 2912–2924. [Google Scholar] [CrossRef]
  130. Lichfield, N. Community Impact Evaluation: Principles and Practice; Taylor & Francis: London, UK, 2005. [Google Scholar]
  131. Coccossis, H.; Nijkamp, P. Sustainable Tourism Development; Avebury Press: Aldershot, Avebury, UK, 1995. [Google Scholar]
  132. Fusco Girard, L.; Nijkamp, P. Cultural Tourism and Sustainable Local Development; Ashgate: London, UK, 2009. [Google Scholar]
  133. Porter, M.E.; Kramer, M.R. Creating Shared Value. Harv. Bus. Rev. 2011, 89, 62–77. [Google Scholar]
  134. Ezzat, A.M. Sustainable Development of Seaport Cities through Circular Economy: A Comparative Study with Implications to Suez Canal Corridor Project. Eur. J. Sustain. Dev. 2016, 5, 509–522. [Google Scholar] [CrossRef]
Figure 1. Methodology.
Sustainability 11 06253 g001
Figure 2. The integrated evaluation framework for the circular city. Note: Source: authors’ elaboration [17].
Sustainability 11 06253 g002
Table 1. The analysed circular cities.
City—CountryProject Name
1London (United Kingdom)Circular London
2Glasgow (United Kingdom)Circular Glasgow
3Rotterdam (The Netherlands)Circular Rotterdam
4Amsterdam (The Netherlands)Circular Amsterdam
5Paris (France)Circular Paris
6Antwerp (Belgium)Antwerp Circular South
7Brussels (Belgium)Be Circular Be.Brussels
8Maribor (Slovenia)Roadmap towards the circular economy in Slovenia
9Luibljana (Slovenia)Roadmap towards the circular economy in Slovenia
10Praga (Czech Republic)Circular Prague
11Kawasaki (Japan)Eco-town project
15Kalundborg (Denmark)Kalundborg Industrial Park
12Marseille (France)*
13Göteborg (Sweden)*
14Malmö (Sweden)*
Note: * Cities that are moving towards the circular city model but that have not produced documents related to a general local strategy/agenda (they are implementing individual projects/initiatives related to the circularization of processes).
Table 2. Indicators of circular cities deduced from literature.
IndicatorUnit of MeasureScaleReference
Environmental Dimension
Annual amount of greenhouse gas emissions;
Annual amount of CO2 emissions;
Percentage of reduction of greenhouse gas emissions
%/year or tons/yearMi–Me–Ma[21,35,46,47]
Recycling rate of municipal waste%/yearMe[10,45,47]
Recycling rate of packaging waste%/yearMe–Ma[10,47]
Amount of landfilled waste
Percentage of material solid waste landfilled
Percentage of household waste ended in landfills
%/year or tons/yearMi–Me–Ma[10,35,45,46,47]
Percentage of material solid waste incinerated%/yearMe–Ma[35]
Percentage of material solid waste composted%/yearMe–Ma[35]
Using of recycled goods in municipal administration%/yearMe[46]
Using of recycled goods in industrial production%/yearMe–Ma[46]
Saving energy due to the use of recycled goods in industrial production%/year or kWh/yearMi–Me–Ma[46]
Saving water due to the use of recycled goods in industrial production%/year mc/yearMe–Ma[46]
Amount of recycled goods soldN./month (or year)Me–Ma[46]
Percentage of household waste reused or recycled%/yearMe–Ma[46]
Unsold products recovered every day for redistribution at the market itself or through nearby community facilitiesKg/dayMe–Ma[46]
Input (energy, materials) in production processes from renewable sources**Mi–Me–Ma[48]
Input in production processes from reused materials**Mi–Me–Ma[48]
Input in production processes from recycled materials**Mi–Me–Ma[48]
Output from production processes from renewable sources**Mi–Me–Ma[48]
Output from production processes from reused materials**Mi–Me–Ma[48]
Output from production processes from recycled materials**Mi–Me–Ma[48]
Amount of resources saved**Mi–Me–Ma[20]
Percentage of water consumption for habitat (reduction for example thanks to harvesting rainwater on the roofs)%/yearMi–Me–Ma[20,35]
Volume (amount) of resource flow**Me–Ma[49]
Amount of recycled resources **Mi–Me–Ma[49]
Amount of reused resources **Mi–Me–Ma[49]
Percentage of green roofs %/ total city surfaceMi–Me–Ma[45]
Amount of food waste treated
Food waste treated in Small and Medium-size Enterprises (SMEs)
%/total food wasteMi–Me–Ma[45]
Percentage of retrofitting interventions on buildings %/total buildingMi–Me–Ma[45]
Percentage of degraded buildings %/ total buildingMe–Ma[45]
Public transport usage% of inhabitants using public transportMe–Ma[45]
Electrical energy consumed in the transport sector % of transport sector using electrical energyMe–Ma[45]
Synergies among industriesN.Me–Ma[45]
Safe water accessibility (water issues regarding its treatment and distribution)**Me–Ma[45]
Water efficiency (water issues regarding its treatment and distribution)**Me–Ma[45]
Separated waste (recovery and treatment of waste generated in city)Kg/yearMe–Ma[45]
Percentage of non-renewable energy use%/yearMi- Me–Ma[35]
Percentage of renewable energy use%Mi–Me–Ma[50]
Percentage of local nutrient recovery%Me–Ma[50]
Buildings designed for complete disassemblyN.Me–Ma[50]
Reuse of building components at the end of life % Me–Ma[50]
Design for flexibility by using modular systems %Me–Ma[50]
Recycling rate of recyclable materials and constructions %Me–Ma[50]
Low-impact and non-toxic materials used in production processes%Me–Ma[50]
Sustainable materials sourced from certified or eco-verified sources%Me–Ma[50]
Amount of waste heat from industry used for heating the city and horticulturekWh/yearMi–Ma–Ma[25]
Amount of groundwater warmed in the earth and used to heat homes and officesMc/yearMi–Ma–Ma[25]
Number of homes getting their energy (heat and electricity) from biogas (i.e., fermenting the manure of cows)N./totalMe–Ma[25]
Amount of recovered phosphate from the sewage waterKg/dayMi–Me–Ma[25]
Percentage of reuse or recycling of recyclable demolition materials%Mi–Me–Ma[25]
Economic and Financial Dimensions
Spending on waste management€/yearMe–Ma[47]
Disposable income of households (reduction through the reduced costs of products and services)€/yearMe–Ma[47]
Revenue from recycled goods sold€/month
€/year
Mi–Me–Ma[46]
Potential value of the material after recovery/re-useMi[49]
Circular economy innovation budget (in relation to the number platforms and businesses that lead to innovation in circular economy subjects)%/yearMi–Me–Ma[45]
Annual cost saving from recover phosphate from the sewage water (precious and scarce fertilizer)€/yearMi–Me–Ma[25]
Social and Cultural Dimensions
Liveability (e.g., increase through reduction of time lost from congestion, reduction of air pollution, improved waste and wastewater treatment)**Me–Ma[47]
Employment opportunities
Job creation
N. of jobsMe–Ma[20,46,47]
Number of events and dissemination activities about circular economy N. of events/yearMe–Ma[46]
Participants in events about circular economy (including public bodies, companies, universities, research centres, professional associations, etc.)N. of participants/yearMe–Ma[46]
Active population in circular economy initiatives%Me–Ma[45]
People involved in the informal waste recycling sector%/tot. inhabitantsMe–Ma[35]
Note: ** The indicators whose unit of measure does not emerge or is not clear in the source are reported with a double asterisk.
Table 3. Indicators of circular cities deduced from official documents and reports.
IndicatorUnit of MisureScaleCity Reference
Environmental Dimension
Amount or percentage of recycled materialTons/year or %/yearMi–Me–MaCircular London
Circular Rotterdam
Maribor, Slovenia
Luibljana, Slovenia
Amount or percentage of products reusedTons/year or %/yearMi–Me–MaCircular London
Circular Rotterdam
Maribor, Slovenia
Amount or percentage of products recoveredTons/year or %/yearMi–Me–MaCircular Prague
Maribor, Slovenia
Luibljana, Slovenia
Amount of raw materials used in the manufacturing processesTons/yearMi–Me–MaCircular London
Average amount of materials retained in the cycle per citizen per yearKg/yearMi–Me–MaAntwerp Circular South
Percentage of incoming/outgoing flows %/yearMeCircular Paris
Amount of CO2 emissions
Amount of greenhouses gases emissions
Kg of CO2/yearMi–Me–MaCircular London
Circular Amsterdam
Circular Prague
Malmö, Sweden
CO2 (or CO2 equivalent) emissions saved (also through industrial and urban symbiosis)
GHG emissions saved (for example by an increase in circularity)
Tons/year or T Co2 equivalent /year or %/yearMi–Me–MaCircular London
Circular Glasgow
Marseille
Kalundborg Industrial Symbiosis
Circular Prague
Malmö, Sweden
Gothenburg, Sweden
Kawasaki, Japan
Amount of emissions of NOxTons/yearMe–MaCircular Prague
Amount of emissions of fine dust emissions
Annual average air quality particulate matter
Tons/year or PM2.5 µg/m3Me–MaCircular Prague
Circular Rotterdam
Reduction in embodied carbon (building environment chain)kilograms of CO2e per kilogram of productMi–Me–MaCircular London
CO2 intensity tons/capitaMi–Me–MaCircular Rotterdam
Embedded CO2 emissions (“Further research is needed to calculate this indicator” [37])tons/capitaMi–Me–MaCircular Rotterdam
Percentage of reduction of emissions due to a smart and clean building logistics (construction sector)%Mi–Me–MaCircular Rotterdam
Air pollution and greenhouse gas emissions associated to transportTons/yearMe–MaCircular London
Average amount of products going to landfill or incinerationTons/yearMe–MaCircular London
Circular Prague
Waste reduction in production of goods–raw material efficiencykilograms of waste per €1000 outputMe–MaCircular Amsterdam
Circular Prague
Amount or percentage of waste separation%/year or tons/yearMe–MaCircular Rotterdam
Circular Prague
Increase in the clean plastics and drink packaging streams from residual waste%/yearMe–MaCircular Rotterdam
Percentage of recycling of the solid waste generated in the city
Percentage of recycle of packaging wastePercentage of recycle of municipal waste
%/yearMe–MaCircular Rotterdam
Maribor, Slovenia
Luibljana, Slovenia
Amount of construction waste by implementing of interventions related to circular economytons/yearMe–MaCircular Rotterdam
Difference between tonnes of waste and tonnes of products consumedTons of waste/tons of products consumedMe–MaCircular Rotterdam
Tonnage of waste diverted via repair, reuse, recovery and upcycling activities (recycling centres, artisans, second-hand goods stores, fab labs, etc.)tons/yearMe -MaCircular Paris
Traceability of hazardous waste**Me–MaMaribor, Slovenia
Amount of waste produced in the city
Amount of waste generated per capita
Tons/year or tons/per capita/yearMe–MaGothenburg, Sweden
Circular London
Circular Rotterdam
Amount of waste produced in the city and treated within the city itselftons/year or %/yearMeCircular Prague
Amount of solid waste reusedTons/year or %/yearMe–MaMaribor, Slovenia
Luibljana, Slovenia
Circular Glasgow
Circular Prague
Amount or percentage of waste avoided
Amount of household waste reduced preventing waste and encouraging reuse
Tons/year or %/yearMi–Me–MaCircular London
Circular Glasgow
Circular Prague
Circular Rotterdam
Antwerp Circular South Circular Paris
Maribor, Slovenia
Malmö, Sweden
Gothenburg, Sweden
Amount of biowastes processed in biogas facilities% or tons/yearMe–MaCircular Prague
Percentage of reduction of noise of waste collection fleet by a perceived percentage%Me–MaCircular Prague
Use of renewable resources%/yearMi–Me–MaCircular Amsterdam
Antwerp Circular South
Circular Rotterdam
Malmö, Sweden
Energy savings per year%/yearMi–Me–MaCircular Glasgow
Circular Paris
Tap water use%/yearMe–MaAntwerp Circular South
Absolute (kWh) and relative (%) reduction of yearly electricity consumptionkWh/year or %/yearMi–Me–MaAntwerp Circular South
Less use of peak power%/yearMi–Me–MaAntwerp Circular South
Primary resources used
Virgin resources used
Amount of primary resource use avoided
%/year or Tons/yearMi–Me–MaCircular Rotterdam
Malmö, Sweden
Circular London
Circular Prague
Circular Glasgow
Primary raw material demand per capitaton/capitaMe–MaCircular Rotterdam
Energy requirement per capitaGJ/person/yearMe–MaCircular Rotterdam
GDP per energy requirement€/GJMe–MaCircular Rotterdam
Supply of renewable energy%Mi–Me–MaCircular Rotterdam
Embedded energy use (“Further research is needed to calculate this indicator” [37])ton/capitaMiCircular Rotterdam
Amount of material saving due to the implementation of circular strategiestonsMi–Me–MaCircular Amsterdam
More efficient resource use**Mi–Me–MaCircular London
Percentage of renewable or recycled energy use%/yearMi–Me–MaMalmö, Sweden
Renewable energy production on total energy productionMWh/year/totalMi–Me–MaMalmö, Sweden
Fossil-fuel-free transport sector%Me–MaMalmö, Sweden
Percentage of renewable electricity supply for all municipal operations%MeMalmö, Sweden
Number of families powered by energy produced by wind turbinesN./totalMe–MaMalmö, Sweden
Electricity consumption per capitaMWh per Capita/yearMe–MaMalmö, Sweden
Public transit ridership for work and school commutes%Me–MaMalmö, Sweden
Eco-car strategy–Municipal fleet powered by biogas, hydrogen or electricity (including plug-in hybrids)%/ yearMe–MaMalmö, Sweden
Construction materials come from secondary sources%Mi–Me–MaCircular Prague
Tonnes of residual materials not utilised (construction sector)Tons/totalMi–Me–MaCircular Prague
Percentage of building heating mainly by natural gas%Me–MaCircular Prague
Percentage of building heating mainly by energy from incineration%Me–MaCircular Prague
Percentage of water heating by natural gas%Mi–Me–MaCircular Prague
Raw material consumption%/yearMi–Me–MaCircular Prague
Sq metres that includes facilities and services to develop their circular sustainable projectsSqm/total surfaceMe–MaBe circular Be.Brussels
Liters of households daily water-consumptionLiters/dayMe–MaAntwerp Circular South
Raw materials with high risk for impact on biodiversity (“Further research is needed to calculate this indicator” [37])%Me–MaCircular Rotterdam
Percentage of sustainable food%Me–MaCircular Paris
Maritime traffic (amount of maritime throughput)Tons/yearMe–MaMarseille
Land covered by a circular platform in the industrial port areaSqmMe–MaMarseille
Percentage of the land area used for circular economy projects implementation%Me–MaMarseille
Number of plants involved in circular economy projectsN./yearMe–MaMarseille
Percentage of biodiversity%Me–MaMalmö, Sweden
Percentage of annual rainfall absorbed by green roofs %/yearMe–MaMalmö, Sweden
Temperature of external facades (decrease for example thanks to green facades)°CMiMalmö, Sweden
Indoor temperatures (decrease for example thanks to green facades)°CMiMalmö, Sweden
Amounts of ground-level ozone recorded near the green facades**MiMalmö, Sweden
Creation of protected green areasN./yearMe–MaMalmö, Sweden
Green areas used as stormwater storageSqm/total surfaceMe–MaMalmö, Sweden
Energy consumption referred to transport sectorKWh/yearMe–MaMaribor, Slovenia
Proportion of green and recreational areas per capita%Me–MaMaribor, Slovenia
Percentage of improvement of fuel utilisation compared to a separate production of heat and power%Me–MaKalundborg Industrial Symbiosis
Reduction of the total water consumption by recycling water and by letting it circulate between the individual symbiosis partners%Me–MaKalundborg Industrial Symbiosis
Amount of ground water substituted by lake water that is processed up to drinking water quality by municipality.
Amount of surface water saved
Cubic meters/yearMe–MaKalundborg Industrial Symbiosis
Amount of reduced oil consumption through symbiosesTons/yearMe–MaKalundborg Industrial Symbiosis
Amount of newspaper/cardboard sold to cardboard and paper consuming industries producing new paper, egg boxes, etc.Tons/yearMe–MaKalundborg industrial symbiosis
Amount of rubble and concrete used for different surfaces after crushing and sortingTons/yearMe–MaKalundborg
Amount of garden/park refuse delivered as soil amelioration in the areaTons/yearMe–MaKalundborg industrial symbiosis
Amount of bio waste from households and company canteens used in the compost and biogas productionTons/yearMe–MaKalundborg industrial symbiosis
Amount of iron and metal resold after cleaning for recyclingTons/yearMe–MaKalundborg industrial symbiosis
Amount of glass and bottles that are sold to producers of new glassTons/yearMe–MaKalundborg industrial symbiosis
Amount of resources saved through the industrial symbiosis initiativesTons/yearMe–MaKalundborg industrial symbiosis
Number of different resource streams exchangedN. /yearMe–MaKalundborg Industrial Symbiosis
Climate change adaptation**Me–MaCircular Prague
Number of symbioses/synergies connecting businesses (resources exchanged)N./yearMe–MaKawasaki, Japan
Malmö, Sweden
Reduction in the physical value of material use due to industrial and urban symbiosis%Me–MaKawasaki, Japan
Economic And Financial Dimensions
Money saved (in a year) for average household due to reducing the amount of products thrown away€/yearMe–MaCircular London
Financial savings to both consumers and businesses adopting more efficient circular business models€/yearMi–Me–MaCircular London
Financial savings to public sector bodies through improved procurement practices/waste management€/yearMe–MaCircular London
Financial savings for consumers from decreased consumption of “new products”€/yearMe–MaCircular London
Waste management costs€/yearMe–MaCircular Glasgow
Circular Prague
Budget allocated to stimulate pilot projects that employ circular economy at the local level€/yearMeBe circular Be.Brussels
Environmental costs (costs of exhaustion, water pollution, CO2-emissions, toxicity and land use in € per kilogram)€/kgMe–MaCircular Amsterdam
Gross value added€/yearMiCircular Prague
Return on investmentMiCircular Prague
Total revenue from sale/leasing of reused products€/yearMiCircular Prague
Economic savings in purchasing reused products for citizens€/yearMiCircular Prague
Resource usage: total raw material productivityGDP/tons of primary material inputMi–Me–MaCircular Rotterdam
Euros allocated from the municipality to various district heating and district energy projects€/yearMeMalmö, Sweden
Sustainability of investments from the municipality**MeMalmö, Sweden
Average value of productsMiCircular London
Value of re-usable or recyclable used goods sent to landfillMiCircular London
Money granted to businesses or research projects linked to the circular economy€/yearMe–MaBe circular Be.Brussels
Increase in productivity for municipality by organizing the production chains in a circular way%/year or €/yearMeCircular Amsterdam
Net added value due to the implementation of circular strategies€/yearMi–Me–MaCircular Amsterdam
Value creation thanks to the growth of circular economy models€/yearMi–Me–MaCircular Paris
Volume of sales thanks to the growth of circular economy modelsAmount/year or €/yearMi–Me–MaCircular Glasgow
Sales of locally produced goodsAmount/year or €/yearMe–MaCircular Glasgow
Revenues through sales thanks to the growth of circular economy models€/yearMi–Me–MaCircular Glasgow
Change in GDP through circular activities%MaCircular Rotterdam
Turnover of organizations working in the circular economy (including all sectors and types)€/yearMiCircular Paris
Global sales related to circular economy%/yearMe–MaMarseille
Annual fees related to circular economy%/yearMe–MaMarseille
Tenancy turnover%/yearMe–MaMalmö, Sweden
Costs related to flood risk€/yearMe–MaMalmö, Sweden
Resources productivity**Me–MaMaribor, Slovenia
Creating added value and economic growth€/yearMe–MaMaribor, Slovenia
Luibljana, Slovenia
Attractiveness in terms of tourist visitsN. of visitors/yearMe–MaMaribor, Slovenia
Luibljana, Slovenia
Public funding in circular economy projects€/yearMe–MaGothenburg
Economic advantage from industrial symbiosis activities€/yearMe–MaKawasaki, Japan
Economic opportunity generating from waste deverted from incinerator and landfill thanks to material exchanges€/yearMe–MaKawasaki, Japan
Social and Cultural Dimensions
Number of new jobs
Share of circular jobs (full- or part-time jobs that are related to one of the seven basic principles of circular employment)
Percentage of new jobs related to the circular economy
Number of new jobs from recycling of packaging
Number of new jobs from industrial ecology
Number of new green jobs
N./year or %/yearMi–Me–MaCircular London
Marseille
Circular Amsterdam
Circular Rotterdam
Circular Paris
Circular Glasgow Kalundborg industrial symbiosis
Maribor, Slovenia
Circular Prague
Luibljana, Slovenia
Kawasaki, Japan
New business opportunities
New businesses that have integrated circularity into their development process
N./year or %/yearMe–MaCircular London
Marseille Circular Amsterdam
Circular Rotterdam
Circular Paris
Circular Glasgow Kalundborg industrial symbiosis
Maribor, Slovenia
Circular Prague
Luibljana, Slovenia
Be circular Be.Brussels
Number of training opportunities related to circular economyN./yearMe–MaCircular London
Circular Prague
Unemployment rate%/yearMe–MaCircular Rotterdam
Maribor, Slovenia
Luibljana, Slovenia
Malmö, Sweden
Change in circular jobs%Me–MaCircular Rotterdam
Number of employeesN./yearMe–MaKalundborg industrial symbiosis
Number of companies supported in the implementation of circular economy approaches N./yearMe–MaBe circular Be.Brussels
Number of individuals trained through the education measures N./yearMe–MaBe circular Be.Brussels
New collaborations between public agencies and enterprisesN./yearMe–MaBe circular Be.Brussels
Number of participants in circular economy processesN./yearMe–MaBe circular Be.Brussels
Public tenders incorporating circular economy and resource efficiency criteria%Me–MaBe circular Be.Brussels
Number of people using a personal dashboard that display real-time data-flows from smart energy, water and waste bin meters, helping to increase awareness about consumptionN./yearMe–MaAntwerp Circular South
Training for employees to think in a circular wayN./yearMe–MaBe circular Be.Brussels
Percentage of population that shows an increase in circular behaviour%Me–MaCircular Rotterdam
Annual number of visitors (with active engagement) to the reuse hubsN./yearMiCircular Prague
Social Cohesion (participate objectively)**Me–MaCircular Rotterdam
Percentage of population that describes their own health as good or very good%/yearMe–MaCircular Rotterdam
Population with middle or high education%/yearMe–MaCircular Rotterdam
Percentage of population dying from diseases of the respiratory system (diseases of the respiratory system can be an air quality indicator, but also of habits such as smoking)%/yearMe–MaCircular Rotterdam
Average household income€/yearMe–MaCircular Rotterdam
Population below poverty line%/yearMe–MaCircular Rotterdam
Health benefits (how to evaluate this indicator is not specified in the report)**Me–MaCircular London
Alleviating food poverty (how to evaluate this indicator is not specified in the report)**Me–MaCircular London
Positive community activity (how to evaluate this indicator is not specified in the report)**Me–MaCircular London
Physical and mental health benefits (how to evaluate this indicator is not specified in the report)**Me–MaCircular London
Number of new circular initiativesN./yearMe–MaCircular Rotterdam
Percentage of residents participated in dialogue and/or design related to circular economy%/yearMe–MaMalmö, Sweden
Number of local “green” companiesN./yearMe–MaMalmö, Sweden
City attractiveness in terms of creation of recreational and cultural spaces**Me–MaMalmö, Sweden
Development of cooperative economy**Me–MaMaribor, Slovenia
Number of new forms of enterprises (SMEs, start-ups, incubators, etc.)N./yearMe–MaMaribor, Slovenia
Luibljana, Slovenia
Level of satisfaction of citizens with the administration servicesqualitativeMe–MaMaribor, Slovenia
Transformation of neighborhoods and local community**Me–MaMaribor, Slovenia
Competitiveness of the economy**Me–MaMaribor, Slovenia
Competitiveness of the university**Me–MaMaribor, Slovenia
Professional and managerial transformation of the city administration**Me–MaMaribor, Slovenia
Interaction between residents**MeMaribor, Slovenia
Number of private partners involved in industrial symbiosisN./yearMe–MaKalundborg Indusrtial Symbiosis
Number of public partners involved in industrial symbiosisN./yearMe–MaKalundborg Indusrtial Symbiosis
Note: ** The indicators whose unit of measure does not emerge or is not clear in the source are reported with a double asterisk.
Table 4. Kalundborg Eco-Industrial Park: an overview.
Kalundborg, Denmark—Eco-Industrial Park
First output-input exchanges: 1961
Geographical scale of cooperation: Kalundborg
Nature of eco-industrial transactions: Output-input exchanges: energy, water, and waste materials
Network members: 8 partners
Denomination: Kalundborg Symbiosis Centre
Creation: 1996
Founders: Industrial partners and the Kalundborg municipality
Mission: statement to educate and build new partnerships (encouraging, facilitating, and managing eco-industrial interactions)
Table 5. Impacts of Kalundborg industrial symbiosis.
IndicatorData
Number of partners linked by commercial agreements exchanging output-input (2015)8 (7 private industrial companies and the local government of Kalundborg)
Number of output–input exchanges (n. of symbioses) (2015)30
Number of different resource streams exchanged25
Amount of internal resources combined (number)5000
Annual economies generated from transforming waste into valuable resources and reducing pollution and materials consumption€80 million/year
Socio-economic benefits produced every year connecting enterprises14 mill /year (Enough to buy 354 brand new electric powered cars)
Euros saved on the bottom line annually connecting the enterprises24 mill/year (Equivalent to having 252 academics employed for a year)
Annual reduction in CO2 equivalent emissions thanks to the partnerships635,000 tons/year
Environmental impact saving—CO2 after 30 years175,000 tons/year
Environmental impact saving—SO2 after 30 years10,200 tons/year
Water saved thanks to recycling and reuse (2010)3 mill m3
Amount of gypsum produced from desulfurization of flue gas that replaced natural gypsum150,000 tons/year
Amount of oil consumption yearly reduced thanks to 19 synergies20,000 tons/year
Amount of gypsum consumption reduced thanks to 19 synergies200,000 tons/year
Amount of the water consumption reduced thanks to 19 synergies2.9 mill m3/year
Resource saving—gas after 30 years45,000 tons/year
Resource saving—coil after 30 years15,000 tons/year
Resource saving—water after 30 years600,000 m3/year
Waste reuse—ash for cement industry after 30 years130,000 tons/year
Waste reuse—gypsum for plasterboard products for the construction industry after 30 years90,000 tons/year
Waste reuse—solid biomass used by 600 farms as fertilizer after 30 years150,000 m3/year
Employment (number of jobs)Gyproc 165
Asnaes Powe Station 120
Statoil Refinery 350
RGS90 65
Novo Nordisk Kalundborg 3500 employees
Number of employees in Kalundborg SymbiosisOver 5000
Note: Data source: [59,60].
Table 6. Ecopal Dunkirk (France): an overview.
Dunkirk, France—Ecopal
Network members: 101 members (mostly Small and Medium Enterprises) (in 2016)
Denomination: Ecopal
Creation: 2001
Founders: Local companies (bottom-up logic) and local public institutions
Mission: To ensure local sustainable development by promoting the concept of industrial ecology through concrete and fruitful projects
Table 7. Impacts of Ecopal.
IndicatorData
Amount of flows (raw materials, energy, waste, by-products, sludge and sewage, and unavoidable energy) inventoried from 147 companies (from 2007 to 2009)5000
Amount of opportunities for cooperation affecting 55 companies (number of synergies)30
Number of enterprises involved in synergies related to reuse of water20
Number of firms that exchange by-products like scrap, steel slag, refractory bricks, steel mill dust, acid waste, tires, solvents, animal feed and used oil (2018)14
Euros saved thanks to 60 shared collections every year210,000 €/year
Percentage of saving on waste-management bills for each participant thanks to 60 shared collections every year20%
Money saved from each enterprise annually4800 €/year
CO2 emission avoided thanks to 60 shared collections every year45 tons/year
Amount of CO2 emissions avoided in 10 years230 tons
Amount of industrial residues managed from 60 shared collections every year430 tons/year
Amount of drinking water yearly saved130,000 m3/year
Number of employees (2011)57,000
Number of industries promoting industrial ecologyOver 200
Note: Data source: [61,62,63,64,65].
Table 8. Kawasaki Eco-Town: an overview.
Kawasaki, Japan—Eco-Town
Geographical scale of cooperation: Kawasaki
Nature of ecoindustrial transactions: Output-input exchanges in main industries of steel, electronics, communication, machinery, oils, chemistry, information, service
Denomination: Kawasaki Eco-Towns
Creation: 1997
Founders: municipality, supported by the Ministry of Environment and the Ministry of Economy, Trade and Industry
Mission: to find a solution to dispose of municipal solid waste in a sustainable way enhancing at the same time local economy
Table 9. Impacts of Kawasaki Eco-Town.
IndicatorData
Number of documented symbioses connect steel, cement, chemical, and paper firms and their spin-off recycling businesses14
Economic advantage from industrial symbiosis activities involving the steel sector 6.74 mill €/a
Economic opportunity generating from waste diverted from incinerator and landfill thanks to 7 key material exchanges (565 kt)130 million USD/year
Coal saved thanks to industrial symbiosis activities involving the waste-processing sector9.1 kt/a
Limestone saved thanks to industrial symbiosis activities involving the waste-processing sector55 kt/a limestone saved
Percentage of reduction in CO2 emission due to the reduction of waste and by-products through industrial symbiosis (2017)13.8%
Total carbon emissions reduction through industrial and urban symbioses 4.26 Mt CO2e
Amount of waste deverted from incinerator and landfill thanks to 7 key material exchanges565 kt
Reduction in the physical value of material use due to industrial and urban symbioses 6.4%
Emergy decresase due to industrial and urban symbioses compared to the case without industrial and urban symbioses49%
N. of workers in Mizue-Town, Kawasaki WardAbout 400
Note: Data source: [66,68,69].
Table 10. Proposed indicators about port in circular city.
IndicatorUnit of MeasureScale
Number of companies/actors involved in symbiotic and synergistic relationships in port area and among port area and cityN./yearMi–Me
Number of existing or promoted symbioses and synergies in port area and among port area and the cityN./yearMi–Me
Reduction in greenhouse gas emissions thanks to the implementation of symbiotic processes%/yearMi–Me
Percentage (or amount) of recycling in port area (waste oil in heavy oil and fuel, oils and metals from waste water, etc.)%/year or tons/yearMi–Me
Percentage of waste produced in port area to landfill%/year or tons/yearMi–Me
Reduction of the percentage of toxic substances produced in port area%/yearMe–Ma
Amount of materials (such as plastic or tires) used as alternative fuel to coaltons/yearMi–Me
Production of thermal energy from the waste heat supplied by the surrounding companiesKJ/yearMi–Me–Ma
Energy generated during waste treatment and used to supply electricity to recycling facilitiesMWh/yearMi–Me–Ma
Grants from the local and national government for symbiosis activities€/yearMe–Ma
Direct and indirect new investments generated by activated symbioses€/yearMe–Ma
New jobs generated by activated symbioses in port areaN./yearMi–Me–Ma
Recycling of non-ferrous metalstons/yearMe–Ma
Amount of electricity equivalent to the energy needed by 10,000 homes per year generated by turbines KW/yearMe–Ma
Investments in the recycling projects€/yearMe–Ma
Waste reduction in production processes%/yearMe–Ma
Money saved thanks to the construction of a new biomass cogeneration plant€/yearMe–Ma
Awards for companies actively involved in waste reduction N./yearMe–Ma
Workshops and events with experts for community awarenessN./yearMe–Ma
Number of neighborhood associations on 10,000 inhabitantsN./10,000 inhabitantsMe
Ground water saved through recycling and reuseMc/yearMe–Ma
Surface water saved through industrial symbiosesMc/yearMe–Ma
Waste water savedMc/yearMe–Ma
Table 11. Health effect from air pollutant associated with shipping.
Air PollutantsHealth Effects
Carbon monoxide (CO)“It is a gas that is readily absorbed from lungs into bloodstream. It attaches more readily to haemoglobin in the blood than oxygen and can cause headaches, dizziness, weakness and aggravate heart conditions”
Nitrogen dioxide (NO2)“It is a gas that causes increased susceptibility to infections and asthma. It reduces lung development in children and has been associated with increasingly more serious health effects, including reduced life expectancy”
Sulphur dioxide (SO2)“It is a gas that can aggravate respiratory and cardiovascular conditions. It can trigger bronchospasm in asthmatics and its effects are heightened by exercise. Sulphur dioxide also from secondary (fine) particulate matter”
Volatile organic compounds (VOCs)“It includes a wide range of chemicals, some of which are carcinogenic to humans. Of most concern are benzene, formaldeyde, 1-3 butadiene and polycyclic aromatic hydrocarbons which include benzo(a)pyrene. VOCs can also react with NOx in the presence of sunlight to form ozone (O3) which is a lung irritant”
Particulate matter
(PM10 and PM2.5)
“It impacts predominantly on respiratory and cardiovascular systems. Effects can range from reduced lung function to increased medication use to more hospital admissions through to reduced life expectancy and death”
Heavy metals“These, such as lead and mercury, are a threat to the development of the chid in utero and early life. Lead is a cumulative toxicant that affects multiple body systems and can cause adverse neurological and behavioural effects in children. Mercury may have toxic effects on the nervous, digestive and immune systems, and on lungs, kidneys, skin and eyes”
Dioxins“They are highly toxic and can cause reproductive and developmental problems, damage the immune system, interfere with hormones and also cause cancer”
Note: Source: [86].
Table 12. Proposed indicators about cultural landscape in circular city.
IndicatorUnite of MeasureScale
Production of public spaces as placesSqm/total surfaceMe–Ma
Sense of place in sites/areaqualitative (scale 1–5)Me
Realization of low energy consumption systems in projects related to cultural heritageN.Mi
Implementation of renewable energy sources in projects related to cultural heritageN.Mi
Use of local traditional materials, bio-materials and/or reuse/materials in projects related to cultural heritagetons/projectsMi
Amount of construction waste to landfill (reduction due to avoiding new construction thanks, for example, to adaptive reuse projects)tons/yearMi
Job creation (linked for example to cultural heritage adaptive reuse)N./yearMi–Me–Ma
Attraction capacity of innovative startups and companies (following the implementation of projects related to cultural heritage)N./yearMi–Me–Ma
Attraction capacity of cultural and creative industries (following the implementation of projects related to cultural heritage)N./yearMi–Me–Ma
Attraction capacity of new commercial activities (following the implementation of projects related to cultural heritage)N./yearMi–Me–Ma
Attraction capacity of cultural visitors (following the implementation of projects related to cultural heritage)N./yearMi–Me–Ma
Quality of public spaces in terms of attractiveness (enhancement of the quality following the implementation of projects related to cultural heritage)Qualitative (scale 1–5)Me–Ma
Real estate values in the area (increase of values following the implementation of projects related to cultural heritage avoiding gentrification in the area)€/yearMi–Me–Ma
Place attachment and local identity (following the implementation of projects related to cultural heritage)Qualitative (scale 1–5)Me–Ma
Social cohesion (following the implementation of projects related to cultural heritage)Qualitative (scale 1–5)Me–Ma
Inclusion of marginalized groups (following the implementation of projects related to cultural heritage)Qualitative (scale 1–5)Me–Ma
Landscape visual quality of the area (following the implementation of projects related to cultural heritage)Qualitative (perception, scale 1–5)Me–Ma
Cultural activities and events (following the implementation of projects related to cultural heritage)N. events/yearMe–Ma
Ctizens’ participation in cultural activities and events (following the implementation of projects related to cultural heritage)N. participants/events
People wellbeing (following the implementation of projects related to cultural heritage)Further research is needed for this indicatorMe–Ma
Number of third sector units (non-governmental organizations (NGOs), associations, etc.) involved in partnership/cooperation (following the implementation of projects related to cultural heritage)N./yearMe–Ma
Number of startups, enterprises (following the implementation of projects related to cultural heritage)N./yearMe–Ma
Number of volunteers (following the implementation of projects related to cultural heritage)N./yearMi–Me–Ma
Annual revenues from new uses/functions (following adaptive reuse projects)€/yearMi–Me–Ma
Safety in the area (following the implementation of projects related to cultural heritage)Qualitative (safety perception). N. of murders/yearMe–Ma
Table 13. Proposed indicators about community wellbeing and health in circular city.
IndicatorUnit of MisureScale
Health care spending on diseases caused by air pollution amounted on the total health expenditure %/yearMi–Me–Ma
Lost productivity arising from ill health due to pollution (market cost)€/yearMi–Me–Ma
Attraction of investments in environmental projects (willingness to pay of the public body to avoid health problems)€/yearMe–Ma
Impacts on health (including occupational health and safety issues, mental health and respiratory) due to use of nontoxic materials in remanufacturing, refurbishment, and reuse of products and components in “Circular buildings”***Me–Ma
Impacts on health (including occupational health and safety issues, mental health and respiratory) due to improved indoor air quality***Me–Ma
Impacts on health (including reduced cancer, negative birth outcomes, and respiratory risks) due to the reduced waste generation (thanks also to product life extension)***Me–Ma
Impacts on health (including reduced cancer, negative birth outcomes, and respiratory risks) due to the reduced production emissions (thanks also to product life extension)***Me–Ma
Reduced impacts on health (respiratory and cardiovascular conditions) due to lower emissions related to air quality from sharing models (as car sharing)***Me–Ma
Reduced impacts on health (cancer, negative birth outcomes, and respiratory diseases) due to the reduction of air, water and soil pollution thanks to recycling***Me–Ma
Reduced impacts on health (cancer, negative birth outcomes, and respiratory diseases) due to the reduction of air, water and soil pollution thanks efficient use of resources***Me–Ma
Reduced impacts on health (cancer, negative birth outcomes, and respiratory diseases) due to the reduction of air, water and soil pollution thanks to reduced use of landfill, and incineration***Me–Ma
Impacts on health (including road safety, road accident deaths and injuries) due to sharing models, shift in consumption in mobility sector***Me–Ma
Reduced impacts on health (cardiovascular and respiratory effects) due to lower air pollutants and GHG related to use of renewable energy sources, general move to renewable energy and energy efficiency in the circular economy across many sectors ***Me–Ma
Reduced impacts on health (cancers, respiratory and negative birth outcomes) due to use of renewable energy sources, reduced generation of pollutants during energy recovery process***Me–Ma
Reduced costs in health sector that allow improving health services due to waste reduction and recycling in health sector***Me–Ma
Reduced impacts on health (cardiovascular and respiratory problems) due to indirect impact via reduced manufacturing air/water emissions thanks use of recycled materials in manufacturing processes***Me–Ma
Average income available on which wellbeing perception depends€/year/personMe–Ma
Inequality index of disposable income.
(Ratio between total equivalent income received by 20% of the population with the highest income and that received by 20% of the population with the lowest income).
%/yearMe–Ma
Healthy life expectancy at birth. (Average number of years that a child born in the reference year can expect to live in good health, assuming that the risks of illness and death at different ages observed in that same year remain constant over time).N.Me–Ma
Rate of non-participation in the work %Me–Ma
Predatory crime index. Number of victims of home burglaries, pick-pocketing and robberies per 1,000 inhabitantsN./1000 inhabitantsMe–Ma
Note: *** Further research is needed for this indicator involving other disciplines.
Table 14. Proposed indicators about urban planning in circular city.
IndicatorUnit of MisureScale
Number of building reused for a new functionN.Me–Ma
Number of spaces reused with a new functionSqm/total city surfaceMe–Ma
Number of projects including nature-based solutions N./total projects Me–Ma
Amount of financial support to implement nature-based solutions€/yearMe–Ma
Recovering of abandoned areas Sqm recovered/sqm abandonedMe–Ma
Reduce production of waste due to the use of sustainable materialstons/yearMi–Me–Ma
Adoption of green and blue infrastructure which can help to regulate CO₂ emissions, flooding and the heat island effectN.Mi–Me–Ma
Virgin material use%/yearMi–Me–Ma
Percentage of reuse of materials of buildings for repurposing %Mi
Number of retrofitting projectsN./yearMi–Me–Ma
Number of projects/solutions that maximise energy efficiency and minimise waste reductionN./yearMi–Me–Ma
Percentage of space for (peri-) urban farming in spatial planning%Me–Ma
Changes in property value€/yearMi–Me–Ma
Avoided damage costs€/yearMe–Ma
Carbon storage and sequestration in vegetation and soilCO2/yearMe–Ma
Monetary values: value of carbon sequestration by trees€/yearMe–Ma
Carbon savings from reduced building energy consumptionKJ/yearMi
Energy savings from reduced building energy consumptionCO2/yearMi
Temperature in urban areas (reductions thanks for example to the implementation of nature-based solutions (NBS) projects)°CMe
Distribution of public green space – total surface or per capitasqm/ total surfaceMe–Ma
Annual amount of pollutants captured by vegetationCO2/yearMe–Ma
Encourage re-use of building materials in new constructionsN. of incentives/yearMe–Ma
Encourage efficient use of resources, materials, and construction techniques that maximise the effective life-cycle of the buildingN. of incentives/yearMe–Ma
Public transport links: walking distance to nearest facilitiesKmMe–Ma
Land dedicated to pedestrians: percentage of road network%Me–Ma

