Abstract
This paper extends the IO-SDA (input–output and structural decomposition analysis) method to decompose the CBAPT (cross-border air pollutant transfer) into different effects, and reveals the status of CBAPT and analyzes influencing factors affecting the CBAPT in China–US trade by comparing China with the US in these factors. This study found that China was a net air pollutant exporter, and this indicates the air pollutants were transferred from the US into China through China–US trade. On the whole, the China energy intensity, China emission coefficient, and import scale effects decreased the CBAPT, whereas the export scale and US emission coefficient effects increased the CBAPT; the influences of export structure, US energy intensity, and import structure on CBAPT were uncertain. The sectoral distribution of effects on the CBAPT in China–US trade was unbalanced, which was mainly concentrated in heavy industry and transportation. The China energy intensity, China emission coefficient, and import scale effects inhibited sectoral CBAPT, and the export scale effect promoted this sectoral transfer. Other effects on the sectoral transfer were negligible. This paper provides some policy suggestions based on empirical results.
1. Introduction
Pollution transfer is a major issue in the research area of the relationship between trade and environment, and it is mainly concentrated on the cross-border transfer caused by the trade between developed and developing countries. Scholars have put forward the hypothesis of “environmental cost transfer”, which means that the international trade may lead to the transfer of environmental pollution from developed to developing countries due to the differences in economic structure, trade structure, and environmental regulation [1]. The US and China are the world’s first and second largest economies, respectively. China–US trade has a significant impact not only on China and the US, but also on the world economy. The international trade development between China and the US is of great potential in the long term despite the trade friction in the short term [2]. Thus, China–US trade is the most important research object in the study of cross-border pollution transfer in international trade. Air pollution has attracted the world’s attention. Air pollutants are caused by mixtures of gaseous, volatile, semi-volatile, and particulate matter, and they mainly include dust, inhalable particulate matter (PM), sulfur dioxide (SO2), nitrogen oxides (NOx), carbon monoxide (CO), and so on, where SO2, NOx, and particulate matter with diameters less than 2.5 μm (PM2.5) are representative and major air pollutants. Thus, we used these three types of air pollutants in this study.
As for China, the data from the China Statistical Yearbook show that the total foreign trade value exceeded 20 billion USD (20.64 billion USD) in 1978, and it reached 4107.16 billion USD in 2017. Trade benefits the economic development, and brings environmental pollution problems to China as well [3]. Air pollution in China is serious, which not only hinders social and economic development, but also endangers human health [4,5]. China’s production is not entirely used for domestic consumption. For example, the export of industrial products from China accounted for 11.20%–18.99% of its total production from 2005 to 2015 [2]. Although the money from export can meet some internal needs, this results in the cross-border air pollutant transfer (CBAPT) from other countries into China. China has increasingly close trade ties with other countries. The data from the China Statistical Yearbook show that the US, Japan, Hong Kong, Korea, and Taiwan are major trading partners for mainland China, and the US is China’s largest trading partner, accounting for 12.26%–14.92% of China’s foreign trade from 2004 to 2017. Meanwhile, China–US trade plays an extremely important role in China’s economic development.
In this regard, the following questions arise: Does China–US trade conform to the “environmental cost transfer” hypothesis, i.e., are the major air pollutants transferred from the US to China? What are the key factors affecting the transfer of air pollutants in China–US trade? Do these factors drive or inhibit CBAPT? How can the CBAPT in China–US trade be mitigated? The answers to these questions are helpful to scientifically recognize the CBAPT in China–US trade process and provide the basis for formulating the coordinated development policy between international trade and the environment.
2. Literature Review
Many studies focus on the embodied carbon in trade. Sato (2014) reviewed the literature on embodied carbon in trade and compared the results from this literature [6]. Wiedmann (2016) summarized the latest empirical findings on global change instigated by trade, and pointed out that the impacts embodied in trade had grown much more rapidly than their total global counterparts [7].
Leontief was the first to apply the input–output (IO) model to examine the relationship between the economy and environmental deterioration in 1970 [8], and the IO model became a mainstream analytical method to study trade and environment issues. Many scholars took embodied carbon as the research object for the current international concern on carbon emissions. For example, Fang and Chen (2016) and Wang et al. (2018) applied the IO model to study embodied carbon emissions in regional trade [9,10]. In addition, this model was also used to study embodied carbon from foreign trade in India [11], Australia [12], Ireland [13], and Sweden [14]. The IO model can be classified into single-region IO (SRIO) and multi-region IO (MRIO) forms. SRIO is based on the input–output table for one country or region, and most studies took embodied carbon as the research object. Deng et al. (2016) put forward the concept of “embodied air pollutants (EAPs)”, which refers to the air pollutant emissions from the production, transportation, and sales for foreign trade [15]. As for China, air pollutants emitted directly and indirectly in China to meet the needs of other countries are called “EAPs in export”; the concept of “EAPs in import” is the reverse of this, i.e., air pollutants emitted directly and indirectly in other countries to meet the needs of China. When EAPs in export are larger than the pollutants in import, the air pollutants transfer from other countries into China, otherwise the opposite. Su (2013) and Deng et al. (2016) calculated the emissions of EAPs in China’s commodity consumption and trade over 1997–2007 and 1995–2009, respectively, and found that China became a net air pollutant exporter [15,16]. Yang et al. (2018) studied embodied SO2 changes in 28 sectors of China’s supply chain [17]. Wakeel et al. (2017) calculated India’s embodied PM2.5 and found that 14% of PM2.5 emissions were indirectly emitted in 2010 [18].
Compared with the SRIO model, the MRIO model has the advantage of using multi-regional and national input–output tables, which can study the economic, energy, and environmental links between different regions or countries. The MRIO model includes bilateral trade IO (BTIO) and multilateral trade IO (MTIO) forms. The MRIO model is based on MRIO tables and distinguishes regional heterogeneity endogenously. In contrast, the BTIO model, also labeled as the emissions embodied in bilateral trade (EEBT) model, is based on SRIO tables. Tukker et al. (2018) introduced the use of MRIO modeling in assessments of natural resource use and resource use efficiency [19]. A comparison between MRIO and BTIO models was reported by Cadarso et al. (2018) [20]. BTIO was employed to study embodied emissions in the trade between two countries or regions. For example, some scholars calculated embodied emissions in China–Japanese [21,22,23,24], China–South Korean [25], and China–Australian [26] trade. Du et al. (2011) and Zhao et al. (2016) examined the embodied carbon in China–US trade over the periods 2002–2007 and 1995–2009, respectively [27,28]. They found that a large amount of CO2 was transferred into China through this trade. Most studies on bilateral trade focused only on embodied carbon. Xu et al. (2019) calculated PM2.5, NOx and SO2 embodied in China–US trade, and found that EAPs in China’s export were much larger than in China’s imports [2]. MTIO was applied to examine embodied emissions in trades among several countries or regions with similar economic development and economic structure. Most scholars constructed the MTIO form to study carbon emissions. For example, Deng and Xu (2017) calculated embodied carbon in global trade [29]. The results revealed the US was the largest embodied carbon trading country; Liu et al. (2017) also found the similar results [30].
In the IO analytical framework, most scholars employed the decomposition method to study the influencing factors for embodied energy and emissions. The main decomposition methods include index decomposition analysis (IDA) and structural decomposition analysis (SDA). In IDA, the log mean Divisia index (LMDI) is widely used. For example, Wu et al. (2016) employed the LMDI method to decompose the embodied carbon emission changes in China–Japanese trade during 2000–2009 into activity, structure, and technology effects [23]. A similar decomposition method was conducted by Dong et al. (2010) [21]. Recently, Xu et al. (2019) applied this model to decompose the changes of PM2.5, NOx, and SO2 embodied in China–US trade [2]. Generally, IDA mainly uses time series data, which makes it easy to compare the annual changes of various effects, whereas SDA is based on IO data, which is conducive to the analysis of direct and indirect effects, and decomposing embodied emission changes into more effects [31] For example, Su and Thomson (2016) used an extended IO table to distinguish the normal and processing exports with processing trade and non-competitive imports, and explained the estimation of embodied emissions in trade through the extended IO framework and driving forces behind the changes of embodied emissions using the additive SDA framework [32]. Zhao et al. (2016) distinguished the impacts of intermediate inputs and final products and analyzed the factors affecting embodied carbon emission changes in China–US trade, and found that the “trade structure of domestic intermediate products” and “export market shares of domestic final products” greatly promoted the growth of embodied carbon in the export to the US, while the carbon emissions embodied in the US exports into China were mainly affected by “total foreign demand” [28]. However, Yu and Chen (2017) revealed that trade scale effect increased embodied carbon in China’s export into South Korea, while the trade structure effect had a negative impact in China–South Korean trade [25]. In addition, some studies used this method to investigate embodied carbon from the inter-provincial trade perspective [33,34], and investigated embodied carbon emissions in global trade [29,35,36].
As for the studies on EAPs using the SDA method, Liu and Wang (2015) divided the changes of SO2 embodied in China’s export into the emission intensity, production technology coefficient, intra-regional, and inter-regional trade coefficients, export structure, and export scale effects [37]. Deng et al. (2016) applied the same method to study the influencing factors for changes in EAPs in China’s consumption and trade from 1995 to 2009 [15]. Recently, Lin and Xu (2019) examined embodied NOx, sulfur oxides (SOx), and non-methane volatile organic compounds (NMVOC) in China–Russian trade, and found that China has become a “pollution heaven” [38], which is consistent with the results of Yu and Chen (2017) [25]. These results indicate that the expansion of export to Russia was the main reason for the increases in EAPs from China’s export to Russia, and the progress of emission reduction technology restrained the growth of EAPs.
The current literature presents the following features. First, the existing literature mainly concentrated on embodied carbon issues, while few touched on the EAPs. The current relative studies are only found in the study by Lin and Xu (2019) [38], but in this study the important air pollutant (PM2.5) emissions were not considered in the China–Russian trade. In addition, the China–Russian trade value accounts for only about 2% of China’s total, whose influence is less compared with China–US trade. Second, the previous literature focused on embodied emissions in China’s exports into the US and imports from the US [28]. However, few studies conducted the analysis in the term of cross-border emission transfer. Third, the IDA and SDA methods were both widely used in the studies on factors influencing embodied emissions; the advantage of the SDA method is that this method can take both direct and indirect effects of various factors into account, and can easily compare the factors affecting cross-border pollutant transfer based on IO table data [39]. However, the current research on bilateral trade using the SDA method mainly focused on embodied carbon, few studies conducted an in-depth analysis of the cross-border transfer of major air pollutants.
For the research gap, this paper extends the SDA method to decompose the CBAPT into different effects, and discusses the influencing factors for CBAPT in China–US trade from 2005 to 2015 by comparing China with the US in these factors. This study can provide the following novelties in the relative research area. First, this paper establishes the relationship between China and the United States in terms of economy, trade, energy consumption, and emissions based on the input–output tables of China and the US, and incorporates the emission coefficients, trade structures, and energy intensities of the two countries into the input–output and structural decomposition analysis (IO-SDA) model, which expands the traditional IO-SDA decomposition model for a single country. This is conducive to analysis of the impact of differences between China and the United States in influencing factors on CBAPT. Second, it is easy to point out the key driving and inhibiting factors and the extent of influences of these factors for CBAPT in China–US trade, through analyzing the differences in emission coefficient, trade structure, and energy intensity between China and the United States, which can provide the basis for the relevant policy formulation.
3. Methodology
The IO relationship can be expressed as,
where A, X, and Y represent the direct consumption coefficient matrix, sectoral total output column vector, and final product column vector, respectively. Assuming that, aij = xij/xj, and xij denotes the value of sector j’s input from sector i; then xj, represents sector j’s total output. The complete consumption coefficient matrix B is:
where (I−A)−1 is the Leontief inverse matrix; I is an identity matrix; the corresponding elements of B can be represented by bij. In previous studies, the imported intermediate inputs were not considered which resulted in an overestimation of embodied emissions. Thus, China’s intermediate inputs in this paper should be divided into two kinds: intermediate inputs produced domestically and imported intermediate inputs. Assuming that Ad and Am denote the direct consumption coefficient matrices of domestic and imported intermediate products, respectively, A = Ad + Am, where Am = MA, Ad = (I − M) × A; then M is an import coefficient matrix, which is used to measure sector i’s dependence on import, and its diagonal matrix elements mij can be described as mij = imi/(xi + imi-exi), where xi, imi, and exi represent sector i’s output, import, and export, respectively. Am should be deducted in this calculation because the production of imported intermediate products occurs abroad. Thus, Equation (2) can be rewritten as,
Sector j’s complete energy consumption intensity can be expressed as,
where ei is energy consumption of sector I, ei/xi denotes sector i’s energy intensity (energy consumption per unit output). Sector j’s air pollutant emission coefficient (EIj) can be written as,
where APj and Ej stand for air pollutant emissions and energy consumption of sector j, respectively. Thus, sector j’s EAPs in the export (EAjEX) can be defined as,
where EXj is sector j’s export value. Assuming that IMj denotes sector j’s import value, the EAPs in sector j’s import can be expressed as,
Thus, the CBAPT from the US into China in China–US trade (EAjNET) can be written as,
Equation (8) can be rewritten as follows, combined with Equations (6) and (7),
where CEjChina and CEjUS respectively represent complete energy consumption intensity in China and the US. EIjChina and EIjUS respectively represent sector j’s air pollutant emission coefficient for China and the US. SEX and SIM respectively denote China’s export and import structures in China–US trade. EX and IM are China’s total export value into, and total import value from, the US, respectively. Thus,
where bijChina and bijUS represent the complete consumption coefficient for China and the US, respectively. eiChina and eiUS are sector i’s energy consumption in China and the US, respectively. xiChina and xiUS are China’s and the US outputs, respectively.
where APjChina and APjUS respectively stand for sector j’s air pollutant emissions in China and the US, respectively. EjChina and EjUS are sector j’s energy consumption in China and the US, respectively. Through the two-polar decomposition method [40], the changes in CBAPT in China–US trade (ΔEANET) between the 0 period and 1 period can be expressed as,
Equation (14) can be used to decompose the CBAPT in China–US trade over different periods. The China energy intensity (denoted by ΔIChina), China emission coefficient (denoted by ΔCChina), export structure (denoted by ΔSex), export scale (denoted by ΔEX), US energy intensity (denoted by ΔIUS), US emission coefficient (denoted by ΔCUS), import structure (denoted by ΔSim), and import scale effects (denoted by ΔIM) respectively reflect the impacts of changes in direct and indirect energy consumption per unit output (energy consumption intensity) in China, EAPs per unit energy consumption (EAP emission coefficient) in China’s export into the US, China’s proportional export into the US for different sectors, China’s total export into the US, energy consumption intensity in the US, EAP emission coefficient in China’s import from the US, China’s proportional import from the US for different sectors, and China’s total import from the US, on CBAPT from the US into China.
4. Data Sources
China’s relevant data mainly come from its statistics and official databases. The relevant data of the US come from its statistics and international official databases, so multiple data sources were used in this study. China’s and the US IO tables are respectively taken from the “China Statistical Year book” and the website of the World Input–Output Database (WIOD). The data on trade values came from the “China Trade and External Economic Statistical Yearbook”. The data on RMB exchange rate to USD in 2005–2015 were from the “China Statistical Yearbook”. The data for fossil energy consumed in China and the US were from the “China Statistical Yearbook” and the US Energy Information Administration (EIA), respectively. China’s air pollutant emissions (SO2, NOx, and PM2.5) were from the “China Statistical Yearbook”, the China environment protection database, and emission inventory database from Tsinghua University [41,42,43]. The data for air pollutant emissions in the US were obtained from the United States Environmental Protection Agency (EPA) and the Emission Database for Global Atmospheric Research (EDGAR).
In this paper, the data mentioned above are processed as follows. Considering the consistency with sectoral division, this paper divided the national economy for China and the US into 12 sectors, based on China’s 42-sector and America’s 56-sector input–output tables, China’s and America’s 21-sector export and import data, China’s 47-sector and America’s five-sector energy consumption data, and China’s 12-sector and America’s 13-sector air pollutant data (Table 1).

Table 1.
Sectoral classification.
5. Results and Discussion
5.1. The Status of CBAPT in China–US Trade
The trends of changes in SO2 and NOx embodied in China’s export into the US showed an “inverted V” shape (Figure 1), and reached their highest levels in 2007. Embodied PM2.5 in China’s export decreased to 315.30 kilotons (kt) from the maximum of 699.54 kt during 2005–2015. During this period, the import embodied SO2 decreased slightly (−4.01 kt), and import embodied NOx and PM2.5 showed an upward trend. The EAPs in China’s exports were much larger than those in imports from 2005 to 2015, indicating that China was a net air pollutant exporter. This means a large amount of air pollutants were transferred from the US into China in China–US trade. This result is consistent with Yu and Chen (2017) [25], Long et al. (2018) [24], and Xu et al. (2019) [2]. They suggested that a large number of air pollutants and greenhouse gases (GHGs) were transferred through trade from developed countries, such as the US, Japan, and Korea, into China. However, the export embodied SO2, NOx, and PM2.5 declined by 32.56%, 15.57%, and 45.07%, respectively, from 2005 to 2015. Accordingly, the cross-border transfer of SO2, NOx, and PM2.5 emissions in China–US trade decreased from 803.96, 323.03, and 682.10 kt in 2005 to 538.29, 196.73, and 345.53 kt in 2015, respectively.
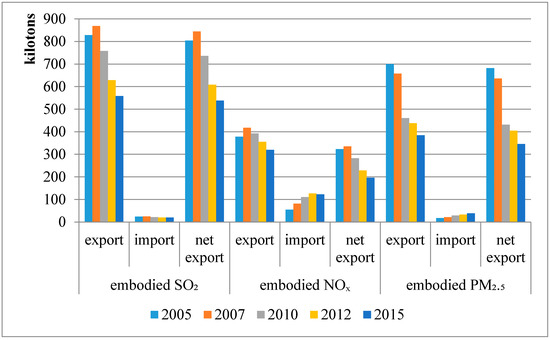
Figure 1.
The air pollutants embodied in China–US trade from 2005 to 2015. Particulate matter (PM).
In recent studies, some scholars found that the trade surplus was a driving factor for the increment of embodied energy consumption in China–EU trade [44]. Comparison with the change trends of trade value in China–US trade indicates a huge trade surplus for China from 2005 to 2015. The net export value presented an upward trend apart from a slight decline due to the financial crisis in 2009 (Figure 2). However, the CBAPT from the US into China showed a declining trend over the study period. This indicates that the trade surplus played a small role in the CBAPT in China–US trade. Although they had a declining trend, China’s EAPs per unit export value into the US were still much higher than the US EAPs per unit export value into China from 2005 to 2015 (Figure 3). This was because of the large share of coal and other high-pollution energy consumption in China’s production. The proportion of coal consumption covered 65.97%–72.72% during 2005–2015, which was much greater compared with the US (17.86%–24.73%). Moreover, there were differences in the energy consumption structure and energy efficiency between the two countries.
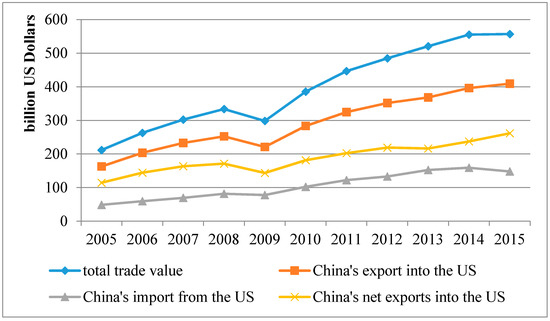
Figure 2.
The status of China–US trade from 2005 to 2015.
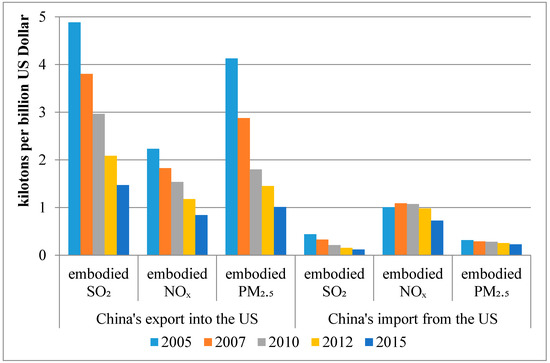
Figure 3.
The embodied air pollutants (EAPs) per unit of China’s export and import in China–US trade from 2005 to 2015.
Comparison with EAP emission coefficients in various sectors shows that the US emitted less EAPs per unit energy consumption than China on the whole (Table 2). From a sectoral perspective, embodied pollutant emission coefficients in China’s Sectors 1, 5, 6, and 9 from 2005 to 2015 were sometimes lower than these coefficients in the same sectors for the US. The US has realized the mechanization of agriculture and other primary productions, and has been developing towards modernization, specialization, and technology. However, the large-scale application of machinery brought more energy consumption and higher pollutant emission coefficients for these sectors. Other sectors in China, such as Sectors 2 and 3, have higher EAP emission coefficients from 2005 to 2015. Meanwhile, their energy consumption respectively accounted for 20.33% (2005)–23.08% (2007) and 7.66% (2007)–8.52% (2010) of the total, whereas the share of energy consumption in these two sectors for the US were only 2.89% (2007)–4.52% (2005) and 0.54% (2015)–0.99% (2005), respectively. Thus, compared with the US, China’s Sectors 2 and 3 were energy-intensive, and coal consumption respectively accounted for 29.60% (2007)–38.78% (2015) and 60.03% (2007)–64.60% (2015) [2]). Yu et al. (2014) suggested that a large amount of coal consumption was closely related to higher pollutant emission coefficients [45]. China’s export were mainly concentrated in Sectors 2, 8, and 10, and most of these sectors had higher emission coefficients when compared with the US. In addition, China’s import from the US were concentrated in Sectors 1, 5, and 11, and the emission coefficients in these sectors were lower when compared with the US.
Table 2.
Sectoral EAP emission coefficients and trade values for China and the US from 2005 to 2015 (unit: t/104 tce; billion USD).
5.2. Influencing Factors for CBAPT in China–US Trade
Equation (14) was used to decompose the CBAPT from the US into China in China–US trade (ΔEANET) over different periods. Table 3 shows that the effects on the changes in the CBAPT and their contributions over different periods. On the whole, the China energy intensity, China emission coefficients, and import scale effects inhibited the CBAPT from the US into China, among which the China emission coefficient effect was a key factor. The US emission coefficient and export scale effects greatly promoted the CBAPT from the US into China. The export structure, US energy intensity and import structure effects, contributed positively or negatively to the CBAPT.
Table 3.
Effects on cross-border air pollutant transfer (CBAPT) from the US into China from 2005 to 2015.
5.2.1. Energy Intensity Effect
The China energy intensity effect decreased the volumes of SO2, NOx, and PM2.5 transferred from the US into China by 107.7, 60.5, and 66.9 kt, respectively, from 2005 to 2015. The China energy intensity effect had a decreasing-inhibitory impact on the CBAPT from 2005–2007 to 2007–2010, but this effect promoted the PM2.5 transfer by 24.3 kt from 2007 to 2010. The contribution of the energy intensity effect to CBAPT changed from negative to positive from 2010–2012 to 2012–2015, and this effect increased the volumes of SO2, NOx, and PM2.5 transferred from 2012 to 2015 by 82.5, 57.6, and 22.1 kt, respectively. This shows the energy efficiency promotion in China had slowed down. The US energy intensity effect promoted the SO2 transfer into China by 15.3 kt from 2005 to 2015, but inhibited the volumes of NOx and PM2.5 transferred into China by 6.5 and 0.7 kt, respectively. Over the period of 2005–2015, this effect on SO2 and NOx transferred into China presented as an “N” and “V” shape, respectively, while this effect on PM2.5 transferred into China was from promotion to inhibition.
The decline in China’s energy intensity directly leads to the reduction of China’s energy consumption per unit output, thereby reducing the air pollutant emissions per unit output. This results in the decreases in EAPs in China’s export. Similarly, the decline in the US energy intensity results in the decreases in EAPs in the US export. Thus, the decreases in China’s energy intensity can reduce the CBAPT from China into the US, and it is just the reverse if the US energy intensity decreases. Comparing the US energy intensity with China’s from 2005 to 2015 (Figure 4), China’s energy intensity was higher, but the gap narrowed gradually from 2.66 times in 2005 to 1.43 times in 2015. During the 11th Five-Year Plan (FYP) (2006–2010), China declared the plan of reducing energy intensity by 20% as a restrictive indicator [46]. In the 12th FYP (2011–2015), the requirement for decreasing energy intensity by 16% was put forward. During the 13th FYP (2016–2020), the target was clearly declared that the energy intensity would be reduced by 15% by 2020 compared with 2015′s level. China has made a great progress in decreasing energy intensity. Figure 4 indicates that China’s energy intensity went down from 2005 to 2015. According to China statistics, China’s energy intensity declined by 4.5% in 2014, and this was the largest degree of decline since 2008. However, China’s economic growth rate was on a declining trend from 2012 to 2015, and the emission reduction was neglected in some places for maintaining steady economic growth. Additionally, the decreases in energy prices, such as coal and crude oil, led to the decline in enthusiasm of energy conservation and emission reduction for enterprises, and the long-term development of energy saving transformation also limited the promotion space for enterprises in the future [47]. Thus, the energy intensity in China went down during the study period, but this degree of decline decreased. The inhibitory impact of China’s energy intensity effect on CBAPT decreased as well. The energy intensity for the US was stable, which increased steadily from 2005 to 2010, and then decreased from 2010 to 2015. The US Obama administration proposed to “bring manufacturing back” in 2009 to create more jobs and develop the US economy because of the financial crisis in 2008. The “bring manufacturing back” proposal inevitably intensified energy consumption, so the energy consumption per unit output for the US increased during 2008–2010. Barkhordari and Fattahi (2017) suggested the decline in energy intensity was induced by energy price reduction and technological changes [48]. At the end of 2013, the US announced the withdrawal of quantitative easing policy. The USD exacerbated the decline in energy price, so the energy intensity showed a downward trend during this period. As one of the highest energy efficiency countries, the US will not greatly change the energy intensity through the adjustment of energy use proportion or progress of cleaner production technology. Therefore, the US energy intensity had a relatively small effect on the CBAPT, which was consistent with Xu et al. (2019) [2]. The impact of energy intensity effect on CBAPT mainly depended on the change of energy intensity in China.
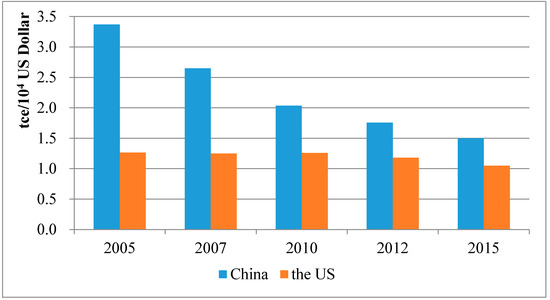
Figure 4.
The energy intensity for China and the US from 2005 to 2015.
5.2.2. Emission Coefficient Effect
The China emission coefficient had a great inhibitory effect on CBAPT from the US into China. This effect respectively reduced the volumes of SO2, NOx, and PM2.5 transferred into China by 550.0, 228.8, and 510.2 kt from 2005 to 2015, and the contributions to the total transfer were −207%, −181.1%, and −151.6%, respectively. From 2005–2007 to 2007–2010, this effect inhibited PM2.5 transfer into China with an increasing degree, but inhibited the SO2 transfer into China with a decreasing degree, and even promoted the NOx transfer into China. From 2010–2012 to 2012–2015, the contribution of emission coefficient effect to the CBAPT was always negative, and this inhibition presented an upward trend. The US emission coefficient effect significantly increased the volumes of SO2, NOx, and PM2.5 transferred into China (5.7, 42.0, and 1.4 kt, respectively). The contributions to SO2 and PM2.5 transfer from 2005 to 2015 had “N” and “V” shape trends, respectively, and the contribution to NOx transfer presented an increasingly promoting trend.
The decline in China’s air pollutant emission coefficients directly leads to the reduction of China’s air pollutant emission intensity (air pollutant emissions per unit output), and this is conducive to decreases in EAPs in China’s exports. Similarly, the decline in the US air pollutant emission coefficients results in the decreases in EAPs in the US export. Thus, the decreases in China’s air pollutant emission coefficients can reduce the CBAPT from China into the US, and it is reverse if the US air pollutant emission coefficients decrease. China’s long period coal-based energy consumption structure is a main reason for the large amount of air pollutants. The increment in the proportion of coal consumption increased air pollutant emission coefficient. Figure 5 shows that, China’s coal consumption rose from 2005 to 2013, with an average annual increase by 8.88%, and declined gradually from 4244.26 million tons (Mt) in 2013 to 3970.14 Mt in 2015, but it was still higher than the consumption in 2005. The proportional coal consumption in China increased from 2005 to 2007. The rapid development of China’s economy, especially the development of infrastructure and the manufacturing industry, increased the demand for coal, thus the proportional coal consumption increased. The China emission coefficient effect showed a slight inhibition on the SO2 and NOx transfer. The proportion of coal consumption declined from 2007 to 2010. During the 11th FYP (2006–2010), China’s government encouraged high-quality energy development and utilization mechanisms, optimized energy consumption structure, and gradually formed a new energy structure. Thus, the China emission coefficient effect inhibited CBAPT during this period. From 2010 to 2013, the proportional coal consumption showed an upward trend, with an average annual increase of 11.01%. Meanwhile, the average GDP growth rate was more than 10%. The accelerating industrialization and urbanization increased the coal consumption, and this resulted in high consumption and low efficiency. Accordingly, the inhibition of China’s emission coefficient effect on the CBAPT became small. The proportion of coal consumption decreased during 2013–2015, so the contributions of China’s emission coefficient effect to reduction in SO2, NOx, and PM2.5 transferred into China reached 53.28%, 83.32%, and 41.76%, respectively. The coal industry development plan during the 12th FYP period was issued in 2012, which stated that the comprehensive utilization of resources should be accelerated and that the healthy and sustainable development for the coal industry should be promoted, so the construction of new coal industry system had achieved a remarkable achievement, and China’s energy efficiency had been gradually improved by 2015.
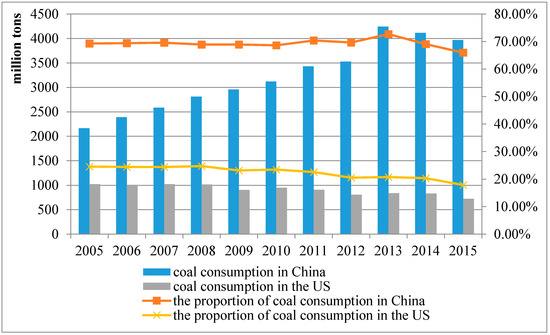
Figure 5.
The coal consumption and proportion in China and the US from 2005 to 2015.
However, the US had low proportional coal consumption (Figure 5). The coal consumption in the US presented a declining trend on the whole, and the oil and gas consumption accounted for a great proportion; the “low carbonization” characteristic for the US economy is obvious. The US has formed a service-dominated economic mode since the mid-1990s, and the proportion of industry declined. The proportion of manufacturing industry for the US was less than 11% by 2015, whereas the US imported industrial products from China accounted for 96.32% of its total, which resulted in the CBAPT into China.
Comparing China’s air pollutant emission coefficients with the US (Figure 6), the emission coefficients in China are significantly higher. This indicates that the emission efficiency for the US was higher than China on the whole. China’s emission coefficients presented a decreasing trend, reflecting the promotion of China’s emission efficiency. The SO2 and NOx emission coefficients in the US decreased, but the PM2.5 emission coefficient increased slightly. Further analysis shows that the change trend of emission coefficient effect in China was consistent with the change trend of SO2, NOx, and PM2.5 emission coefficients from 2005 to 2015 (Figure 7). This indicates the effect of emission coefficient on CBAPT mainly depended on the change of China’s emission efficiency.
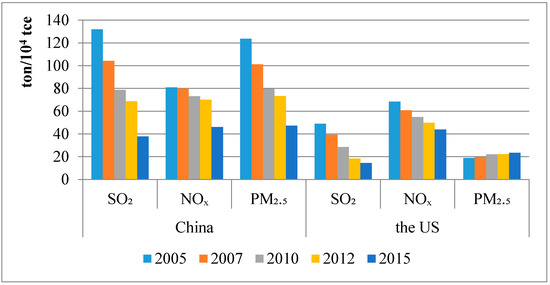
Figure 6.
China’s and US air pollutant emission coefficients from 2005 to 2015.
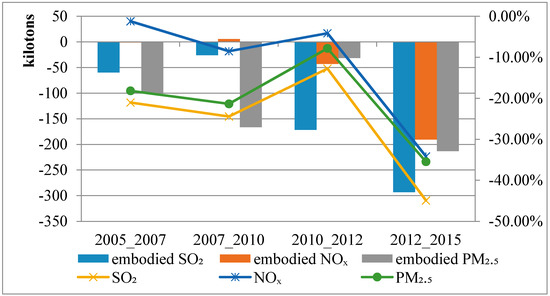
Figure 7.
The emission coefficient effects on CBAPT and changes in air pollutant emission coefficients in China from 2005 to 2015.
From a sectoral perspective (Table 4), Sectors 3, 10, and 12, were with the high emission coefficients in China from 2005 to 2015, followed by Sectors 1, 9, and 10. This indicates that the emission efficiency for these sectors was relatively low. These sectors account for a considerable proportion of export into the US (Table 5). For example, the export shares for Sector 10 reached 65.09% (2005)–67.73% (2012) from 2005 to 2015. Meanwhile, China’s total SO2, NOx, and PM2.5 emissions in the exports into the US were all more than 300 kt. In addition, Sector 10 also had the highest emission coefficient among all sectors in the US, and its export share into China was more than 45%. This means that the US also emitted a large amount of air pollutants from its exports into China. The emissions in the US were far less than the emissions in China because of the cleaner production technology and more advanced end-treatment level. This resulted in a large amount of CBAPT from the US into China.
Table 4.
Sectoral air pollutant emission coefficients in China and the US from 2005 to 2015 (unit: t/104 tce).
Table 5.
The sectoral proportional export for China and the US from 2005 to 2015 (unit: %).
5.2.3. Trade Structure Effect
The export structure effect increased the volumes of SO2 and NOx transferred into China by 3.0 and 32.6 kt, respectively, from 2005 to 2015, whereas the export structure effect decreased the volume of PM2.5 transferred into China by 23.3 kt. From 2005 to 2007, this effect reduced the SO2 and PM2.5 transfer, and promoted the NOx transfer. The contribution to the CBAPT into China was negative from 2007 to 2010. From 2010–2012 to 2012–2015, the export structure effect had a slightly declining impact on the SO2 transfer, but the promotion degree of NOx and PM2.5 transfer increased; the increments of SO2, NOx and PM2.5 transferred into China changed from 10.2 to 9.8 kt, 5.5 to 22.7 kt, and 10.2 to 46.7 kt, respectively. The import structure effect had a relatively slight positive or negative impact on the CBAPT into China.
For China, the optimization of trade structure (the decline in the proportion of high-energy-consumption and high-emission exports) is conducive to reducing the EAPs in China’s export, thereby reducing the CBAPT from China into the US. China’s proportional industrial export into the US increased from 95.78% in 2005 to 96.32% in 2015 (Figure 8). The proportion of export from the commercial sector was only from 1.08% (2012) to 1.44% (2007), and showed a downward trend. Thus, China’s export into the US was still dominated by resource- and labor-intensive products. The reason for this is that China has abundant resources, labor, and other production factors. Moreover, this is related to the decline in the proportion of manufacturing industry in the US; China’s industrial import value was high, and the proportion accounted for 71.07% (2015)–82.05% (2005). The export structure dominated by tertiary industry in the US had little impact on the environment. Meanwhile, the export proportion of China’s industrial sectors was 1.17 (2005)–1.36 (2015) times of the import proportion. This also indicates China was in a disadvantaged position of international division.
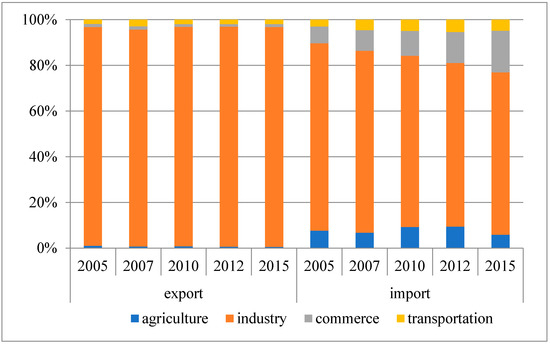
Figure 8.
The proportional export and import for China’s agriculture, industry, commerce and transportation from 2005 to 2015.
5.2.4. Trade Scale Effect
The export scale was an important promoting effect on the CBAPT. This effect increased the volumes of SO2, NOx, and PM2.5 transferred into China by 385.0, 197.8, and 285.0 kt, respectively, from 2005 to 2015. From 2005–2007 to 2007–2010, the export scale effect changed from positive to negative. This effect greatly promoted the SO2, NOx, and PM2.5 transfer from 2005 to 2007, with contributions of 475.4%%, 723.5%, and 333.5%, respectively. From 2007 to 2010, this effect slightly decreased the CBAPT. The import scale effect significantly reduced the SO2, NOx, and PM2.5 transferred into China, whose contribution was negative during each period. From 2005 to 2015, this inhibitory effect on SO2 transfer decreased and then increased, and gradually increased the NOx and PM2.5 transfer. The US is China’s largest export market and the third largest import source [49]. From 2005 to 2015, the export into the US increased from 169.52 to 379.70 billion USD, with an increase by 123.99%. During the period of 2005–2007, China’s economy developed rapidly. As one of the “troikas” driving the economic growth, China’s export rose by 60.12%, of which the exports into the US increased by 34.76%. The foreign demand decreased due to the financial crisis in 2008, and the growth rate of China’s exports into the US declined slightly, dropping by 65.77% from 2005–2007 to 2007–2010. Over this period, the export scale effect changed from promoting to inhibitory. Over the next few years, the exports continued to increase, rising by 48.54% in 2015 compared with 2010, and the growth rate increased from 17.93% to 25.96% (Figure 9). Accordingly, the export scale effect on the CBAPT increased as well. The import from the US increased by 2.25 times from 2005 to 2015, and the import growth rate decreased and then increased, so the inhibition of import scale effect on the SO2 transfer into China decreased and then increased. The exports into the US were two to three times greater than its imports from 2005 to 2015. The huge trade surplus also led to the CBAPT from the US into China to a certain extent. It can be predicted that the export scale into the US may be reduced due to the China–US trade frictions, and this may weaken the promoting trade scale effect on the CBPT in the future.
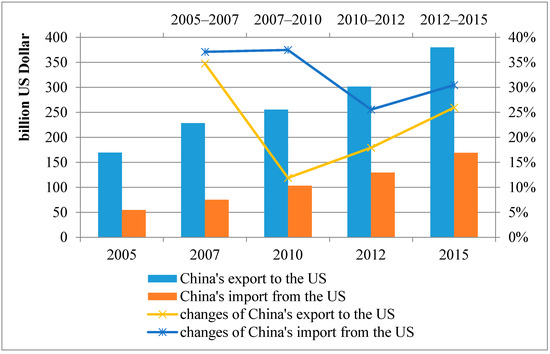
Figure 9.
The changes of export and import in China–US trade from 2005 to 2015.
6. Conclusions and Policy Suggestions
The original idea of this work is that the status of emission cross-border transfers and their driving factors can be revealed through the international trade links between different countries. In this regard, the US and China’s IO tables and air pollutant emission dataset are used in this empirical study. The proposed framework can be applied to other aggregate indicators and extended to multi-country analysis. This paper extends the SDA method to decompose the CBAPT into the energy intensity effect, emission coefficient effect, trade structure effect, and trade scale effect from the two-national perspectives, and discusses the influencing factors for CBAPT in China–US trade through comparison of China with the US. The main conclusions are as follows through the results above.
(1) China was a net air pollutant exporter, and the CBAPT from the US into China existed in China–US trade. (2) On the whole, the China energy intensity, China emission coefficient, and import scale had great inhibitory effects on the CBAPT from the US into China, while the increases in CBAPT were induced by the export scale and US emission coefficient effects; the influences of export structure, US energy intensity, and import structure were uncertain on the CBAPT. (3) The sectoral distribution of effects on the CBAPT from the US into China in China–US trade was unbalanced, which was mainly concentrated in the heavy industry and transportation, such as Sectors 3, 5, 10, and 12; the China energy intensity, China emission coefficient, and import scale effects inhibited sectoral CBAPT; the export scale effect promoted this sectoral transfer, and other effects on the sectoral transfer were negligible.
Future studies will use the extended SDA method to analyze whether China–US trade promotes or reduces the total amount of air pollutant emissions for the two countries, and explore the impact of China–US trade frictions on the CBAPT considering the current China–US trade situation. The following policy suggestions are put forward based on these conclusions.
We looked at adjusting trade division and accelerating industrial transformation. Most of China’s exports into the US are resource-, capital- and labor-intensive, while its imports from the US are mainly technology-intensive. Accelerating the transformation and upgrading China’s industrial structure is an effective measure to improve social productivity and reduce air pollutant emissions. The volumes of SO2, NOx, and PM2.5 transferred from the US into China showed a downward trend from 2005 to 2015, indicating that China’s international division in China–US trade had been improved. Thus, in order to change China’s trade status as a net air pollutant exporter, it is necessary to improve China’s international division position; transform and upgrade traditional dominant industries (such as textiles, machinery, optics, and other manufacturing industries); cultivate and develop new industries (such as information, electronics, new materials and bioengineering), rebrand the new competitive advantages of traditional industries; and improve international comprehensive competitiveness. In addition, the industrial structure should be adjusted to accelerate the development of industry towards innovation driven, intelligent manufacturing, and low carbon.
In terms of optimizing the trade structure and restricting the high-emission sectoral export, the expansion of China’s exports into the US is an important reason for promoting the CBAPT into China, but the export restrictions will inevitably hinder economic development. Thus, China should optimize its trade structure by increasing the added value of export products, improving export quality and enriching the types of export products, so as to reduce the promotion of export scale effect on the CBAPT into China. The export from high-emission sectors, such as Sectors 2, 3, and 10, greatly promoted the CBAPT into China, while the import from these sectors were conducive to reducing air pollutant emissions. Therefore, China should reduce domestic air pollutant emissions through some trade measures, such as reducing the export of high-emission sectors and reducing the import tariffs on high-emission products. Moreover, China should optimize the resource allocation in heavy industries, guide the social resources to flow into the low-pollution industries, and vigorously support the development of modern industries, such as the internet, microelectronics, new energy, and ecotourism.
We also considered the adoption of scientific and technological innovations to reduce China’s emission coefficient and improve its energy efficiency. The China energy intensity and China’s emission coefficient effects greatly inhibited the CBAPT from the US into China. Thus, China should attach full importance to this advantage, and further improve China’s emission efficiency and energy efficiency. First, China can learn from the experience of developed countries in energy conservation and emission reduction, draw on their successful policies and guidelines, refer to their emission regulations, and use high standards to limit production emissions. For example, at the beginning of the 21st century, the US issued more than 10 policies and regulations to promote energy conservation and emission reduction, and adopted strict legislation to restrain the high consumption and pollution behavior of the government and enterprises. Now, Japan strongly supports and encourages energy-saving and emission-reduction activities. Through financial allocation, the Japanese government vigorously supports research institutions in developing energy-saving technologies, and subsidizes energy-saving products. Secondly, more attention should be paid to production details and emission links, to encourage the transformation and innovation of production equipment, phase out the backward production mode, and strengthen the emission supervision. Detailed air pollutant treatment standards should be established for each type of emissions to ensure that all production processes should meet these standards. Third, governments should encourage the development and application of clean energy and replace high-pollution energy with clean energy. It is necessary to establish a new energy-saving and emission-reduction innovation system with the government as a leading force, enterprises as driving forces, and research institutions as supporting forces, and then form a virtuous development cycle.
Author Contributions
Conceptualization, S.X. and C.G.; Methodology, S.X.; Software, C.G.; Validation, Y.Z.; Formal Analysis, S.X.; Investigation, Z.H.; Data Curation, B.Z.; Writing-Original Draft Preparation, S.X. and C.G.; Writing-Review & Editing, S.X., X.M. and Y.L.; Visualization, Y.L.; Supervision, S.W.; Funding Acquisition, Z.H.
Funding
This research was funded by the National Natural Science Foundation of China (grant Nos. 71974083 and 71573253), Key Projects of Philosophy and Social Sciences for Universities by Jiangsu Provincial Department of Education (grant No. 2018SJZDI109), China Postdoctoral Science Foundation (grant Nos. 2015T80594 and 2014M551682), Jiangsu Social Science Fund Project (grant No. 18EYB014), and National Key Research and Development Program of the Ministry of Science and Technology of China (No. 2017YFC0213005).
Conflicts of Interest
The authors declare no conflict of interest.
References
- Wiedmann, T.; Lenzen, M. Environ. and social footprints of international trade. Nat. Geosci. 2018, 11, 314–321. [Google Scholar] [CrossRef]
- Xu, S.C.; Gao, C.; Miao, Y.M.; Shen, W.X.; Long, R.Y.; Chen, H.; Zhao, B.; Wang, S.X. Calculation and decomposition of Chin’s embodied air pollutants in Sino-US trade. J. Clean. Prod. 2019, 209, 978–994. [Google Scholar] [CrossRef]
- Aunan, K.; Hansen, M.H.; Liu, Z.H.; Wang, S.X. The hidden hazard of household air pollution in rural China. Environ. Sci. Policy 2019, 93, 27–33. [Google Scholar] [CrossRef]
- Sun, C.W.; Yuan, X.; Yao, X. Social acceptance towards the air pollution in China: Evidence from public’s willingness to pay for smog mitigation. Energy Policy 2016, 92, 313–324. [Google Scholar] [CrossRef]
- Zeng, Y.Y.; Cao, Y.F.; Qiao, X.; Seyler, B.C.; Tang, Y. Air pollution reduction in China: Recent success but great challenge for the future. Sci. Total Environ. 2019, 663, 329–337. [Google Scholar] [CrossRef]
- Sato, M. Embodied carbon in trade: A survey of the empirical literature. J. Econ. Surv. 2014, 28, 831–861. [Google Scholar] [CrossRef]
- Wiedmann, T. Impacts embodied in global trade flows. In Taking Stock of Industrial Ecology; Clift, R., Druckman, A., Eds.; Springer: Berlin/Heidelberg, Germany, 2016; pp. 159–180. [Google Scholar]
- Leontief, W. Environ. repercussions and the economic structure: An Input-output approach. Rev. Econ. Stat. 1970, 52, 262–271. [Google Scholar] [CrossRef]
- Fang, D.L.; Chen, B. Information-based ecological network analysis for embodied carbon network in China. Energy Procedia 2016, 104, 574–579. [Google Scholar] [CrossRef]
- Wang, Z.H.; Yang, Y.T.; Wang, B. Carbon footprints and embodied CO2 transfers among provinces in China. Renew. Sustain. Energy Rev. 2018, 82, 1068–1078. [Google Scholar] [CrossRef]
- Zhao, Y.H.; Tian, Y.; Liu, Y. Input-output analysis of carbon emissions embodied in India’s foreign trade. J. Int. Trade 2014, 10, 77–87. [Google Scholar]
- Seo, S.; Kim, J.; Yum, K.-K.; McGregor, J. Embodied carbon of building products during their supply chains: Case study of aluminium window in Australia. Resour. Conserv. Recycl. 2015, 105, 160–166. [Google Scholar] [CrossRef]
- Duggan, A.R.; McCabe, B.A.; Goggins, J.; Clifford, E. An embodied carbon and embodied energy appraisal of a section of Irish motorway constructed in peatlands. Constr. Build. Mater. 2015, 79, 402–419. [Google Scholar] [CrossRef]
- Andersson, M.; Barkander, J.; Kono, J.; Ostermeyer, Y. Abatement cost of embodied emissions of a residential building in Sweden. Energy Build. 2018, 158, 595–604. [Google Scholar] [CrossRef]
- Deng, G.Y.; Ding, Y.F.; Ren, S.L. The study on the air pollutants embodied in goods for consumption and trade in China-Accounting and structural decomposition analysis. J. Clean. Prod. 2016, 135, 332–341. [Google Scholar] [CrossRef]
- Su, X. China’s Air Pollutant Emission Embodied in International Trade; Tsinghua University: Beijing, China, 2013; pp. 21–36. [Google Scholar]
- Yang, X.; Zhang, W.Z.; Fan, J.; Li, J.M.; Meng, J. The temporal variation of SO2 emissions embodied in Chinese supply chains, 2002–2012. Environ. Pollut. 2018, 241, 172–181. [Google Scholar] [CrossRef]
- Wakeel, M.; Yang, S.Y.; Chen, B.; Hayat, T.; Alsaedi, A.; Ahmad, B. Network perspective of embodied PM2.5-A case study. J. Clean. Prod. 2017, 142, 3322–3331. [Google Scholar] [CrossRef]
- Tukker, A.; Giljum, S.; Wood, R. Recent progress in assessment of resource efficiency and environmental impacts embodied in trade: An introduction to this special issue. J. Ind. Ecol. 2018, 22, 489–501. [Google Scholar] [CrossRef]
- Cadarso, M.Á.; Monsalve, F.; Arce, G. Emissions burden shifting in global value chains-winners and losers under multi-regional versus bilateral accounting. Econ. Syst. Res. 2018, 30, 439–461. [Google Scholar] [CrossRef]
- Dong, Y.L.; Ishikawa, M.; Liu, X.B.; Wang, C. An analysis of the driving forces of CO2 emissions embodied in Japan-China trade. Energy Policy 2010, 38, 6784–6792. [Google Scholar] [CrossRef]
- Liu, X.B.; Ishikawa, M.; Wang, C.; Dong, Y.L.; Liu, W.L. Analyses of CO2 emissions embodied in Japan-China trade. Energy Policy 2010, 38, 1510–1518. [Google Scholar] [CrossRef]
- Wu, R.; Geng, Y.; Dong, H.J.; Fujita, T.; Tian, X. Changes of CO2 emissions embodied in China-Japan trade: Drivers and implications. J. Clean. Prod. 2016, 112, 4151–4158. [Google Scholar] [CrossRef]
- Long, R.Y.; Li, J.Q.; Chen, H.; Zhang, L.L.; Li, Q.W. Embodied carbon dioxide flow in international trade: A comparative analysis based on China and Japan. J. Environ. Manag. 2018, 209, 371–381. [Google Scholar] [CrossRef] [PubMed]
- Yu, Y.; Chen, F.F. Research on carbon emissions embodied in trade between China and South Korea. Atmos. Pollut. Res. 2017, 8, 56–63. [Google Scholar] [CrossRef]
- Jayanthakumaran, K.; Liu, Y. Bi-lateral CO2 emissions embodied in Australia-China trade. Energy Policy 2016, 92, 205–213. [Google Scholar] [CrossRef]
- Du, H.B.; Guo, J.H.; Mao, G.Z.; Smith, A.M.; Wang, X.X.; Wang, Y. CO2 emissions embodied in China-US trade: Input-output analysis based on the emergy/dollar ratio. Energy Policy 2011, 39, 5980–5987. [Google Scholar] [CrossRef]
- Zhao, Y.H.; Wang, S.; Zhang, Z.H.; Liu, Y.; Ahamd, A. Driving factors of carbon emissions embodied in China-US trade: A structural decomposition analysis. J. Clean. Prod. 2016, 131, 678–689. [Google Scholar] [CrossRef]
- Deng, G.Y.; Xu, Y. Accounting and structure decomposition analysis of embodied carbon trade: A global perspective. Energy 2017, 137, 140–151. [Google Scholar] [CrossRef]
- Liu, Y.; Chen, S.Y.; Chen, B.; Yang, W. Analysis of CO2 emissions embodied in China’s bilateral trade: A non-competitive import input-output approach. J. Clean. Prod. 2017, 163, S410–S419. [Google Scholar] [CrossRef]
- Xu, S.C.; Han, H.M.; Zhang, W.W.; Zhang, Q.Q.; Long, R.Y.; Chen, H.; He, Z.X. Analysis of regional contributions to the national carbon intensity in China in different Five-Year Plan periods. J. Clean. Prod. 2017, 145, 209–220. [Google Scholar] [CrossRef]
- Su, B.; Thomson, E. China’s carbon emissions embodied in (normal and processing) exports and their driving forces, 2006–2012. Energy Econ. 2016, 59, 414–422. [Google Scholar] [CrossRef]
- Zhong, Z.Q.; He, L.Y.; Wang, Z. Geographic sources and the structural decomposition of emissions embodied in trade by Chinese megacities: The case of Beijing, Tianjin, Shanghai, and Chongqing. J. Clean. Prod. 2017, 158, 59–72. [Google Scholar] [CrossRef]
- Zhou, D.Q.; Zhou, X.Y.; Xu, Q.; Wu, F.; Wang, Q.W.; Zha, D.L. Regional embodied carbon emissions and their transfer characteristics in China. Struct. Chang. Econ. Dyn. 2018, 46, 180–193. [Google Scholar] [CrossRef]
- Xu, Y.; Dietzenbacher, E. A Structural decomposition analysis of the emissions embodied in trade. Ecol. Econ. 2014, 101, 10–20. [Google Scholar] [CrossRef]
- Pu, Z.N.; Fu, J.S.; Zhang, C.; Shao, J. Structural decomposition analysis of embodied carbon from transition economies. Technol. Forecast. Soc. Chang. 2018, 135, 1–12. [Google Scholar] [CrossRef]
- Liu, Q.L.; Wang, Q. Reexamine SO2 emissions embodied in China’s exports using multiregional input-output analysis. Ecol. Econ. 2015, 113, 39–50. [Google Scholar] [CrossRef]
- Lin, B.Q.; Xu, M.M. Does China become the “pollution heaven” in South-South trade? Evidence from Sino-Russian trade. Sci. Total Environ. 2019, 666, 964–974. [Google Scholar] [CrossRef] [PubMed]
- Wang, H.; Ang, B.W.; Su, B. Assessing drivers of economy-wide energy use and emissions: IDA versus SDA. Energy Policy 2017, 107, 585–599. [Google Scholar] [CrossRef]
- Dietzenbacher, E.; Los, B. Structural Decomposition Techniques: Sense and Sensitivity. Econ. Syst. Res. 1998, 10, 307–324. [Google Scholar] [CrossRef]
- Zhao, B.; Wang, S.X.; Dong, X.Y.; Wang, J.D.; Duan, L.; Fu, X.; Hao, J.M.; Fu, J. Environ. effects of the recent emission changes in China: Implications for particulate matter pollution and soil acidification. Environ. Res. Lett. 2013, 8, 024031. [Google Scholar] [CrossRef]
- Zhao, B.; Wang, S.X.; Liu, H.; Xu, J.Y.; Fu, K.; Klimont, Z.; Hao, J.M.; He, K.B.; Cofala, J.; Amann, M. NOx emissions in China: Historical trends and future perspectives. Atmos. Chem. Phys. 2013, 13, 9869–9897. [Google Scholar] [CrossRef]
- Zhao, B.; Wang, S.X.; Wang, J.D.; Fu, J.S.; Liu, T.H.; Xu, J.Y.; Fu, X.; Hao, J.M. Impact of national NOx and SO2 control policies on particulate matter pollution in China. Atmos. Environ. 2013, 77, 453–463. [Google Scholar] [CrossRef]
- Tao, F.; Xu, Z.; Duncan, A.A.; Xia, X.H.; Wu, X.F.; Li, J.Y. Driving forces of energy embodied in China-EU manufacturing trade from 1995 to 2011. Resour. Conserv. Recycl. 2018, 136, 324–334. [Google Scholar] [CrossRef]
- Yu, S.W.; Wei, Y.M.; Guo, H.X.; Ding, L.P. Carbon emission coefficient measurement of the coal-to-power energy chain in China. Appl. Energy 2014, 114, 290–300. [Google Scholar] [CrossRef]
- Xu, S.C.; Miao, Y.M.; Gao, C.; Long, R.Y.; Chen, H.; Zhao, B.; Wang, S.X. Regional differences in impacts of economic growth and urbanization on air pollutants in China based on provincial panel estimation. J. Clean. Prod. 2019, 208, 340–352. [Google Scholar] [CrossRef]
- Xu, S.C.; Zhang, W.W.; Li, Q.B.; Zhao, B.; Wang, S.X.; Long, R.Y. Decomposition analysis of the factors that influence energy related air pollutant emission changes in China using the SDA method. Sustainability 2017, 9, 1742. [Google Scholar] [CrossRef]
- Barkhordari, S.; Fattahi, M. Reform of energy prices, energy intensity and technology: A case study of Iran (ARDL approach). Energy Strategy Rev. 2017, 18, 18–23. [Google Scholar] [CrossRef]
- Yang, R.R.; Long, R.Y.; Yue, T.; Shi, H.H. Calculation of embodied energy in Sino-USA trade: 1997–2011. Energy Policy 2014, 72, 110–119. [Google Scholar] [CrossRef]


© 2019 by the authors. Licensee MDPI, Basel, Switzerland. This article is an open access article distributed under the terms and conditions of the Creative Commons Attribution (CC BY) license (http://creativecommons.org/licenses/by/4.0/).