Article

Text Mining for Patent Analysis to Forecast Emerging Technologies in Wireless Power Transfer

1
Department of Industrial Management Engineering, Korea University, 145 Anam-ro, Seongbuk, Seoul 02841, Korea
2
Railroad Type Approval Team, Korea Railroad Research Institute, 176 Cheoldobangmulgwan-ro, Uiwang, Gyeonggi 16105, Korea
3
Propulsion System Research Team, Korea Railroad Research Institute, 176 Cheoldobangmulgwan-ro, Uiwang, Gyeonggi 16105, Korea
*
Author to whom correspondence should be addressed.
Sustainability 2019, 11(22), 6240; https://doi.org/10.3390/su11226240
Submission received: 11 October 2019 / Revised: 3 November 2019 / Accepted: 4 November 2019 / Published: 7 November 2019
(This article belongs to the Special Issue Technologies and Innovations for Sustainable Growth)

Abstract

:
Governments around the world are planning to ban sales of vehicles running on petroleum-based fuels as an effort to reduce greenhouse gas emissions, and electric vehicles surfaced as a solution to decrease pollutants produced by the transportation sector. As a result, wireless power transfer technology has recently gained much attention as a convenient and practical method for charging electric vehicles. In this paper, patent analysis is conducted to identify emerging and vacant technology areas of wireless power transfer. Topics are first extracted from patents by text mining, and the topics with similar semantics are grouped together to form clusters. Then, the process of identifying emerging and vacant technology areas is improved by applying a time series analysis and innovation cycle of technology to the clustering result. Lastly, the results of clustering, time series, and innovation cycle are compared to minimize the possibility of misidentifying emerging and vacant technology areas, thus improving the accuracy of the identification process and the validity of the identified technology areas. The analysis results revealed that one emerging technology area and two vacant technology areas exist in wireless power transfer. The emerging technology area identified is circuitries consisting of transmitter coils and receiver coils for wireless power transfer, and the two vacant technology areas identified are wireless charging methods based on resonant inductive coupling and wireless power transfer condition monitoring methods or devices.

1. Introduction

Current transportation modes produce many pollutants, which have a hazardous effect on the environment and human health. According to the United States Environmental Protection Agency (EPA), about 29% of greenhouse gas emissions in 2017 were produced by transportation, which mostly uses petroleum-based fuels such as gasoline and diesel [1]. Petroleum-based fuels produce various greenhouse gases including nitrogen oxides (NOx) and sulfur oxides (SOx), which create smog and accelerate global warming that affects human lives significantly.
Governments around the world are taking measures to decrease pollutants produced by the transportation sector. In 2014, the mayor of Paris, France announced that vehicles consuming diesel will be banned from the city by 2020 as part of a plan to fight pollution [2]. Politicians in the Netherlands took measures a step further by voting for a motion that bans sales of new cars running on petroleum-based fuels starting in 2025 [3]. China, the world’s largest vehicle market, is also considering a ban on production and sales of fossil fuel cars to reduce harmful emissions [4]. Vehicle manufacturers, to follow and meet the environment-friendly trends and regulations, started to research and produce electric vehicles.
An electric vehicle (EV), unlike a fossil fuel car, emits no waste products that pollute the environment and thus is referred to as a zero-emissions vehicle (ZEV), which has become a popular choice for transportation. EVs, however, are currently bound to limitations. First of all, people are psychologically worried about the driving-range of EVs. Although most people drive less than 100 kilometers per day on average, majority of people are only willing to purchase EVs with driving-range of 320 kilometers or longer [5,6]. A survey also revealed that 29% of Norwegian EV users wanted more driving-range [7]. In addition, performance of EVs depends largely on the weather and topography of a location, and in extreme cases, driving-range of EVs can be cut nearly in half [8]. Comparably short driving-range of EVs poses a problem, and limited availability of charging stations brings additional problems for EVs.
Nevertheless, the problems caused by a short driving-range and limited availability of charging stations can be solved with wireless power transfer (WPT) technology. WPT, which is also known as wireless charging, transfers power or electricity in a non-contact manner, and the technology allows EVs to charge batteries while in motion by continuously sending electricity from power transmitters installed underground. Since the power is constantly picked up from WPT, EVs not only can be freed from a short driving-range and limited availability of charging stations but also can be fitted with smaller and lighter batteries for improved efficiency [9,10]. Thus, wireless charging technology is considered as a unique and optimal solution for EVs, and the technology has recently been introduced to EVs for the first time to enhance ease of use and everyday practicality of EVs [11,12,13]. Also, Renault and Qualcomm Technologies recently tested two electric vehicles equipped with the dynamic wireless charging technology, which is capable of charging a moving vehicle by delivering 20 kilowatts of electricity at speeds up to 100 kilometers per hour [14].
Technology development, however, is characterized by irregular growth of constituent sub-technology elements, and due to such unevenness, the evolution of technology can be hampered by the element with the lowest level of development or performance, which is known as the reverse salient [15,16]. Historically, many technology developments were inhibited at first due to insufficiently developed elements. For example, underperforming motors and capacitors prevented efficient distribution of electricity for direct current electric system, primitive gyroscopes limited the accuracy of ballistic missiles, and computer-integrated manufacturing faced many restrictions due to underdeveloped methods used to transfer digital data between different processes [17,18,19]. Although the mentioned elements are now all developed well and are forming large markets, the elements were emerging or vacant technologies in the beginning. Novelty and growth characterize emerging and vacant technologies, which are defined as relatively fast-growing novel technologies that persist over time and have potential to impact society within 10 to 15 years [20,21,22]. Emerging and vacant technologies are also viewed as scientific inventions or innovations, which are the results of research and development, that have potential to create or transform industries but are not fully exploiting economic potential yet [23,24]. Since scientific inventions and innovations are well reflected in patents, and since patenting activities such as the number of patents filed show potential growth and novelty of technologies, emerging and vacant technologies can be identified through patent analysis [25,26,27].
Wireless power transfer technology is speculated to dominate the electric charging market by 2028 and is expected to stay highly competitive until 2039 [28]. According to market research, wireless charging technology is viewed as a promising market that is expected to show the maximum compound annual growth rate (CAGR) of 41.5% between 2018 and 2025, and the high growth rate is mainly expected to be driven by electric vehicles [29]. Despite the importance of WPT technology, no previous research identified reverse salient in WPT. Therefore, to spot new technological opportunities and produce meaningful insights regarding WPT technology, this research conducts patent analysis and identifies emerging and vacant technologies by employing text mining and clustering. Also, by applying time series analysis and innovation cycle of technology, this paper improved the method for identifying emerging and vacant technologies. The rest of the paper is organized as follows. In Section 2, literature about patent analysis is reviewed. The research methodology is outlined and explained in Section 3, patent analysis results are provided in Section 4, and the results are interpreted and discussed in Section 5. Lastly, Section 6 summarizes and concludes the paper.

2. Literature Review

World Intellectual Property Organization (WIPO) defines a patent as an exclusive right granted for an invention, which is a product or a process that either provides a new way of doing something or offers a new technical solution to a problem [25]. Information contained in patent documents is unique, thus making patents an excellent tool for analyzing technological development and discovering technological opportunities [30]. In fact, patent documents are widely analyzed to capture and forecast technological opportunities since the documents contain diverse and complete information on technologies that have been researched and developed [31]. Patent analysis, however, provides insights only when accurate results are delivered in a comprehensible form [32].
According to Tseng et al. (2007), a typical patent analysis consists of seven processes, which are task identification, searching, segmentation, abstracting, clustering, visualization, and interpretation. Each process, however, requires a certain level of expertise, and the whole analysis process is time consuming even for experts [33]. In addition, due to the rapid growth of patent documents, relying solely on the knowledge and skill of experts is no longer suitable for analyzing patents, making text mining techniques a vital tool for patent analysis [34]. Currently, researchers are developing many text mining methods that extract keywords to assist patent analysis from various aspects including trend analysis, technology forecasting, strategic technology planning, infringement analysis, and novelty detection [35]. Joung and Kim (2017) took a step further to propose a method that automatically selects keywords from contexts, and Noh et al. (2015) found that extracting keywords from an abstract of a patent with term frequency-inverse document frequency (TF-IDF) is the best method for a patent analysis [26,36]. Traditional keyword-based patent analysis, however, cannot capture correlation among different patents. To capture the correlation between patents, Choi and Hwang (2014) utilized both keyword-based analysis and network-based analysis to identify patent keyword network characteristics and associate technology elements [37]. The strategies used to select keywords are important since keyword extraction and selection methods affect analysis results, and the advancements made in text mining diversified the scope of patent analysis, allowing wider discovery of technological opportunities.
Researchers analyze patents from various aspects to discover technological opportunities, and the most popular form of patent analysis is technology forecasting because the analysis reveals relationships among different technologies, providing firms diverse technological opportunities and valuable decision-making insights. Technology forecasting includes emerging and vacant technology forecasting, which is a type of technology forecasting used to find undeveloped technology areas that have the potential to emerge as new markets. Many studies conducted technology forecasting in the manufacturing sector, which is the sector that is more appropriate for technology forecasting compared to the service sector [27,38,39,40,41,42]. Firms in some technology fields, however, prefer hiding trade secrets rather than applying and registering patents [38]. Therefore, technologies must be selected carefully for patent analysis.
Researchers also approached technology forecasting from many aspects by applying and combining various analysis methods. Altuntas et al. (2015) proposed a method for technology forecasting based on patent documents, and the authors’ utilized technology life cycle, diffusion speed, patent power, and expansion potential for the analysis [43]. Levitas et al. (2006) also utilized technology cycle time along with patent age since older patents are more likely to have higher citations, and the authors researched emergence of new technologies and survival of old technologies by conducting survival analysis on every US patent issued to integrated circuit manufacturers [44]. Altuntas et al. (2015) proposed weighted association rules to determine the interdependencies among technologies by capturing commercial significance and technological impact of patents and technology classes [45]. However, the result has limited implications since the study only utilized International Patent Classification (IPC) codes for the analysis. Lee et al. (2018) applied a feed-forward multilayer neural network to identify emerging technologies at an early stage. Patent indicators are extracted from the United States Patent and Trademark Office (USPTO) database to develop quantitative indicators, which are used to forecast emerging technologies [46]. Cho et al. (2018) used the most relevant core data to increase accuracy of vacant technology prediction and performed object-solution matrix analysis, and Song et al. (2017) extracted and applied technical attributes to obtain new technology ideas based on F-term, which is a Japanese patent classification system enabling the efficient search of patent documents [47,48,49]. Kyebambe et al. (2017) applied supervised learning to patent analysis and forecasted emerging technologies to enable firms to discover investment opportunities, and Niemann et al. (2017) used semantic similarities to develop patent lanes, which are the deployments of patent clusters over a course of time [50,51]. Patent lanes, however, are not suitable for distinguishing different terms with the same concept and thus are prone to bias.
Some researchers visualized patents to forecast vacant technologies. Jun et al. (2012), based on patent documents, used matrix map and k-medoids clustering for vacant technology forecasting. Through the proposed method, the authors first extracted the top five keywords to define clusters and then identified vacant technology areas from the constructed matrix map [52]. However, a rather subjective approach was accompanied when selecting vacant technology areas from the matrix map. Lee et al. (2009) used text mining to extract keyword vectors from patent documents and applied principal component analysis to select the keyword vectors to construct a patent map. The researchers, from the patent map, identified blank areas or technology vacancies, which are tested against a few criteria for verification [53]. Yoon and Magee (2018), by focusing on the detailed directions of technology development, also identified vacant spaces by applying generative topology mapping (GTM) to patents visualized in a two-dimensional space [54]. The proposed method, however, only shows good prediction performance for technologies that have stable patterns. Yoon et al. (2019) improved the GTM approach by incorporating the local outlier factor to identify vacant technologies, which are clustered into underdeveloped, undeveloped, and undiscovered technologies by the authors [55]. However, identifying vacant technologies solely based on clusters or maps poses a danger of misidentification since the time-varying aspect of keywords is not considered.
Many studies focused on the clustering of patents to yield better emerging and vacant technology forecasting [26,56,57,58]. Kim et al. (2015) used k-means clustering method to classify unstructured patent data into similar technology groups, and the optimal number of clusters is determined and evaluated with silhouette width, Davies-Bouldin Index, and Pseudo F. The authors employed latent Dirichlet allocation (LDA), a generative probabilistic model for collections of discrete data, to extract topics from technology clusters [59]. Jun et al. (2012) extracted IPC codes from patents and applied association rule mining (ARM) to create clusters of patents, which are used as a basis of identifying vacant technologies [39]. The research, however, has limitations since ARM is the sole analysis method used to find the vacant technologies. To create better patent clusters, Choi and Jun (2014) proposed a vacant technology forecasting method that combines ensemble methods and Bayesian learning, and the authors extracted vacant technologies from the patent clusters formed [60]. The authors, however, only used the top-ranked keywords to create patent clusters, limiting the scope of clusters by not including other important keywords. Trappey et al. (2011) combined patent content clustering and technology life cycle forecasting, which are used to cluster patents into homogenous groups and evaluate market opportunities respectively [40]. However, the result may not be applicable to other countries since only patents from China National Intellectual Property Administration (CNIPA), which was formerly known as State Intellectual Property Office (SIPO), are used.
Emerging and vacant technology forecasting became prominent since the recent proliferation of new technologies forced firms to identify vacant technology areas to acquire new markets [55]. Also, documents with emerging technological ideas tend to show greater scientific impact compared to documents that do not contain novel ideas, thus making identification of emerging and vacant technologies even more important [61]. Table 1 provides a summary of emerging and vacant technology forecasting researches reviewed in this paper. The table reveals some notable characteristics regarding the researches. For the analysis method, many studies employed clustering techniques since clustering keywords with similar contexts helps to pinpoint undeveloped or underdeveloped technologies from well-developed technologies. At the same time, however, many studies selected emerging and vacant technology areas solely based on vacancies present in clusters or maps, exposing the selection process to the danger of misidentification. The majority of studies acquired data from the USPTO database since patents from all over the world are filed and registered to the USPTO, making the database a comprehensive and ideal source of patents. Lastly, although many different technology fields are chosen for the analysis, most of the fields selected are relatively new technologies such as fuel cell, biosensor, renewable energy, 3D printing, and nuclear fusion.
Therefore, wireless power transfer, the technology selected for patent analysis in this paper, is ideal for emerging and vacant technology forecasting, and text mining techniques and clustering algorithms are employed for the analysis. In addition, this paper contributes to the improvement of the identification process of emerging and vacant technology areas by applying time series analysis and innovation cycle of technology, thus minimizing the danger of misidentification and increasing the validity of the identified technology areas.

3. Methodology

3.1. Research Framework

Patent analysis in this paper is largely divided into three parts. In the first part, general patenting activities in WPT technology are captured to identify trends and characteristics of the technology by analyzing bibliographic data such as filing dates and applicants. In the second part, key topics of WPT technology are extracted and clustered to select potential candidates for vacant technology areas by employing text mining techniques and clustering algorithms. Lastly, emerging and vacant technology areas of WPT technology are identified by the time series analysis and innovation cycle of technology. Figure 1 shows the research framework of this paper.

3.2. Data Collection

The USPTO, of all patent offices in the world, represents the largest volume of data since patents from all over the globe are filed to the USPTO to the extent that excluding patents from the United States (US) will result in a dramatic decrease in the degree of concentration of patent data [63,64]. Accordingly, the US is considered to be the main market for securing patents and technologies for a new innovation [65]. Patents registered in the US are cited and referenced far more than patents registered in Europe, making the patents from the USPTO to possess more valuable and reliable data for patent analysis [66]. In addition, patents from the USPTO have one of the lowest home biases as more than half of the patents issued in the US go to non-US entities [65,67]. Therefore, to gather as many relevant patents as possible while minimizing biases, patents from the USPTO database are used in this paper.

3.3. Preprocessing

Textual data may contain punctuations, misspelled words, and abbreviations, which must be removed, corrected, and expanded before an analysis [68]. A patent, which is a field-specific legal document that contains a lot of jargon and abbreviations, is not free from such problems either. Therefore, preprocessing, which cleans and filters text for classification, is a necessary step for patent analysis, and procedures such as text cleaning, abbreviation expansion, and stop word removal are often applied to convert data into a more effective and suitable form for the analysis [69,70].
Texts are first cleaned through tokenization, a process that converts text streams into processing units known as tokens, which are character strings (e.g., sentences, phrases, and words) without delimiters such as commas, colons, and spaces [71,72]. During the tokenization, uppercase letters are also converted to lowercase letters. Tokens are then filtered using stop words, which are common but unnecessary words (e.g., articles, conjunctions, and prepositions) for the patent analysis. Lastly, all prefixes and suffixes are removed. The refined textual data obtained by preprocessing now only contains words that are essential for describing patent documents, and the words are constructed into a term-document matrix for the analysis.

3.4. Topic Extraction

3.4.1. TF-IDF

Term frequency (TF) assumes that a term with higher value or weight appears more frequently in a document, meaning that high-frequency terms are essential for describing contents of a document [73]. However, TF alone does not perform well in some cases. For example, the values or weights of high-frequency terms are not helpful if the high-frequency terms are evenly distributed or sparsely present across documents [74]. TF-IDF, which weighs terms proportional to the term frequency and inversely proportional to the document frequency, is an improved version of TF.
TF-IDF, an empirical method used for information retrieval, is a popular term weighing scheme, and the idea of the scheme is based on a language modeling theory that classifies terms in a document into elite words and non-elite words [75,76]. By definition, TF-IDF (Equation 1) increases the weight of a term that frequently appears in a document (Equation 2) and decreases the weight of a term that frequently appears across documents (Equation 3) while assigning zero weights to terms that do not appear in a document [77]. Term weights represent attribute values of documents, and the values are regarded as indivisible objects [78]. In general, TF-IDF performs better with a larger number of dimensions and shows better statistical quality compared to other information retrieval methods, and the effectiveness of TF-IDF has been justified by many information retrieval related researches [75,79]. In order to extract topics from patent documents, this paper applies TF-IDF to assign weights to words in the term-document matrix before employing LDA.
TF IDF ( t ) = TF ( t ) × IDF ( t )
TF ( t ) = number   of   times   term   t   appears   in   a   document total   number   of   words   in   the   document
IDF ( t ) = log ( total   number   of   documents number   of   documents   containing   term   t )

3.4.2. LDA

LSA, a topic modeling method that extracts and represents the contextual meaning of words from a large corpus of text, is a technique used to analyze relationships among a set of documents by applying statistical computations to produce a set of concepts that are related to the original documents [80,81]. LSA, based on linear algebra and singular value decomposition (SVD), considers the overall distribution of words from contexts to determine similarity of word meanings based on the word aggregates [82,83]. Compared to other topic modeling methods, LSA is less likely to suffer from synonymy problem [84]. However, LSA is not able to handle polysemy [82].
Probabilistic latent semantic analysis (PLSA) is based on an aspect model, which is a latent variable model that associates unobserved variables with each observation [85]. PLSA has a solid statistical foundation and properly defines the generative data model, thus yielding better analysis results compared to LSA [82,85]. Although PLSA provides probabilistic model for texts, the method, however, is unable to provide probabilistic model for documents [86].
LDA, the most advanced form of LSA, is a generative probabilistic model based on a three-level hierarchical Bayesian model, and while LSA, PLSA, and LDA all assume exchangeability, meaning that the methods neglect the order of words in a document, LDA is based on the idea that documents are composed of random mixtures of latent topics, which can be characterized by distribution of words [86]. In other words, LDA employs parameters to calculate the joint distribution of a topic mixture and obtain the probability of a corpus or topic.

3.5. Clustering

The topics extracted by applying TF-IDF and LDA need to be clustered to identify potential vacant technology areas. Clustering finds a structure from a collection of unlabeled data, and objects within a cluster share similar characteristics [87]. Two of the most commonly used clustering algorithms, k-means clustering, and k-medoids clustering, are unsupervised clustering methods that aim to minimize the sum of squared errors based on the Euclidean distance (Equation 4) [88,89]. K-means clustering is a non-hierarchical clustering method that assigns all objects to the nearest centroid, which is the mean of the coordinates of the objects, and while k-medoids clustering is similar in concept to k-means clustering, k-medoids assigns all objects to the nearest medoid, which is the object that is the closest to the centroid [90].
Both k-means and k-medoids are partitioning algorithms, meaning that the number of clusters is initially specified [87]. However, the clusters formed by k-medoids are generally more robust and less prone to outliers compared to the clusters formed by k-means [87,89,90]. In addition, k-means can be very sensitive to the initial centroids selected [91]. Sensitivity, however, can be mitigated by running the algorithm multiple times, and in some cases, the k-means algorithm yields better results compared to k-medoids algorithm [91,92]. Specifically, k-medoids performs better with larger data sets, and k-means performs more efficiently with smaller data sets [87]. Therefore, clustering methods should be chosen based on the type of data and the purpose of analysis [91].
arg   min j = 1 k i = 1 n x i ( j ) c j 2 k   =   number   of   clusters n   =   number   of   objects x i   =   object   i c j   =   centroid   of   cluster   j

3.6. Time Series Analysis

Time series analysis, which is particularly useful for analyzing obscure data, is used to forecast future trends by developing mathematical models that describe the underlying relationship of the historical observations [93]. A time-series usually includes count data that has a record of the number of events occurring in a given time frame [94]. Exponential smoothing, a univariate time series analysis method, is widely used to make forecasts since the method is relatively simple to formulate, and the method assumes that a time series is built from unobserved components (e.g., adaptive levels, growth rates, and seasonal effects), which adapt to structural changes in markets over time [95,96,97]. Exponential smoothing utilizes a smoothing coefficient, which ranges between 0 and 1. Smoothing coefficient values close to 1 result in a subtle smoothing effect, and the values close to a 0 result in a greater smoothing effect since fewer weights are given to recent data.
Exponential smoothing is advantageous compared to other time series analysis models since the method can be applied to a broad range of data for forecasting [98]. In fact, exponential smoothing is a very accurate short-term forecasting method that outperforms many other more sophisticated models [96,99]. Therefore, exponential smoothing is applied to the clustering result in this paper since analyzing the time-varying aspect of patenting activity in each cluster is useful in identifying emerging and vacant technology areas in WPT.

3.7. Innovation Cycle of Technology

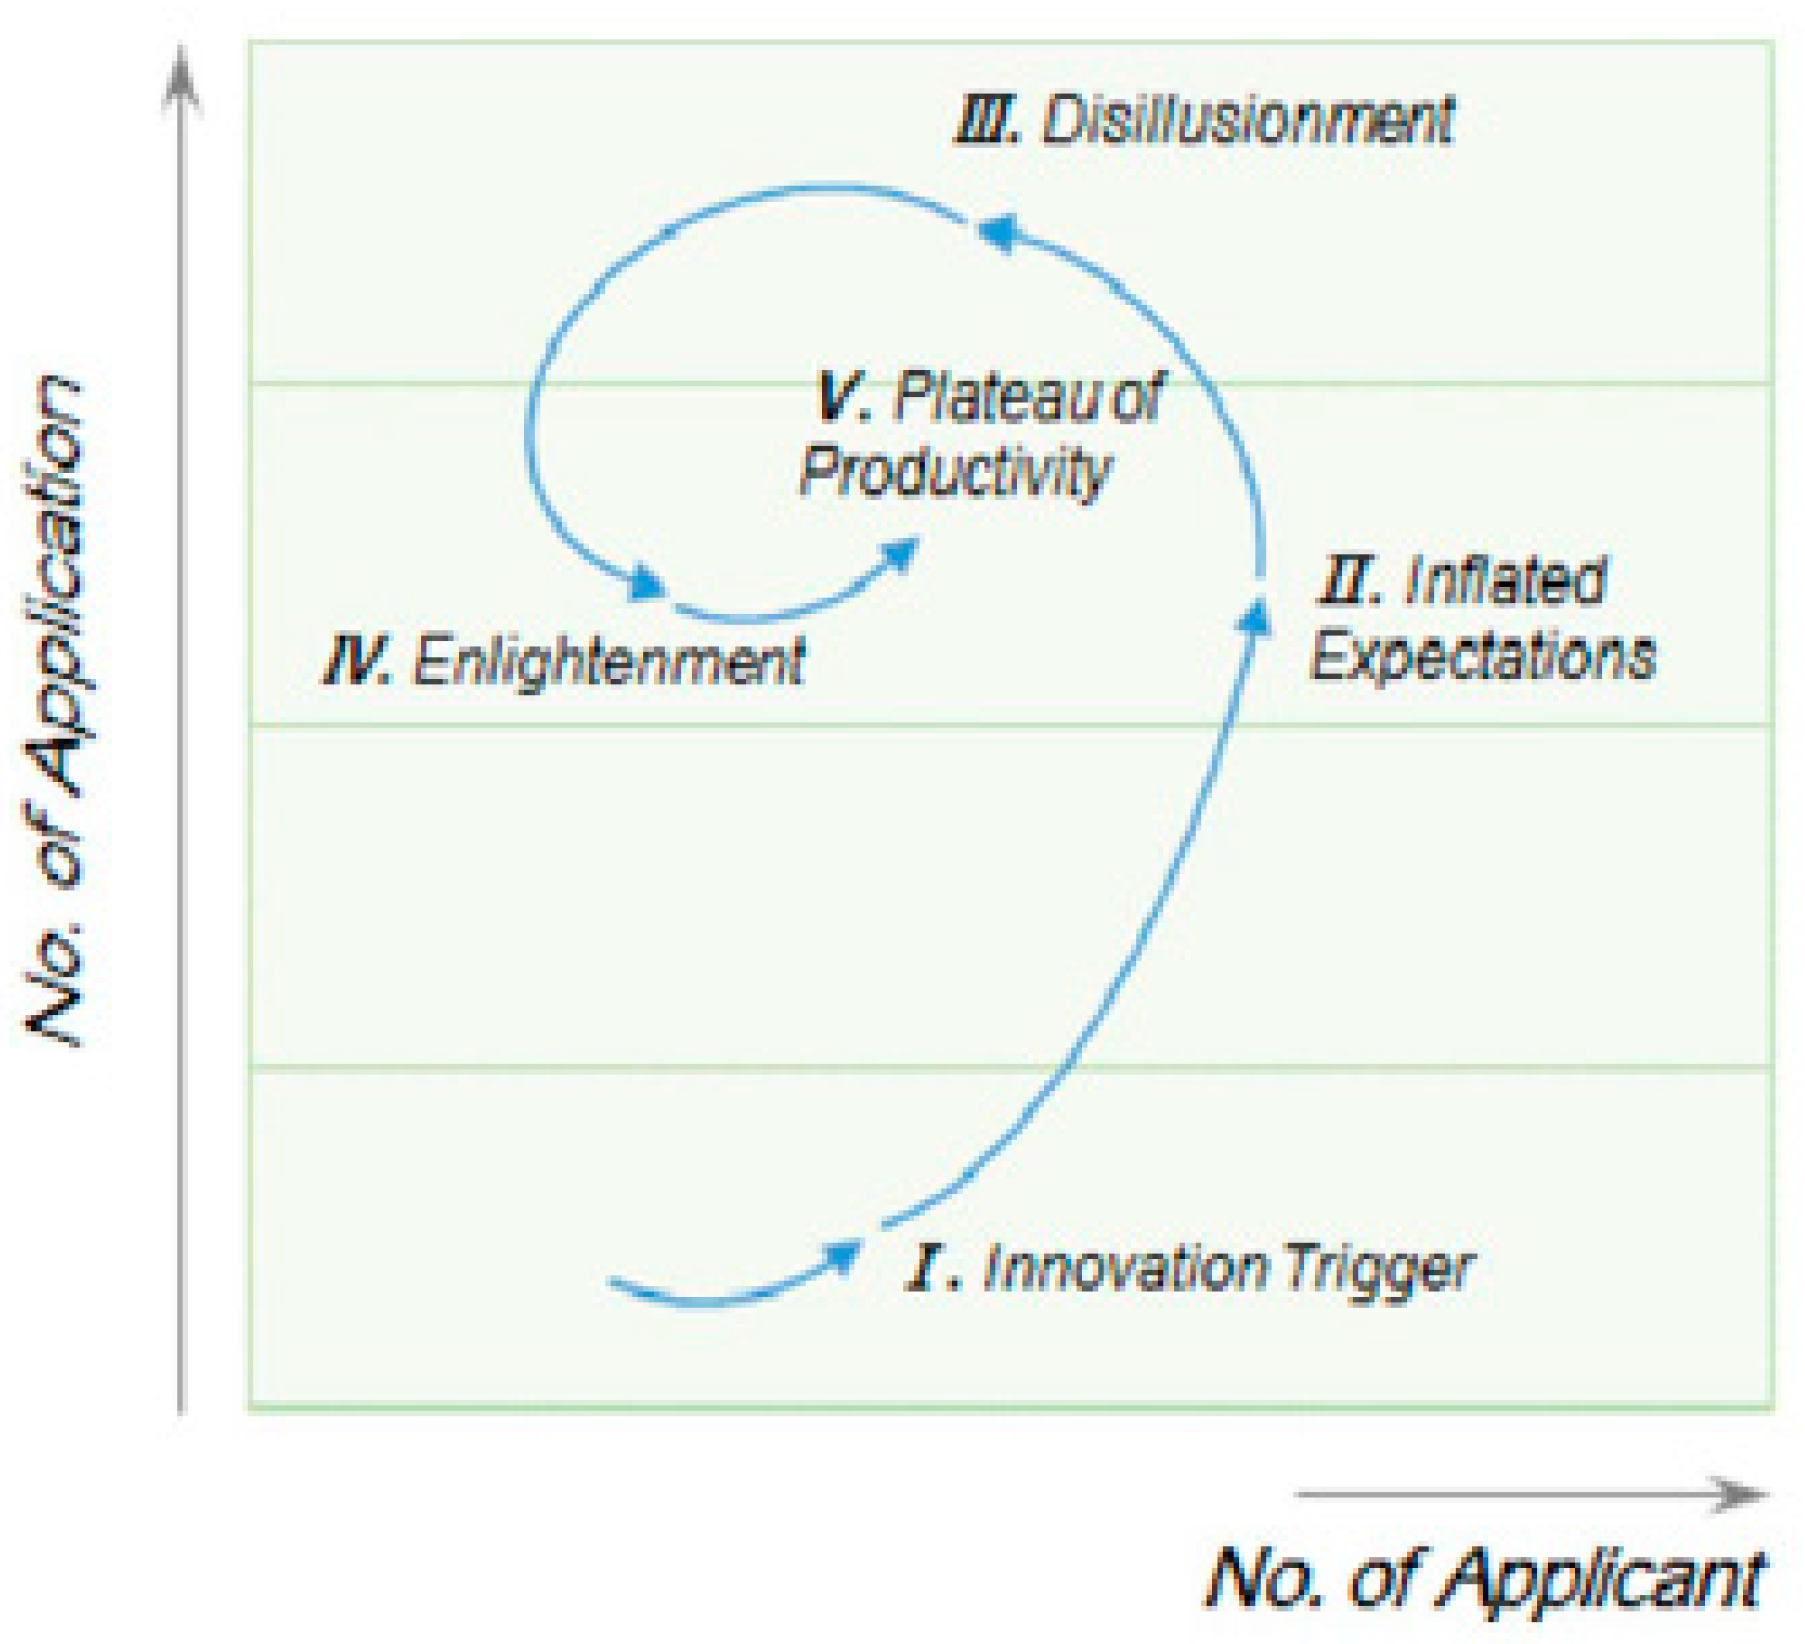
Patent portfolio analysis is used to assess technologies and obtain important information about the technologies [100]. For example, the analysis is used to reveal and define technology growth level and maturity since the characteristics of each stage of innovation cycle can be differentiated [47,101]. The innovation cycle of technology, a portfolio analysis technique, classifies technology development into five levels (Figure 2).
Innovations are triggered in Level 1, which is an initial phase of new technologies. The phase is characterized by a gradual increase in patent applications at a small volume, and technologies in Level 1 are conceived as vacant technologies. Level 2 is a development phase, and new technologies are met with inflated expectations. The number of patents filed and the number of patent applicants both increases rapidly, and technologies in Level 2 are viewed as emerging technologies. Level 3 contains mature technologies. Although the number of patents filed still increases in Level 3, the rate of increase is much slower compared to Level 2. In Level 4, both the number of patents and the number of applicants start to decrease, and market size of the technologies in Level 4 starts to shrink as well. In Level 5, the last level, the market size is gradually restored as new innovations emerge from the technologies developed up until Level 4.
Compared to other data, patents are considered as a preferred source for locating the development phase of a technology, allowing an observer to pinpoint the phase of a technology based on the shape of a graph, which indicates distinctive characteristics of each phase [103,104]. Since determining the development phase of a technology area is useful in identifying emerging and vacant technology areas due to the characteristics of emerging and vacant technologies (radical novelty, fast growth, coherence, prominent impact, and uncertainty), innovation cycle of technology is utilized in this paper [21].

4. Analysis Results

4.1. Filing Trends of Patents in WPT Technology

Patents regarding wireless power transfer technology are retrieved from the USPTO database for the analysis. A total of 3608 patents are collected, and the removal of irrelevant patents reduced the number to 1416. A few patents are provided in Table 2 as samples.
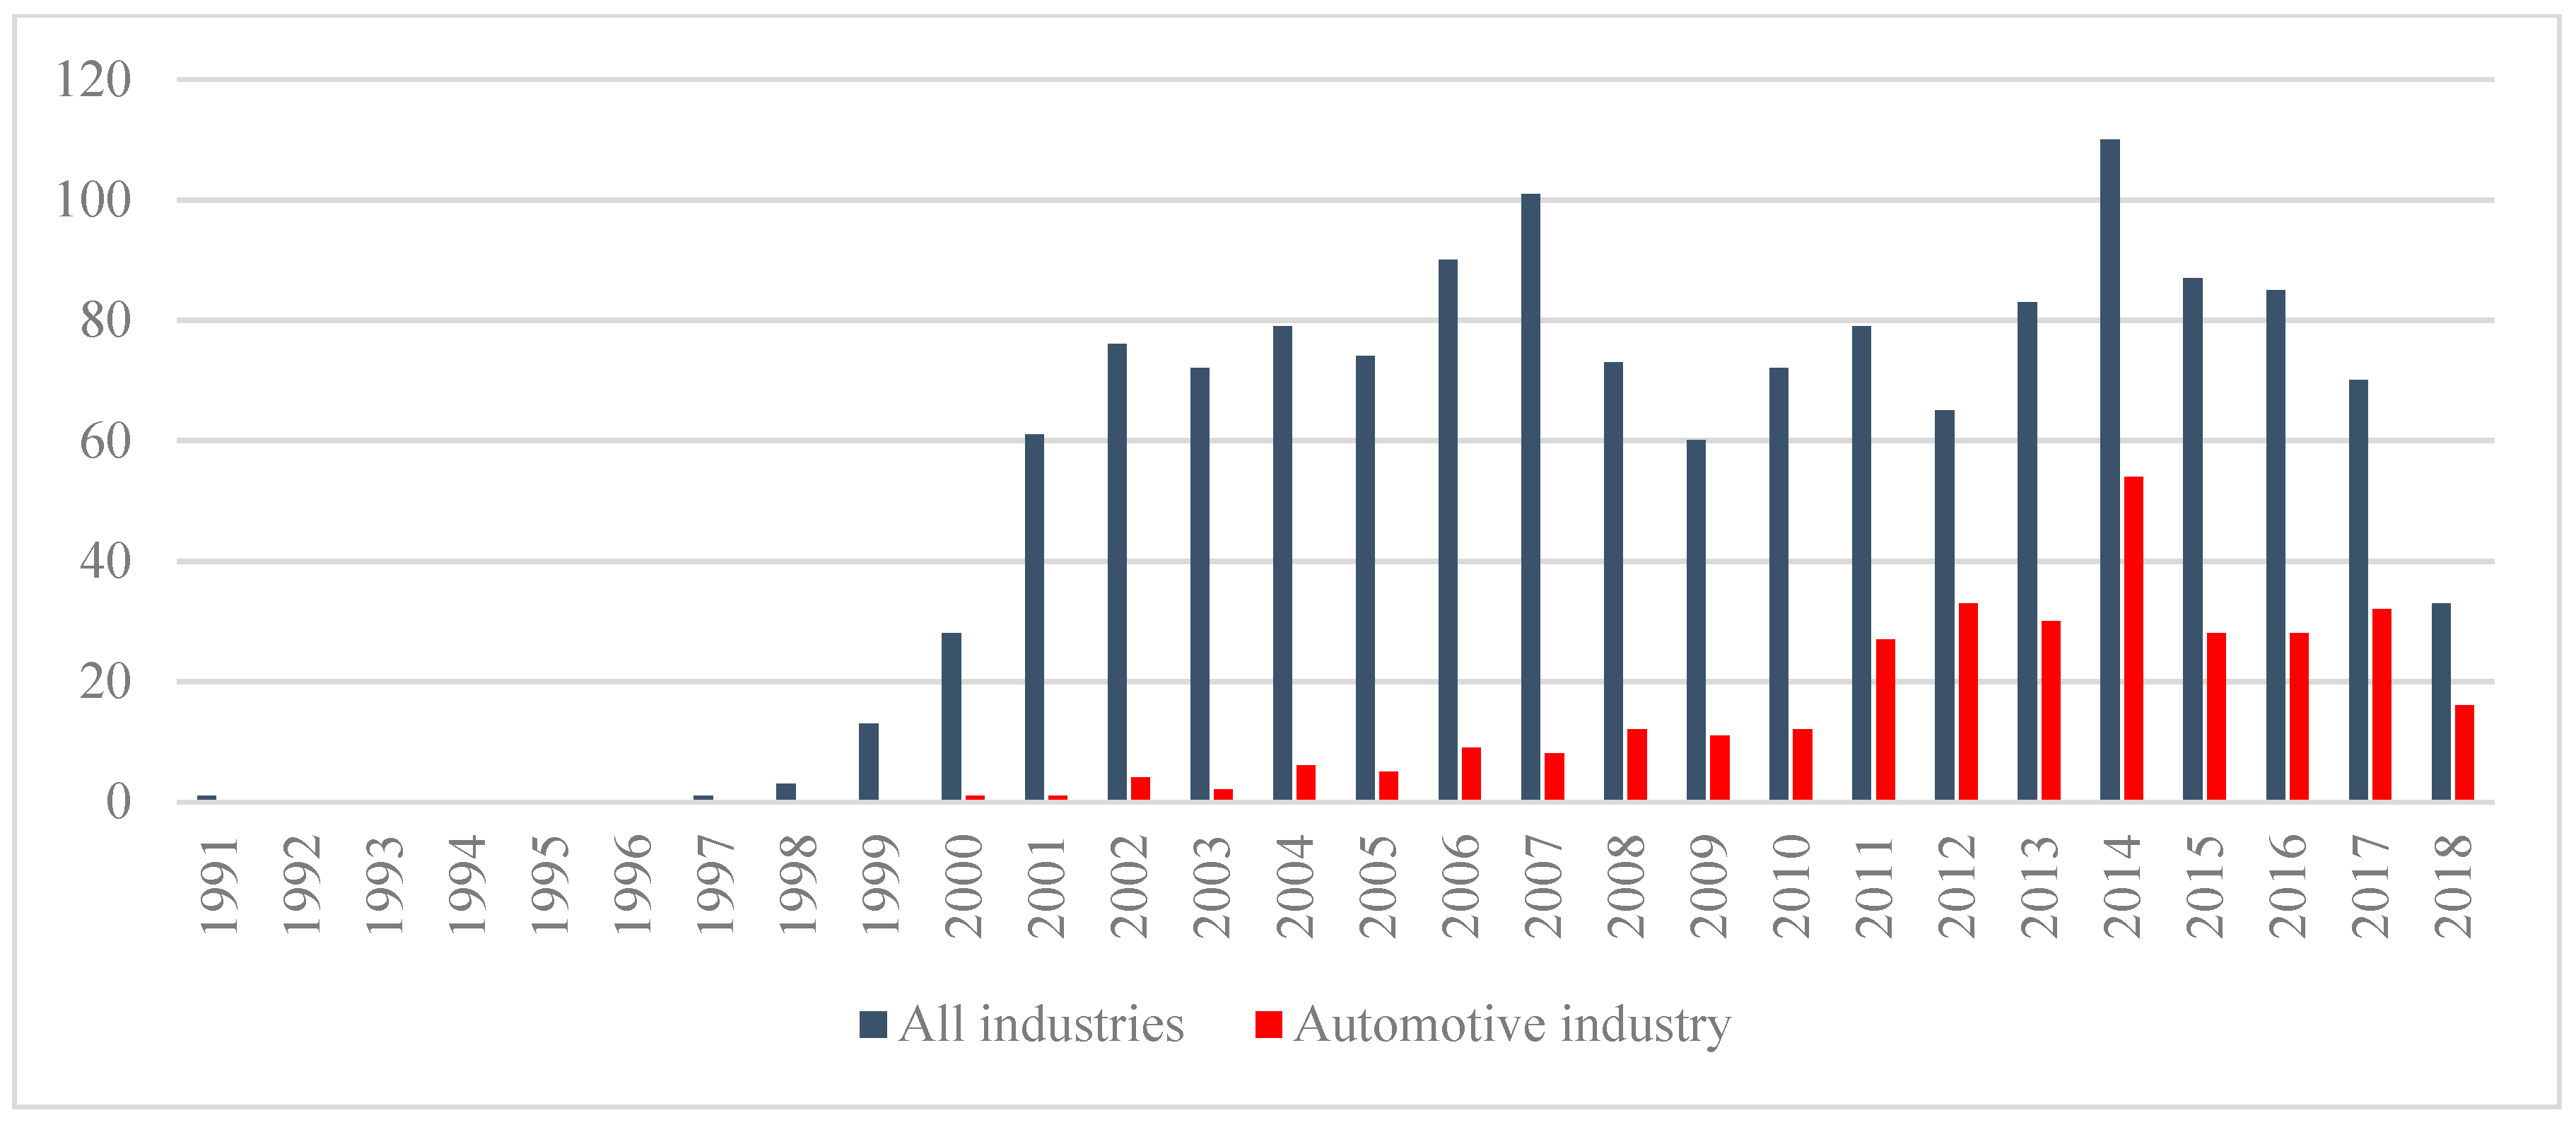
Figure 3 shows the number of WPT technology patents filed from 1991 to 2018. The number of patents filed in 2017 and 2018 may seem small compared to the number of patents filed in prior years, but the decrease in the number is not an accurate representation of actual number of patents filed since the USPTO grants up to 18 months of confidential status to patents upon receiving requests from applicants [105]. Thus, some of the WPT technology patents filed in 2017 and 2018 are not reflected yet.
Not many WPT technology patents were filed prior to 1999. The patents, however, have been actively filed from all industries since 2001 although the patenting activity slowed down slightly after 2007, the year the global financial crisis started. Interestingly, the composition of patent applicants changed drastically after the global financial crisis as the number of patents filed from the automotive industry increased greatly after 2010, which can be explained by the fact that consumers began to seek EVs due to the expensive gas prices [106]. In fact, the automotive industry is responsible for 408 patents out of 1,416 patents filed, thus becoming the industry filing the greatest number of patents in WPT technology followed by the electronics industry with 217 patents and the information and communications technology (ICT) industry with 151 patents. Other transportation-related industries such as aircraft and locomotive only filed 11 and 6 patents respectively.
Table 3 shows the ten most active applicants filing patents in WPT technology from 1991 to 2018. The companies in the table are responsible for about 30% of the entire patents filed in WPT technology, and TMC and Qualcomm are the two most prominent companies filing the patents. As expected, companies in the automotive industry are dominant in filing the patents, and to further characterize patent filing patterns in WPT technology, only the patents filed from the automotive companies in Table 3 are used to plot Figure 4, which shows the number of WPT technology patents filed each year by each automotive company.
The figure reveals that DENSO was the forerunner among the automotive companies in filing WPT technology patents. The company continuously filed several patents a year starting 2004, but the number soon declined as TMC actively began to file WPT technology patents starting 2008. However, since both DENSO and TMC are under the Toyota Group, one can speculate that TMC took over WPT technology research and development from DENSO. After 2014, WPT technology patents filed from TMC plummeted. Nevertheless, patenting activity in WPT technology is not deterred in the automotive industry as other automobile manufacturers, especially Hyundai, Ford, and Honda, began actively filing WPT technology patents starting in 2015.

4.2. Extraction and Clustering of Topics from WPT Technology Patents

Package “stringr” in R is used to preprocess abstracts of the 1,416 patents collected. The package, which utilizes International Components for Unicode (ICU) C library, includes a set of functions that are designed to provide fast and accurate manipulations of common strings. Through the preprocessing, patent abstracts are converted into character strings, which are filtered to obtain words that are essential for describing the patents. The obtained words are constructed into a term-document matrix through principal component analysis (PCA), which reduces the dimensionality of the data, thus making interpretation and analysis easier. In this paper, principal components are selected so that the proportion of variation explained exceeds 90%. Table 4 shows a part of the term-document matrix constructed.
A term-document matrix shows the frequency of a word appearing in a document. For example, the word "electr" appeared once in Document 1 and twice in Document 3, and the word "communic" appeared five times in documents 1 and 4. The frequencies of word appearances are converted to weights with TF-IDF, and the result of the conversion can be seen in Table 5.
LDA is applied with package “topicmodels” in R to extract topics based on the calculated weights. The extracted topics are then clustered with the k-medoids algorithm since the algorithm performs better with larger data sets and is less affected by outliers. Silhouette values are used to determine the optimal number of clusters.
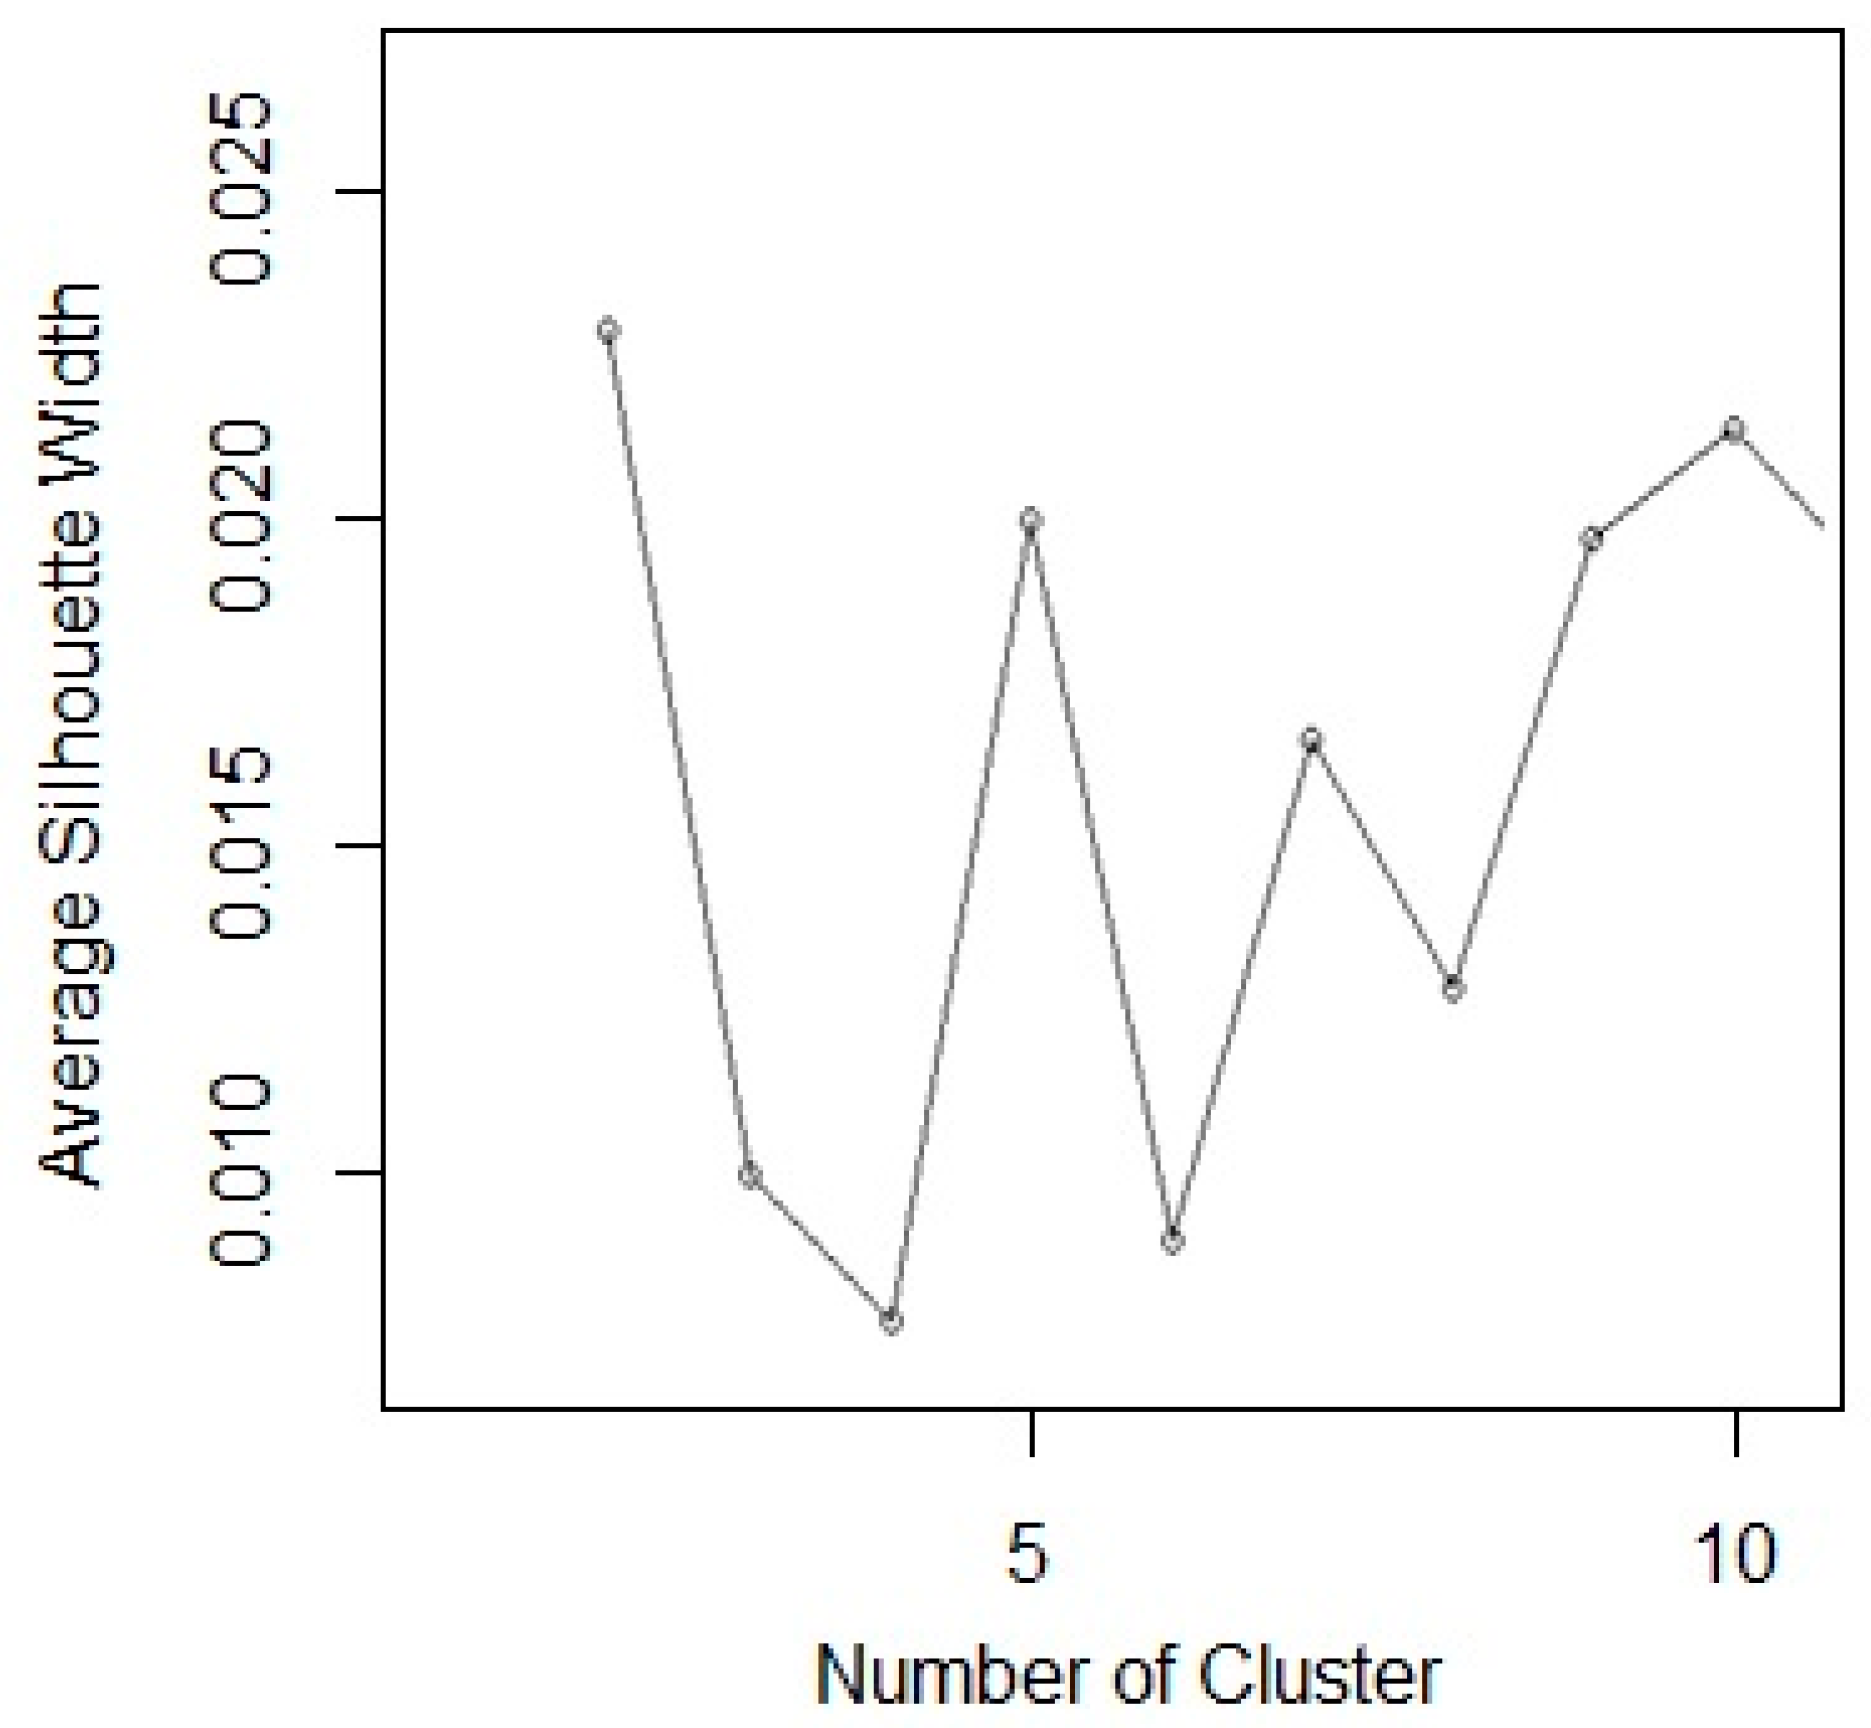
Silhouette is a method used to interpret and validate the consistency of clusters. The range of silhouettes is between -1 and 1, and higher value indicates a better clustering result. As shown in Figure 5, the optimal number of clusters for the extracted topics is two because the highest silhouette value is achieved with two clusters. Although a high silhouette value is also achieved with ten clusters, creating too many clusters is not ideal in this research since topics in each cluster can get very specific. Thus, topics are divided into two clusters in this paper. The first cluster contains 882 patents, and the second cluster contains 534 patents.
Table 6 shows the keywords that describe each cluster. The word "transmitter" is the only word that appeared in both clusters, indicating the importance and universal usage of transmitters in wireless charging. Based on the keywords, the first cluster can be defined as near field energy transfer methods or devices based on electromagnetic induction, and the second cluster can be defined as ancillary equipment for WPT, which includes devices such as voltage controllers for regulating a constant voltage level, communication modules for transmitting information about battery status, position sensors for checking the alignment of a transmitter and a receiver, and remote transponders for activating wireless charging.
The patents in each cluster are further divided into smaller groups based on the IPC to identify potential vacant technology areas. The IPC provides a hierarchical system of symbols, which are used to classify patents and utility models according to the pertaining technology areas [107]. The highest hierarchy level of the IPC is the section, followed by the class, the subclass, and the group. The section is divided into eight categories, and the section title indicates the broad contents of the section (Table 7). Of all hierarchy levels of the IPC, only the section is used to divide clustered patents into subgroups in this paper since all technological fields must be covered to accurately identify vacant technologies [48].
To group patents based on the IPC, the patents in each cluster are first normalized. For example, a patent with IPC subclass codes B60L, B64C, G01S, and H02J is normalized to 0.5 patent for Section B and 0.25 patent for sections G and H. After the normalization, k-means algorithm is employed to group patents in each cluster since the algorithm performs more effectively with smaller data sets. Table 8 shows the result of the grouping.
The result reveals that the majority of the patents are in IPC sections B, G, and H. Section H represents about 51% of the patents, followed by Section G with 24% and Section B with 22%. Also, not a single patent was present in IPC Section D, and only one patent was present in IPC Section C. IPC sections A, E, and F only included a small number of WPT related patents, suggesting that the three sections are unrelated to WPT technologies. Thus, WPT technology is closely related to performing operations, transporting, physics, and electricity, and the technology has no connection with chemistry, metallurgy, textiles, and paper.
Keywords are extracted from each subcluster to define each IPC section with respect to WPT technology. From the keywords in Table 9, Subcluster 1-1 can be defined as wireless charging methods based on the resonant inductive coupling. Subcluster 1-2 can be defined as wireless power transfer configurations for powering various communication devices and electric sensors, and Subcluster 1-3 can be defined as circuitries consisting of transmitter coils (primary) and receiver coils (secondary) for wireless power transfer. Also, Subcluster 2-1 can be defined as various controllers used to regulate safe wireless power transfer, Subcluster 2-2 can be defined as devices or systems that control WPT according to electric signals transmitted, and Subcluster 2-3 can be defined as WPT condition monitoring methods or devices such as an apparatus that prevents overheating of WPT components and an instrument that detects alignment and position of a transmitter and a receiver.
The patent clustering result indicates that IPC Section H, which is represented by subclusters 1-3 and 2-2, is a comparatively well-developed technology area in wireless power transfer. On the contrary, the technology areas covered by subclusters 1-1, 1-2, 2-1, and 2-3 are relatively undeveloped. Thus, the four subclusters are potential candidates for vacant technologies in WPT technology.

4.3. Identifying Vacant Technology Areas in WPT Technology

The clustering result suggests that subclusters 1-1, 1-2, 2-1, and 2-3 are underdeveloped technology areas in WPT since the four subclusters are relatively undeveloped compared to subclusters 1-3 and 2-2. However, the clustering result is not enough to show whether an underdeveloped technology area really is a vacant technology area. Therefore, the time series analysis and innovation cycle of technology are applied to accurately identify vacant technology areas from the six subclusters. Patents filed in 2017 and 2018 are excluded since the USPTO grants up to 18 months of confidential status to patents upon receiving requests from applicants. The results of the identification are summarized and compared in Section 5, and the identified vacant technology areas are finalized.

4.3.1. Application of Time Series Analysis

Time series analysis is applied to the clustering result for accurate identification of vacant technology areas in WPT. Figure 6 shows the result of exponential smoothing. The yearly number of patents filed in Subcluster 1-1 has grown continuously from the beginning, and the number of patents filed is expected to steadily increase in the future, meaning that the subcluster is in a development stage. The number of patent filings in Subcluster 1-2 grew rapidly until 2005 and met a quick decline afterward. In fact, less than five patents are filed annually since 2012, and the number is expected to stay low in the future. In Subcluster 1-3, patents have been filed regularly since the beginning, and the number of patents filed increased rapidly after 2008, reaching about 50 per year in 2014. Although the exponential smoothing result reveals uncertainty about future growth, Subcluster 1-3 is likely to show an increase in patent filings for the next couple of years. Combined with the clustering result, Subcluster 1-1 is likely to be identified as a vacant technology area.
Subcluster 2-1 shows a similar pattern to Subcluster 1-2, meaning that Subcluster 2-1 has declined. Thus, only a small number of patents will be filed annually in the future. The number of patent filings in Subcluster 2-2 grew quickly until 2005 and has since stayed at around 15 patents a year. Such stagnation suggests that Subcluster 2-2 is likely to be matured. Subcluster 2-3, when compared to all other subclusters, showed a huge variability in the number of patents filed at the beginning. The number, however, has stabilized after 2009 and is showing a slow but steady increase. Combined with the clustering result, Subcluster 2-3 is highly likely to be identified as a vacant technology area.

4.3.2. Application of Innovation Cycle of Technology

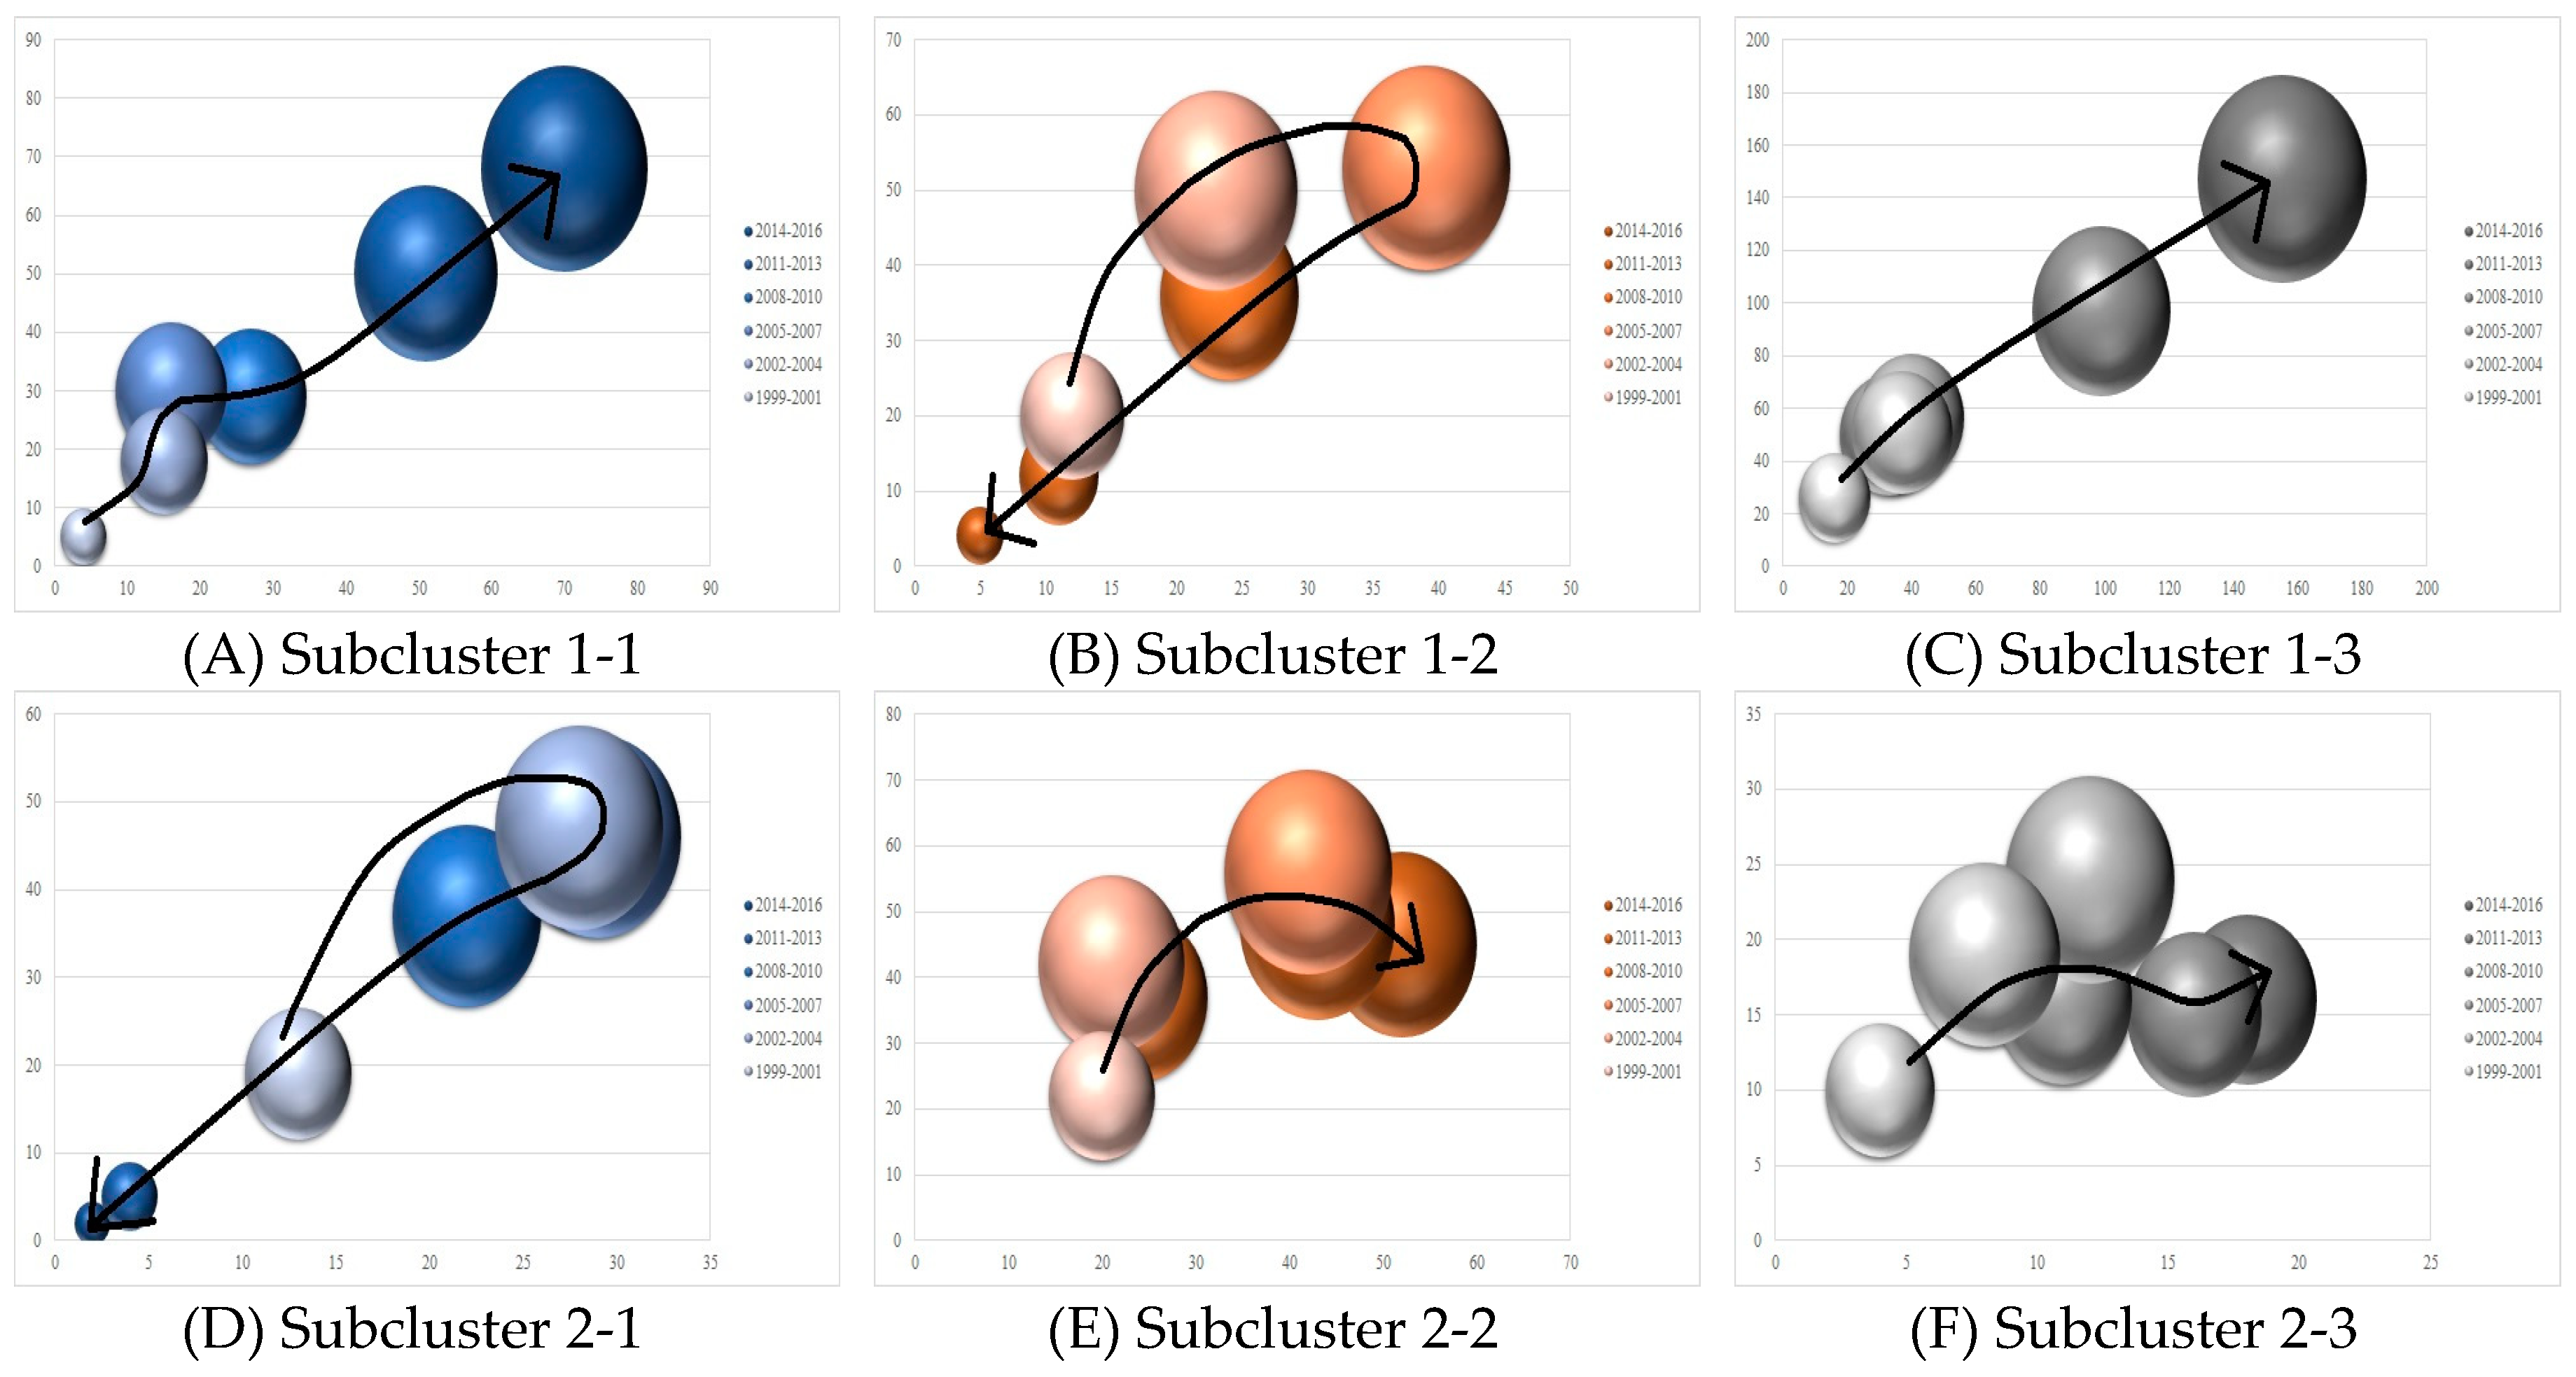
Innovation cycle of technology is applied to the clustering result to identify vacant technology areas from another aspect. Figure 7 shows the innovation cycle of each subcluster. Patents filed from 1999 to 2016 are divided into six equal periods, each of which represents three years of patenting activity. Subclusters 1-2 and 2-1 showed similar patterns in innovation cycles. In both subclusters, the number of patents and the number of applicants initially increased. As time progressed, however, both numbers plummeted, and no significant patenting activity is detected for the last few years. Thus, subclusters 1-2 and 2-1 are in Level 4 (decline phase). Subcluster 2-2 showed a continuous increase in the number of applicants since 1999. The number of patents filed, however, has been declining for some years, meaning that patenting activity has slowed down in general. Therefore, Subcluster 2-2 is in Level 3 (maturity phase).
In general, the number of patents and the number of applicants both increased in Subcluster 1-1, and patents have been actively filed in recent years. However, both numbers are not large, indicating that Subcluster 1-1 is in transition from the initial phase to the development phase. Subcluster 1-3 showed continuous growth throughout the years, and as many as 147 patents from 155 applicants are filed between 2014 and 2016. Compared to other subclusters, patents are filed very actively in Subcluster 1-3, suggesting that the subcluster is in the development phase. For Subcluster 2-3, the number of applicants generally increased while the number of patents filed remained relatively stationary, meaning that many applicants are intermittently filing small number of patents. In addition, compared to other subclusters, the bubbles in Subcluster 2-3 are gathered together. Thus, Subcluster 2-3 is in the initial phase. Combined with the clustering result, subclusters 1-1 and 2-3 are highly likely to be identified as vacant technology areas.

5. Discussion

The summary of analyses conducted in this paper is provided in Table 10. All results indicate that Subcluster 2-2 is well-developed, meaning that the subcluster has matured. Subclusters 1-2 and 2-1 are portrayed as underdeveloped areas according to the clustering result since the two subclusters contained fewer patents compared to subclusters 1-3 and 2-2. However, the results of the time series analysis and innovation cycle show that patenting activity has been continuously shrinking since 2007 in subclusters 1-2 and 2-1, meaning that the two subclusters are in the decline phase. The two subclusters also unveil the risks involved in identifying vacant technology areas solely based on clustering, thus emphasizing the importance of conducting and comparing multiple analyses in identifying vacant technology areas.
The results of clustering and time series analysis indicate that Subcluster 1-1 is at an early stage of development. Although the result of the innovation cycle indicates that Subcluster 1-1 may have surpassed the initial phase, the subcluster clearly has not fully entered the development phase either. Therefore, Subcluster 1-1, which is defined as wireless charging methods based on resonant inductive coupling, is a vacant technology area. The result of clustering indicates that Subcluster 1-3 is a well-developed technology area since the subcluster contains more than half of the patents in Cluster 1. However, Subcluster 1-3 showed the most active patent filings in both time series analysis and innovation cycle, and the results showed no signs of slowing down in patenting activity. Thus, Subcluster 1-3, which is defined as circuitries consisting of transmitter coils and receiver coils for WPT, is an emerging technology area. Lastly, all of the results indicate that Subcluster 2-3, which is defined as WPT condition monitoring methods or devices, is a vacant technology area. In conclusion, subclusters 1-1 and 2-3 are identified as vacant technology areas, and Subcluster 1-3 is identified as an emerging technology area.
The identified emerging and vacant technology areas provide insights regarding the way WPT technologies evolved. First of all, WPT configurations for relatively small devices are developed. Next, apparatuses and systems that control wireless power transfer according to electric signals are developed. The two technology areas developed to set a foundation for more innovations in WPT technologies since reliability is increased and various configurations are invented for future development.
Recently, circuitries of WPT started to show rapid growth, indicating the start of modularization for various WPT applications. Then, devices such as an apparatus that prevents overheating of WPT components and an instrument that detects alignment and position of a transmitter and a receiver started to slowly emerge. The surfacing of such condition monitoring devices signals the expansion in the usage of WPT, implying that wireless power transfer technologies will be widespread in the future.
The patent analysis results also revealed several interesting characteristics of the patenting activity in WPT technology. For example, patent filing trends and innovation cycles revealed that the patenting activity, which generally increased until 2007, was temporarily hampered afterward. The diminished activity implies that the global financial crisis had influences on patent filings. However, the paths taken by technology areas that ended up in the decline phase were vastly different from the paths taken by technology areas that are currently in the initial or development phase. After 2007, both the number of patents and applicants plummeted for technology areas that ended up in the decline phase while the numbers took off for technology areas that are currently in the initial or development phase. Another interesting characteristic is the participation of the automotive industry in filing WPT patents. While the automotive industry is actively filing WPT patents, no other transportation sector is showing noticeable patenting activity in WPT technology areas. In fact, over the same time period, the automotive industry filed more than 400 patents, whereas the aircraft industry and the locomotive industry filed only 11 and 6 patents respectively. Such characteristic implies that other transportation sectors are seeking methods other than WPT technology for innovation since all transportation sectors are putting efforts to increase the efficiency of the transports and reduce the pollutants produced by the transports.

6. Conclusions

Several notable aspects of wireless power transfer technology are discovered through the patent analysis conducted in this paper. First of all, patent filing trends revealed that, since 2011, paradigm of patenting activity in WPT shifted to the automotive industry, which is leading the patent share by a large margin compared to other industries. Also, within the transportation sector, the automotive industry is observed as the only industry that is actively filing WPT patents, indicating that the industry is diligently undergoing a transformation to reduce the pollutants emitted by vehicles and meet the regulations imposed by governments. Secondly, two large patent clusters, each of which contains three subclusters, are identified by employing text mining and clustering. Topics extracted by text mining showed that one of the two clusters included patents directly related to WPT while the other cluster included patents related to ancillaries of WPT.
Unlike many previous studies that identified emerging and vacant technology areas based on clustering alone, this paper took a step further and applied time series analysis and innovation cycle of technology to minimize the possibility of misidentifying emerging and vacant technology areas. By correlating clusters with time series analysis and innovation cycle of technology, possible gaps in technology development of WPT are identified. As a result, the identification process is improved, and the validity of the identified technology areas is increased. Three WPT technology areas are identified as emerging and vacant technology areas. The emerging technology area identified is circuitries consisting of transmitter coils and receiver coils for wireless power transfer, and the two vacant technology areas identified are wireless charging methods based on resonant inductive coupling and wireless power transfer condition monitoring methods or devices. In the future, the three identified areas are expected to show continuous growth, which will make WPT technology safer and more versatile.
A reliable method for identifying emerging and vacant technology areas is provided in this paper, and WPT technology characteristics and meaningful insights are revealed by the patent analysis. However, further improvements can be made in this paper. Namely, only abstracts of the patents are used to extract topics for the patent analysis. Although patent abstracts contain crucial information about patents, patent claims include more detailed aspects of patents, thus comprehensively describing patents. Utilization of both patent abstracts and claims may add some noise in extracted topics since the volume of textual data is substantially larger, but the application of adequate filtering process will provide exhaustive topics for a patent analysis. Also, in this paper, patents irrelevant to WPT are manually removed from the patent search result. Applying methods that automatically filter irrelevant patents can reduce human errors, thus providing more accurate analysis results.

Author Contributions

Conceptualization, K.H.K., S.W.C. and C.L.; methodology, K.H.K., Y.J.H. and S.W.C.; validation, K.H.K., Y.J.H., S.L., S.W.C. and C.L.; formal analysis, K.H.K. and S.W.C.; investigation, K.H.K.; data curation, K.H.K. and S.W.C.; writing—original draft preparation, K.H.K.; writing—review and editing, K.H.K., Y.J.H., S.L., S.W.C. and C.L.; visualization, K.H.K.; supervision, C.L.; project administration, Y.J.H., S.L. and C.L.

Funding

This research was supported by “Development on the Interface Technologies of Wireless Power Transfer System for LRT (Light Rail Transit)” of the Ministry of Land, Infrastructure and Transport (17RTRP-B097048-03).

Conflicts of Interest

The authors declare no conflict of interest.

References

  1. United States Environmental Protection Agency. Inventory of U.S. Greenhouse Gas Emissions and Sinks: 1990–2017; United States Environmental Protection Agency: Washington, DC, USA, 2019.
  2. Reuters. Paris Mayor Wants to Ban Diesel Cars by 2020 to Fight Pollution. Available online: www.reuters.com/article/us-paris-pollution-idUSKBN0JL0FO20141207?feedType=RSS&feedName=environmentNews (accessed on 27 March 2019).
  3. The Guardian. Netherlands Moots Electric Car Future with Petrol and Diesel Ban by 2025. Available online: www.theguardian.com/technology/2016/apr/18/netherlands-parliament-electric-car-petrol-diesel-ban-by-2025 (accessed on 27 March 2019).
  4. The Guardian. China to Ban Production of Petrol and Diesel Cars ‘in the Near Future’. Available online: www.theguardian.com/world/2017/sep/11/china-to-ban-production-of-petrol-and-diesel-cars-in-the-near-future (accessed on 27 March 2019).
  5. Franke, T.; Krems, J.F. What drives range preferences in electric vehicle users? Transp. Policy 2013, 30, 56–62. [Google Scholar] [CrossRef]
  6. Nykvist, B.; Sprei, F.; Nilsson, M. Assessing the progress toward lower priced long range battery electric vehicles. Energy Policy 2019, 124, 144–155. [Google Scholar] [CrossRef]
  7. Haugneland, P.; Kvisle, H.H. Norwegian electric car user experiences. In Proceedings of the 2013 World Electric Vehicle Symposium and Exhibition (EVS27), Barcelona, Spain, 17–20 November 2013; pp. 1–11. [Google Scholar]
  8. AAA. Icy Temperatures Cut Electric Vehicle Range Nearly in Half. Available online: https://newsroom.aaa.com/2019/02/cold-weather-reduces-electric-vehicle-range (accessed on 27 March 2019).
  9. Ko, Y.D.; Jang, Y.J. The optimal system design of the online electric vehicle utilizing wireless power transmission technology. IEEE Trans. Intell. Transp. Syst. 2013, 14, 1255–1265. [Google Scholar] [CrossRef]
  10. Suh, N.P.; Cho, D.H.; Rim, C.T. Design of on-line electric vehicle (OLEV). Glob. Prod. Dev. 2011, 3–8. [Google Scholar] [CrossRef]
  11. Sun, L.; Ma, D.; Tang, H. A review of recent trends in wireless power transfer technology and its applications in electric vehicle wireless charging. Renew. Sustain. Energy Rev. 2018, 91, 490–503. [Google Scholar] [CrossRef]
  12. Garcia-Vazquez, C.A.; Llorens-Iborra, F.; Fernandez-Ramirez, L.M.; Sanchez-Sainz, H.; Jurado, F. Comparative study of dynamic wireless charging of electric vehicles in motorway, highway and urban stretches. Energy 2017, 137, 42–57. [Google Scholar] [CrossRef]
  13. BMW Group. Charging Even Easier than Refuelling. Available online: www.press.bmwgroup.com/global/article/detail/T0281369EN/charging-even-easier-than-refuelling?language=en (accessed on 27 March 2019).
  14. Groupe Renault. Electric Vehicles, Towards Dynamic Wireless Charging? Available online: https://group.renault.com/en/news/blog-renault/electric-vehicles-towards-dynamic-wireless-charging (accessed on 27 March 2019).
  15. Dedehayir, O.; Makinen, S.J. Determining reverse salient types and evolutionary dynamics of technology systems with performance disparities. Technol. Anal. Strateg. Manag. 2011, 23, 1095–1114. [Google Scholar] [CrossRef]
  16. Han, K.; Shin, J. Identification and forecasting of emerging technology commercialization by reverse salient. J. Adv. Manag. Sci. 2013, 1, 282–287. [Google Scholar] [CrossRef]
  17. Hughes, T.P. Networks of Power: Electrification in Western Society, 1880–1930; The Johns Hopkins University Press: Baltimore, MD, USA, 1983. [Google Scholar]
  18. MacKenzie, D. Missile accuracy: A case study in the social processes of technological change. In The Social Construction of Technological Systems: New Directions in the Sociology and History of Technology; The MIT Press: Cambridge, MA, USA, 1987. [Google Scholar]
  19. Hardstone, G.A.P. Capabilities, structures and strategies re-examined: Incumbent firms and the emergence of complex product systems (CoPS) in mature industries. Technol. Anal. Strateg. Manag. 2004, 16, 173–196. [Google Scholar] [CrossRef]
  20. Small, H.; Boyack, K.W.; Klavans, R. Identifying emerging topics in science and technology. Res. Policy 2014, 43, 1450–1467. [Google Scholar] [CrossRef]
  21. Rotolo, D.; Hicks, D.; Martin, B.R. What is an emerging technology? Res. Policy 2015, 44, 1827–1843. [Google Scholar] [CrossRef] [Green Version]
  22. Stahl, B.C. What does the future hold? A critical view of emerging information and communication technologies and their social consequences. In Researching the Future in Information Systems; Springer: Berlin, Germany, 2011. [Google Scholar]
  23. Halaweh, M. Emerging technology: What is it? J. Technol. Manag. Innov. 2013, 8, 108–115. [Google Scholar] [CrossRef]
  24. Cozzens, S.; Gatchair, S.; Kang, J.; Kim, K.S.; Lee, H.J.; Ordonez, G.; Porter, A. Emerging technologies: Quantitative identification and measurement. Technol. Anal. Strateg. Manag. 2010, 22, 361–376. [Google Scholar] [CrossRef]
  25. Patents. World Intellectual Property Organization. Available online: www.wipo.int/patents/en (accessed on 31 March 2019).
  26. Joung, J.; Kim, K. Monitoring emerging technologies for technology planning using technical keyword based analysis from patent data. Technol. Forecast. Soc. Chang. 2017, 114, 281–292. [Google Scholar] [CrossRef]
  27. Daim, T.U.; Rueda, G.; Martin, H.; Gerdsri, P. Forecasting emerging technologies: Use of bibliometrics and patent analysis. Technol. Forecast. Soc. Chang. 2006, 73, 981–1012. [Google Scholar] [CrossRef]
  28. Manohar, M.; Lathabai, H.H.; George, S.; Prabhakaran, T. Wire-free electricity: Insights from a techno-futuristic exploration. Util. Policy 2018, 53, 3–14. [Google Scholar] [CrossRef]
  29. Allied Market Research. Wireless Charging Market by Technology (Inductive, Resonant, Radio Frequency (RF), and Others), and Industry Vertical (Electronics, Automotive, Industrial, Healthcare, and Aerospace & Defense)—Global Opportunity Analysis and Industry Forecast, 2018–2025. Available online: www.alliedmarketresearch.com/wireless-charging-market (accessed on 31 March 2019).
  30. Chen, D.; Chang, H.; Huang, M.; Fu, F. Core technologies and key industries in Taiwan from 1978 to 2002: A perspective from patent analysis. Scientometrics 2005, 64, 31–53. [Google Scholar] [CrossRef]
  31. Feng, X.; Leng, F. Patent text mining and informetric-based patent technology morphological analysis: An empirical study. Technol. Anal. Strateg. Manag. 2012, 24, 467–479. [Google Scholar] [CrossRef]
  32. Madani, F.; Weber, C. The evolution of patent mining: Applying bibliometrics analysis and keyword network analysis. World Pat. Inf. 2016, 46, 32–48. [Google Scholar] [CrossRef]
  33. Tseng, Y.; Lin, C.; Lin, Y. Text mining techniques for patent analysis. Inf. Process. Manag. 2007, 43, 1216–1247. [Google Scholar] [CrossRef]
  34. Kostoff, R.N. The use and misuse of citation analysis in research evaluation. Scientometrics 1998, 43, 27–43. [Google Scholar] [CrossRef]
  35. Abbas, A.; Zhang, L.; Khan, S.U. A literature review on the state-of-the-art in patent analysis. World Pat. Inf. 2014, 37, 3–13. [Google Scholar] [CrossRef]
  36. Noh, H.; Jo, Y.; Lee, S. Keyword selection and processing strategy for applying text mining to patent analysis. Expert Syst. Appl. 2015, 42, 4348–4360. [Google Scholar] [CrossRef]
  37. Choi, J.; Hwang, Y. Patent keyword network analysis for improving technology development efficiency. Technol. Forecast. Soc. Chang. 2014, 83, 170–182. [Google Scholar] [CrossRef]
  38. Yoon, B.; Lee, S. Patent analysis for technology forecasting: Sector-specific applications. In Proceedings of the 2008 IEEE International Engineering Management Conference, Estoril, Portugal, 28–30 June 2008; pp. 1–5. [Google Scholar]
  39. Jun, S.; Park, S.S.; Jang, D.S. Patent management for technology forecasting: A case study of the bio-industry. J. Intell. Prop. Rights 2012, 17, 539–546. [Google Scholar]
  40. Trappey, C.V.; Wu, H.; Taghaboni-Dutta, F.; Trappey, A.J.C. Using patent data for technology forecasting: China RFID patent analysis. Adv. Eng. Inform. 2011, 25, 53–64. [Google Scholar] [CrossRef]
  41. Chen, Y.; Chen, C.; Lee, S. Technology forecasting and patent strategy of hydrogen energy and fuel cell technologies. Int. J. Hydrog. Energy 2011, 36, 6957–6969. [Google Scholar] [CrossRef]
  42. Zhou, X.; Huang, L.; Porter, A.; Vicente-Gomila, J.M. Tracing the system transformations and innovation pathways of an emerging technology: Solid lipid nanoparticles. Technol. Forecast. Soc. Chang. 2019, 146, 785–794. [Google Scholar] [CrossRef]
  43. Altuntas, S.; Dereli, T.; Kusiak, A. Forecasting technology success based on patent data. Technol. Forecast. Soc. Chang. 2015, 96, 202–214. [Google Scholar] [CrossRef]
  44. Levitas, E.F.; McFadyen, M.A.; Loree, D. Survival and the introduction of new technology: A patent analysis in the integrated circuit industry. J. Eng. Technol. Manag. 2006, 23, 182–201. [Google Scholar] [CrossRef]
  45. Altuntas, S.; Dereli, T.; Kusiak, A. Analysis of patent documents with weighted association rules. Technol. Forecast. Soc. Chang. 2015, 92, 249–262. [Google Scholar] [CrossRef]
  46. Lee, C.; Kwon, O.; Kim, M.; Kwon, D. Early identification of emerging technologies: A machine learning approach using multiple patent indicators. Technol. Forecast. Soc. Chang. 2018, 127, 291–303. [Google Scholar] [CrossRef]
  47. Cho, H.P.; Lim, H.; Lee, D.; Cho, H.; Kang, K. Patent analysis for forecasting promising technology in high-rise building construction. Technol. Forecast. Soc. Chang. 2018, 128, 144–153. [Google Scholar] [CrossRef]
  48. Song, K.; Kim, K.S.; Lee, S. Discovering new technology opportunities based on patents: Text-mining and F-term analysis. Technovation 2017, 60–61, 1–14. [Google Scholar] [CrossRef]
  49. Japan Patent Office. Classification. Available online: www.jpo.go.jp/e/system/patent/gaiyo/seido-bunrui/index.html (accessed on 1 April 2019).
  50. Kyebambe, M.N.; Cheng, G.; Huang, Y.; He, C.; Zhang, Z. Forecasting emerging technologies: A supervised learning approach through patent analysis. Technol. Forecast. Soc. Chang. 2017, 125, 236–244. [Google Scholar] [CrossRef]
  51. Niemann, H.; Moehrle, M.G.; Frischkorn, J. Use of a new patent text-mining and visualization method for identifying patenting patterns over time: Concept, method and test application. Technol. Forecast. Soc. Chang. 2017, 115, 210–220. [Google Scholar] [CrossRef]
  52. Jun, S.; Park, S.S.; Jang, D.S. Technology forecasting using matrix map and patent clustering. Ind. Manag. Data Syst. 2012, 112, 786–807. [Google Scholar] [CrossRef]
  53. Lee, S.; Yoon, B.; Park, Y. An approach to discovering new technology opportunities: Keyword-based patent map approach. Technovation 2009, 29, 481–497. [Google Scholar] [CrossRef]
  54. Yoon, B.; Magee, C.L. Exploring technology opportunities by visualizing patent information based on generative topographic mapping and link prediction. Technol. Forecast. Soc. Chang. 2018, 132, 105–117. [Google Scholar] [CrossRef]
  55. Yoon, B.; Park, I.; Yun, D.; Park, G. Exploring promising vacant technology areas in a technology-oriented company based on bibliometric analysis and visualisation. Technol. Anal. Strateg. Manag. 2019, 31, 388–405. [Google Scholar] [CrossRef]
  56. Kim, G.; Bae, J. A novel approach to forecast promising technology through patent analysis. Technol. Forecast. Soc. Chang. 2017, 117, 228–237. [Google Scholar] [CrossRef]
  57. Kim, Y.G.; Suh, J.H.; Park, S.C. Visualization of patent analysis for emerging technology. Expert Syst. Appl. 2008, 34, 1804–1812. [Google Scholar] [CrossRef]
  58. Kwon, H.; Kim, J.; Park, Y. Applying LSA text mining technique in envisioning social impacts of emerging technologies: The case of drone technology. Technovation 2017, 60–61, 15–28. [Google Scholar] [CrossRef]
  59. Kim, G.J.; Park, S.S.; Jang, D.S. Technology forecasting using topic-based patent analysis. J. Sci. Ind. Res. 2015, 74, 265–270. [Google Scholar]
  60. Choi, S.; Jun, S. Vacant technology forecasting using new Bayesian patent clustering. Technol. Anal. Strateg. Manag. 2014, 26, 241–251. [Google Scholar] [CrossRef]
  61. Kwon, S.; Liu, X.; Porter, A.L.; Youtie, J. Research addressing emerging technological ideas has greater scientific impact. Res. Policy 2019, 48, 103834. [Google Scholar] [CrossRef]
  62. Caviggioli, F. Technology fusion: Identification and analysis of the drivers of technology convergence using patent data. Technovation 2016, 55–56, 22–32. [Google Scholar] [CrossRef]
  63. Guruprasad, K.; Kanagavel, P.; Srikanth, K.; Radhika, K.; Sonal, S. Analysis of US patents granted to Indian inventors. J. Intellect. Prop. Rights 2003, 8, 205–212. [Google Scholar]
  64. Huang, M.; Chang, H.; Chen, D. The trend of concentration in scientific research and technological innovation: A reduction of the predominant role of the U.S. in world research & technology. J. Informetr. 2012, 6, 457–468. [Google Scholar]
  65. Mani, S. Is India becoming more innovative since 1991? Some disquieting features. Econ. Political Wkly. 2009, 44, 41–52. [Google Scholar]
  66. Michel, J.; Bettels, B. Patent citation analysis: A closer look at the basic input data from patent search reports. Scientometrics 2001, 51, 185–201. [Google Scholar] [CrossRef]
  67. Albino, V.; Ardito, L.; Dangelico, R.M.; Petruzzelli, A.M. Understanding the development trends of low-carbon energy technologies: A patent analysis. Appl. Energy 2014, 135, 836–854. [Google Scholar] [CrossRef]
  68. Singh, T.; Kumari, M. Role of text pre-processing in Twitter sentiment analysis. Procedia Comput. Sci. 2016, 89, 549–554. [Google Scholar] [CrossRef]
  69. Haddi, E.; Liu, X.; Shi, Y. The role of text pre-processing in sentiment analysis. Procedia Comput. Sci. 2013, 17, 26–32. [Google Scholar] [CrossRef]
  70. Zhang, W.; Yoshida, T.; Tang, X. Text classification based on multi-word with support vector machine. Knowl. Based Syst. 2008, 21, 879–886. [Google Scholar] [CrossRef]
  71. Hassler, M.; Fliedl, G. Text preparation through extended tokenization. Wit. Trans. Inf. Commun. Technol. 2006, 37, 13–21. [Google Scholar]
  72. Stavrianou, A.; Andritsos, P.; Nicoloyannis, N. Overview and semantic issues of text mining. Sigmod Rec. 2007, 36, 23–34. [Google Scholar] [CrossRef]
  73. Luhn, H.P. A statistical approach to mechanized encoding and searching of literary information. IBM J. Res. Dev. 1957, 1, 309–317. [Google Scholar] [CrossRef]
  74. Salton, G.; Yang, C.S. On the specification of term values in automatic indexing. J. Doc. 1973, 29, 351–372. [Google Scholar] [CrossRef]
  75. Aizawa, A. An information-theoretic perspective of tf-idf measures. Inf. Process. Manag. 2003, 39, 45–65. [Google Scholar] [CrossRef]
  76. Roberston, S. Understanding inverse document frequency: On theoretical argument for IDF. J. Doc. 2004, 60, 503–520. [Google Scholar]
  77. Hiemstra, D. A probabilistic justification for using tf×idf term weighting in information retrieval. Int. J. Digit. Libr. 2000, 3, 131–139. [Google Scholar] [CrossRef]
  78. Wu, H.C.; Luk, R.W.P.; Wong, K.F.; Kwok, K.L. Interpreting TF-IDF term weights as making relevance decisions. ACM Trans. Inf. Syst. 2008, 26, 13. [Google Scholar] [CrossRef]
  79. Zhang, W.; Yoshida, T.; Tang, X. A comparative study of TF*IDF, LSI and multi-words for text classification. Expert Syst. Appl. 2011, 38, 2758–2765. [Google Scholar] [CrossRef]
  80. Landauer, T.K.; Dumais, S.T. A solution to Plato’s problem: The latent semantic analysis theory of the acquisition, induction, and representation of knowledge. Psychol. Rev. 1997, 104, 211–240. [Google Scholar] [CrossRef]
  81. Dumais, S.T. Latent semantic analysis. Annu. Rev. Inf. Sci. Technol. 2004, 38, 188–230. [Google Scholar] [CrossRef]
  82. Hofmann, T. Unsupervised learning by probabilistic latent semantic analysis. Mach. Learn. 2001, 42, 177–196. [Google Scholar] [CrossRef]
  83. Landauer, T.K.; Foltz, P.W.; Laham, D. An introduction to latent semantic analysis. Discourse Process. 1998, 25 (Suppl. S2–S3), 259–284. [Google Scholar] [CrossRef]
  84. Dumais, S.T.; Furnas, G.W.; Landauer, T.K.; Deerwester, S.; Harshman, R. Using latent semantic analysis to improve access to textual information. Proc. Sigchi Conf. Hum. Factors Comput. Syst. 1988, 281–285. [Google Scholar] [CrossRef]
  85. Hofmann, T. Probabilistic latent semantic analysis. In Proceedings of the Fifteenth Conference on Uncertainty in Artificial Intelligence, Stockholm, Sweden, 30 July–1 August 1999; pp. 289–296. [Google Scholar]
  86. Blei, D.M.; Ng, A.Y.; Jordan, M.I. Latent Dirichlet allocation. J. Mach. Learn. Res. 2003, 3, 993–1022. [Google Scholar]
  87. Madhulatha, T.S. Comparison between k-means and k-medoids clustering algorithms. Commun. Comput. Inf. Sci. 2011, 198, 472–481. [Google Scholar]
  88. Velmurugan, T.; Santhanam, T. Computational complexity between k-means and k-medoids clustering algorithms for normal and uniform distributions of data points. J. Comput. Sci. 2010, 6, 363–368. [Google Scholar] [CrossRef]
  89. Arora, P.; Deepali, V.; Varshney, S. Analysis of k-means and k-medoids algorithm for big data. Procedia Comput. Sci. 2016, 78, 507–512. [Google Scholar] [CrossRef]
  90. Park, H.; Jun, C. A simple and fast algorithm for k-medoids clustering. Expert Syst. Appl. 2009, 36, 3336–3341. [Google Scholar] [CrossRef]
  91. Velmurugan, T. Efficiency of k-means and k-medoids algorithms for clustering arbitrary data points. Int. J. Comput. Technol. Appl. 2012, 3, 1758–1764. [Google Scholar]
  92. Balabantaray, R.C.; Sarma, C.; Jha, M. Document clustering using k-means and k-medoids. Int. J. Knowl. Based Comput. Syst. 2013, 1, 7–13. [Google Scholar]
  93. Zhang, G.P. Time series forecasting using a hybrid ARIMA and neural network model. Neurocomputing 2003, 50, 159–175. [Google Scholar] [CrossRef]
  94. Harvey, A.C.; Fernandes, C. Time series models for count or qualitative observations. J. Bus. Econ. Stat. 1989, 7, 407–417. [Google Scholar]
  95. Corberan-Vallet, A.; Bermudez, J.D.; Vercher, E. Forecasting correlated time series with exponential smoothing models. Int. J. Forecast. 2011, 27, 252–265. [Google Scholar] [CrossRef]
  96. Gardner, E.S. Exponential smoothing: The state of the art. J. Forecast. 1985, 4, 1–28. [Google Scholar] [CrossRef]
  97. Billah, B.; King, M.L.; Snyder, R.D.; Koehler, A.B. Exponential smoothing model selection for forecasting. Int. J. Forecast. 2006, 22, 239–247. [Google Scholar] [CrossRef] [Green Version]
  98. Gardner, E.S. Exponential smoothing: The state of the art—Part II. Int. J. Forecast. 2006, 22, 637–666. [Google Scholar] [CrossRef]
  99. Beaumont, A.N. Data transforms with exponential smoothing methods of forecasting. Int. J. Forecast. 2014, 30, 918–927. [Google Scholar] [CrossRef]
  100. Huang, J. Patent portfolio analysis of the cloud computing industry. J. Eng. Technol. Manag. 2016, 39, 45–64. [Google Scholar] [CrossRef]
  101. O’Leary, D.E. Technology life cycle and data quality: Action and triangulation. Decis. Support. Syst. 2019, 126, 113139. [Google Scholar] [CrossRef]
  102. Ryu, T.K.; Jung, C.; Kim, B.T.; Lim, S.; Lim, H.; Choo, Y.; Park, J.; Kim, J.; Kim, H.R.; Joung, D.; et al. Development of indicators for IP competitiveness and characteristics. Korea Inst. Intellect. Prop. 2012. Available online: https://www.kiip.re.kr/en/research_report/view.do?bd_gb=ereport&bd_cd=1&bd_item=0&po_item_gb=regb_10&currentPage=8&po_no=R0359 (accessed on 6 November 2019).
  103. Haupt, R.; Kloyer, M.; Lange, M. Patent indicators for the technology life cycle development. Res. Policy 2007, 36, 387–398. [Google Scholar] [CrossRef]
  104. Jarvenpaa, H.M.; Makinen, S.J.; Seppanen, M. Patent and publishing activity sequence over a technology’s life cycle. Technol. Forecast. Soc. Chang. 2011, 78, 283–293. [Google Scholar] [CrossRef]
  105. The United States Patent and Trademark Office. 1120 Eighteen-Month Publication of Patent Applications [R-07.2015]. Available online: www.uspto.gov/web/offices/pac/mpep/s1120.html (accessed on 29 April 2019).
  106. Consumer Reports. More American Drivers Want Electric Cars, AAA Survey Says. Available online: www.consumerreports.org/hybrids-evs/more-american-drivers-want-electric-cars-aaa-survey-says (accessed on 1 May 2019).
  107. World Intellectual Property Organization. About the International Patent Classification. Available online: www.wipo.int/classifications/ipc/en/preface.html (accessed on 14 May 2019).
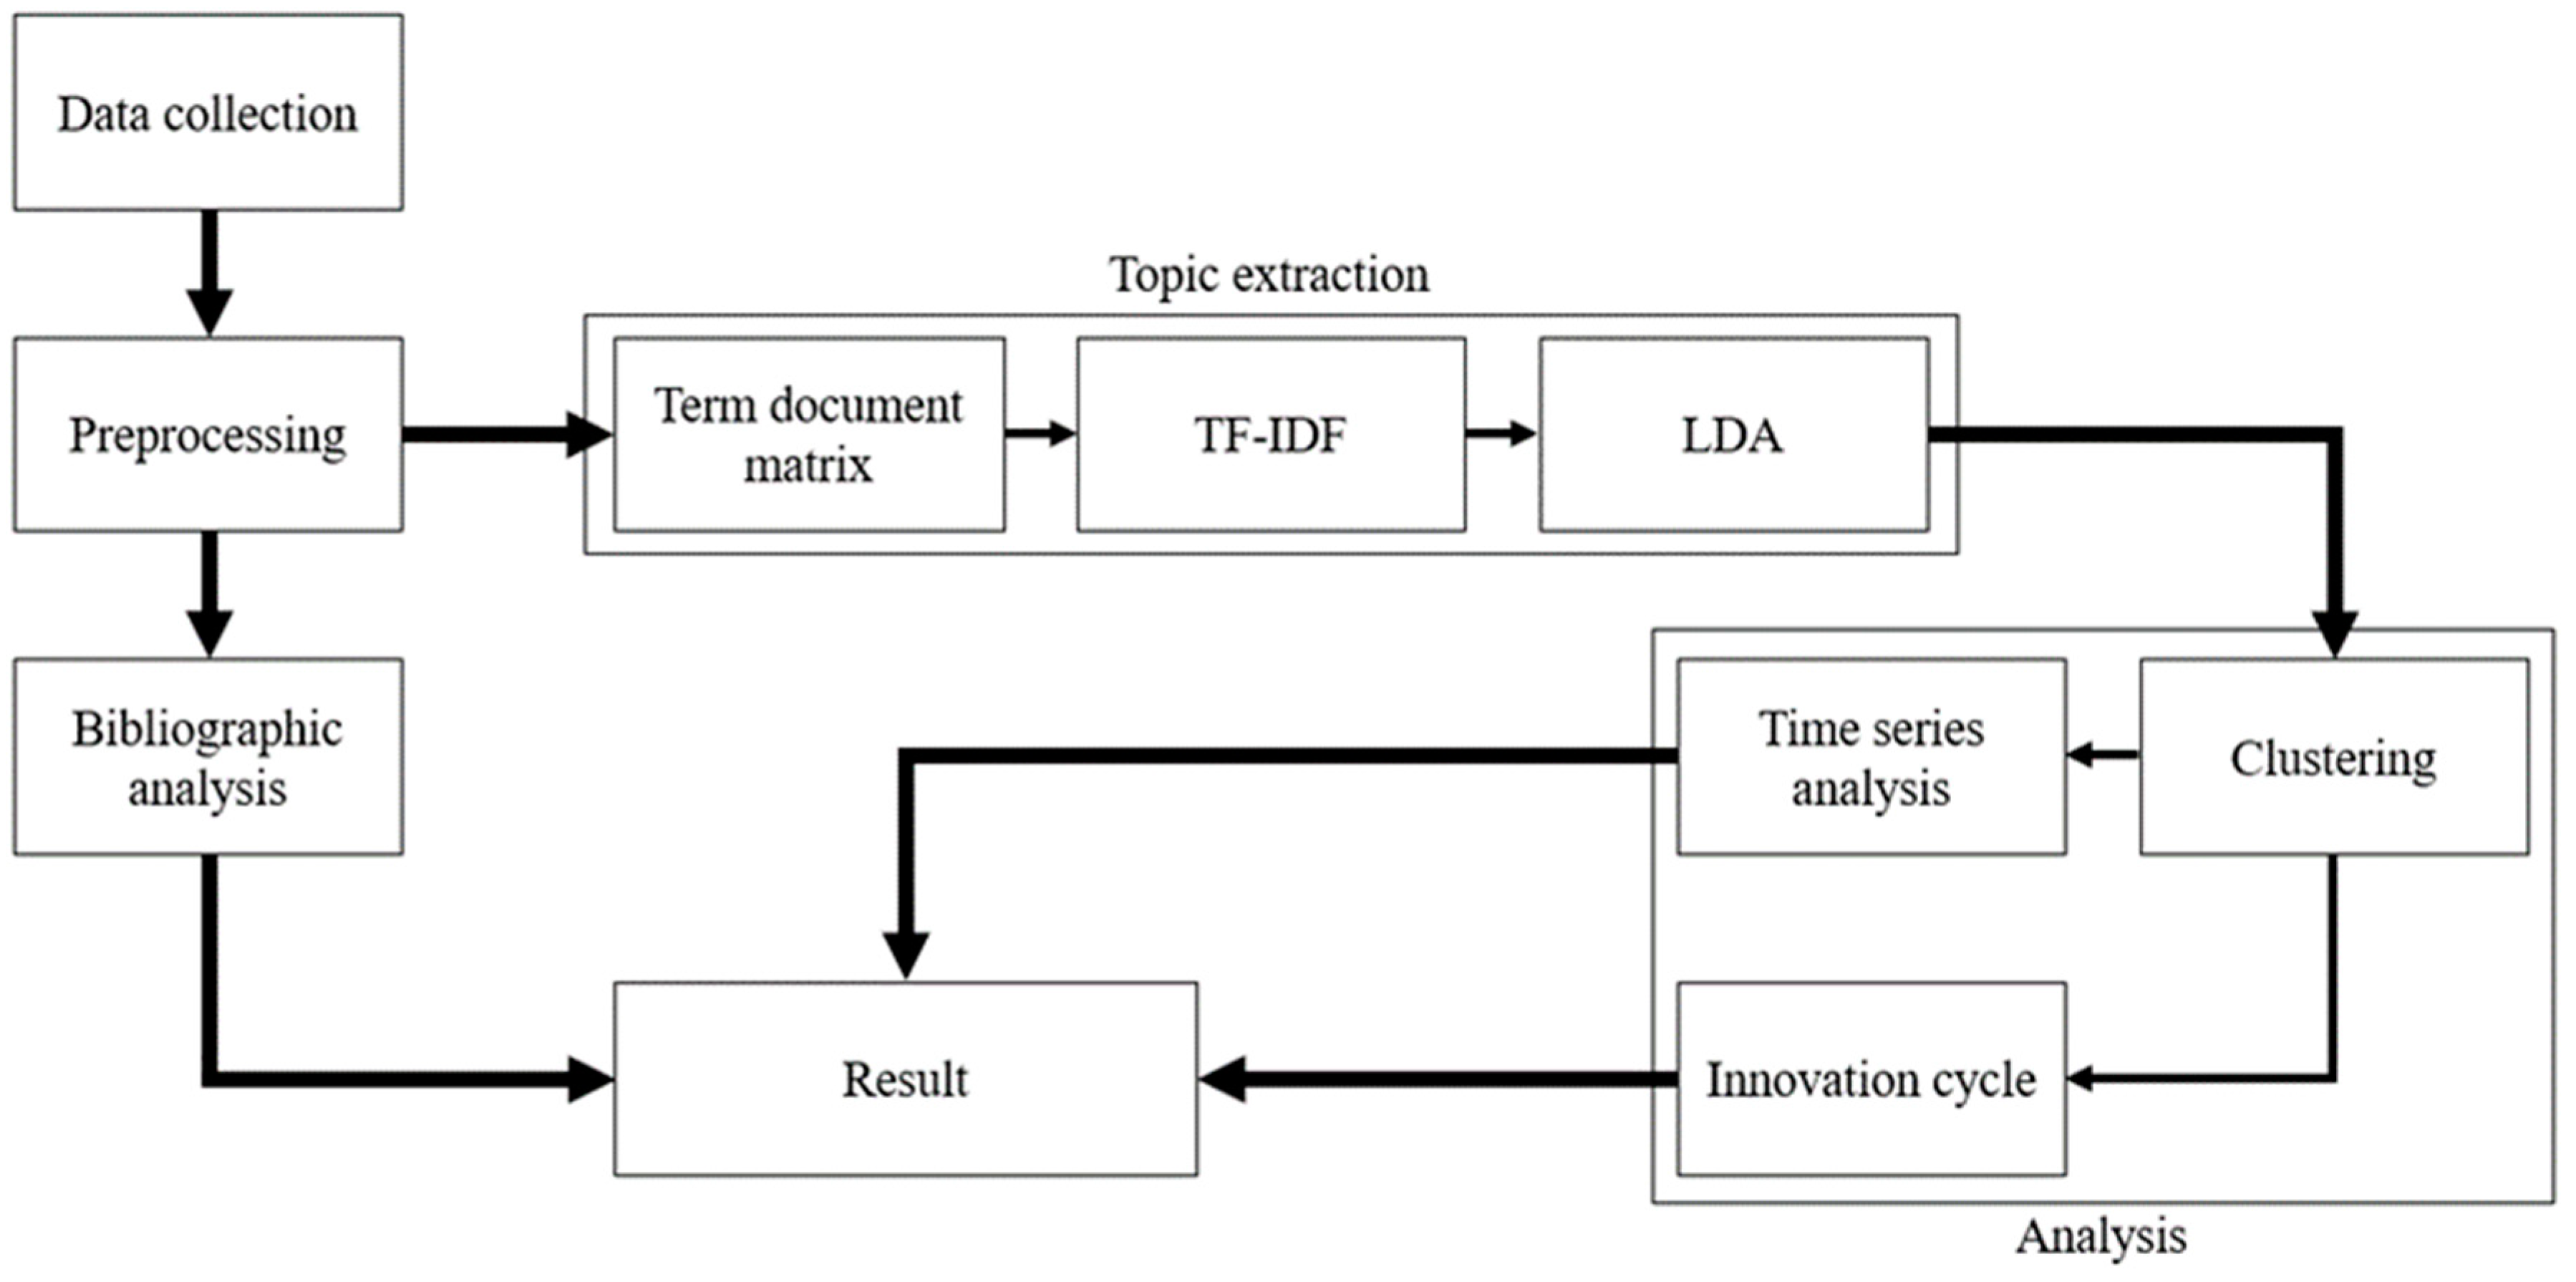
Figure 1. Research framework.
Sustainability 11 06240 g001
Figure 2. Innovation cycle of technology [102].
Sustainability 11 06240 g002
Figure 3. Number of WPT technology patents filed each year.
Sustainability 11 06240 g003
Figure 4. Number of WPT technology patents filed each year by each automotive company.
Sustainability 11 06240 g004
Figure 5. Silhouette values.
Sustainability 11 06240 g005
Figure 6. Exponential smoothing.
Sustainability 11 06240 g006
Figure 7. Innovation cycle of each subcluster.
Sustainability 11 06240 g007
Table 1. Summary of emerging and vacant technology forecasting studies.
AuthorMethodTechnologyDatabase
Altuntas et al. (2015) [45]- Weighted association rule- Database application
- Database theory
USPTO
Caviggioli (2016) [62]- Bibliometrics
- Duration model
- All fields of technologyEPO 1
Choi and Jun (2014) [60]- Bayesian learning
- Ensemble method
- Humanoid robot systemUSPTO
Daim et al. (2006) [27]- Bibliometrics
- Delphi method
- Growth curve
- Food safety
- Fuel cell
- Optical storage
USPTO
Joung and Kim (2017) [26]- Hierarchical clustering algorithm
- Keyword trend analysis
- TF-IDF
- Electrochemical glucose biosensorUSPTO
Jun et al. (2012) [39]- Association rule mining
- K-means clustering
- Time series analysis
- BiotechnologyUSPTO
Jun et al. (2012) [52]- K-medoids clustering
- Matrix map
- Support vector clustering
- Management of technologyUSPTO
Kim and Bae (2017) [56]- Bibliometrics
- K-means clustering
- Wellness careUSPTO
Kim et al. (2015) [59]- Latent Dirichlet allocation
- Principal component analysis
- Renewable energyUSPTO
Kyebambe et al. (2017) [50]- Supervised learning
- Technology cycle time
- All fields of technologyUSPTO
Lee et al. (2009) [53]- Patent map
- Principal component analysis
- Personal digital assistant (PDA)USPTO
Lee et al. (2018) [46]- Multilayer neural network- PharmaceuticalUSPTO
Song et al. (2017) [48]- Cosine similarity
- S-curve
- Braking systemJPO 2
Trappey et al. (2011) [40]- Patent content clustering
- Technology life cycle
- RFIDCNIPA
Yoon and Magee (2018) [54]- Generative topology mapping
- Link prediction
- 3D printing
- Nuclear fusion
- Water purification
USPTO
1 EPO (European Patent Office), 2 JPO (Japan Patent Office).
Table 2. Patent samples.
Application Number: 14/107220Title of InventionNonlinear system identification for optimization of wireless power transfer
ApplicantFiling DateMain IPC
Nucleus Scientific Inc.December 16th, 2013G01R-025/00
Abstract
A method of detecting whether a receiver coil is near a transmit coil in a wireless power transfer system (WPTS), the method involving: applying a pseudo-random signal to the transmit coil; while the pseudo-random signal is being applied to the transmit coil, recording one or more signals produced within the WPTS in response to the applied pseudo-random signal; by using the one or more recorded signals, generating a dynamic system model for some aspect of the WPTS; and using the generated dynamic system model in combination with stored training data to determine whether an object having characteristics distinguishing the object as a receiver coil is near the transmit coil.
Application Number: 14/362498Title of InventionMethod for the contactless charging of the battery of an electric automobile
ApplicantFiling DateMain IPC
Renault S.A.S.December 4th, 2012H02J-007/00
Abstract
A method for contactless charging of the battery of an electric automobile by magnetic induction using a transmitter coil of a charging device and a receiver coil of the vehicle, the method including: controlling a power supply of a converter, at terminals of which the transmitter coil is connected, according to a variable frequency; measuring, in an analog circuit, a value of a current and of a voltage at the terminals of the transmission coil; calculating a phase shift between the current and the voltage; converting the phase shift into a digital value; and locking the variable frequency of the converter to the phase-shift value by digital processing.
Application Number: 14/852795Title of InventionVehicle power-supplying system
ApplicantFiling DateMain IPC
IHI CorporationSeptember 14th, 2015B60L-011/18
Abstract
A vehicle power-supplying system that wirelessly supply power to a vehicle includes a power-supplying coil installed at a location at which the vehicle can be stopped, first and second positioning posts whose positional relationship with the power-supplying coil is fixed, a position-identifying means installed in the vehicle and configured to identify a positional relationship of the power-supplying coil with the vehicle by detecting the first and second positioning posts, and a traveling support means configured to support traveling of the vehicle to the power-supplying coil based on the positional relationship with the power-supplying coil identified by the position-identifying means.
Table 3. Top ten applicants filing patents in WPT technology.
RankApplicantIndustryNumber of patents filed (patent share)
1Toyota Motor Corporation (TMC)Automotive123 (8.69%)
2Qualcomm IncorporatedICT63 (4.45%)
3Hyundai Motor CompanyAutomotive35 (2.47%)
4DENSO CorporationAutomotive34 (2.40%)
5Ford Motor CompanyAutomotive32 (2.26%)
6Nissan Motor Co., Ltd.Automotive31 (2.19%)
7Honda Motor Co., Ltd.Automotive27 (1.91%)
8IHI CorporationHeavy industry23 (1.62%)
9General Motors (GM)Automotive19 (1.34%)
10Delphi TechnologiesAutomotive18 (1.27%)
WiTricity CorporationElectronics
Table 4. Part of the constructed term-document matrix.
TermDoc1Doc2Doc3Doc4Doc5Doc6Doc7Doc8Doc9Doc10
Batteri2830040000
Communic5115231010
Current1000000000
Devic2000514410
Dure1000000000
Electr1020060000
Emerg4000000000
Even1001000000
Execut1000000000
Finish1000000000
Table 5. Part of the result after applying TF-IDF.
TermDoc1Doc2Doc3Doc4Doc5Doc6Doc7Doc8Doc9Doc10
Batteri0.090.300.10000.110000
Communic0.160.030.020.130.050.060.0200.060
Current0.07000000000
Devic0.050000.090.010.050.050.050
Dure0.13000000000
Electr0.0300.04000.100000
Emerg0.45000000000
Even0.11000.10000000
Execut0.10000000000
Finish0.17000000000
Table 6. Top ten keywords of the two clusters.
ClusterKeyword
Cluster 1 (882 patents)Reception, energy, magnetic, portion, position, primary, transfer, electromagnetic, transmitter, source
Cluster 2 (534 patents)Controller, circuit, plurality, sensor, transmitter, non-contact, communications, method, voltage, remote
Table 7. IPC sections.
SectionTitle
AHuman necessities
BPerforming operations, transporting
CChemistry, metallurgy
DTextiles, paper
EFixed constructions
FMechanical engineering, lighting, heating, weapons, blasting
GPhysics
HElectricity
Table 8. Result of the clustering.
ClusterSubclusterIPC SectionSubtotalTotal
ABCDEFGH
118.3152.71.003.39.59.339.9224882
203.20000170.34.5178
30.456.5000.71.312.4408.8480
2101.5000.21.0146.98.4158534
20.816.7000.31.83.2241.1264
34.482.1004.83.03.014.7112
Table 9. Top ten keywords of the subclusters.
ClusterSubclusterDominant IPC SectionKeyword
11BCharging, reception, transmitting, transmission, resonator, electromagnetic, control, vehicle, apparatus, battery
2GNetwork, module, signal, wireless, USB 1, GPS 2, remote, tire, electronic, interface
3HCoil, electric, receiving, energy, magnetic, transfer, primary, plurality, circuit, antenna
21GControl, signal, battery, controller, speed, memory, apparatus, remote, circuit, plurality
2HCoil, charging, signal, wireless, electric, control, resonator, primary, voltage, electromagnetic
3BNon-contact, heat, induction, detection, module, parking, transfer, pressure, remote, output
1 USB (Universal Serial Bus), 2 GPS (Global Positioning System)
Table 10. Summary of analyses.
SubclusterClusteringTime seriesInnovation cycle
Subcluster 1-1UnderdevelopedDevelopment stageLevel 1-2
Subcluster 1-2UnderdevelopedDecline stageLevel 4
Subcluster 1-3Well-developedGrowth stageLevel 2
Subcluster 2-1UnderdevelopedDecline stageLevel 4
Subcluster 2-2Well-developedMaturity stageLevel 3
Subcluster 2-3UnderdevelopedDevelopment stageLevel 1