Article

Performance Evaluation and Comparison of Modified Spectral Mixture Analysis Method for Different Images of Landsat Series Satellites

1
School of Surveying and Land Information Engineering, Henan Polytechnic University, Jiaozuo 454000, China
2
School of Surveying and Geo-informatics, North China University of Water Resources and Electric Power, Zhengzhou 450045, China
3
The Yellow River Institute of Science, North China University of Water Resources and Electric Power, Zhengzhou 450045, China
4
School of Water Conservancy, North China University of Water Resources and Electric Power, Zhengzhou 450045, China
5
School of Environmental Science and Spatial Informatics, China University of Mining and Technology, Xuzhou 221116, China
*
Author to whom correspondence should be addressed.
Sustainability 2019, 11(22), 6227; https://doi.org/10.3390/su11226227
Submission received: 4 October 2019 / Revised: 29 October 2019 / Accepted: 5 November 2019 / Published: 7 November 2019
(This article belongs to the Section Sustainability in Geographic Science)

Abstract

:
Urban impervious surface is considered one of main factors affecting urban heat island and urban waterlogging. It is commonly extracted utilizing the original linear spectral mixture analysis (LSMA) model. However, due to the deficiencies of this method, many improvements and modifications have been proposed. In this paper, a modified dynamic endmember linear spectral mixture analysis (DELSMA) model was introduced and tested in Zhengzhou, China, using different images of Landsat series satellites. The accuracy and performance of DELSMA model was evaluated in terms of R M S E , r and R 2 . Results show that (1) the DELSMA model performed equally well for Landsat-5 Thematic Mapper (TM) and Landsat-7 Enhanced Thematic Mapper (ETM+) images, and obtained better accuracy by using Landsat-8 Operational Land Imager (OLI) than Landsat TM/ETM+; (2) the DELSMA model achieved a better performance than the original LSMA model consistently, using images of Landsat from different sensors. Based exclusively on the overall accuracy reports, the DELSMA model proved to be a more efficient method for extracting impervious surface. Our study will provide a reliable method of impervious surface estimation for the urban planner and management in monitoring urban expansion, revealing urban heat island, and estimating urban surface runoff, using time-series Landsat imagery.

1. Introduction

Urban impervious surface refers to the land cover surface which are made up of various impervious materials to prevent moisture seepage, mainly including roads, parking lots, roofs and squares etc. [1,2]. Over the past few decades, China has experienced unprecedented rapid urbanization, and the urban land use structure has been influenced and altered significantly. Impervious surfaces have become one of the most important type of land use/land cover changes that occur during the urbanization process [3]. However, the rapid increase in the impervious surface area leads to an increased risk of serious environmental problems, including urban heat island effects [4,5,6,7], rainstorm waterlogging [8,9], and water quality deterioration [10,11,12]. The spatial distribution of impervious surface is not only an important characteristic of the urbanization process, but also a critical indicator for urban ecological environment quality evaluation [13,14,15]. Thus, accurate time-series impervious surface extraction and mapping at higher precision are relevant to the research of urban expansion and sustainable development.
Remote sensing technology has become an important method, to effectively extract impervious surface due to its fast, large coverage, and reproducible ground observation advantage [16]. For the study of time-series impervious surface remote sensing, Landsat imagery is still the main data source because of its long time span, moderate resolution, and easy access [17,18,19,20]. However, because of the heterogeneity of urban land covers and the limitation in spatial resolution, the presence of mixed pixels has been recognized as a major problem in the analysis of medium spatial resolution images [21,22]. The spectral mixture analysis method has been used to decompose the proportion of endmembers of various features in each pixel, which can significantly improve the interpretation accuracy of medium resolution remote sensing images [23]. In spectral mixture analysis, the linear spectral mixture analysis (LSMA) is the most widely used method [24,25,26,27]. This method is based on the vegetation-impervious surface-soil (V-I-S) conceptual model, combined with the fully constrained least squares (FCLS) method for mixed pixel decomposition. Because of the LSMA model has a good theoretical basis and algorithm framework, and the remote sensing commercial software provides a practical tool to realize linear spectral decomposition, LSMA has become a widely used impervious surface remote sensing inversion method [16].
While the LSMA method is easy to use in estimating impervious surface, several problems still exist [21]. Firstly, every pixel in the image is unmixed into a fix set of endmembers, where some pixels may only contain a subset of endmembers. This could cause “excess” of endmember unmixing and lower the accuracy of impervious surface estimation, adopting the same number of endmembers for the entire image. Secondly, due to the interference of “heterogenous spectra of homologous objects” or “homologous spectra of heterogenous objects”, especially the similarity in spectral properties between impervious surface and bare soil, impervious surface tends to be overestimated in the areas with small amounts of impervious surface, but is underestimated in the areas with large amounts of impervious surface. To address those problems of the LSMA model, some new techniques based on this model have been proposed, including spatially adaptive spectral mixture analysis (SASMA) [28], prior-knowledge-based spectral mixture analysis (PKSMA) [29], segmentation-based and rule-based spectral mixture analysis (S-R-LSMA) [30], stratified spectral mixture analysis in spectral domain (SP-SSMA) [21], and dynamic endmember linear spectral mixture analysis (DELSMA) [31]. The pros and cons of these improved models are shown in Table 1. The performance of the above five improved models is better than the original LSMA model because they introduced spatial information to clip the whole image into sub-regions in the spectral mixture analysis. The shortcomings of the SASMA, PKSMA, and S-R-LSMA models are that pure endmembers are extracted from the entire image scene rather than each sub-region, and the with-class spectral variability is not considered. The SP-SSMA model selected endmembers from each sub-region independently to cope with the within class variability. Even though SP-SSMA markedly improved the accuracy of impervious surface estimation, confusion between impervious surface and soil in suburban areas is still a major concern. The DELSMA model improved the SP-SSMA model by introducing a simpler and more effective biophysical composition index (BCI) as the characteristic component of image stratification, maximizing distinction between impervious surface and bare soil [32]. In addition, the DELSMA model only contains two layers of bright and dark layers, which can reduce image fragmentation and the difficulty of selecting pure endmember. Considering the accuracy of the model, the simplicity of the calculation and the achievability of the operation, the application prospect of the DELSMA model is better than other models.
As one of the nine national central cities in China, Zhengzhou has experienced rapid urban growth. The urban population of Zhengzhou City increased from 1.25 to 5.23 million and the urbanization rate increased from 32.4% in 1978 to 73.4% in 2018. Population growth and socio-economic development have resulted in a significant increase in the amount of impervious surface areas. Previous studies have been conducted to analyze the spatio-temporal variations of urban growth and urban heat island over a long-time period, using the impervious surface estimated with remote sensing data in Zhengzhou [33,34,35]. However, the impervious surface are extracted by using the traditional classification method based on pixels, and the accuracy of impervious surface estimation needs to be improved. The DELSMA model is a new classification method based on sub-pixels, and can extract more accurate impervious surface distribution. The DELSMA model has been reported to perform better than the original LSMA model for Landsat-8 Operational Land Imager (OLI) images in the literature. Nonetheless, in consequence of the OLI sensor’s band number, the band spectral range and image radiation resolution are adjusted compared to Landsat-5 Thematic Mapper (TM) and Landsat-7 Enhanced Thematic Mapper (ETM+) sensors [36,37], and the applicability of the model for the TM/ETM+ images require experimental verification. In addition, the differences in the application performance of the DELSMA model for three different sensor images need to be further explored. This study provides a theoretical reference for the application of DELSMA in extracting impervious surfaces to monitor urban expansion and assess eco-environmental quality based on the DELSMA model, using time-series Landsat imagery.
In this study, we selected Zhengzhou as the study site and evaluate and compare the performance of the DELSMA model against the original LSMA model for extracting the impervious surface, using TM, ETM+, and OLI images. Specific objectives are as follows: (1) to verify the applicability of the DELSMA model to the images acquired by TM and ETM+ sensors; (2) to extract the impervious surface with the DELSMA and LSMA models, using Landsat series images respectively; and (3) to compare the performance of DELSMA model against the original LSMA model for TM, ETM+, and OLI images.

2. Materials and Methods

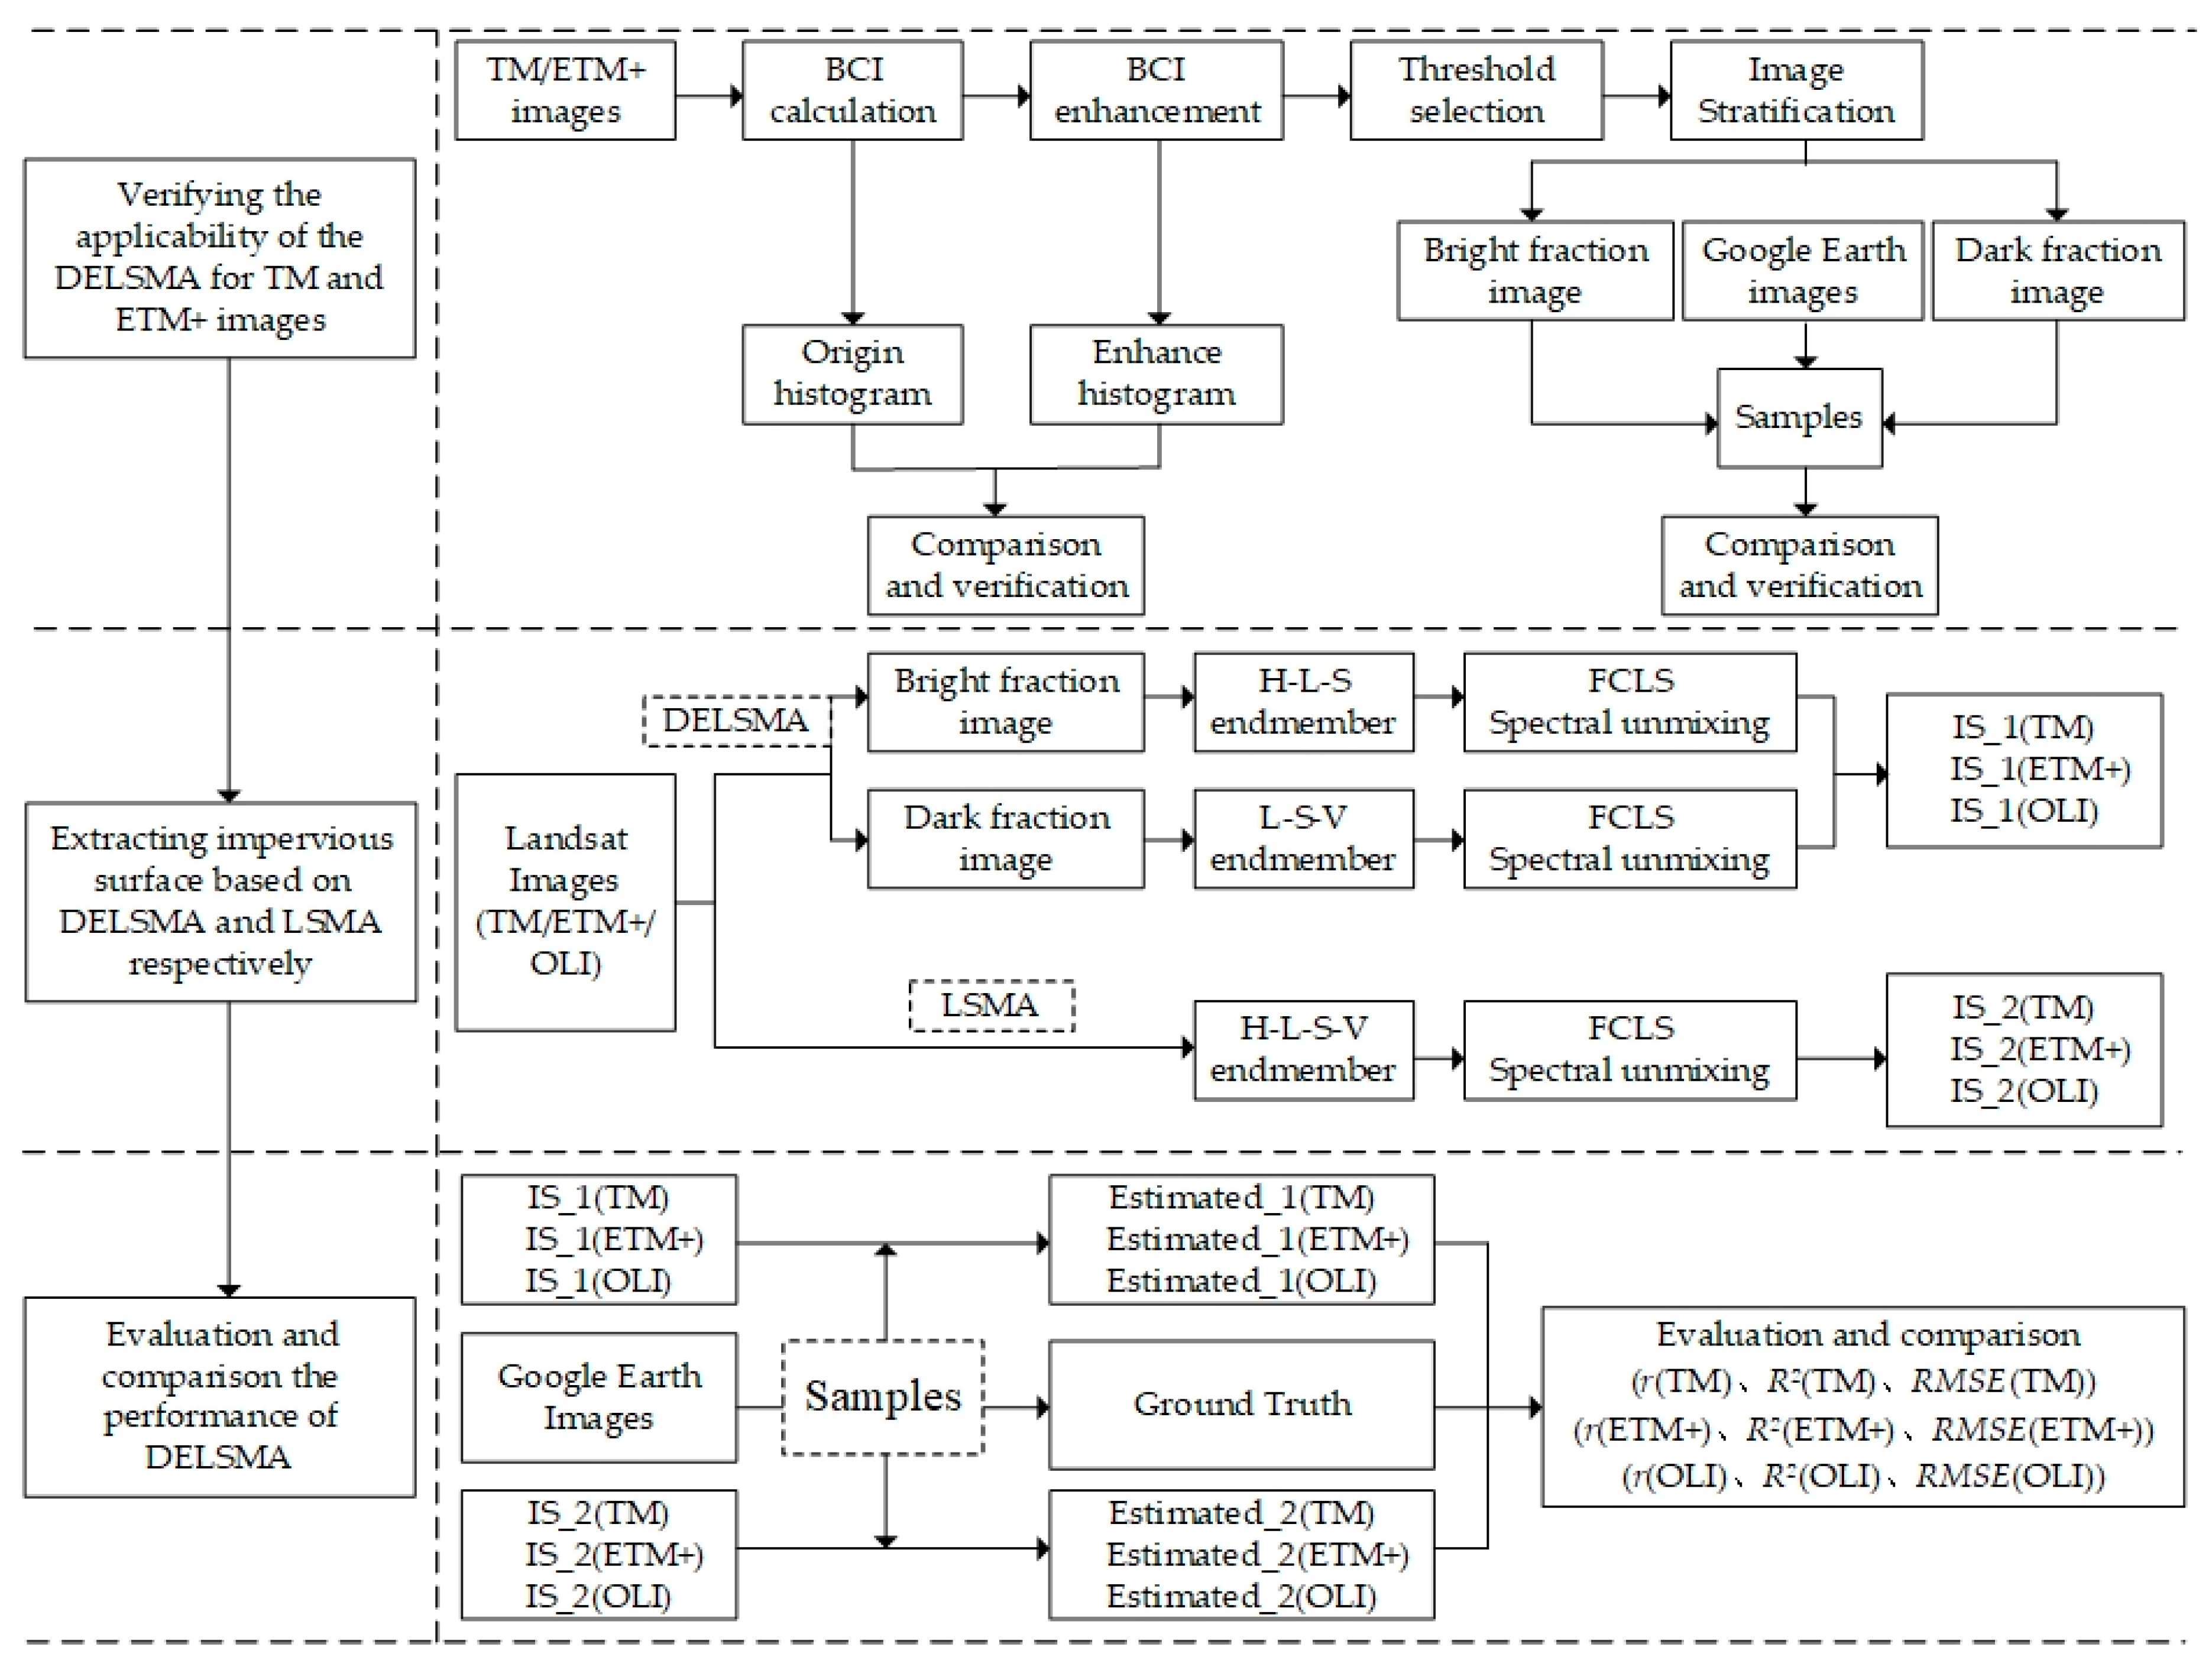
2.1. Research Scheme

First, the applicability of DELSMA model for TM and ETM+ images was verified through contrastive analysis. Then, the impervious surfaces of different periods were estimated based on the DELSMA and LSMA model respectively, using TM, ETM+, and OLI images. The actual impervious surfaces as a reference were extracted using the corresponding Google Earth images. Finally, root mean square error ( R M S E ), correlation coefficient ( r ) and goodness of fit ( R 2 ) were adopted to assess the accuracy of impervious surface between the estimated and actual impervious surface. Figure 1 illustrates the major steps of the framework.

2.2. Data

The Landsat series of satellites is the earliest land resource satellite. The latest generation of Landsat 8 satellites not only maintains the basic features of Landsat 7 and Landsat 5, but also has several new characteristics. These include adding two spectral bands (deep blue and cirrus bands), refining spectral range of some bands of Landsat 7 and Landsat 5, splitting one thermal band to two bands, and improving radiometric resolution from 8 bits to 16 bits. The study found that the basic parameters of the OLI sensor were adjusted compared to TM and ETM+ sensors, and the image quality was improved [36]. The parameter comparison is shown in Table 2.
In this study, three images from TM, ETM+, and OLI sensors, were selected to extract impervious surface and evaluate the performance of the DELSMA model. All the remote sensing data of Zhengzhou were freely downloaded from the United States Geological Survey website (USGS, https://earthexplorer.usgs.gov/). Preprocessing operations include geometric correction, radiation calibration, and atmospheric correction, to eliminate the influence of atmospheric and illumination factors on terrain reflection and obtain terrain reflectivity. The vector data is from the vector map of Zhengzhou administrative boundary. In order to evaluate the accuracy of impervious surface estimation, the corresponding Google Earth images, which were generated near the acquisition date of TM, ETM+, and OLI images respectively, were used as the ground reference. The details of data used in the present work are shown in Table 3.

2.3. Methods

2.3.1. DELSMA Model

The DELSMA model consists of image stratification, endmember selection, and linear spectral mixture analysis (LSMA) [31]. These steps are detailed below.
Image stratification technology introduces the idea of feature extraction into subpixel unmixing. First, the original BCI is calculated to distinguish impervious surface, vegetation, and soil preliminarily, using Equation (1). In BCI, impervious surface is positively correlated with its value and is greater than zero, vegetation is negatively correlated with its value and less than zero, and the gray value of soil is close to zero [38,39]. Then, a transformation was utilized to improve the separability between different land cover types [40]. The grayscale image of BCI was enhanced by adopting Equations (2) and (3). Finally, according to the threshold calculation method of OTSU [41], the enhanced intensity map was used to stratify the whole image into bright and dark fraction images based on Equation (4).
B C I = ( H + L ) / 2 V ( H + L ) / 2 + V   ,
where H is the normalized T C 1 component, V is the normalized T C 2 component and L is the normalized T C 3 component. T C i ( i = 1 , 2 , 3 ) is the first three components of the tasseled cap transformation ( TCT ).
B C I e n h = ρ B C I o r i   ,
ρ = 1 π a r c tan [ λ π ( B C I o r i θ ) ] + 0.5   ,
here B C I o r i is the normalized original feature component with a value range of [0–1]; B C I e n h is the enhanced feature component with a value range of [0–1]; ρ is the conversion coefficient of image transformation with a value range of [0–1]; λ is the sensitivity factor with a value of 20; θ is the average value of the target terrain to be enhanced with the normalized original feature component with a value of 0.5.
g = M a x 0 < T < 1 σ T 2 = ω 0 ( μ 0 μ ) 2 + ω 1 ( μ 1 μ ) 2   ,
where ω 0 = i = 1 T p i , ω 1 = i = T + 1 m p i , μ 0 = i = 1 T i p i / ω 0 , μ 1 = i = T + 1 m i p i / ω 1 , μ = ω 0 μ 0 + ω 1 μ 1 . Assuming T changed from 0 to 1, traversal algorithm is used to find the corresponding value σ T 2 of each T , and the T corresponding to the largest inter-class variance g is the optimal threshold obtained by the OTSU algorithm.
Endmember extraction is critical [42,43,44]. In this study, endmembers were selected in each layer independently, rather than from the entire image, to achieve more adaptive spectral characters. First, the image is transformed by minimum noise fraction (MNF), and all the data information of the image is concentrated in the first few components, so as to reduce the dimensionality of the data and separate the noise so as to eliminate the correlation between bands [23,45]. Then, calculating the pixel purity index (PPI) from the MNF component image. The PPI is the most representative interactive endmember extraction algorithm and is widely used due to its publicity and availability [46]. Finally, the endmembers of different land cover types are selected from these pure pixels by comparing with the corresponding Google Earth images.
The LSMA method assumes that the spectral brightness values of mixed pixels are a linear combination of the spectral brightness values of the basic components of the mixed pixels, which are also called endmembers. By calculating the composition ratio of each endmember in the mixed pixel, the spectrum of the mixed pixels can be unmixed into a linear combination of various endmember spectra [23,24]. The LSMA with full abundance constraints can be expressed as:
R b = i = 1 N f i R i , b + e b   ,
where, R b is a mixed pixel’s reflectance at band b ; R i , b is the reflectance of endmember i at band b ; N is the number of endmembers; f i is the fraction of endmember i ; and e b is the standard residual. Equation (5) is solved by the least square method, and the estimated fractions of the endmembers are commonly constrained using the following equation:
i = 1 N f i = 1   a n d   f i 0   ,

2.3.2. Accuracy Assessment
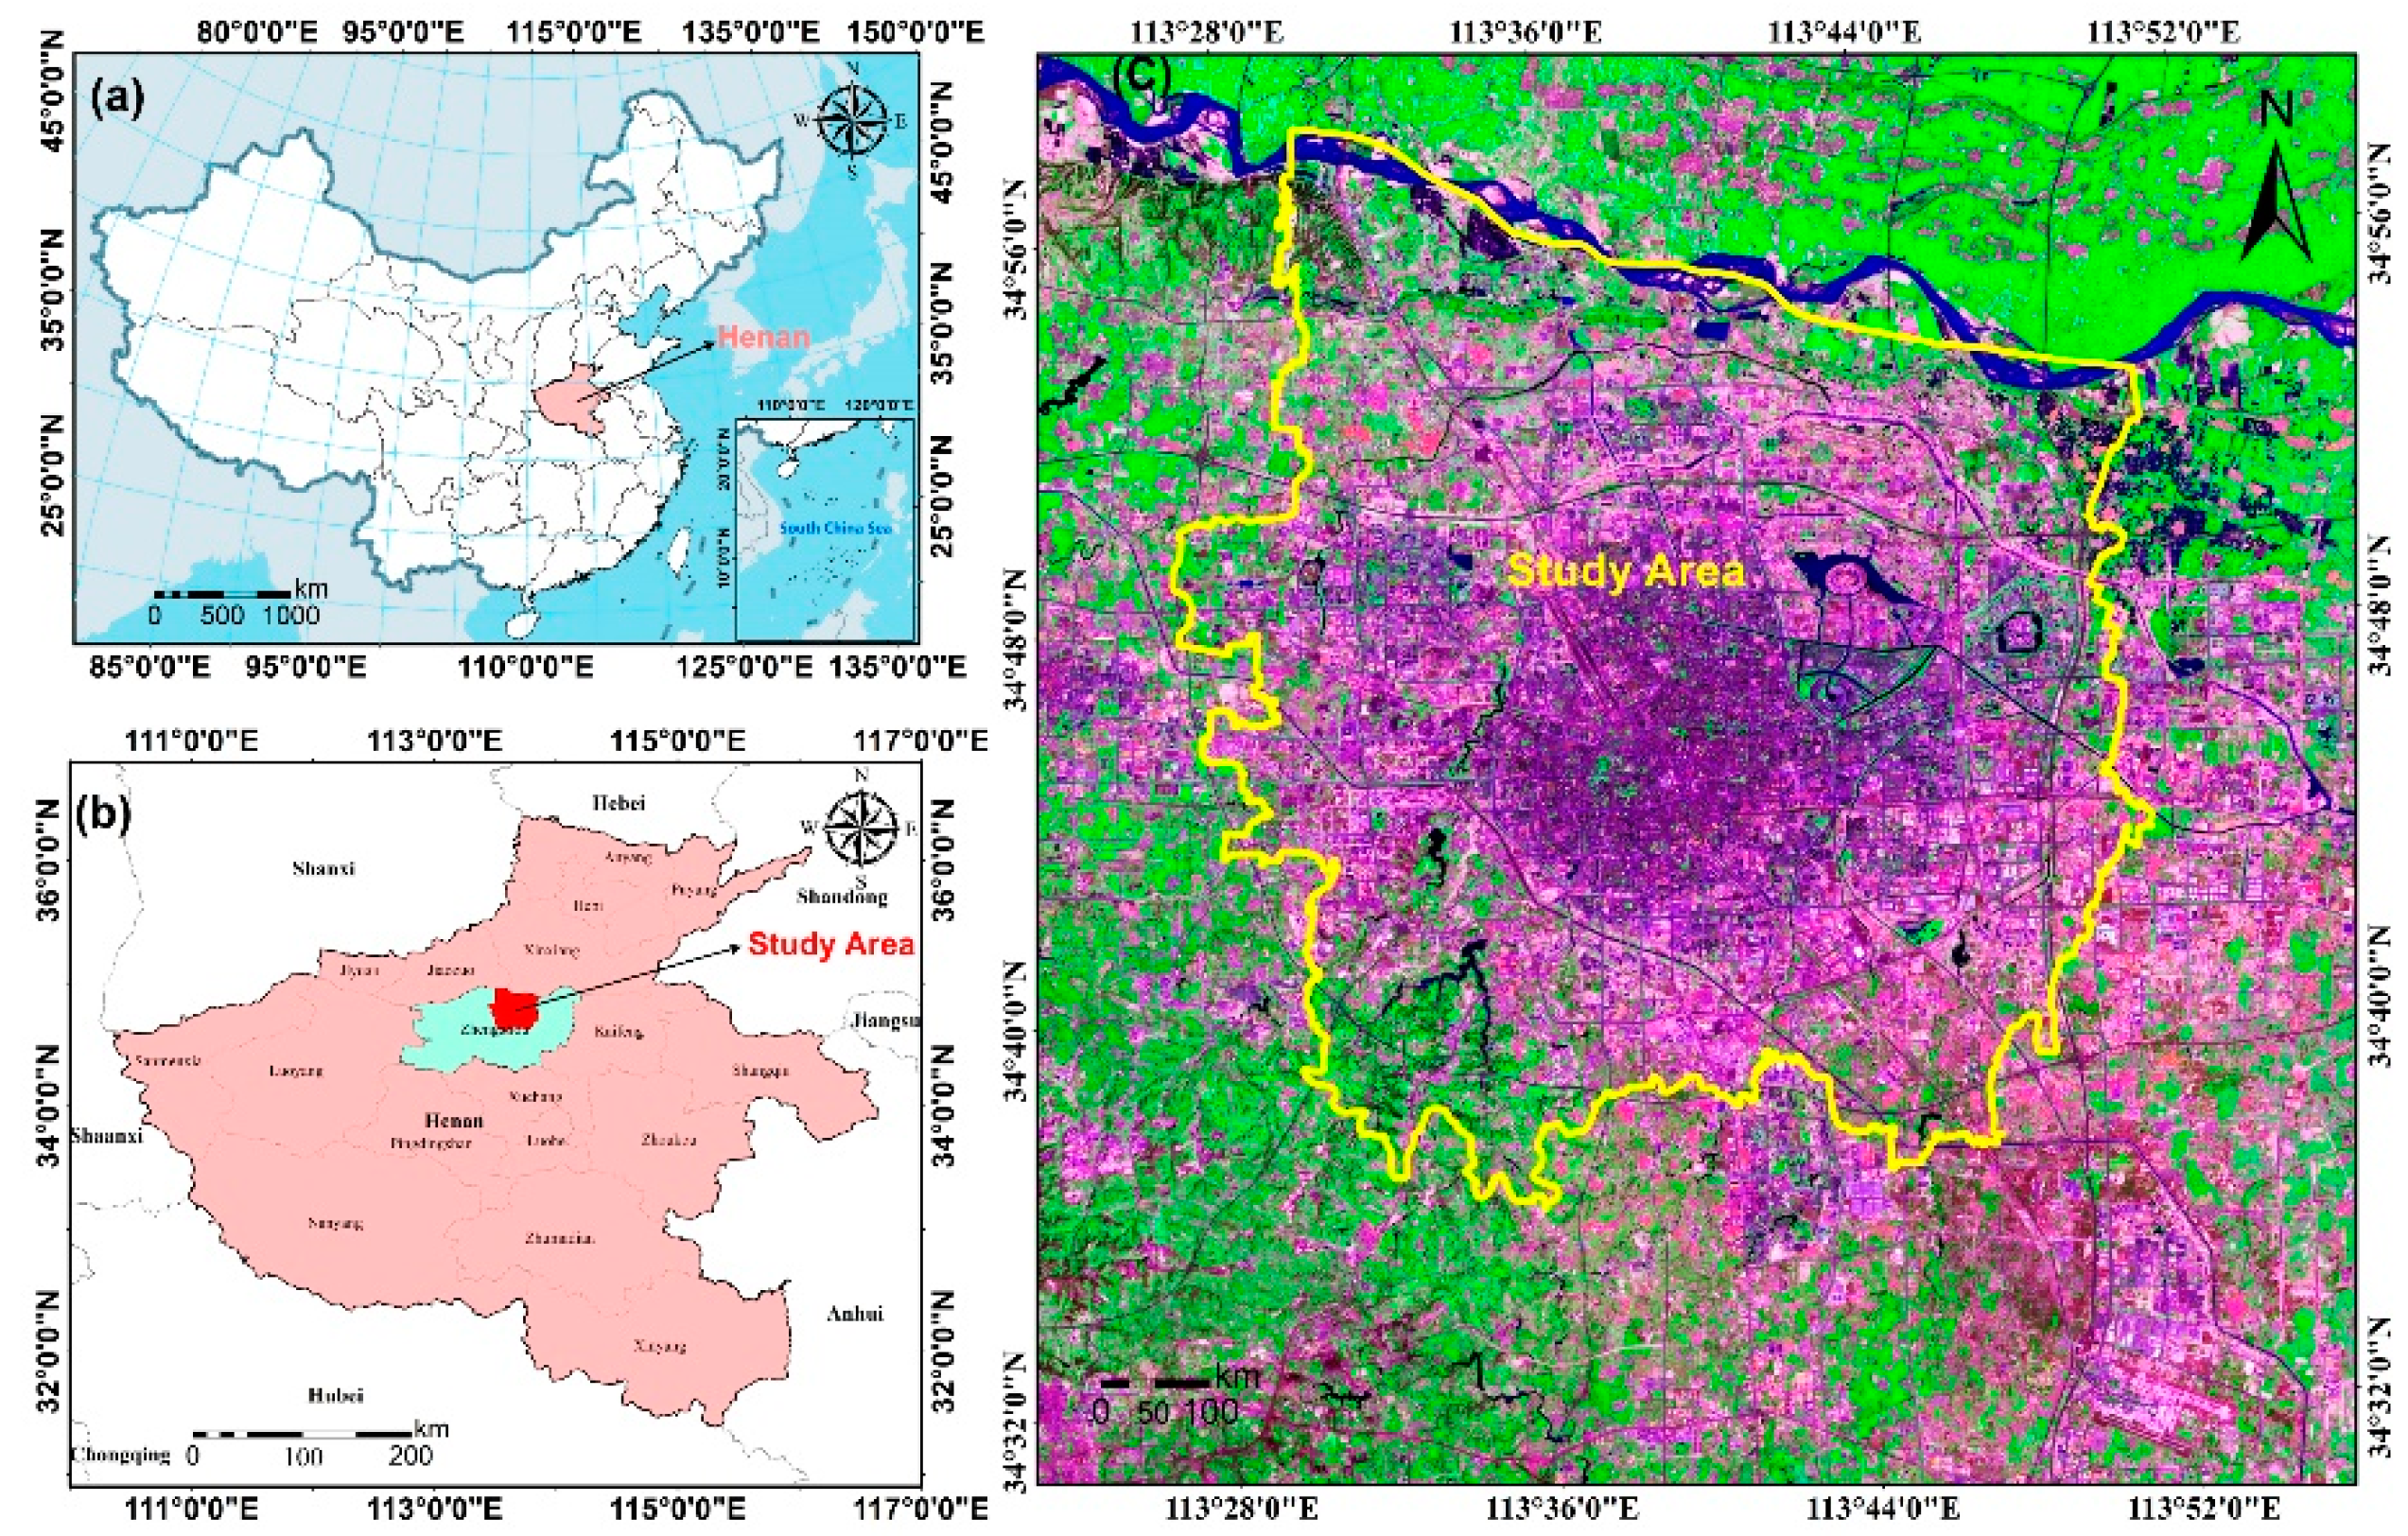
In order to evaluate and compare the performance of impervious surface estimation of DELSMA, comparative analysis is performed with original LSMA, using time-series Landsat imagery. In this study, a random sampling method was applied. First, 100 samples were chosen randomly and evenly in the image. A sampling unit of 3 × 3   ( 90   m × 90   m ) pixels was used to avoid the effects of geometric errors of Landsat and Google Earth images. Then, the estimated value was counted from the average value of the impervious surface in a sampling unit. For every sampled 3 × 3 Landsat pixel, the corresponding Google Earth image was digitized and the true value was calculated from the digitized map. Finally, the 2D scatter plots was drawn based on estimated and the real value, and the methods of residual analysis and linear regression analysis were utilized. Three quantitative criteria were adopted to assess the accuracy of impervious surface abundance modeled by DELSMA and LSMA. These criteria are widely used in performance evaluation of impervious surface extraction models and are expressed as follows [23,31,47,48]:
R M S E = 1 N i = 1 N ( y i x i ) 2   ,
r = i = 1 N ( x i x ¯ ) ( y i y ¯ ) i = 1 N ( x i x ¯ ) 2 · i = 1 N ( y i y ¯ ) 2   ,
R 2 = i = 1 N ( y i x ¯ ) 2 i = 1 N ( x i x ¯ ) 2   ,
where x i is the true impervious surface proportion derived from Google Earth of pixel i ; y i is the estimated impervious surface fraction of sample i using models; x ¯ is the mean true value of the samples; y ¯ is the mean estimation value of the samples; and N is the mean true value of the samples.

2.4. Study Area

Zhengzhou is the capital of Henan Province, and located in the north of central Henan Province, in China. It is in the transition zone between the Funiu mountains and the Huanghuai plains and belongs to a typical inland plain city. By the end of 2018, Zhengzhou city included six districts, five county-level cities and one county. The total area of the city is 7446 km2, with a total population of 10.14 million and gross domestic product (GDP) of 14.41 billion USD. Note that the districts of Erqi, Zhongyuan, Jinshui, Guancheng, and Huiji compose the central urban area according to the Zhengzhou City Master Plan (2010–2020). So the five administrative districts of Zhengzhou were selected for this study as they are more urbanized than other districts (Figure 2). The study area is located between 113°28′–113°52′ E longitudes and 34°36′–34°58′N latitudes, the area is 1016 km2 and the population is 5.23 million. The terrain trends toward higher terrain in the southwest and lower terrain in the northeast, and shows a ladder-like decline. This city is part of the north temperate zone continental monsoon climate and the average temperature is approximately 14.4 ℃, with the annual average precipitation is 640.9 mm, and the average annual sunshine time is 2292 h. Zhengzhou City is the only “double cross” center in the national railway network, and one of the nine national central cities in China. It has become an important node city for the “One Belt, One Road” development strategy. Due to its special geographical location and the support of national policies, Zhengzhou has experienced unprecedented rapid urbanization in the past 40 years. The built-up area increased with an annual growth rate of 24.46% between 1978 and 2018, and the impervious surface area increased significantly. Therefore, it is important for accurate extraction of impervious surfaces of Zhengzhou in different periods, to better reveal its urbanization process and guide its sustainable development.

3. Results

3.1. Model Verification of DELSMA

Image stratification technology is the key to distinguish the DELSMA model from the original LSMA model. The applicability of the LSMA model for Landsat series satellites and the applicability of the DELSMA model for OLI images have been verified and reported. Therefore, this study mainly verified the applicability of image stratification technology for TM and ETM+ images.

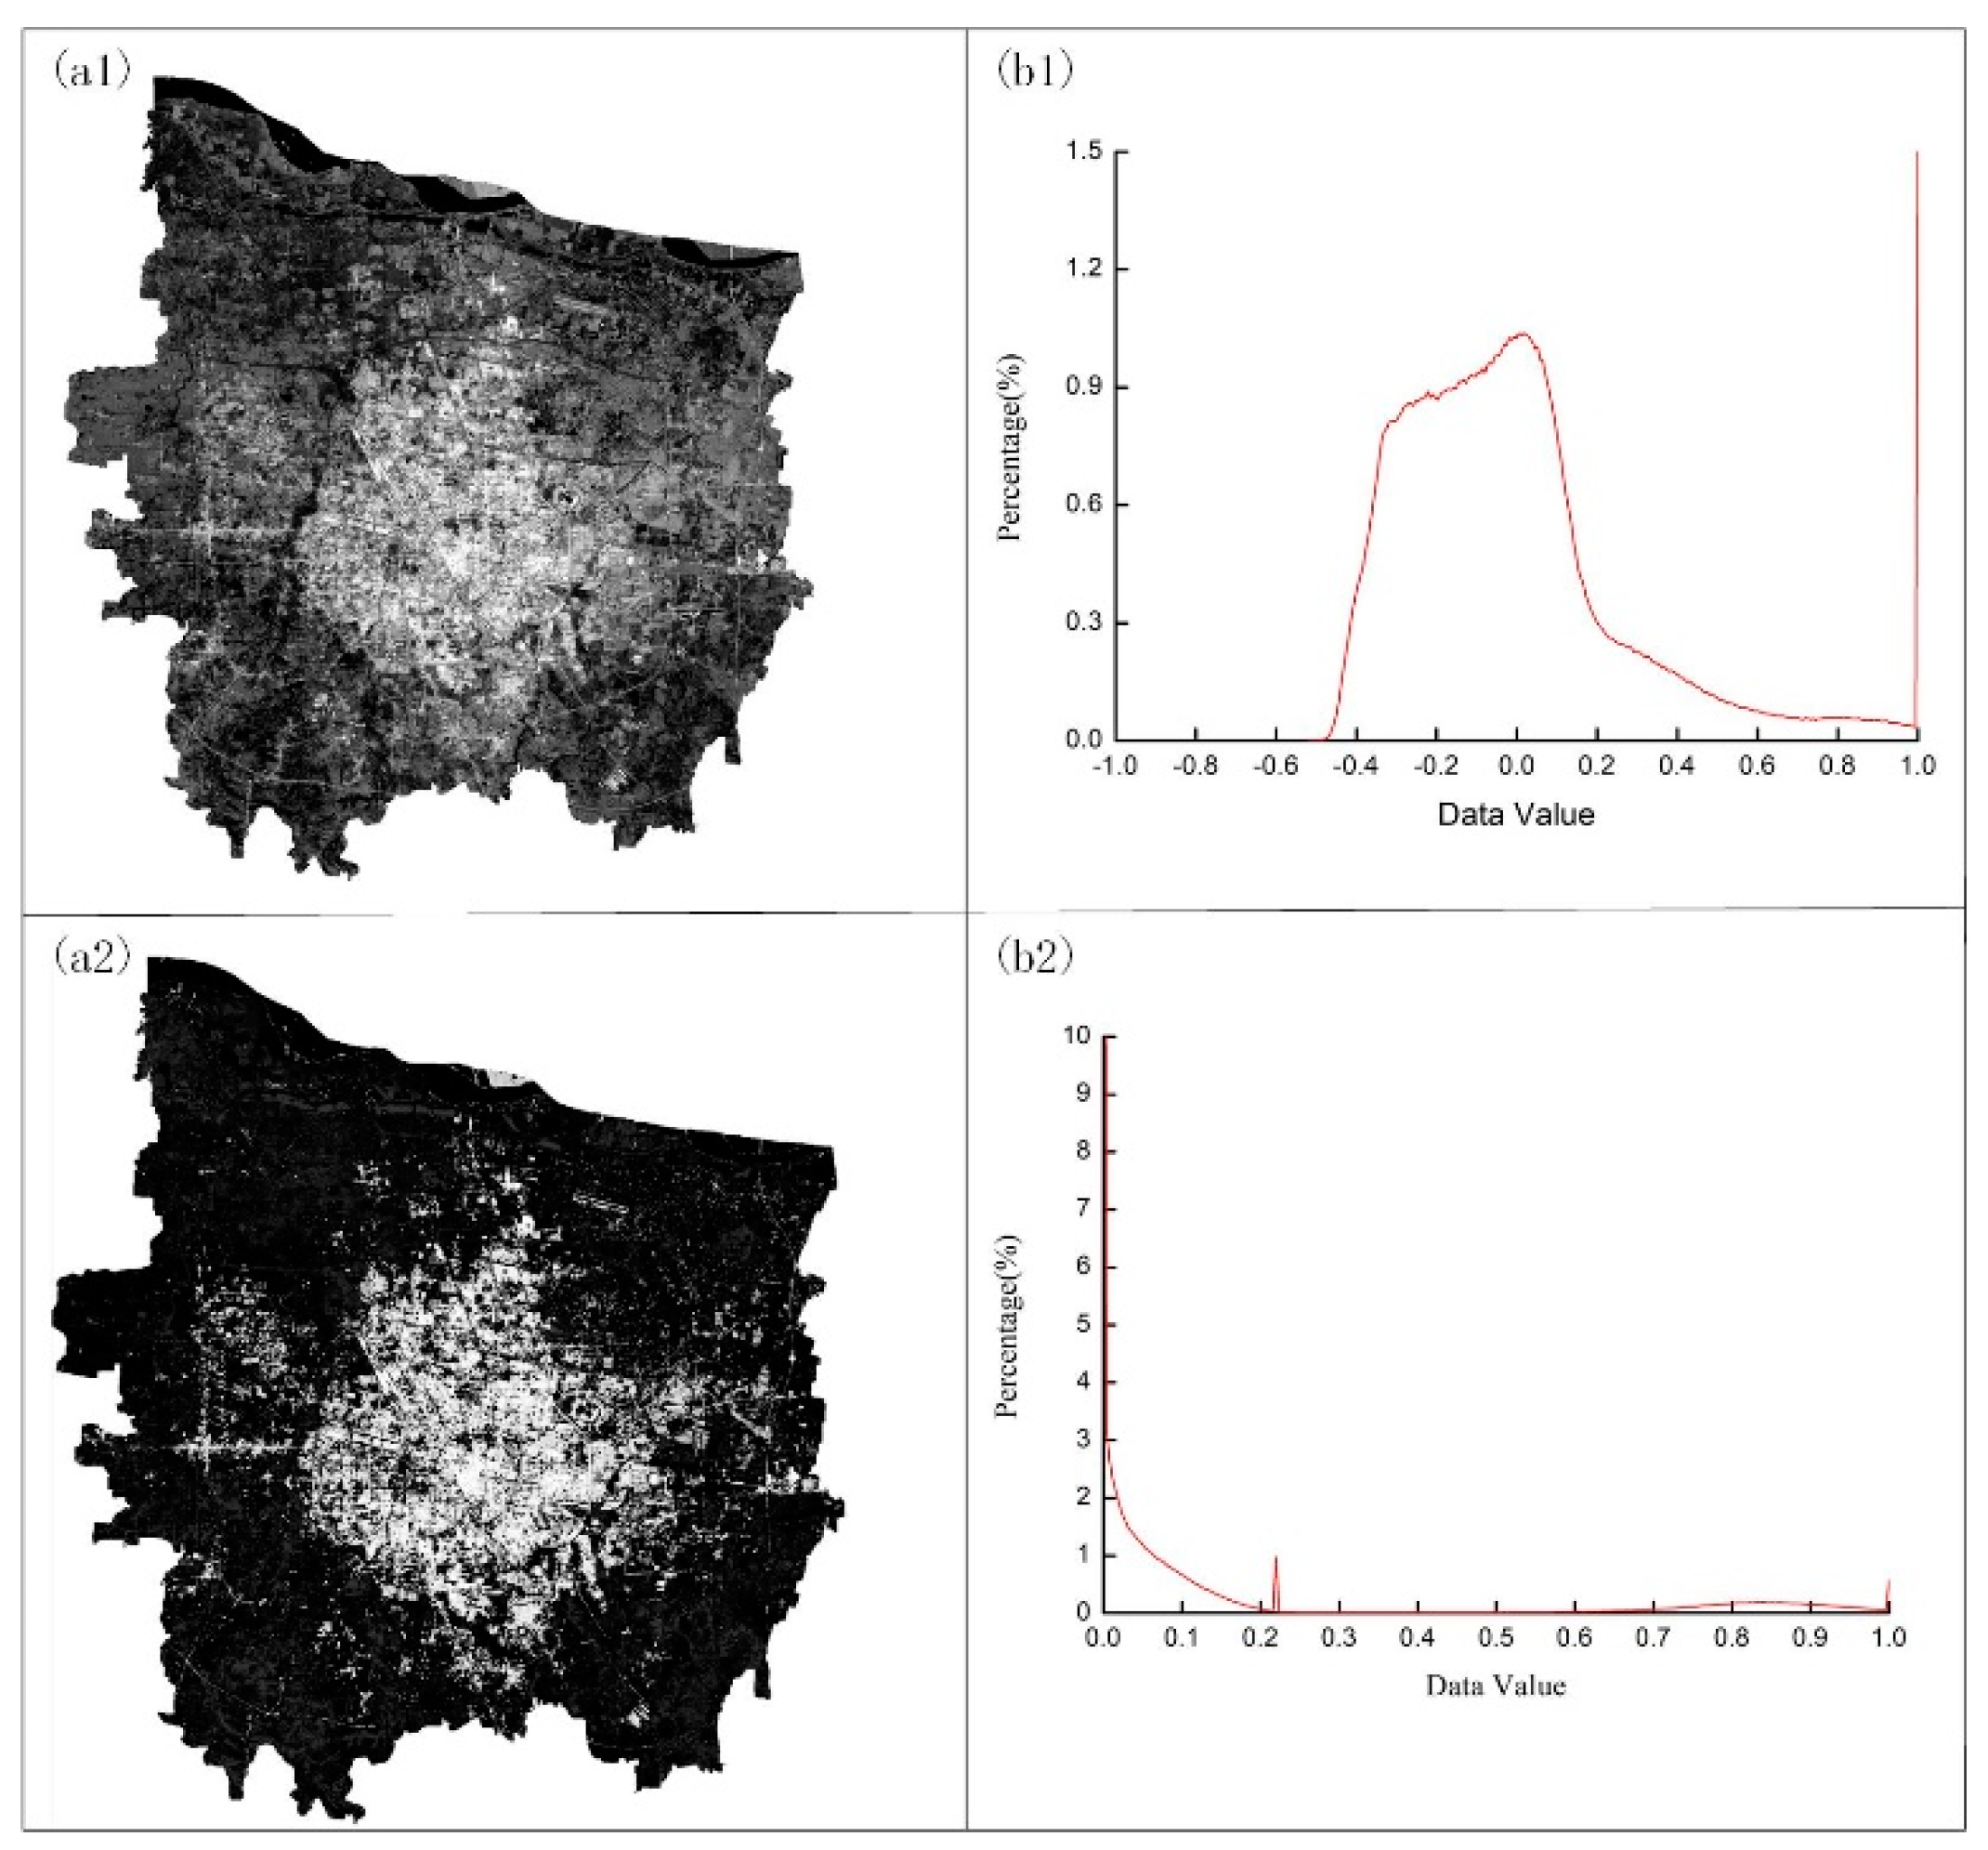
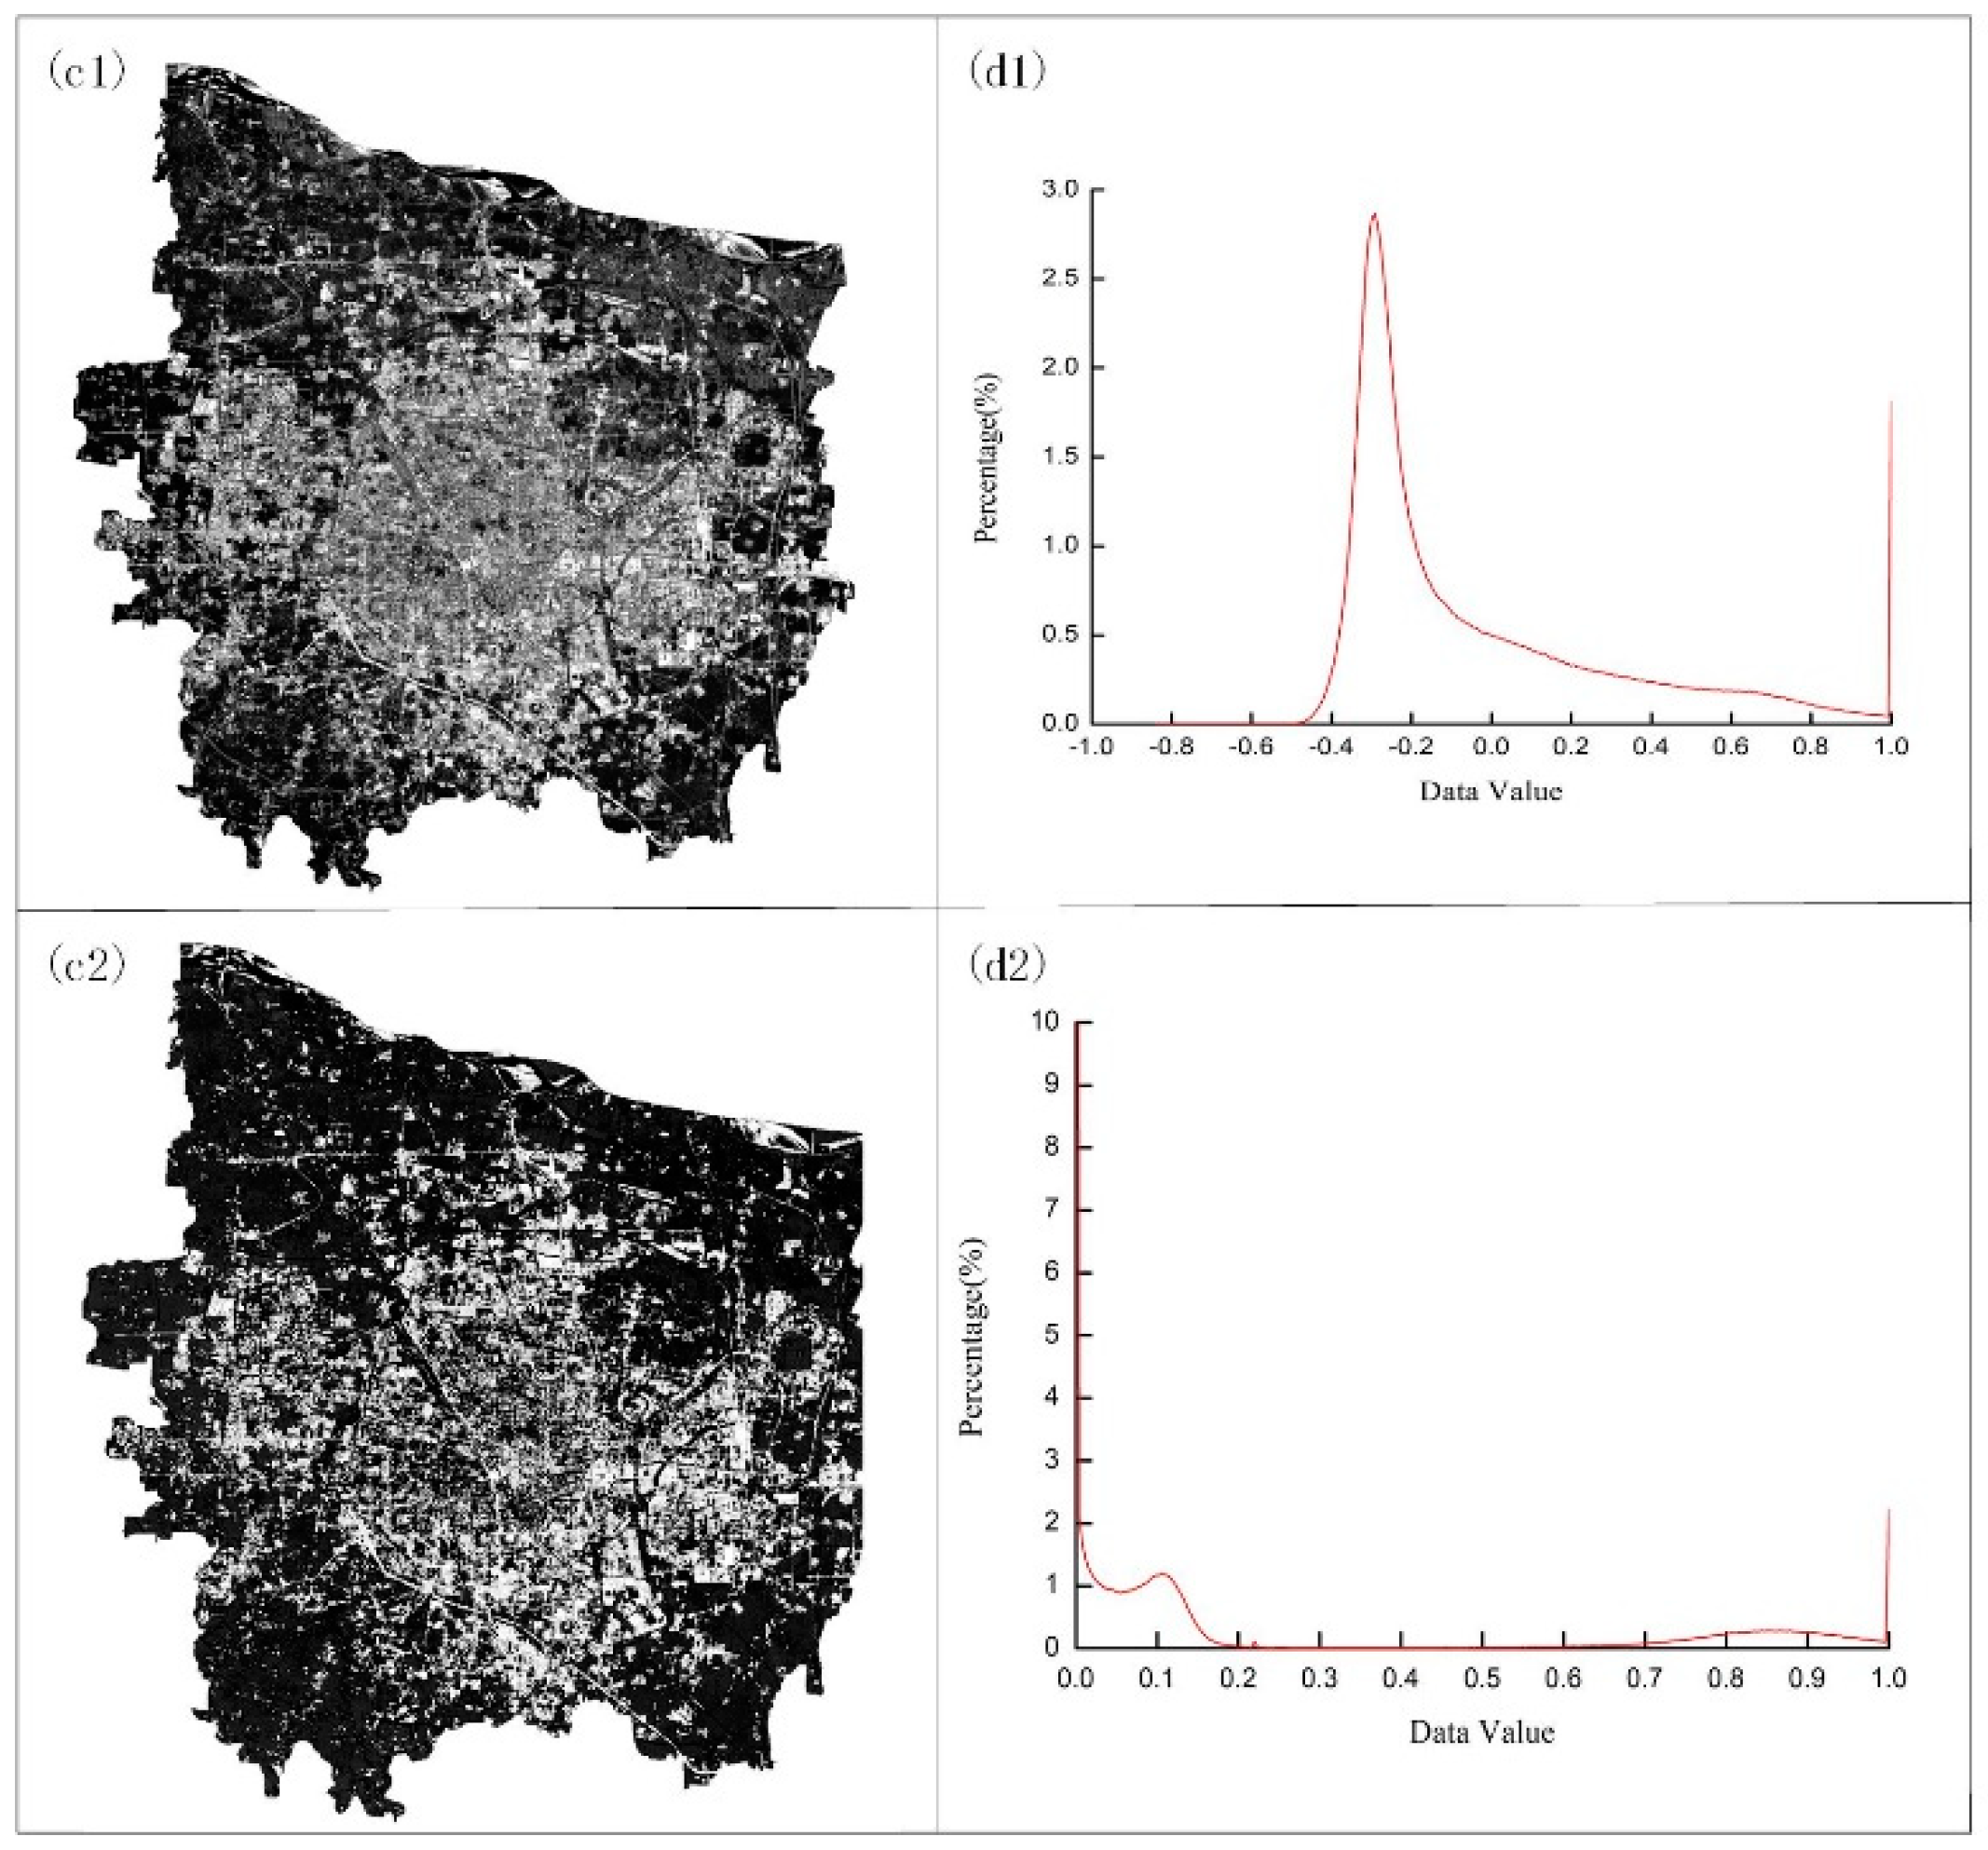
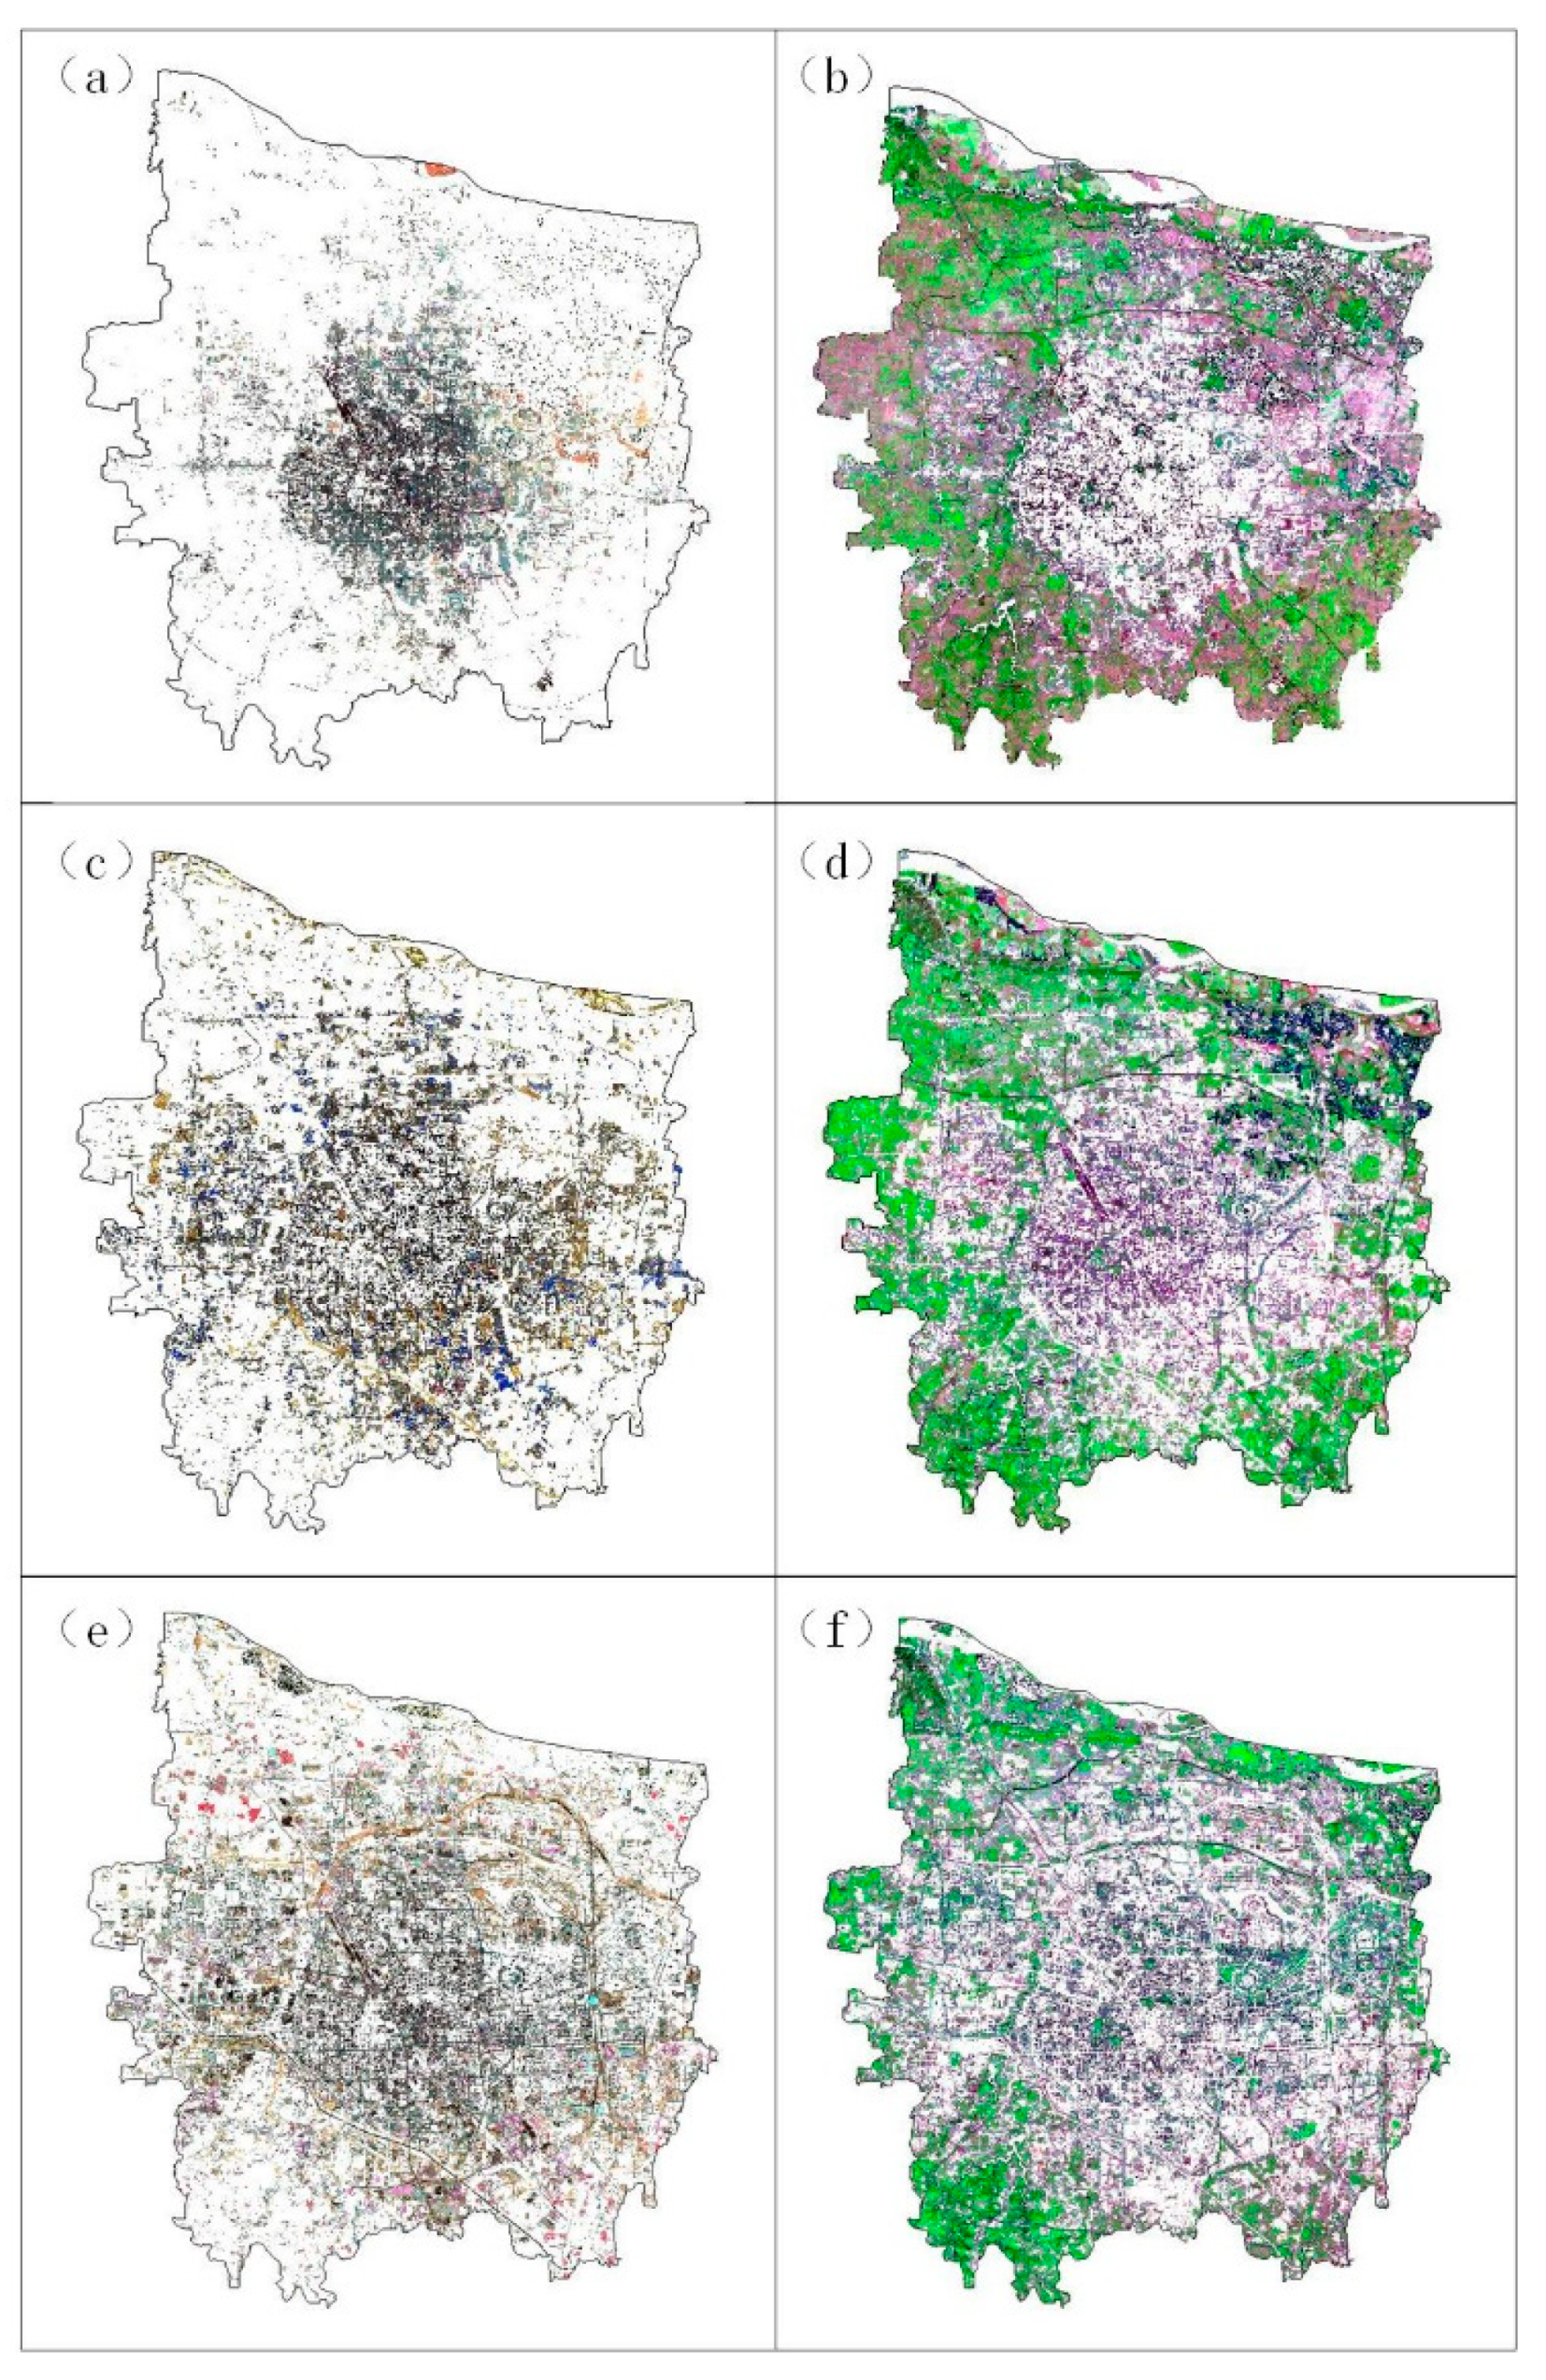
3.1.1. BCI Enhancement Result

The original BCI and enhanced BCI gray scale images were derived through applying Equations (1)–(3), and the results of TM and ETM+ images were shown in Figure 3 and Figure 4. As illustrated, pixels with white and bright gray tones are associated with impervious surfaces, light and moderate gray tones are assigned to bare soil and mixed lands, and dark gray and black tones are assigned to vegetation.
Figure 3 shows the result of the transformation based on a TM image. Figure 3a1,b1 show an original BCI gray scale image and its histogram, respectively. Figure 3a2,b2 show the enhanced result as defined by Equations (2) and (3), and the histogram of the enhanced BCI, respectively. Comparing Figure 3a1,a2, it is clear that the luminance levels of the lower intensity regions are effectively compressed, while simultaneously, the luminance levels of the higher intensity regions are promoted. The difference between Figure 3b1,b2 clearly reveals this positive effect. After the transformation, there is an obvious valley in the histogram between the lower and higher intensity parts, and this change effectively improves the separability of the impervious surface and background information in CBI. Figure 4 shows the result of the transformation based on ETM+ image. The result of Figure 4 is similar to that Figure 3, as it can be seen that the higher intensity regions representing the impervious surface is improved, and the lower intensity regions representing the vegetation is suppressed.
The above analysis indicate that the feature component extraction and enhancement technology has achieved a good application effect for TM and ETM+ images.

3.1.2. Stratification Result

The enhanced BCI was taken to construct the sub-regions for linear spectral mixture analysis. In this study, the threshold for stratification was calculated by Equation (4). The results show that the optimal threshold for the TM image is 0.4510, the ETM + image is 0.4706, and the OLI image is 0.4549. The stratification results are shown in Figure 5.
It can be seen that the bright fraction image is mainly located in the central urban area and industrial areas. The main types of ground features are high and low albedos, such as squares, roads, parking lots, roofs, sand and gravel in construction sites and sand in the Yellow River. Dark fraction image is mainly located in suburban and rural residential areas. The main types of land features are vegetation, non-irrigated lands and some low albedo rural residential areas.
In order to further quantitatively evaluate the image stratification effect, which means there should be no vegetation in the bright fraction image and no high albedo terrains in the dark fraction image. Using Google Earth image as the control group, 100 sample points were randomly selected from the bright and dark fraction images to verify the stratification accuracy. Accuracy verification results show that the sample accuracy of bright and dark fraction images is above 95%, which meets the needs for the further research.
The results of qualitative and quantitative analysis show that the image stratification technique achieves high accuracy for TM and ETM+ images. Then, the applicability of extracting impervious surface based on the DELSMA model has been verified, using TM and ETM+ images.

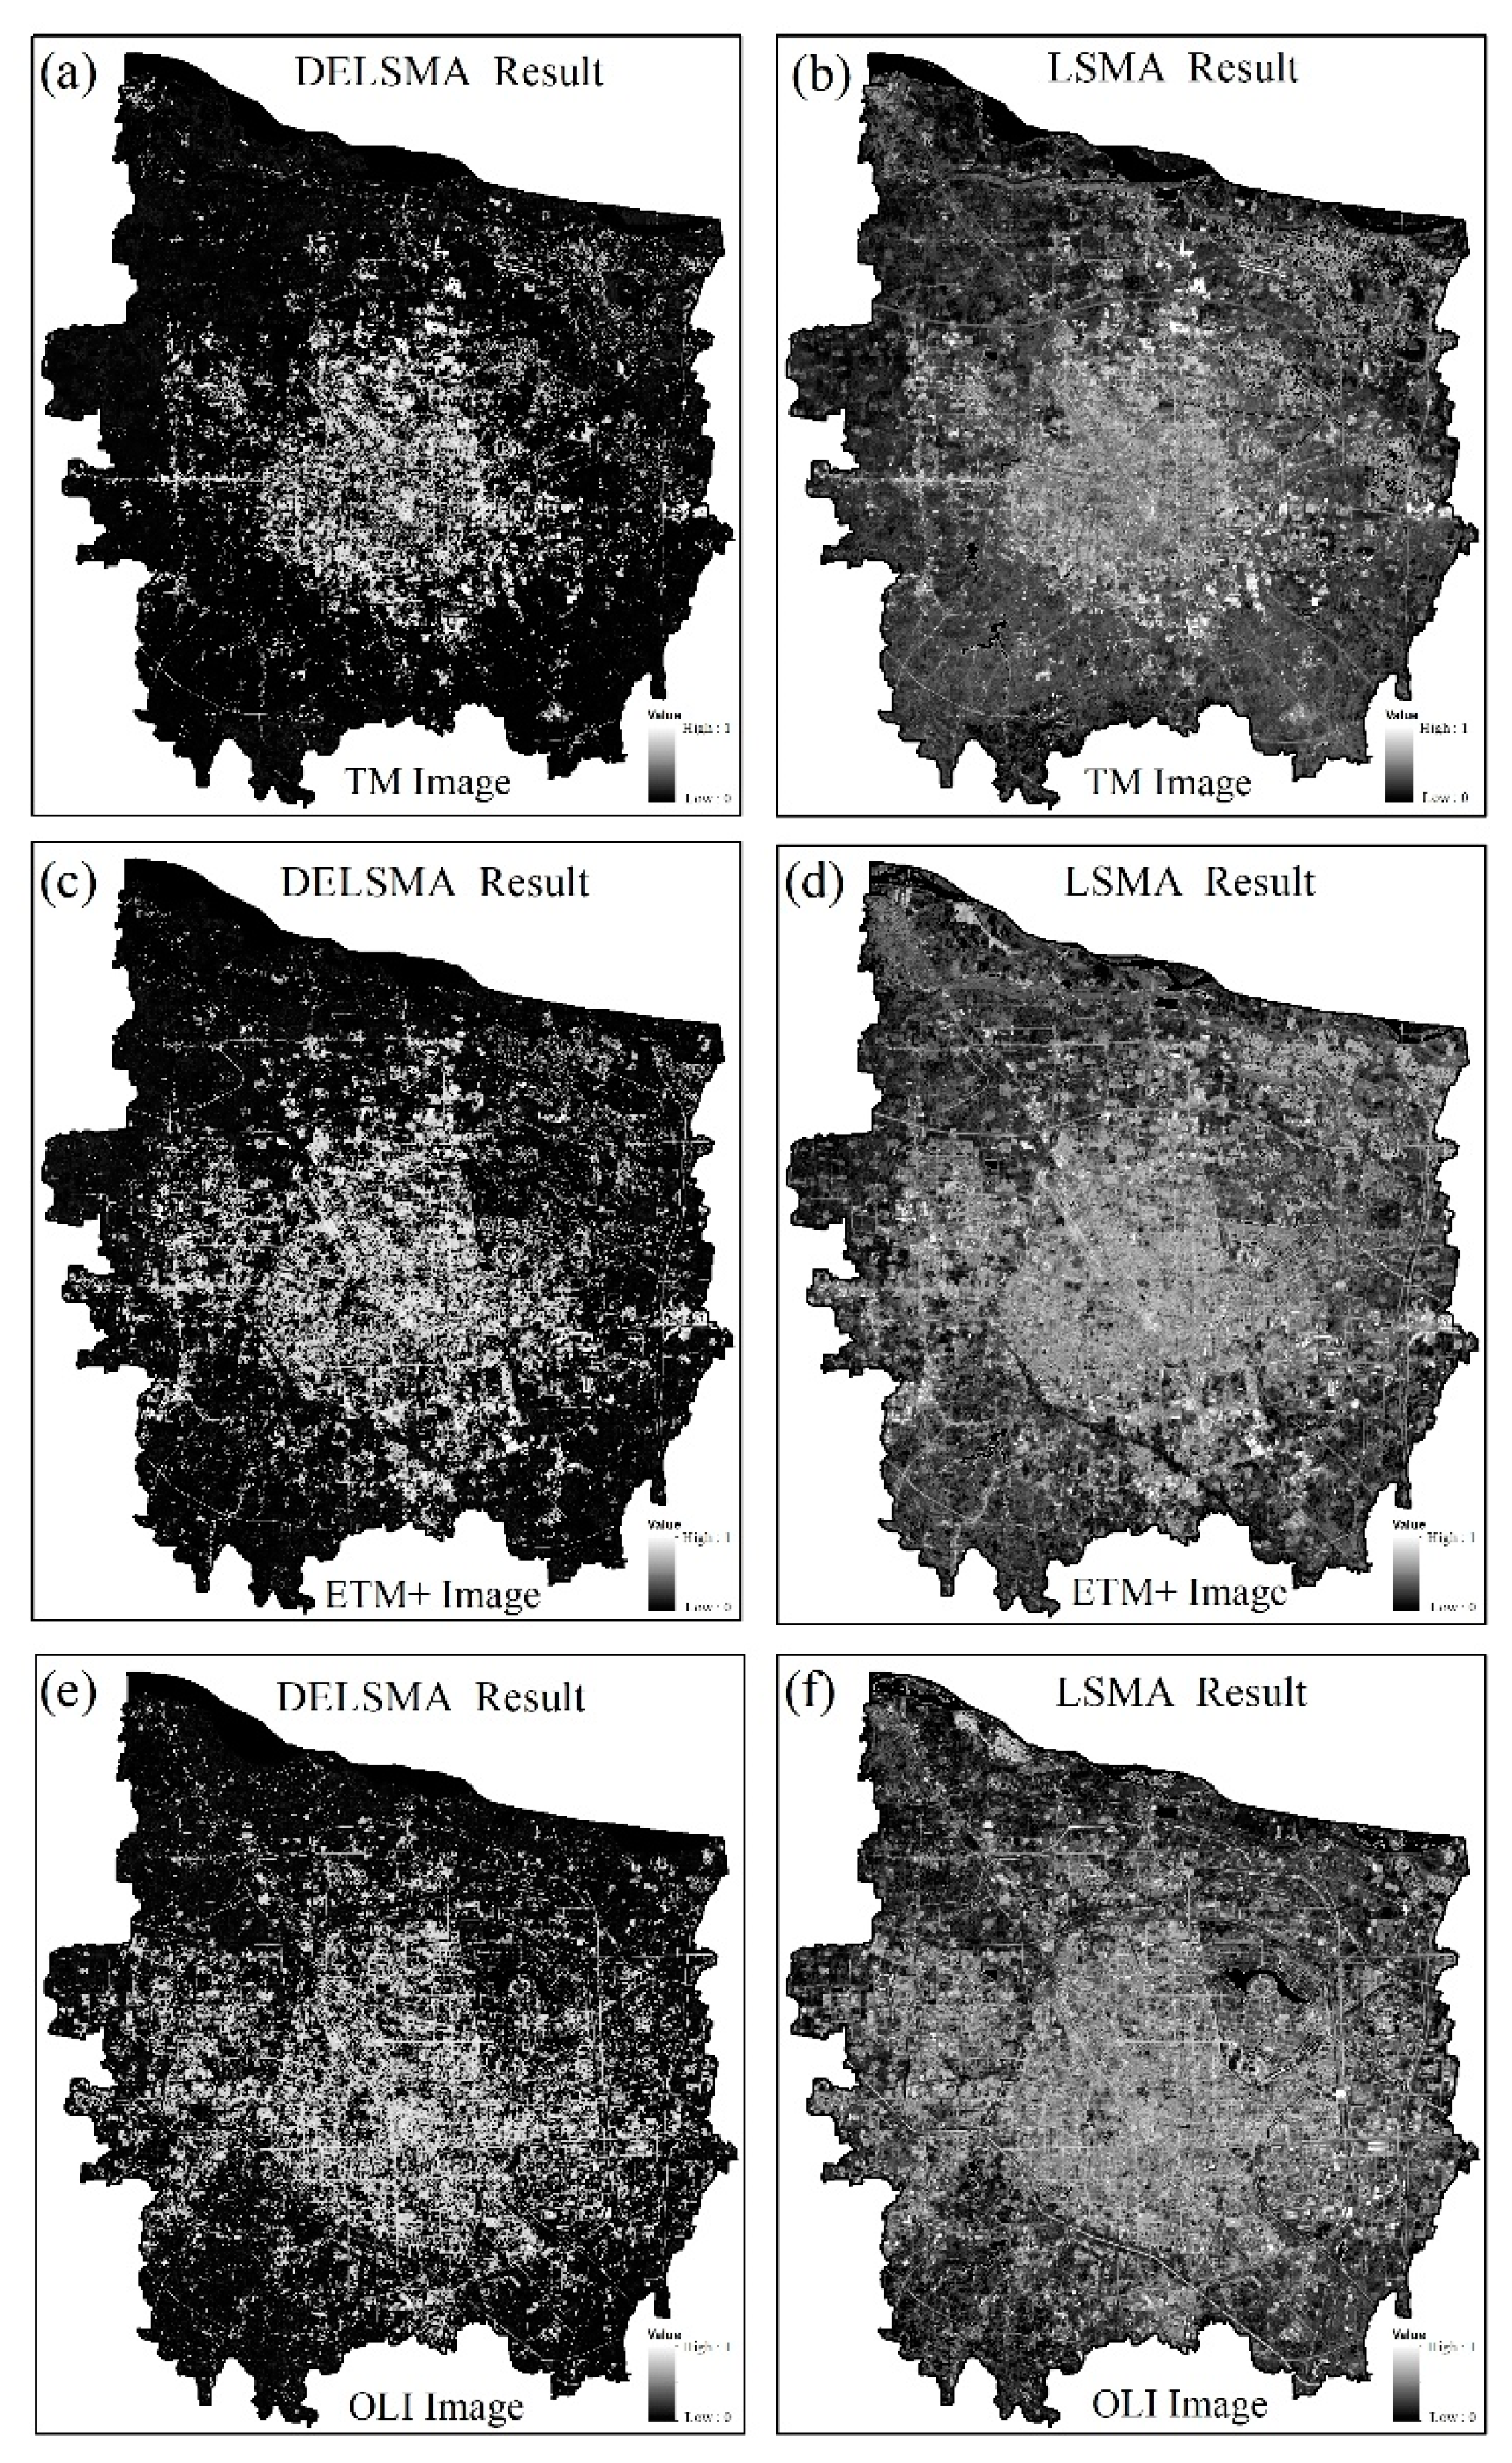
3.2. Impervious Surface Mapping

According to the DELSMA, we adopted different endmember sets for impervious surface mapping in each layer, spectral unmixing was performed. The high albedo, low albedo, and soil (H-L-S) endmember set was used to map impervious surface in bright fraction image, whereas the low albedo, soil, and vegetation (L-S-V) endmember set was used to map impervious surface in dark fraction image. FLCS were used in both layers for mixed pixel unmixing. By summing the abundances of high and low albedos, the impervious surface fractions in bright and dark areas were estimated. The final impervious surface fraction map was prepared by mosaicing the impervious surface fractions in bright and dark areas. In addition, according to the LSMA, the high albedo, low albedo, soil, and vegetation (H-L-S-V) endmember set was used to map impervious surface over entire image. The final impervious surface fraction maps from TM, ETM+, and OLI images based on DELSMA and LSMA were shown in Figure 6.
As illustrated in Figure 6a,c,e the main elements of the impervious surface detected in the study area include compact urban areas, small rural residential land, and the main road network. The images illustrate that the spatial distribution of impervious surface matches well with their actual distribution, although, some bare soils in rural areas are confused with impervious surface, and could be a primary error source. As illustrated in Figure 6b,d,f, the confusion between impervious water surface and bare soil is relatively serious, and the overall effect of the image is light and moderate gray tones. A closer visual inspection of the classification maps of DELSMA and LSMA, reveals their main difference, which is the underestimation of the bright areas and the overestimation of the dark areas by LSMA.
Visual inspection indicates that the DELSMA model performs well in extracting impervious surface as higher impervious surface percentage can be found in commercial and residential areas, and significantly lower impervious surface percentage can be found in agriculture, forestry, and wetlands. In generally, the application of image stratification technology reduces the error of impervious surface estimating of underestimation in urban area and overestimation in rural area, and improves the accuracy of impervious surface estimation.

3.3. Comparative Analysis

To demonstrate the effectiveness of the DELSMA, the original LSMA was employed for comparison. After obtaining the estimation of impervious surface based on DELSMA and LSMA, the corresponding Google Earth images were used as the ground reference. Then, statistics was computed on the differences between the actual and the extracted impervious surface.

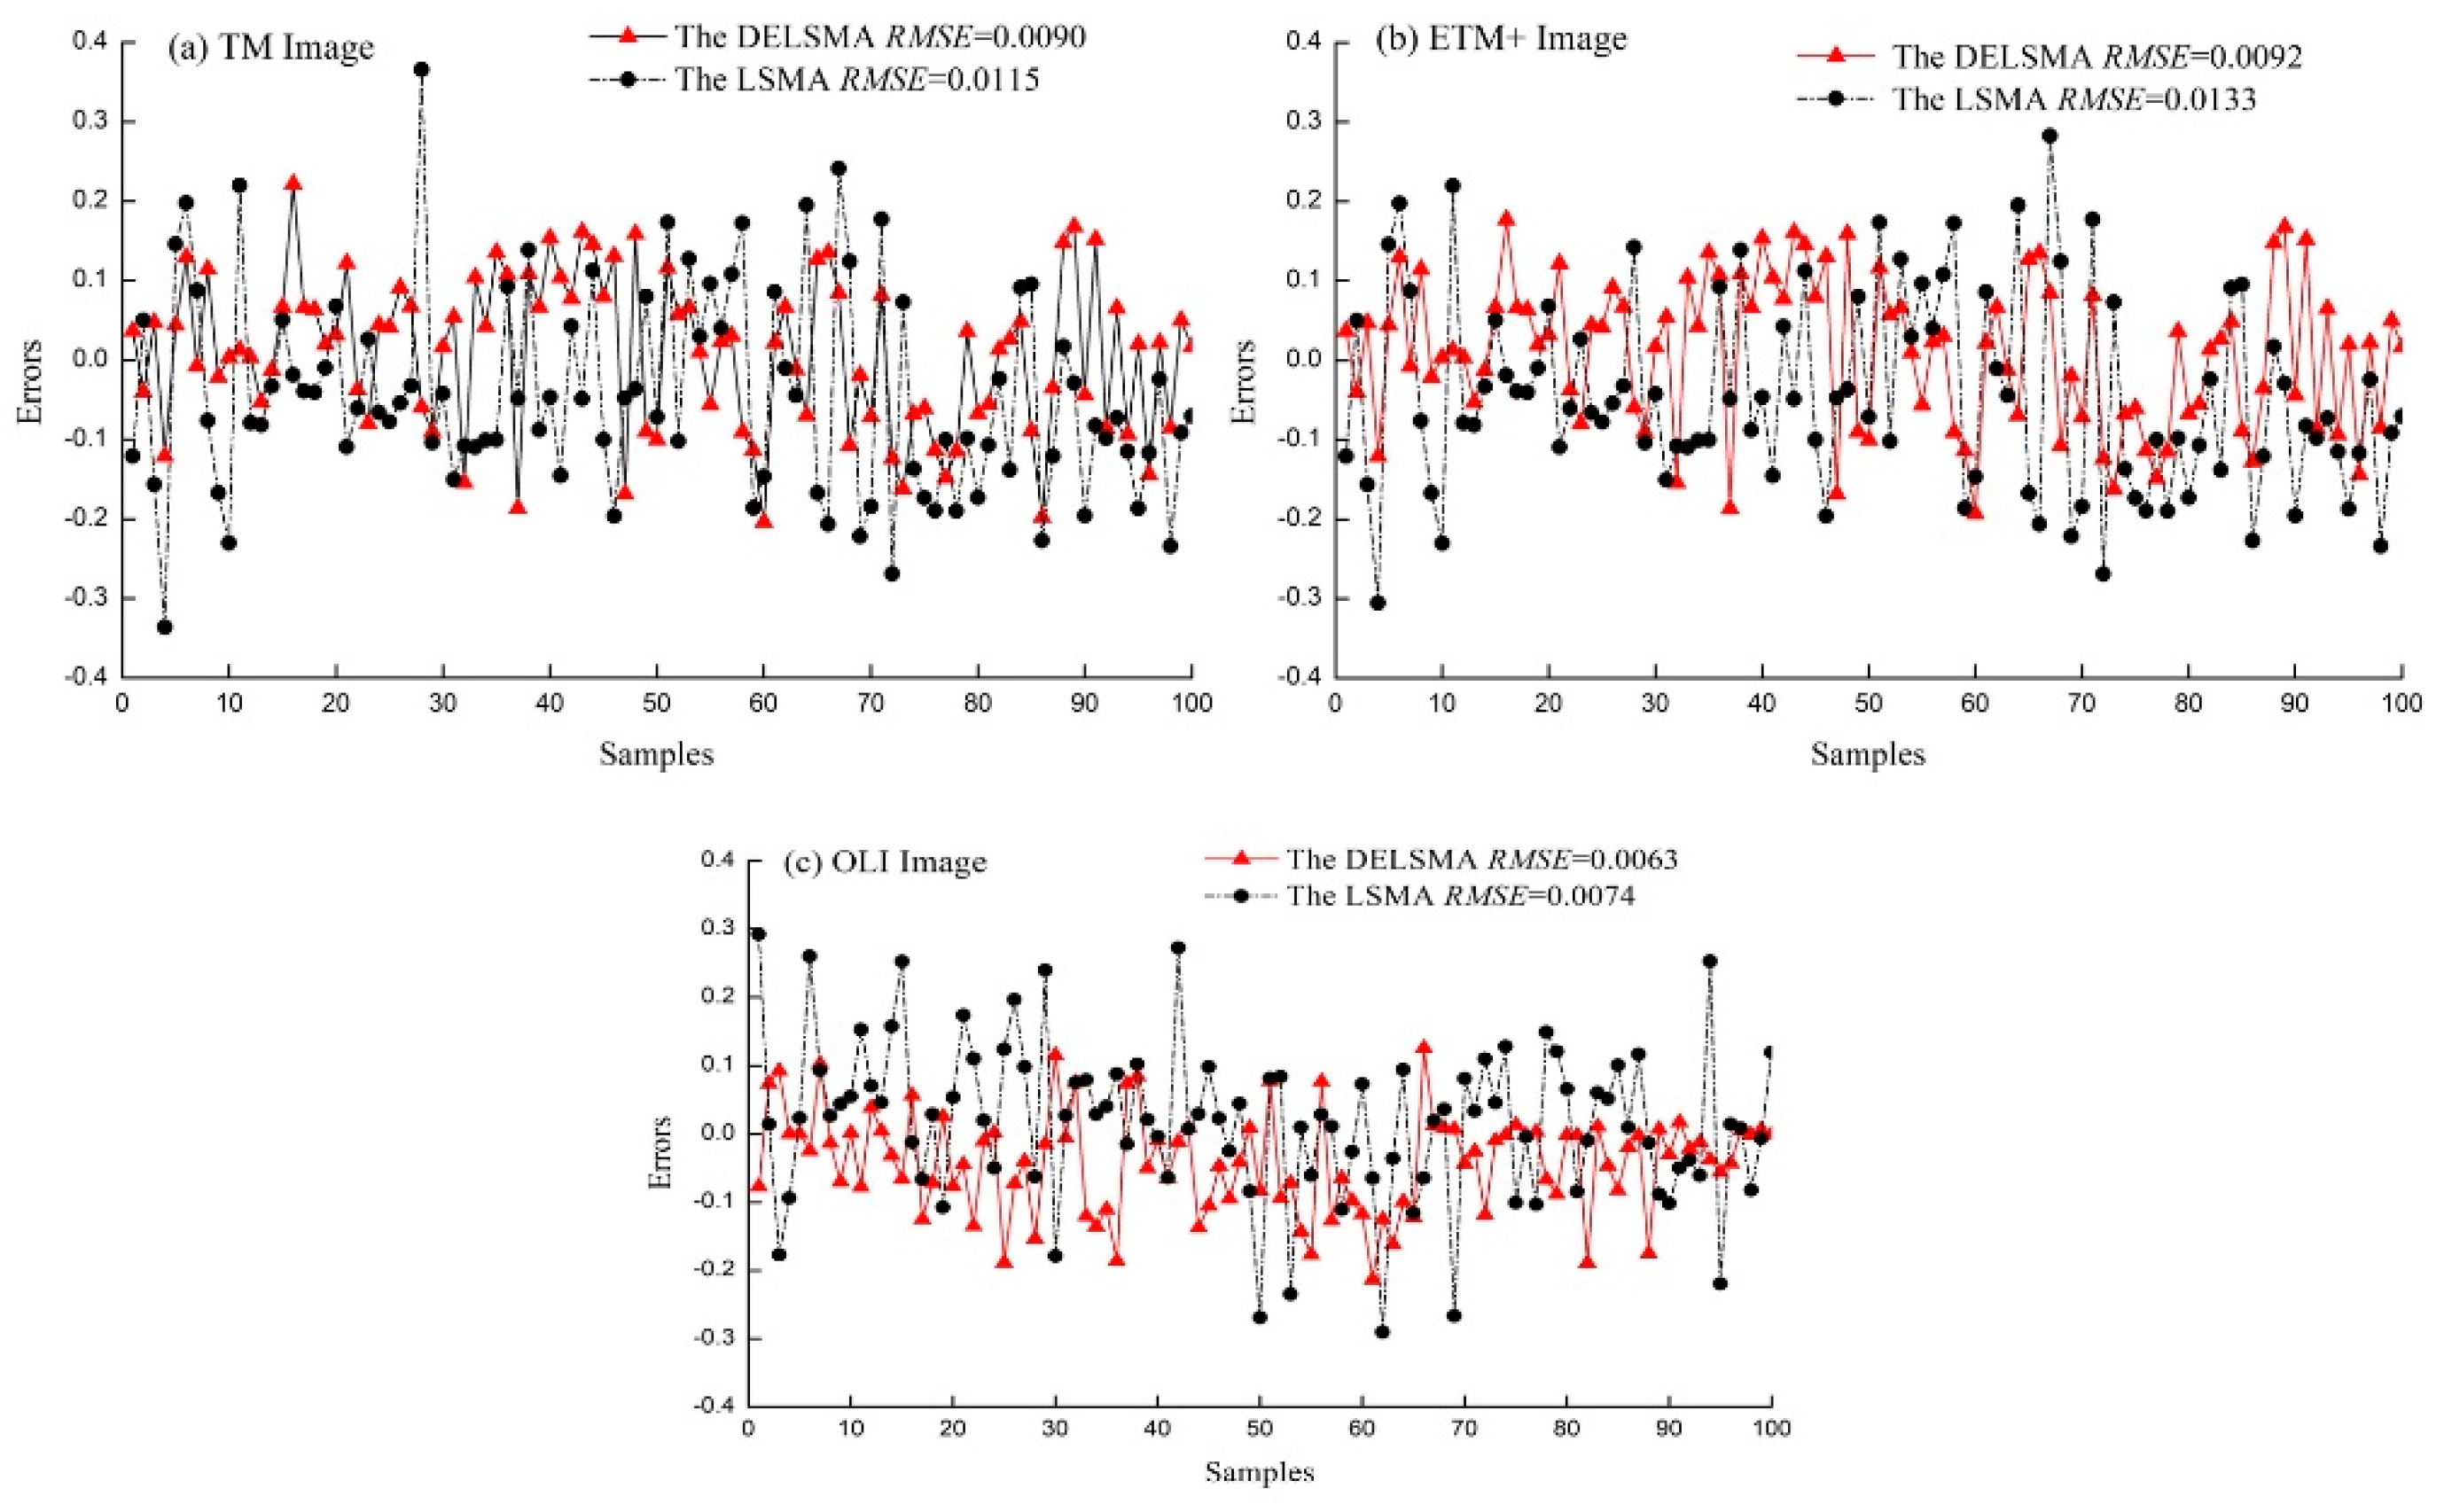
3.3.1. Residual Analysis

The sample error test results of impervious surface extracted by the two models are shown in Figure 7.
The test results show that for TM, ETM+, and OLI images, the error ranges of DELSMA model are –0.2037 to 0.2216, –0.1931 to 0.1770, and –0.2133 to 0.1255, the R M S E are 0.0090, 0.0092 and 0.0063 respectively, and the absolute error is less than 0.1. The proportion of samples is more than 80%, and almost no samples are more than 0.2. However, the error of LSMA model are –0.3361 to 0.3758, –0.3057 to 0.2826, and –0.2906 to 0.2922, the R M S E are 0.0115, 0.0133, and 0.0074, and the absolute error is less than 0.1, and the sample proportion is about 70%. Samples with an error of more than 0.2 are about 10%. Overall, for TM, ETM+, and OLI images, the error of impervious surface coverage extracted by the DELSMA model is lower than the LSMA model. In addition, the error of the TM and ETM+ image is similar and significantly higher than the error of OLI image.

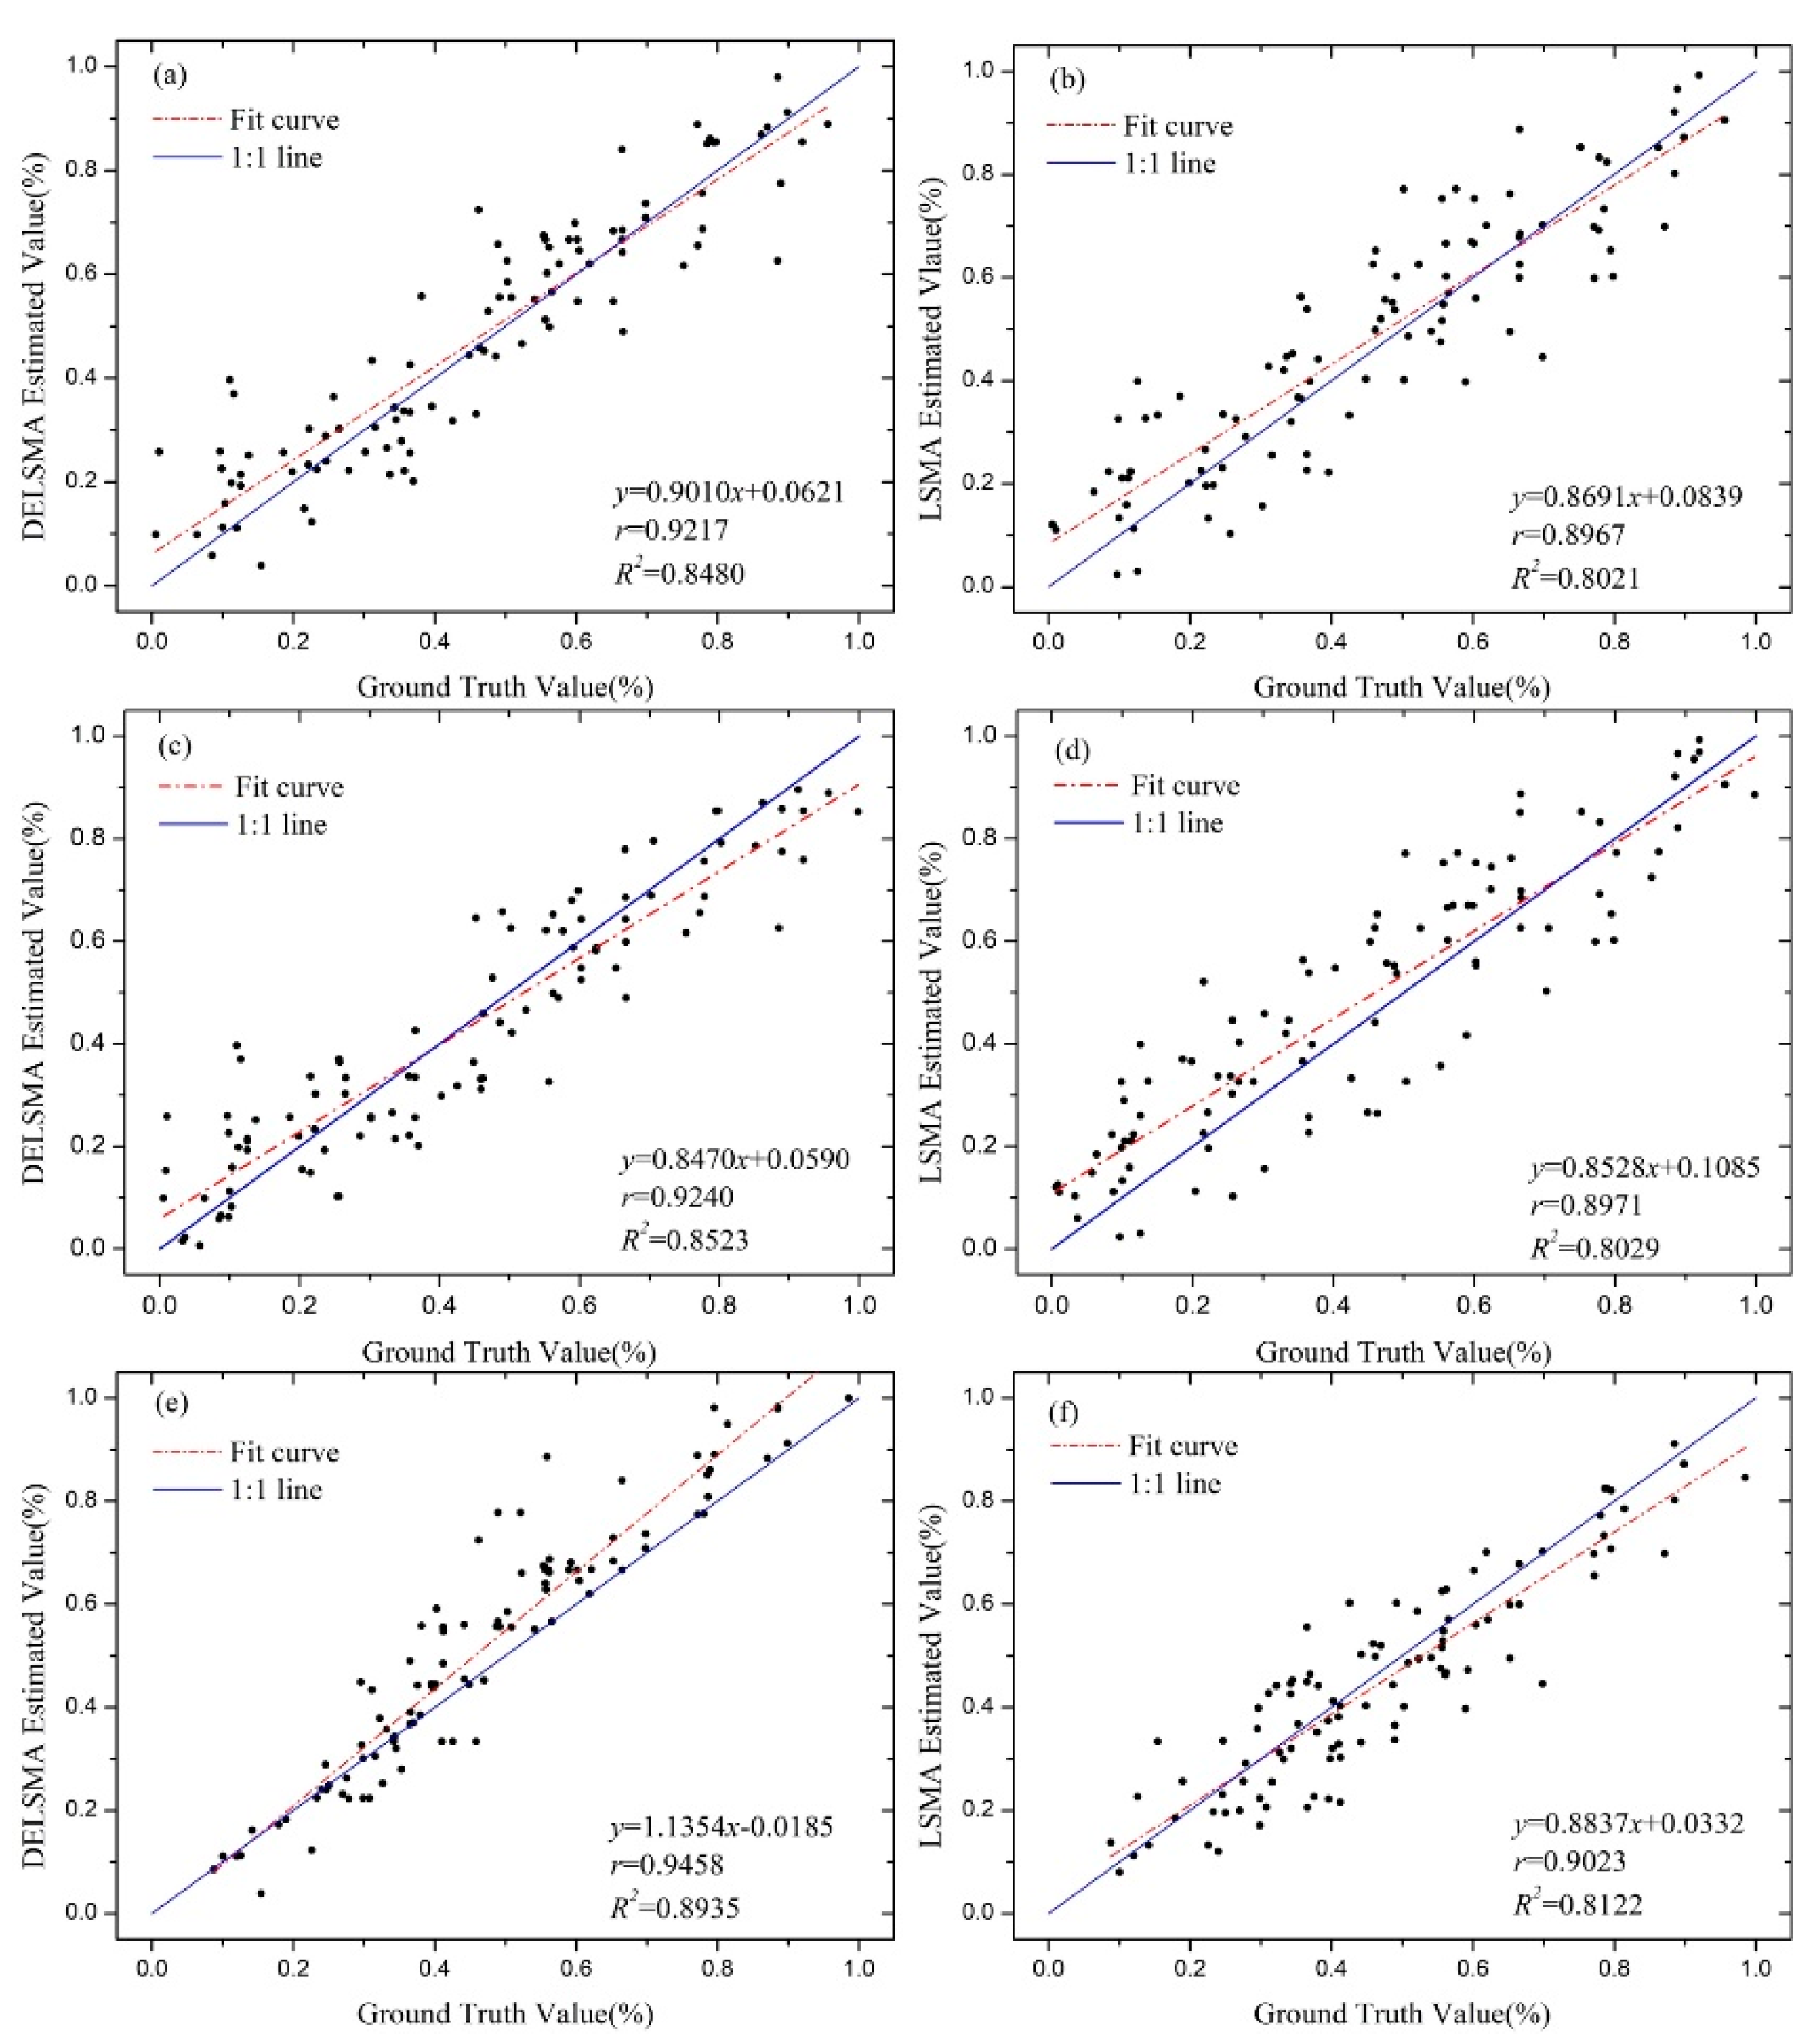
3.3.2. Linear Regression Analysis

In order to further compare the quantitative relationship between the true impervious surface and the estimated impervious surface extracted by the DELSMA and LSMA models, the estimated value and true value are made into 2D scatter plots and linear regression analysis is carried out. The results are shown in Figure 8.
In TM, ETM+, and OLI images, the 2D scatter plots between the estimated values and the real values obtained by the two models are evenly distributed on both sides of the 1:1 central line, and the r of the two models are close to or greater than 0.9, showing a high correlation. At the same time, the fitting line between the estimated value and the real value obtained by the two models is close to the 1:1 center line position, and the R 2 of the linear fitting results are also above 0.8, which shows that the two models have a strong linear relationship. The above two indicators show that both models can achieve credible accuracy. However, the r and R 2 obtained by the DELSMA model are larger than the LSMA model, and the r and R 2 of the TM and ETM+ images are similar and lower than the for the OLI image, which means that the correlation between remote sensing estimation results of the DELSMA model and real values is more significant, and the quality of inversion results is higher, which is more suitable for the estimation of urban impervious surface distribution in complex scenarios.

4. Discussion

4.1. BCI-Based Image Stratification

The selection of feature components is the key step of image stratification, which has significant influence on the stratification accuracy. As a quantitative indicator designed to enhance spectral contrast, BCI is able to effectively characterize various major urban land cover compositions over the study area, particularly for vegetation and impervious surface. BCI gray scale is a panchromatic image, the value of a pixel is its intensity. In this study, a feature component transformation technique to process the original BCI gray scale image. By enhancing the strong value and reducing the weak value, the separability of the strong value and the weak value in the gray scale image is further improved. When applying BCI transformation in TM and ETM+ images, the difference between the two histograms of B C I o r i and B C I e n h clearly reveals this positive effect. After the transformation, there is an obvious valley in the B C I e n h histogram between the lower and higher intensity parts, and this change effectively improves the separability of the higher intensity and lower intensity. Therefore, the accuracy of image stratification is improved effectively by using BCI and feature component conversion technology.

4.2. Stratification-Based Endmember Extraction

Spectral mixture analysis suffers from a difficulty in endmember extraction due to within-class spectral variability, and an inappropriate endmember set could severely affect the accuracy of impervious surface. While LSMA is easy to use in estimating impervious surface, the difficulty of endmember extraction still exists. It has been found that the accuracy of selected endmember is affected by same object with different spectrums and different objects with same spectrum. In addition, the paradox of endmember selection is still unsolved, which means that theoretically “purest” endmembers that can be selected with relative ease do not always yield optimal results, while the selection of the most “representative” endmembers is very difficult with simple LSMA. Stratification provides a good solution to address the problem. With existing researches, the within-class endmember variation is ignored. Although they applied different endmember set to different sub-regions, the endmember set was achieved from the entire image scene rather than each sub-region that have been stratified. In this study, we select the endmember set in each sub-region independently in order to reduce the spectral confusion between similar objects and within-class variability. Therefore, the inner layer information is made full use of extracting more pure and representative endmembers by using image stratification technology.

4.3. Comparison with LSMA

The fundamental difference between the DELSMA model and the LSMA model lies in the application of image stratification technology and the way of endmember selection. For DELSMA model, vegetation is firstly removed from the bright fraction image, and H-L-S endmember set is adopted. The reduction of the endmember type reduces the underestimation error of impervious surface. Therefore, in the central urban areas with high density of impervious surface, the impervious surface obtained by the DELSMA model has higher intensity than the original LSMA model. When dark fraction image is used to eliminate the high albedo, the L-S-V endmember set is adopted, with the linear spectral mixture analysis in the process of reducing the interference of high albedo of other classes, and which reduces the error of the impervious surface overestimation. Therefore, in the urban fringe, the impervious surface extracting based on the DELSMA model has lower intensity compared with the original LSMA model. Moreover, visual inspection and quantitative analysis indicate that DELSMA improves the accuracy of impervious surface estimation when compared with the original LSMA method.

5. Conclusions

This study first verified the applicability of the DELSMA model for TM and ETM+ images in Zhengzhou City, then evaluated the application effect of the DELSMA model in the Landsat series of different sensors, and finally compared the accuracy of extracting impervious surface applying DELSMA and original LSMA. The key findings and main conclusions are summarized as follows:
First, the DELSMA model performed equally well for TM and ETM+ images, and it performed consistently better than the LSMA model. This is mainly because the DELSMA model introduces the feature extraction idea. According to the spatial difference and spectral variability of the ground object, the original image is stratified, which purifies the extraction environment of the pure endmember, and then improves the accuracy of the impervious surface estimation.
Second, the application performance of DELSMA and LSMA models for OLI images were better than that of TM and ETM+ images. This is mainly due to the fact that for the OLI sensor, the addition of the cirrus band can improve the discrimination of soil and high reflectivity features, the spectral range of the band is narrowed, and the vegetation and non-vegetation information is discriminated. The radiometric resolution is improved from 8 bits to 16 bits to avoid the gray-scale over-saturation of the extreme/very dark areas, which is helpful for the fine feature recognition of low-reflectivity features. These advantages make OLI images superior to TM and ETM+ images in mixed pixel unmixing.
Third, the DELSMA model achieved a better performance than the original LSMA in extracting urban impervious surface, using time-series Landsat imagery. This is mainly because the DELSMA model takes advantage the BCI to stratify the entire image into two layers, and selects endmembers from each layer independently rather than from the entire image to cope with the class variability within.
Even though the applicability and performance of the DELSMA model has been validated based on Landsat imagery in Zhengzhou City, the applicability of DELSMA in different types of cities have not been verified. Zhengzhou belongs to a typical inland plain city, where topography and water have little influence for the urban impervious surface estimation. However, in mountainous areas and coastal areas, topography and water may have a great influence for urban impervious surface extracting. Therefore, the DELSMA model should be verified or improved for more cities. Future research is needed to evaluate the application effect of the DELSMA model in different types of cities, and improve the DELSMA model in order to obtain higher accuracy of urban impervious surface according to the features of different types of cities.
Findings from this study will be helpful to extract higher accuracy impervious surface. Moreover, this will provide sufficient data support for urban change, urban heat island analysis, and hydrological simulation, and contribute to decision-makers in formulating urban planning policies.

Author Contributions

Conceptualization, X.H., W.L., and Y.H.; data curation, X.H.; formal analysis, X.H.; funding acquisition, Y.H.; investigation, X.H.; methodology, X.H., W.L., Y.H., and S.H.; project administration, Y.H.; resources, Y.H.; software, S.H.; supervision, W.L. and Y.H.; validation, X.H.; writing—original draft, X.H., C.W., and H.W.; writing—review and editing, X.H., C.W., and H.W.

Funding

This research was founded by the “948” Program of the Ministry of Water Resources in China (201328), and the National key Research and Development Program of China (2016YFC0401402).

Acknowledgments

The authors would like to thank the United States Geological Survey (USGS) for freely providing satellite remote sensing image data required in this study. Furthermore, we appreciate the editors and reviewers for their constructive comments and suggestions.

Conflicts of Interest

The authors declare no conflict of interest.

References

  1. Chester, L.; Arnold, J.; Gibbons, C.J. Impervious Surface Coverage: The Emergence of a Key Environmental Indicator. J. Am. Plan. Assoc. 1996, 62, 243–258. [Google Scholar]
  2. Weng, Q. Remote sensing of impervious surfaces in the urban areas: Requirements, methods, and trends. Remote Sens. Environ. 2012, 117, 34–49. [Google Scholar] [CrossRef]
  3. Xu, J.; Zhao, Y.; Zhong, K.; Zhang, F.; Liu, X.; Sun, C. Measuring spatio-temporal dynamics of impervious surface in Guangzhou, China, from 1988 to 2015, using time-series Landsat imagery. Sci. Total Environ. 2018, 627, 264–281. [Google Scholar] [CrossRef]
  4. Dissanayake, D.; Morimoto, T.; Murayama, Y.; Ranagalage, M. Impact of Landscape Structure on the Variation of Land Surface Temperature in Sub-Saharan Region: A Case Study of Addis Ababa using Landsat Data (1986–2016). Sustainability 2019, 11, 2257. [Google Scholar] [CrossRef]
  5. Fonseka, H.P.U.; Zhang, H.; Sun, Y.; Su, H.; Lin, H.; Lin, Y. Urbanization and its impacts on land surface temperature in Colombo Metropolitan Area, Sri Lanka, from 1988 to 2016. Remote Sens. 2019, 11, 957. [Google Scholar] [CrossRef]
  6. Yang, C.; He, X.; Yan, F.; Yu, L.; Bu, K.; Yang, J.; Chang, L.; Zhang, S. Mapping the influence of land use/land cover changes on the urban heat island effect—A case study of Changchun, China. Sustainability 2017, 9, 312. [Google Scholar] [CrossRef]
  7. Zhou, D.; Xiao, J.; Bonafoni, S.; Berger, C.; Deilami, K.; Zhou, Y.; Frolking, S.; Yao, R.; Qiao, Z.; Sobrino, J.A. Satellite remote sensing of surface urban heat islands: Progress, challenges, and perspectives. Remote Sens. 2019, 11, 48. [Google Scholar] [CrossRef]
  8. Zhang, H.; Cheng, J.; Wu, Z.; Li, C.; Qin, J.; Liu, T. Effects of impervious surface on the spatial distribution of urban waterlogging risk spots at multiple scales in Guangzhou, South China. Sustainability 2018, 10, 1589. [Google Scholar] [CrossRef]
  9. Yu, H.; Zhao, Y.; Fu, Y.; Li, L. Spatiotemporal variance assessment of urban rainstorm waterlogging affected by impervious surface expansion: A case study of Guangzhou, China. Sustainability 2018, 10, 3761. [Google Scholar] [CrossRef]
  10. Weitzell, R.E.; Kaushal, S.S.; Lynch, L.M.; Guinn, S.M.; Elmore, A.J. Extent of stream burial and relationships to watershed area, topography, and impervious surface area. Water 2016, 8, 538. [Google Scholar] [CrossRef]
  11. Luo, K.; Hu, X.; He, Q.; Wu, Z.; Cheng, H.; Hu, Z.; Mazumder, A. Impacts of rapid urbanization on the water quality and macroinvertebrate communities of streams: A case study in Liangjiang New Area, China. Sci. Total Environ. 2018, 621, 1601–1614. [Google Scholar] [CrossRef] [PubMed]
  12. Kim, H.; Jeong, H.; Jeon, J.; Bae, S. The impact of impervious surface on water quality and its threshold in Korea. Water 2016, 8, 111. [Google Scholar] [CrossRef]
  13. Shahtahmassebi, A.R.; Song, J.; Zheng, Q.; Blackburn, G.A.; Wang, K.; Huang, L.Y.; Pan, Y.; Moore, N.; Shahtahmassebi, G.; Sadrabadi Haghighi, R.; et al. Remote sensing of impervious surface growth: A framework for quantifying urban expansion and re-densification mechanisms. Int. J. Appl. Earth Obs. Geoinf. 2016, 46, 94–112. [Google Scholar] [CrossRef] [Green Version]
  14. Miller, J.D.; Kim, H.; Kjeldsen, T.R.; Packman, J.; Grebby, S.; Dearden, R. Assessing the impact of urbanization on storm runoff in a peri-urban catchment using historical change in impervious cover. J. Hydrol. 2014, 515, 59–70. [Google Scholar] [CrossRef] [Green Version]
  15. Zhang, L.; Weng, Q.; Shao, Z. An evaluation of monthly impervious surface dynamics by fusing Landsat and MODIS time series in the Pearl River Delta, China, from 2000 to 2015. Remote Sens. Environ. 2017, 201, 99–114. [Google Scholar] [CrossRef]
  16. Xu, H.; Wang, M. Remote sensing-based retrieval of ground impervious surfaces. J. Remote Sens. 2016, 20, 1270–1289. (In Chinese) [Google Scholar]
  17. Fu, Y.; Li, J.; Weng, Q.; Zheng, Q.; Li, L.; Dai, S.; Guo, B. Characterizing the spatial pattern of annual urban growth by using time series Landsat imagery. Sci. Total Environ. 2019, 666, 274–284. [Google Scholar] [CrossRef]
  18. Liu, C.; Zhang, Q.; Luo, H.; Qi, S.; Tao, S.; Xu, H.; Yao, Y. An efficient approach to capture continuous impervious surface dynamics using spatial-temporal rules and dense Landsat time series stacks. Remote Sens. Environ. 2019, 229, 114–132. [Google Scholar] [CrossRef]
  19. Pan, T.; Kuang, W.; Hamdi, R.; Zhang, C.; Zhang, S.; Li, Z.; Chen, X. City-level comparison of urban land-cover configurations from 2000–2015 across 65 countries within the global belt and road. Remote Sens. 2019, 11, 1515. [Google Scholar] [CrossRef]
  20. Gong, P.; Li, X.; Zhang, W. 40-Year (1978–2017) human settlement changes in China reflected by impervious surfaces from satellite remote sensing. Sci. Bull. 2019, 64, 756–763. [Google Scholar] [CrossRef]
  21. Sun, G.; Chen, X.; Ren, J.; Zhang, A.; Jia, X. Stratified spectral mixture analysis of medium resolution imagery for impervious surface mapping. Int. J. Appl. Earth Obs. Geoinf. 2017, 60, 38–48. [Google Scholar] [CrossRef] [Green Version]
  22. Deng, Y.; Chen, R.; Wu, C. Examining the deep belief network for subpixel unmixing with medium spatial resolution multispectral imagery in urban environments. Remote Sens. 2019, 11, 1566. [Google Scholar] [CrossRef]
  23. Wu, C.; Murray, A.T. Estimating impervious surface distribution by spectral mixture analysis. Remote Sens. Environ. 2003, 84, 493–505. [Google Scholar] [CrossRef]
  24. Sarkar Chaudhuri, A.; Singh, P.; Rai, S.C. Assessment of impervious surface growth in urban environment through remote sensing estimates. Environ. Earth Sci. 2017, 76, 1–14. [Google Scholar] [CrossRef]
  25. Li, L.; Lu, D.; Kuang, W. Examining urban impervious surface distribution and its dynamic change in Hangzhou metropolis. Remote Sens. 2016, 8, 265. [Google Scholar] [CrossRef]
  26. Scott, D.; Petropoulos, G.P.; Moxley, J.; Malcolm, H. Quantifying the physical composition of urban morphology throughout wales based on the time series (1989–2011) analysis of landsat TM/ETM+ images and supporting GIS data. Remote Sens. 2014, 6, 11731–11752. [Google Scholar] [CrossRef]
  27. Li, H.; Li, L.; Chen, L.; Zhou, X.; Cui, Y.; Liu, Y.; Liu, W. Mapping and characterizing spatiotemporal dynamics of impervious surfaces using landsat images: A case study of Xuzhou, East China from 1995 to 2018. Sustainability 2019, 11, 1224. [Google Scholar] [CrossRef]
  28. Deng, C.; Wu, C. A spatially adaptive spectral mixture analysis for mapping subpixel urban impervious surface distribution. Remote Sens. Environ. 2013, 133, 62–70. [Google Scholar] [CrossRef]
  29. Zhang, J.; He, C.; Zhou, Y.; Zhu, S.; Shuai, G. Prior-knowledge-based spectral mixture analysis for impervious surface mapping. Int. J. Appl. Earth Obs. Geoinf. 2014, 28, 201–210. [Google Scholar] [CrossRef]
  30. Li, M.; Zang, S.; Wu, C.; Deng, Y. Segmentation-based and rule-based spectral mixture analysis for estimating urban imperviousness. Adv. Space. Res. 2015, 55, 1307–1315. [Google Scholar] [CrossRef]
  31. Huang, X.; Liu, W.; Han, Y.; Zhang, H.; Liu, X.; Mu, W. A method of estimating urban impervious based on DELSMA model. Sci. Surv. Map. 2019, 44, 79–86. (In Chinese) [Google Scholar]
  32. Deng, C.; Wu, C. BCI: A biophysical composition index for remote sensing of urban environments. Remote Sens. Environ. 2012, 127, 247–259. [Google Scholar] [CrossRef]
  33. Zhao, H.; Zhang, H.; Miao, C.; Ye, X.; Min, M. Linking heat source-sink landscape patterns with analysis of Urban heat Islands: Study on the fast-growing Zhengzhou City in central China. Remote Sens. 2018, 10, 1268. [Google Scholar] [CrossRef]
  34. Zhao, H.; Ren, Z.; Tan, J. The Spatial Patterns of Land Surface Temperature and Its Impact Factors: Spatial Non-Stationarity and Scale Effects Based on a Geographically-Weighted Regression Model. Sustainability 2018, 10, 2242. [Google Scholar] [CrossRef]
  35. Min, M.; Zhao, H.; Miao, C. Spatio-temporal evolution analysis of the urban heat island: A case study of Zhengzhou city, China. Sustainability 2018, 10, 1992. [Google Scholar] [CrossRef]
  36. Xu, H.; Tang, F. Analysis of new characteristics of the first Landsat 8 image and their eco- environmental significance. Acta Ecol. Sin. 2013, 33, 3249–3257. (In Chinese) [Google Scholar]
  37. Poursanidis, D.; Chrysoulakis, N.; Mitraka, Z. Landsat 8 vs. Landsat 5: A comparison based on urban and peri-urbanland cover mapping. Int. J. Appl. Earth Obs. Geoinf. 2015, 35, 259–269. [Google Scholar] [CrossRef]
  38. Zhang, L.; Zhang, M.; Yao, Y. Mapping seasonal impervious surface dynamics in Wuhan urban agglomeration, China from 2000 to 2016. Int. J. Appl. Earth Obs. Geoinf. 2018, 70, 51–61. [Google Scholar] [CrossRef]
  39. Liu, K.; Su, H.; Zhang, L.; Yang, H.; Zhang, R.; Li, X. Analysis of the urban heat Island effect in shijiazhuang, China using satellite and airborne data. Remote Sens. 2015, 7, 4804–4833. [Google Scholar] [CrossRef]
  40. Liu, J.; Fang, T.; Li, D. Shadow Detection in Remotely Sensed Images Based on Self-Adaptive Feature Selection. IEEE Trans. Geosci. Remote Sens. 2011, 49, 5092–5103. [Google Scholar]
  41. Otsu, N. A Tlreshold Selection Method from Gray-Level Histograms. IEEE Trans. Syst. Man Cybern. 1979, 9, 62–66. [Google Scholar] [CrossRef]
  42. Li, W. Examining the importance of endmember class and spectra variability in unmixing analysis for mapping urban impervious surfaces. Adv. Space. Res. 2017, 60, 2389–2401. [Google Scholar] [CrossRef]
  43. Lu, D.; Weng, Q. Use of impervious surface in urban land-use classification. Remote Sens. Environ. 2006, 102, 146–160. [Google Scholar] [CrossRef]
  44. Fan, F.; Deng, Y. Enhancing endmember selection in multiple endmember spectral mixture analysis (MESMA) for urban impervious surface area mapping using spectral angle and spectral distance parameters. Int. J. Appl. Earth Obs. Geoinf. 2014, 33, 290–301. [Google Scholar] [CrossRef]
  45. Qian, Y.; Wu, Z. Study on urban expansion using the spatial and temporal dynamic changes in the impervious surface in Nanjing. Sustainability. 2019, 11, 933. [Google Scholar] [CrossRef]
  46. Fan, F.; Fan, W. Understanding spatial-temporal urban expansion pattern (1990–2009) using impervious surface data and landscape indexes: A case study in Guangzhou (China). J. Appl. Remote Sens. 2014, 8, 3609. [Google Scholar] [CrossRef]
  47. Guo, W.; Lu, D.; Wu, Y.; Zhang, J. Mapping impervious surface distribution with integration of SNNP VIIRS-DNB and MODIS NDVI Data. Remote Sens. 2015, 7, 12459–12477. [Google Scholar] [CrossRef]
  48. Fan, F.; Fan, W.; Weng, Q. Improving Urban Impervious Surface Mapping by Linear Spectral Mixture Analysis and Using Spectral Indices. Can. J. Remote Sens. 2015, 41, 577–586. [Google Scholar] [CrossRef]
Figure 1. Flowchart depicting framework of the study.
Sustainability 11 06227 g001
Figure 2. Location of the study area.
Sustainability 11 06227 g002
Figure 3. The transformation for characteristic index enhancement in Landsat TM: (a1,b1) are the original BCI image and its corresponding histogram image; (a2,b2) are the enhanced BCI image and its corresponding histogram image.
Sustainability 11 06227 g003
Figure 4. The transformation for characteristic index enhancement in Landsat ETM+: (c1,d1) are the original BCI image and its corresponding histogram image; (c2,d2) are the enhanced BCI image and its corresponding histogram image.
Sustainability 11 06227 g004
Figure 5. The stratification result: (a,c,e) are bright fraction images of TM (RGB: 5,2,1), ETM+ (RGB: 5,2,1),and OLI (RGB:6,3,2); (b,d,f) are dark fraction images of TM (RGB: 7,4,2),ETM+ (RGB: 7,4,2), and OLI (RGB: 7,5,3).
Sustainability 11 06227 g005
Figure 6. Fraction images of impervious surfaces based on DELSMA and LSMA models: (a,c,e) extraction of DELSMA based on TM,ETM+, and OLI images; (b,d,f) extraction of DELSMA based on TM,ETM+ and OLI images.
Sustainability 11 06227 g006
Figure 7. The error of the samples based on different model.
Sustainability 11 06227 g007
Figure 8. Scatter plots of true value and estimated value: (a,c,e) represent results of DELSMA based on TM,ETM+, and OLI images; (b,d,f) represent results of LSMA based on TM,ETM+ and OLI images.
Sustainability 11 06227 g008
Table 1. Main features of the various improved models. SASMA, spatially adaptive spectral mixture analysis; PKSMA, prior-knowledge-based spectral mixture analysis; S-R-LSMA, segmentation-based and rule-based spectral mixture analysis; SP-SSMA, stratified spectral mixture analysis in spectral domain; DELSMA, dynamic endmember linear spectral mixture analysis.
ApplicabilityEndmemberWithout-Class Spectral VariabilityWithin-Class Spectral Variability
ModelTMETM+OLIThe Entire ImageSub-region
SASMAUnknowUnknow××
PKSMAUnknowUnknow××
S-R-LSMAUnknowUnknow××
SP-SSMAUnknowUnknow×
DELSMAUnknowUnknow×
Note: √ indicates the type and method of remote sensing image used by the model, × indicates the method not adopted by the model.
Table 2. Comparison of spectral bands between Landsat 8 and Landsat 7.
Landsat8
SensorBand No.BandWavelengthSpatial Resolution/mRadiometric Resolution/bit
OLI1Dark-Blue0.43–0.453012
2Blue0.45–0.513012
3Green0.53–0.593012
4Red0.64–0.673012
5Near-Infrared0.85–0.883012
6SWIR 11.57–1.653012
7SWIR 22.11–2.293012
8Panchromatic 0.50–0.681512
9Cirrus1.36–1.383012
TIRS10TIRS 110.6–11.19
11TIRS 211.5–12.51
Landsat5/7
SensorBand No.BandWavelengthSpatial Resolution/mRadiometric Resolution/bit
TM/ETM+1Blue0.45–0.52308
2Green0.52–0.60308
3Red0.63–0.69308
4Near-Infrared0.77–0.90308
5Near-Infrared1.55–1.75308
7Mid-Infrared2.08–2.35308
8Panchromatic (Only Landsat7)0.52–0.90158
6Thermal10.40–12.50Landsat7(60)
Landsat5(120)
8
Table 3. Data used in the present work.
S.noDateSensorPath/Row
12006/6/17Landsat 5 TM124/36
22011/7/25Landsat 7 ETM+124/36
32017/4/28Landsat 8 OLI124/36

