Article

Analyzing Atrium Volume Designs for Hot and Humid Climates

by
Reihaneh Aram
* and
Halil Zafer Alibaba
*
Faculty of Architecture, Department of Architecture, Eastern Mediterranean University, 99628 Gazimagusa, Northern Cyprus, Mersin 10, Turkey
*
Authors to whom correspondence should be addressed.
Sustainability 2019, 11(22), 6213; https://doi.org/10.3390/su11226213
Submission received: 11 September 2019 / Revised: 23 October 2019 / Accepted: 31 October 2019 / Published: 6 November 2019

Abstract

:
The objective of this research was to determine the proper thermal comfort in an atrium design for single-floor, medium-rise, and high-rise buildings based on different proportions, placements, window opening ratios, and internal condition systems. EDSL Tas software was used for the dynamic thermal simulation software models, and all were analyzed based on ASHRAE 55, ISO 7730, and EN 15251 standards to determine which dynamic thermal simulation models had thermal comfort in a hot and humid climate throughout the year. This research found that for naturally conditioned single-floor and medium-rise buildings, when the atrium proportion was 1/2 of the office proportion at the southeast and center atrium location, respectively, had maximum user satisfaction. When the building’s internal spaces were mechanically conditioned with a 1/3 and 1/4 atrium proportion of the office proportion in single-floor and medium-rise buildings, respectively, thermal comfort was acceptable, especially when the atrium was located in the center for single-floor and in the northeast for medium-rise buildings. However, the naturally conditioned high-rise building with a north-east atrium that was 1/4 of the office proportion and a mechanically conditioned high-rise with a center atrium 1/3 of the office proportion had the minimum dissatisfaction throughout the year.

1. Introduction

One of the important parameters for users in the building sector is the occupants’ comfort. Thermal comfort is a vital issue in hot and humid climates [1]. According to the American Society of Heating, Refrigerating and air-Conditioning Engineers (ASHRAE), “thermal comfort is defined as mind satisfaction based on environmental condition” [2]. An important factor in hot and humid climates is air temperature, which is directly related to the penetration of solar radiation throughout buildings. Consequently, in a hot and humid climate, solar radiation has a direct influence on the indoor thermal condition of the building and also on the building’s energy consumption through its cooling load. The building’s openings as transitional spaces, windows, and envelope also play an important role in providing users’ internal comfort. Daylight is the basic source of lighting for the building and also causes visual comfort. Additionally, natural light has positive effects on the users’ wellbeing and productivity [1].
Generally, energy plays an important role in all plant, animal, and human life. Nowadays, consuming, generating, and providing energy can be done using various methods. The changes in human lifestyle and advancements in technology in the post-industrial revolution have all caused a massive increase in the rate of energy consumption. Unfortunately, most of the energy consumption is from non-renewable sources [3]. Solar energy is an important and free source of energy that directly affects the internal environment. Daylight has a direct and negative influence on the building’s total energy consumption through the cooling load because of the solar heat gain. These problems happen simultaneously and hourly. However, daylight is a fundamental parameter for the occupants’ subjective satisfaction. An important building element is windows, which directly affect indoor thermal comfort. Additionally, a massive aperture transfers a large solar heat gain, which has an objective influence on the building’s energy usage and causes heat exchange as building heat transfers via window openings. Furthermore, transparent spaces create large daylit areas. In some regions, this leads to a conflict between energy performance and daylighting. Consequently, the window to wall ratio (WWR) and transparent area proportion are crucial and valuable factors in early building designs. Additionally, it has been found that adding windows can increase a building’s total heating and cooling energy consumption by up to 180% [4].
In defining natural ventilation, it is necessary to define the building’s openings. Accordingly, there are two main opening types: adventitious opening and purposeful opening. Adventitious openings are cracks in building components caused by the doors and windows that serve no function; however, infiltration may occur through these types of openings. Natural ventilation typically occurs via purposeful openings for ventilation [5]. As another effective factor in the building thermal sector, it can be mentioned that the buildings’ facade also influences the internal thermal comfort [6]. As a result of contemporary architecture moving toward more energy- and cost-saving technology development, construction, and increased indoor thermal comfort, adaptive facades are considered suitable for complex dynamic buildings [7]. However, this type of façade, like the window openings, can generate natural ventilation. Occupants by the window openings can control the internal environment as the main means that causes the new approach known as human adaptive comfort [8].
The atrium can be considered one of the purposeful openings for natural ventilation into a building that is located in a hot and humid climate. Designing atriums for hot and humid climates needs substantial and careful attention to be paid to the different parts of the atrium building design. In fact, incorporating the atrium into the building can reduce energy consumption and increase thermal performance in terms of energy efficiency. Passive design factors, such as building orientation, forms, envelope, and ratios also all have a direct effect on a building’s performance [9]. As a way of finding the optimum building design factors, it is possible to use simulation and analysis software. Simulating the buildings allows for an investigation of a building’s thermal performance. Because building performance has a direct and indirect effect on energy consumption, energy costs, users’ thermal comfort, and greenhouse gas emissions, designing the appropriate model is an important issue [10].
Atriums can be commonly defined as open air spaces in the center of the building, surrounded by adjacent rooms. Historically, the atrium dates back to 3000 BC in the central courtyard house following the old Roman buildings around Mesopotamia. In modern architecture, the atrium is shaped as the expansive open area that is frequently surrounded by several floors; additionally, atriums can also be covered by glass with a massive ratio of openings as windows. Atriums have different functions, including as a common social space; to provide natural light, ventilation, visual comfort; and to lower energy consumption [3]. Atriums can be categorized into four main types. The first atrium type is defined as the centralized atrium, which is orientated in the center of the building as a central courtyard and covered with a glass roof. The semi-enclosed atrium is the second type of atrium category, which is a glass area within the building but with one side of the atrium on the building’s exterior surface. Moreover, the atrium roof in this type can be left open or covered using glass. The third atrium type is the attached atrium, which is constructed outside of the building’s exterior walls and connected with the outdoor environment on three sides. The fourth and final atrium type is the linear atrium, which is oriented between two separate building blocks. The atrium wall in this type has glass on the two sides. Therefore, the closed atrium is mainly used in big buildings or buildings that have a limitation on the use of the southern facade for the atrium wall side in the building [3]. Research analysis of thermal performance in the atrium based on different mathematical, analytical, numerical modeling, and experimental measurement methods has illustrated that design parameters have a direct effect on the indoor thermal comfort condition. These building design parameters consist of the atrium shape and design, proportion, opening characteristics, and materials and properties’ characteristics [11].

2. Literature Review

As the existing research on sustainable buildings and energy saving illustrates, the atrium is a key factor in the total building energy saving and daylight factor, which leaves a minimal carbon footprint and converts sunlight into heat, consequently reducing artificial energy usage [12]. The atrium space dimensions, which include its depth, length, and width, are distinguishing parameters for bringing daylight into the building. Furthermore, the size and location of the window openings and the reflectiveness of the walls have a direct effect on the atrium space’s daylight reception [3]. A study on hot and humid tropical climates illustrated that the top glaze atrium caused a massive discomfort condition for users on the top floor because of a high temperature stratification problem [13]. Research about the atrium building with five floors in Santiago showed that in the atrium space, solar radiation can decrease the cooling usage of the building by 75 percent, consequently causing a reduction in the building’s energy consumption. However, the building volume, form, and glass type are also important factors [3].
According to the research on natural ventilation in a three-story atrium building in a hot and humid climate, it is vital to design the building with consideration of the height for a significant pressure gradient as a result of the different temperatures in order to provide sufficient natural ventilation [14]. Cross-ventilation in the atrium is an especially important parameter for hot and humid climates because this passive cooling strategy causes a reduction in humidity, air temperature, and growth air velocity [15]. Based on research results, it is not possible to design the building with full ventilation relying on a stack effect, buoyancy-driven flow, and heat in the atrium buildings [16], which creates the necessity of finding the optimum solution for designing atrium buildings for hot and humid climates. As a general finding, it has been shown that in the atrium building, natural ventilation can be more achievable by integrating the atrium area with a solar chimney; however, the width and depth of the chimney do not have a significant effect on the atrium building [17]. In an atrium space, the average daylight factor (ADF) is higher in the narrower atrium of the top floor in comparison with the wider atrium space in the lower floor [18]. On the other hand, the research about the natural smoke ventilation in atriums has shown that the rectangular configuration had better performances with natural smoke ventilation than other shapes, such as triangular and square configurations; smoke ventilation was also evaluated by considering the height of the clear space [19]. However, this study did not mention specific solutions and parameters.
A comparison between heating and cooling loads illustrates that the cooling load used more energy in the atrium building according to the EnergyPlus software [20]. This study used buoyancy-driven ventilation has a significant influence on the internal atrium space’s thermal comfort in a hot and humid climate. However, pressurized ventilation is occasionally recommended in this area, and depending on the building’s energy consumption through air conditioning systems, this condition cannot always be described as a fully passive technique [11].
As research in one of the famous heritage buildings in China has shown, when the atrium space’s temperature increases because of the sun, a suitable atrium design can generate natural ventilation through a cross-ventilation system. It also showed that the atrium air exchange was from 97% to 99%, much higher than a similar building without an atrium [21]. According to research conducted on a single-floor atrium without any tower over the atrium roof in a Mediterranean climate, the atrium located in the northeastern part of the building had a better energy performance, while the northwestern atrium placement with 25%, 50%, and 75% window opening ratios had a nearly acceptable thermal comfort in the cold months. Furthermore, it illustrated that the window opening ratio influenced the relative humidity of the whole building. When the atrium is placed in the southeastern part of the building, users’ had an acceptable thermal comfort, although it is also important to provide openings, especially 25% or 50% opening ratios for all windows, to facilitate air movement in a Mediterranean region with a hot and humid climate. The research also found that there is no thermal comfort condition during the summertime [22].
The aim of this research, which focuses on thermal comfort in the atrium building, is to determine which problems in the atrium space have a negative performance in a hot and humid climate and propose practical solutions for active and passive building performance in the atriums of single (one floor), medium-rise (five floors), and high-rise (ten floors) buildings by decreasing the energy usage of mechanical systems. This paper concludes by proposing useful models for architects as a practical solution. Additionally, it aims at finding the optimum atrium volume based on the different atrium proportions, orientations, adjacent spaces’ proportions, and window opening ratios.
Consequently, the fundamental objectives of this research include:
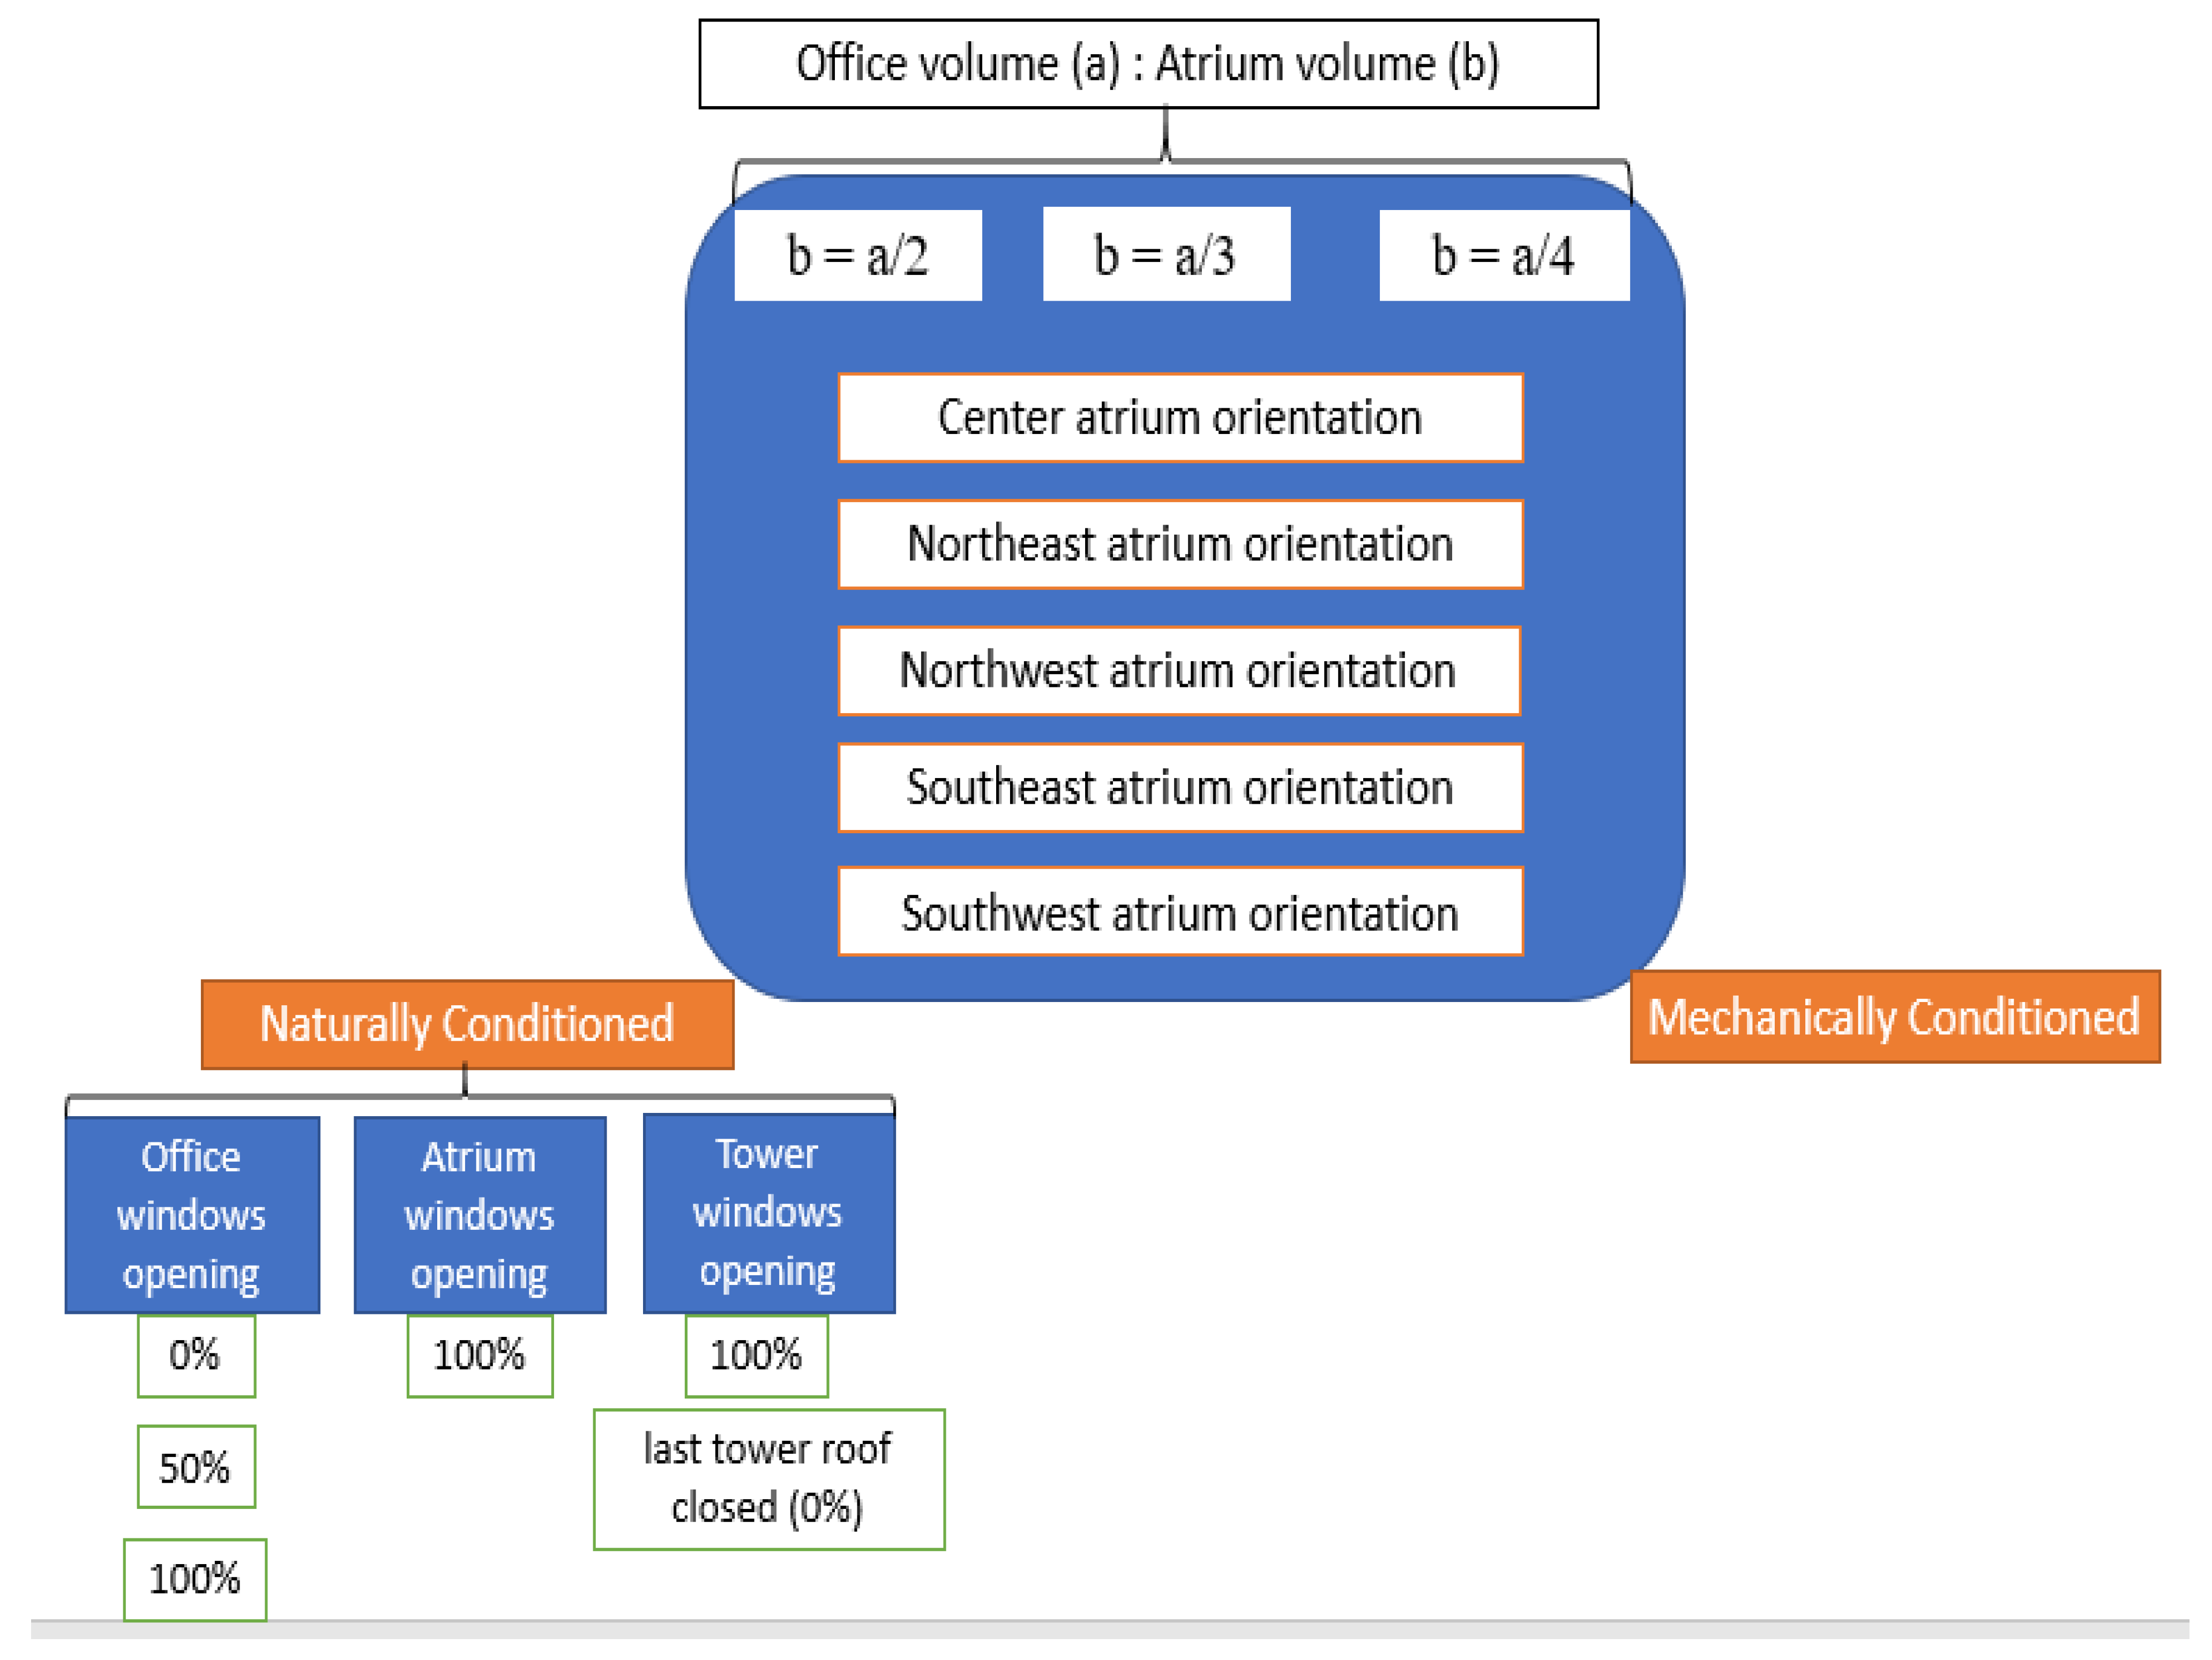
To determine the optimized volume of the atrium zone (atrium proportion) and office zone (office proportion), and window opening ratios of 0%, 50%, and 100% throughout the year in single-floor, medium-rise, and high-rise buildings according to passive and active internal conditions (different months based on a hot and humid climate).
To illustrate the thermal comfort of the atrium and office zone in a hot and humid climate using the northeast, northwest, southeast, and southwest atrium placements in the office (atrium) building design.
To propose a practical method for predicting thermal comfort based on the adaptive model for a natural ventilation internal condition, and predicted mean vote (PMV) and percentage of people dissatisfied (PPD) for the mechanical internal condition system.

3. Materials and Methods

In this research, a methodology was adopted to produce the optimal atrium volume in a hot and humid climate. The simulation models used in this research were the single volume, medium-rise, and high-rise atrium buildings, which functioned as offices and are illustrated in Table 1. Accordingly, all of the dynamic models’ scenarios were analyzed based on three main proportions of the atrium volume at 1/2, 1/3, and 1/4 of the office volume, as can be seen in the general workflow of this paper in Figure 1. As the next step in all of the dynamic models’ scenarios, the atrium placement was changed between the center, northeast, northwest, southeast, and southwest for each model, as illustrated in Table 2. Furthermore, all of the above parameters were tested based on the different internal dynamics of naturally and mechanically conditioned systems. Moreover, the active strategy (mechanical condition) involved a basic air conditioning system in Famagusta buildings with extended hours when all of the building’s windows were completely closed during different seasons. Additionally, the passive strategy (natural ventilation condition) involved the application of different facade window opening ratios—0%, 50%, and 100%—to determine the most suitable models. The EDSL Tas dynamic thermal simulation software, version 9.4.4 [23] was used for this study.
The optimization and analysis process can be illustrated with the following points:
  • All of the simulation models were located in Famagusta, North Cyprus. Consequently, Famagusta weather data was used for all of the simulations. The weather condition of Famagusta, Cyprus, is a hot and humid climate. Throughout August, the average temperature is 27 °C, which is the hottest month. The coldest month is January, for which the average temperature is 12 °C. Furthermore, December is the wettest month with an average of 94.5 mm of rain [24].
  • All of the atrium buildings as single, medium-rise, and high-rise volumes were analyzed with the atrium tower height fixed at 1 m, total building dimension (office + atrium) as 30 m × 30 m without any shading devices, and without any neighboring buildings.
  • All of the dynamic thermal simulation models’ construction materials had the same properties, which consisted of opaque construction properties layers with U-values and glass construction properties layers with U-values. The opaque construction properties layer with U-values group includes the ground floor category (U-Value 0.283 W/m2K, solar absorptance (external surface 0.760 and internal surface 0.500), emissivity (external surface 0.910 and internal surface 0.900), conductance 0.297 W/m2K, and time constant 127.999). Additionally, the another one is the ceiling category (U Value 1.01 W/m2K, solar absorptance (external surface 0.700 and internal surface 0.500), emissivity (external surface 0.900 and internal surface 0.900), conductance 1.251 W/m2K, and time constant 13.749). Furthermore, the glass construction properties’ layers with U-values include the wall category (U-Value 1.803 W/m2K, solar transmittance 0.498, external solar absorptance 0.173 and 0.135, internal solar absorptance 0.227 and 0.097, light transmittance 0.760, and time constant 0). The last category is the windows (clear 6-12-6 double glazing low E) category (U-Value 1.803 W/m2K, solar transmittance 0.498, external solar absorptance 0.173 and 0.135, internal solar absorptance 0.227 and 0.097, light transmittance 0.760, and time constant 0).
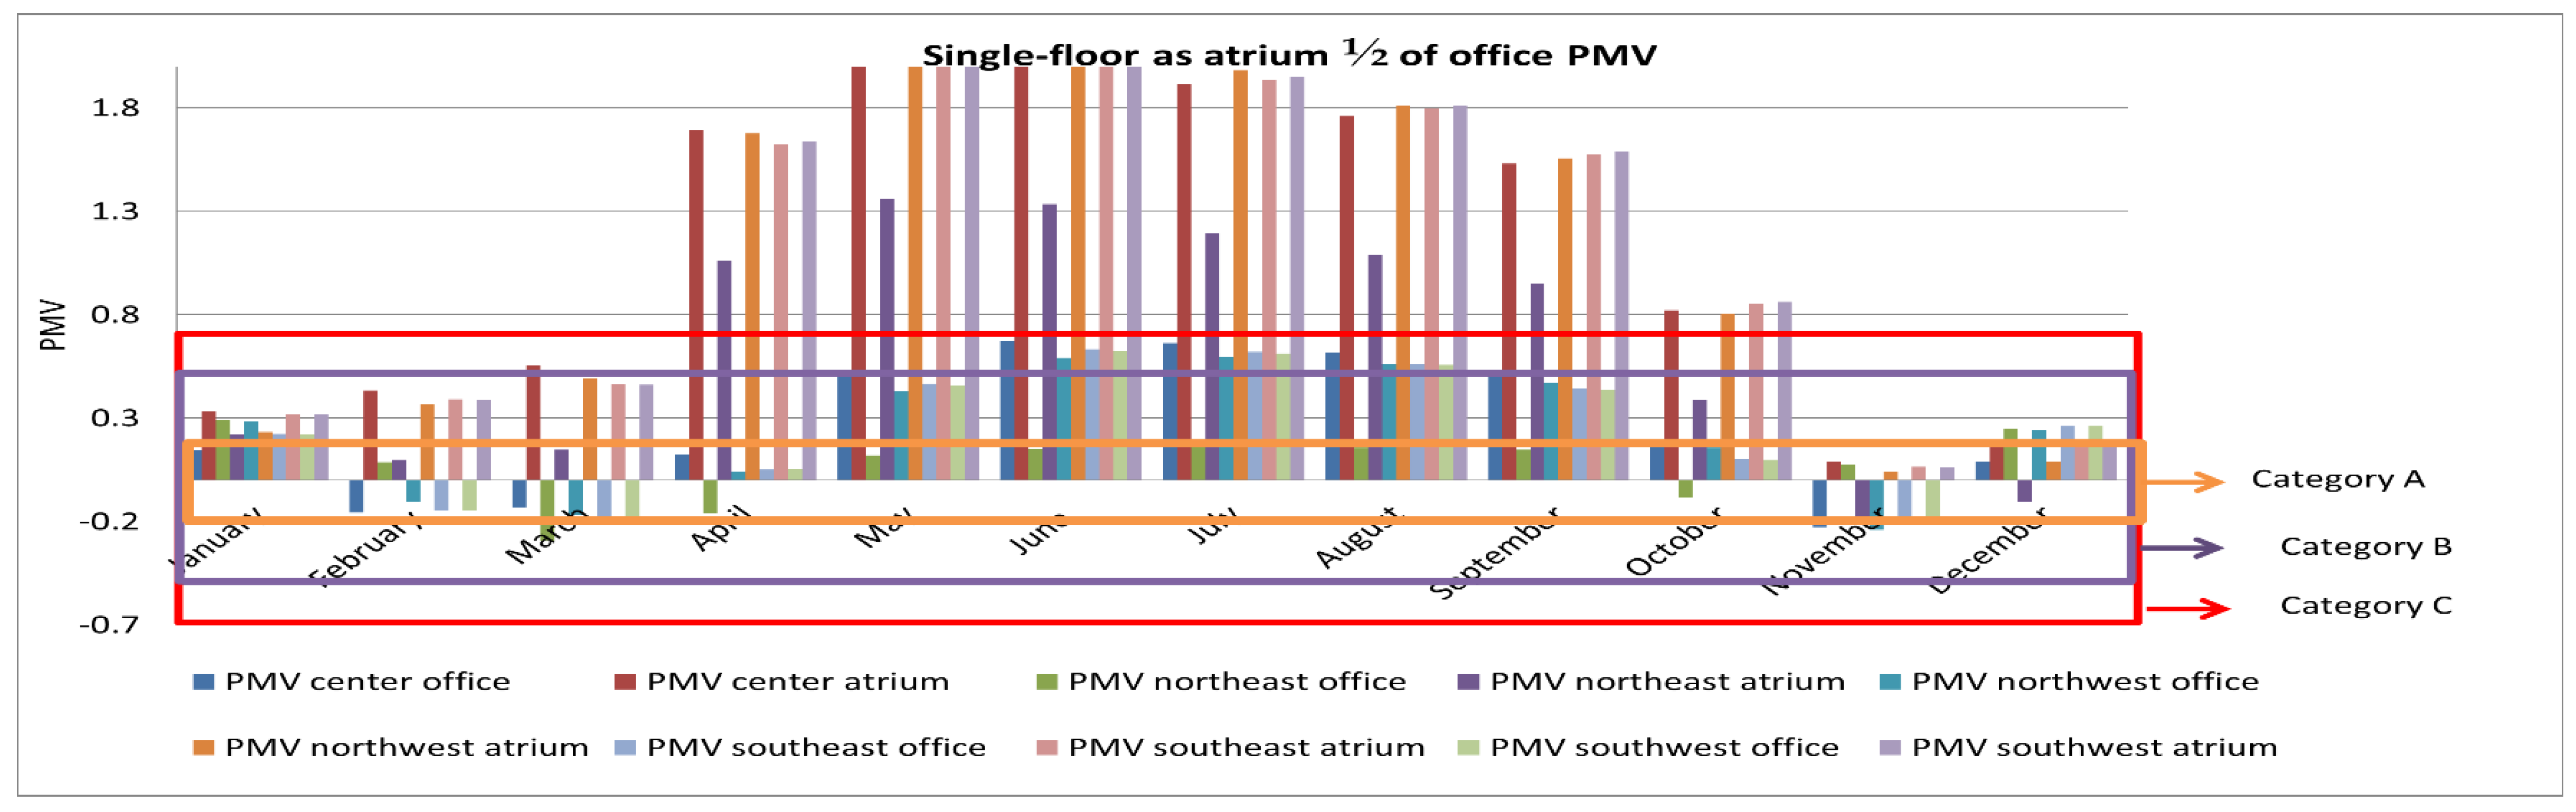
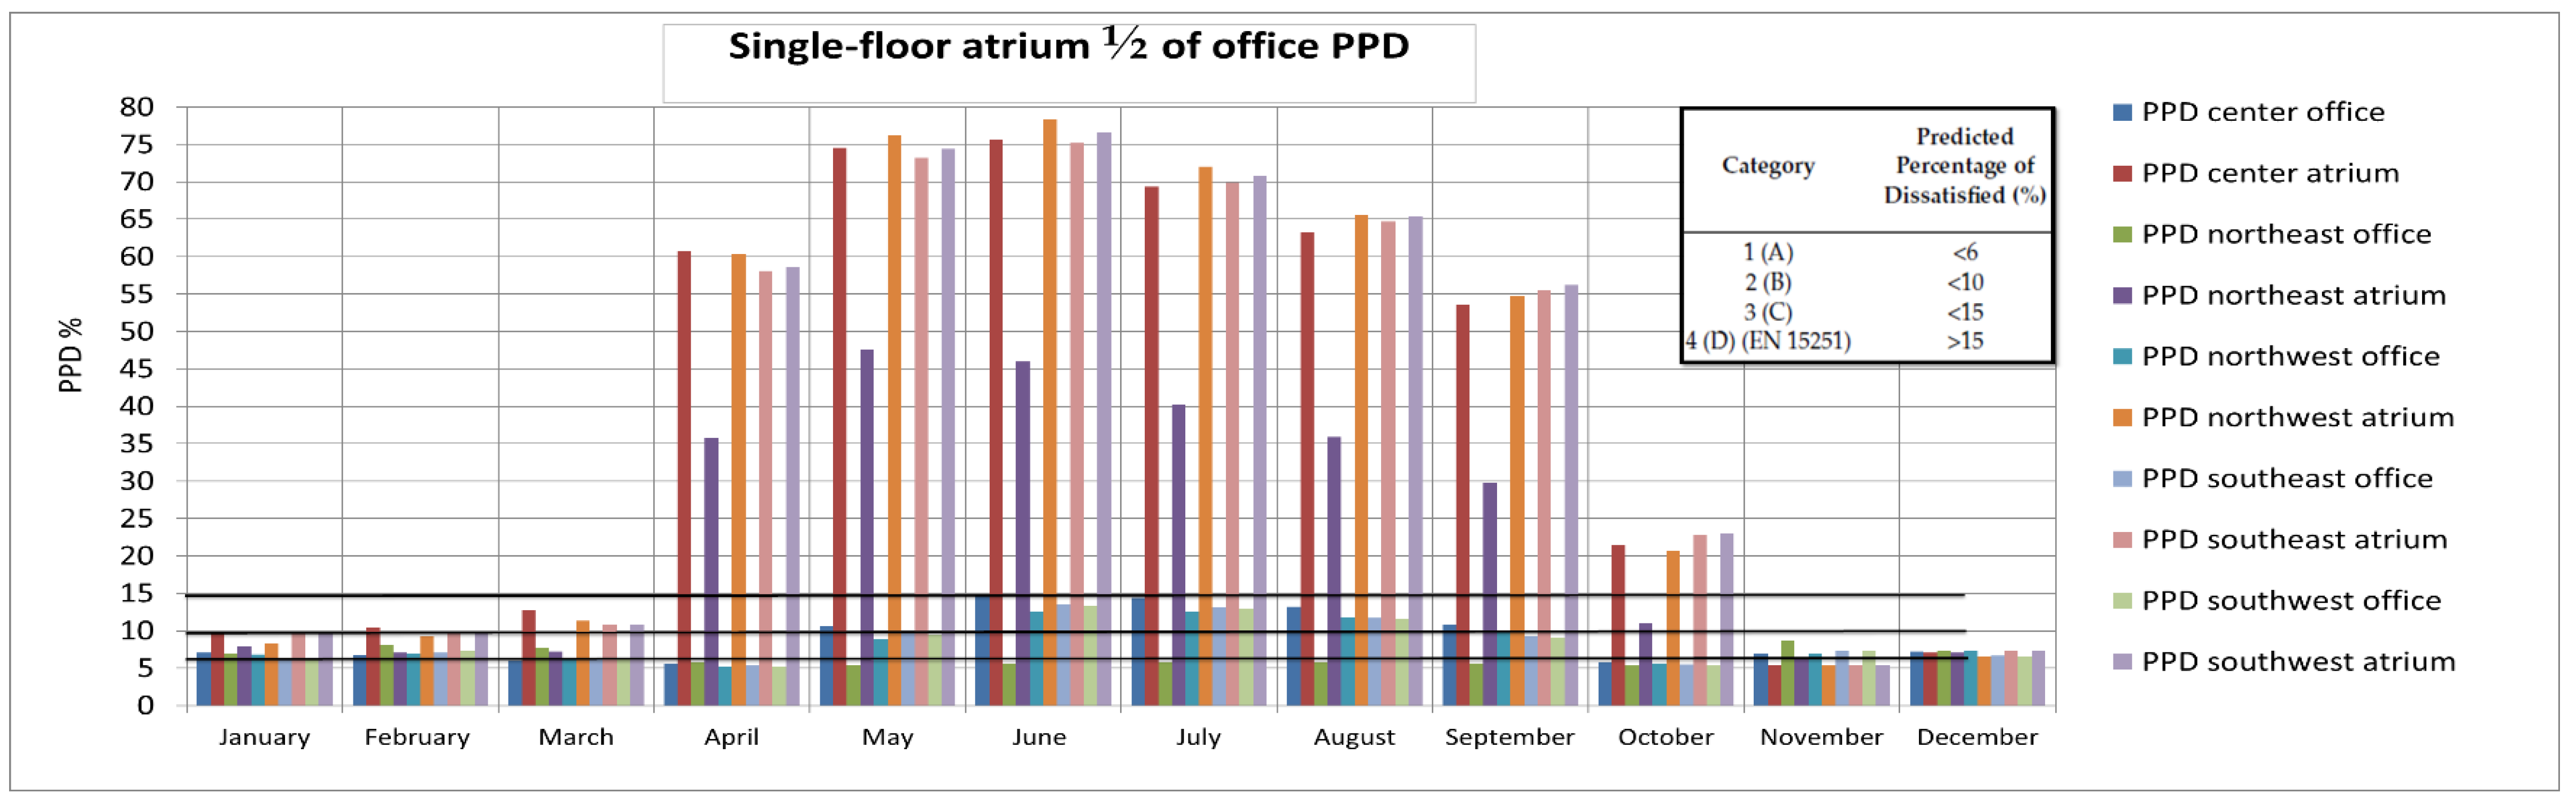
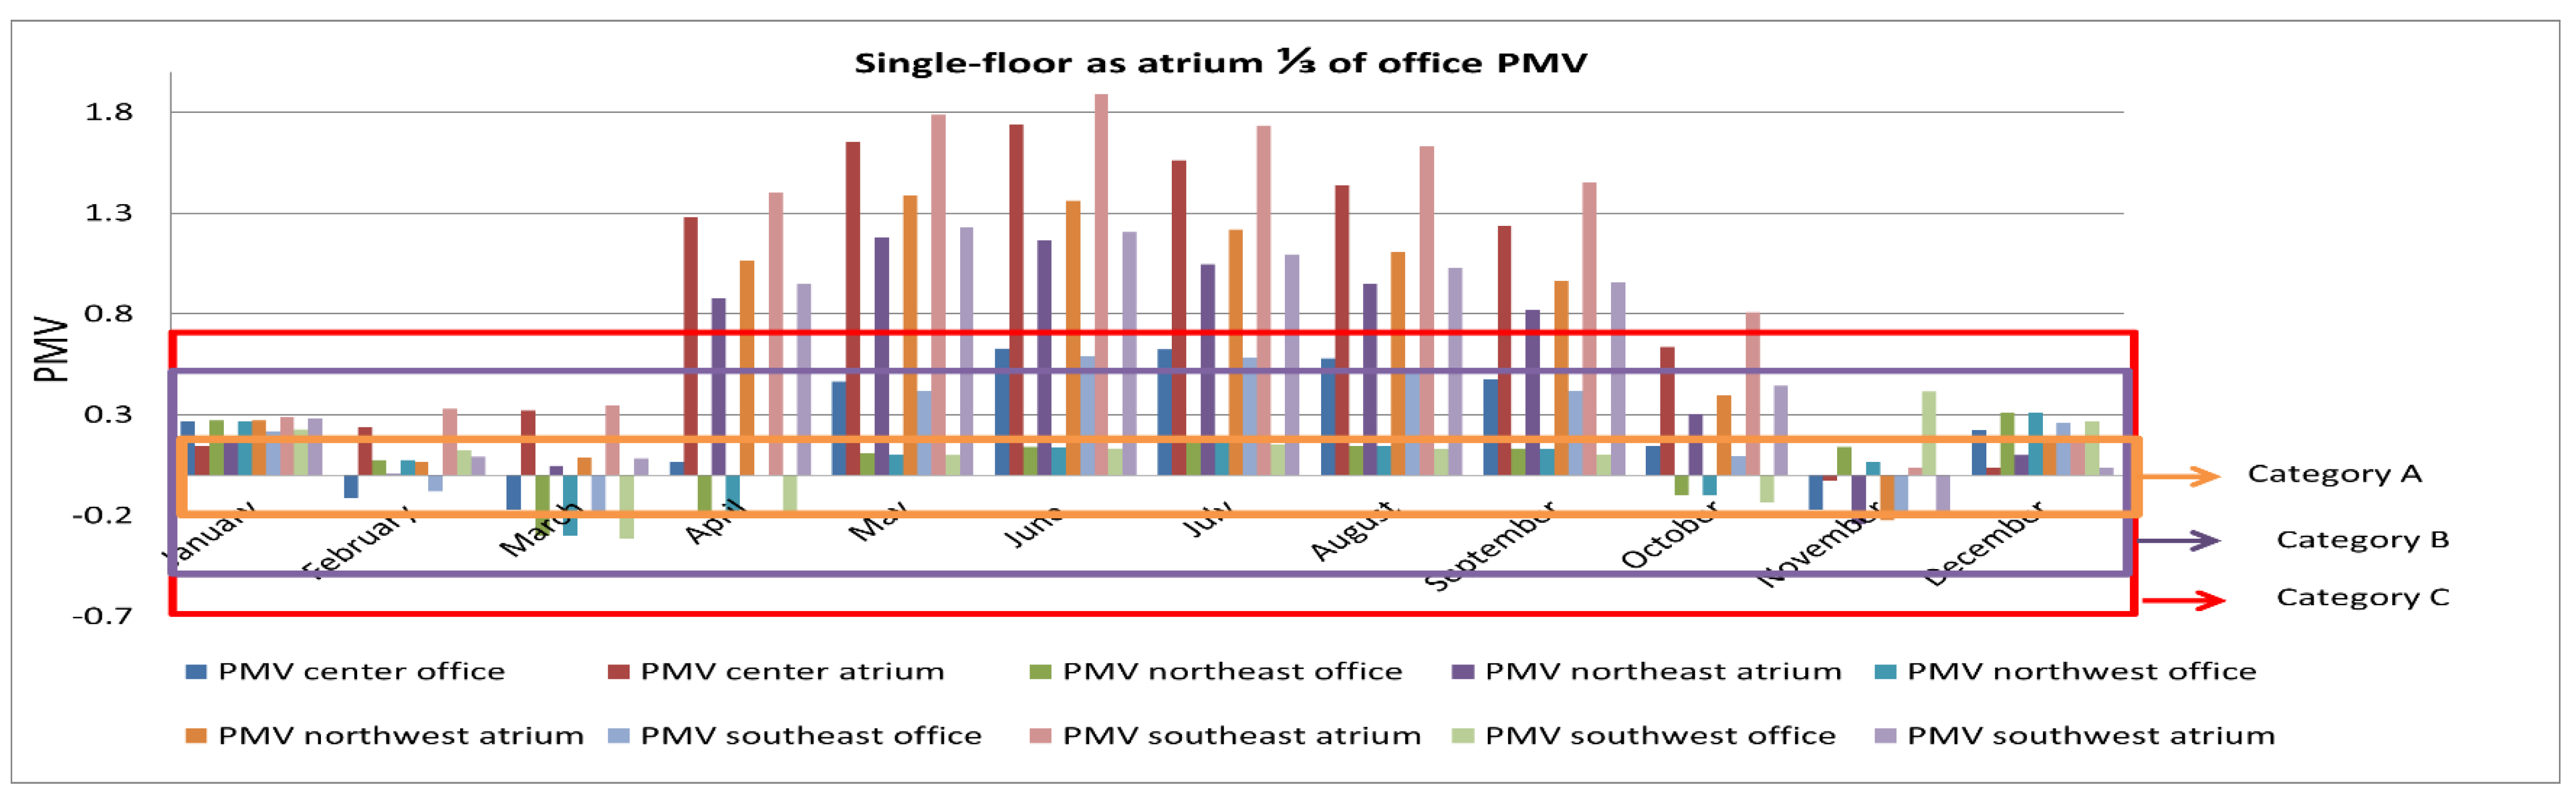
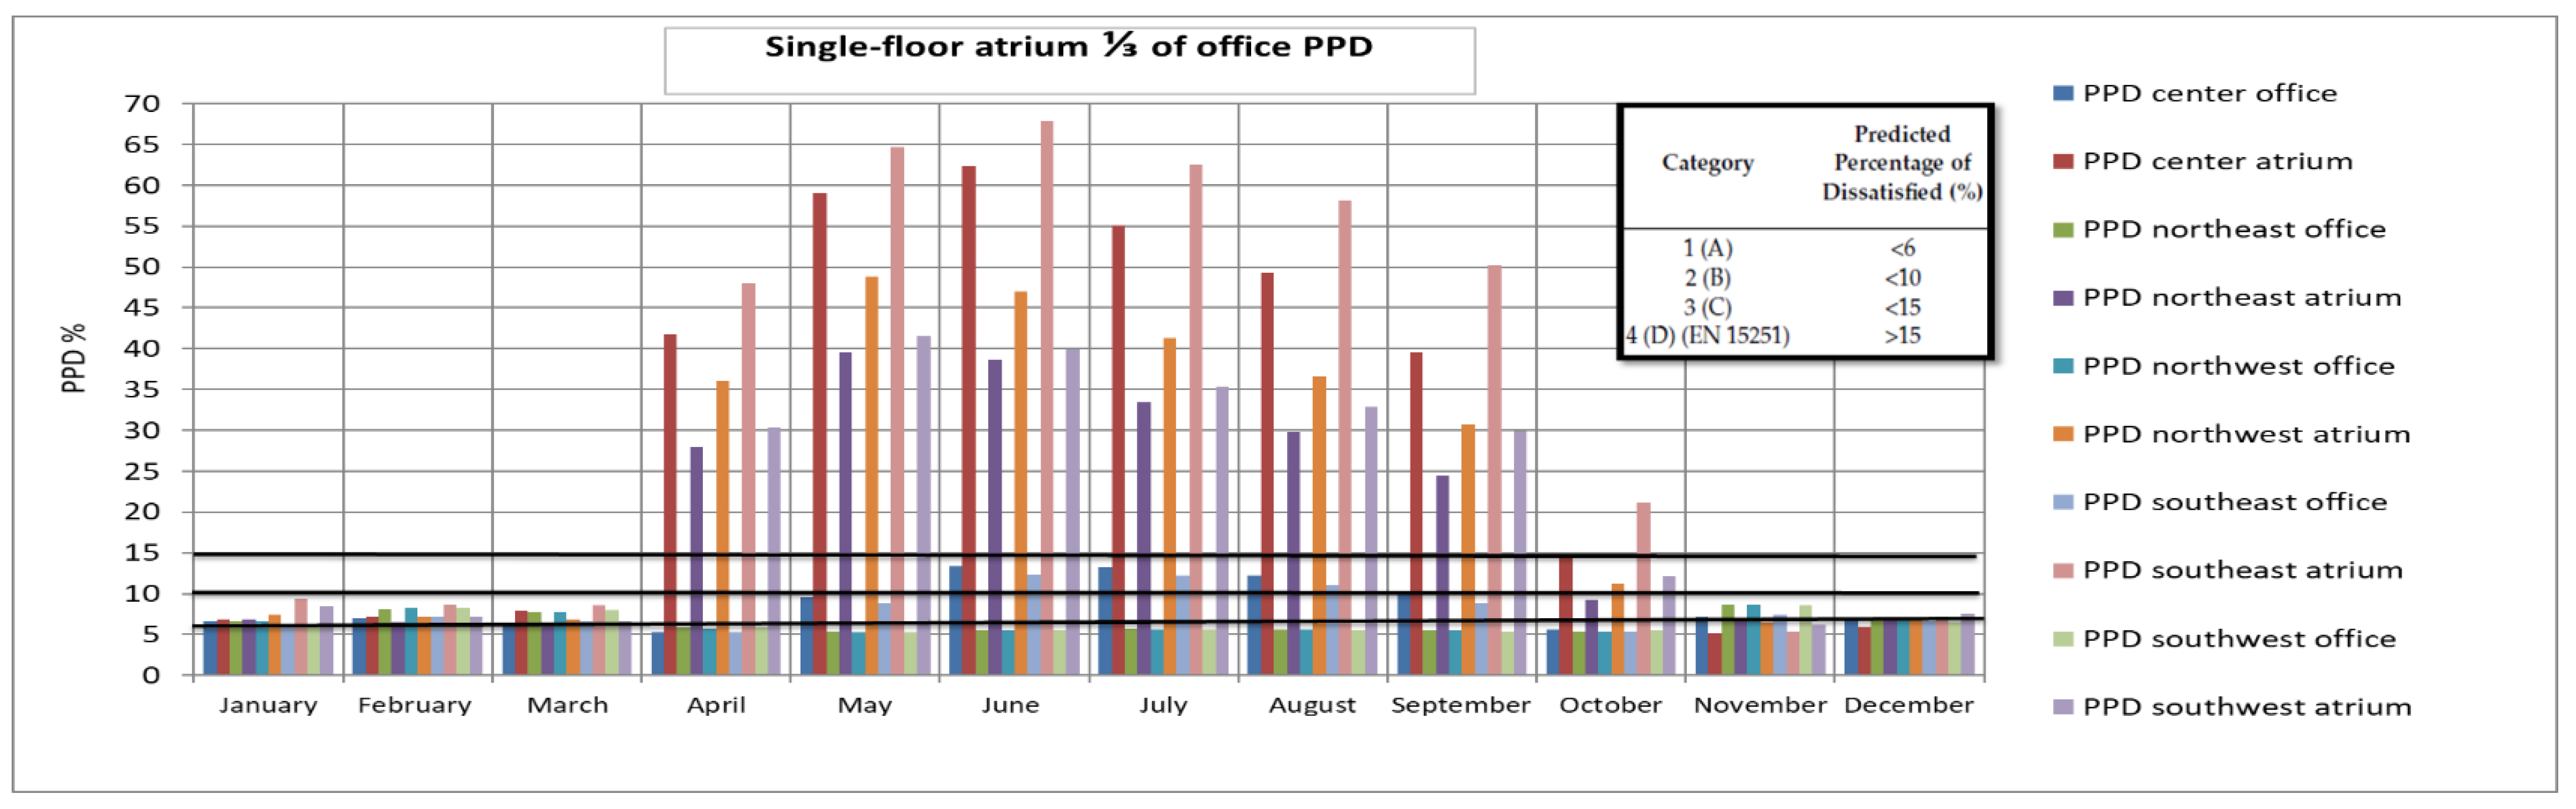
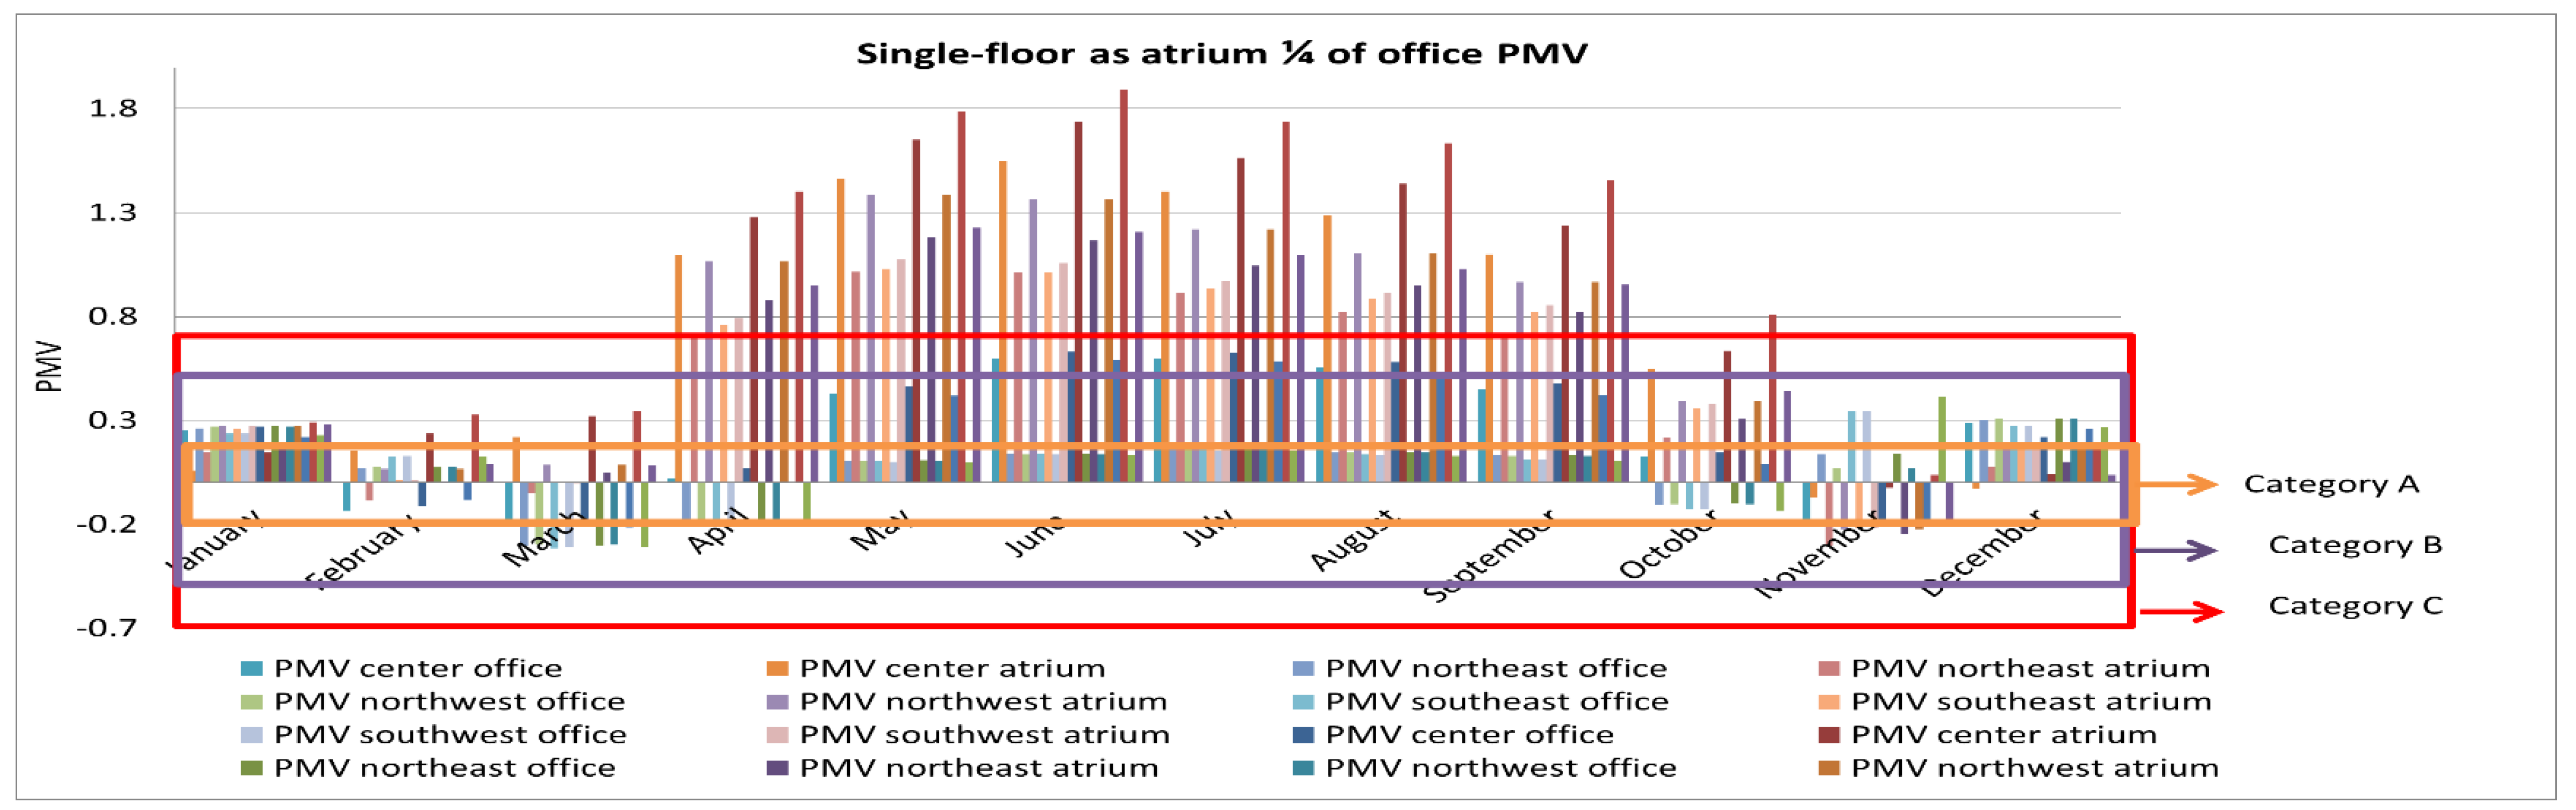
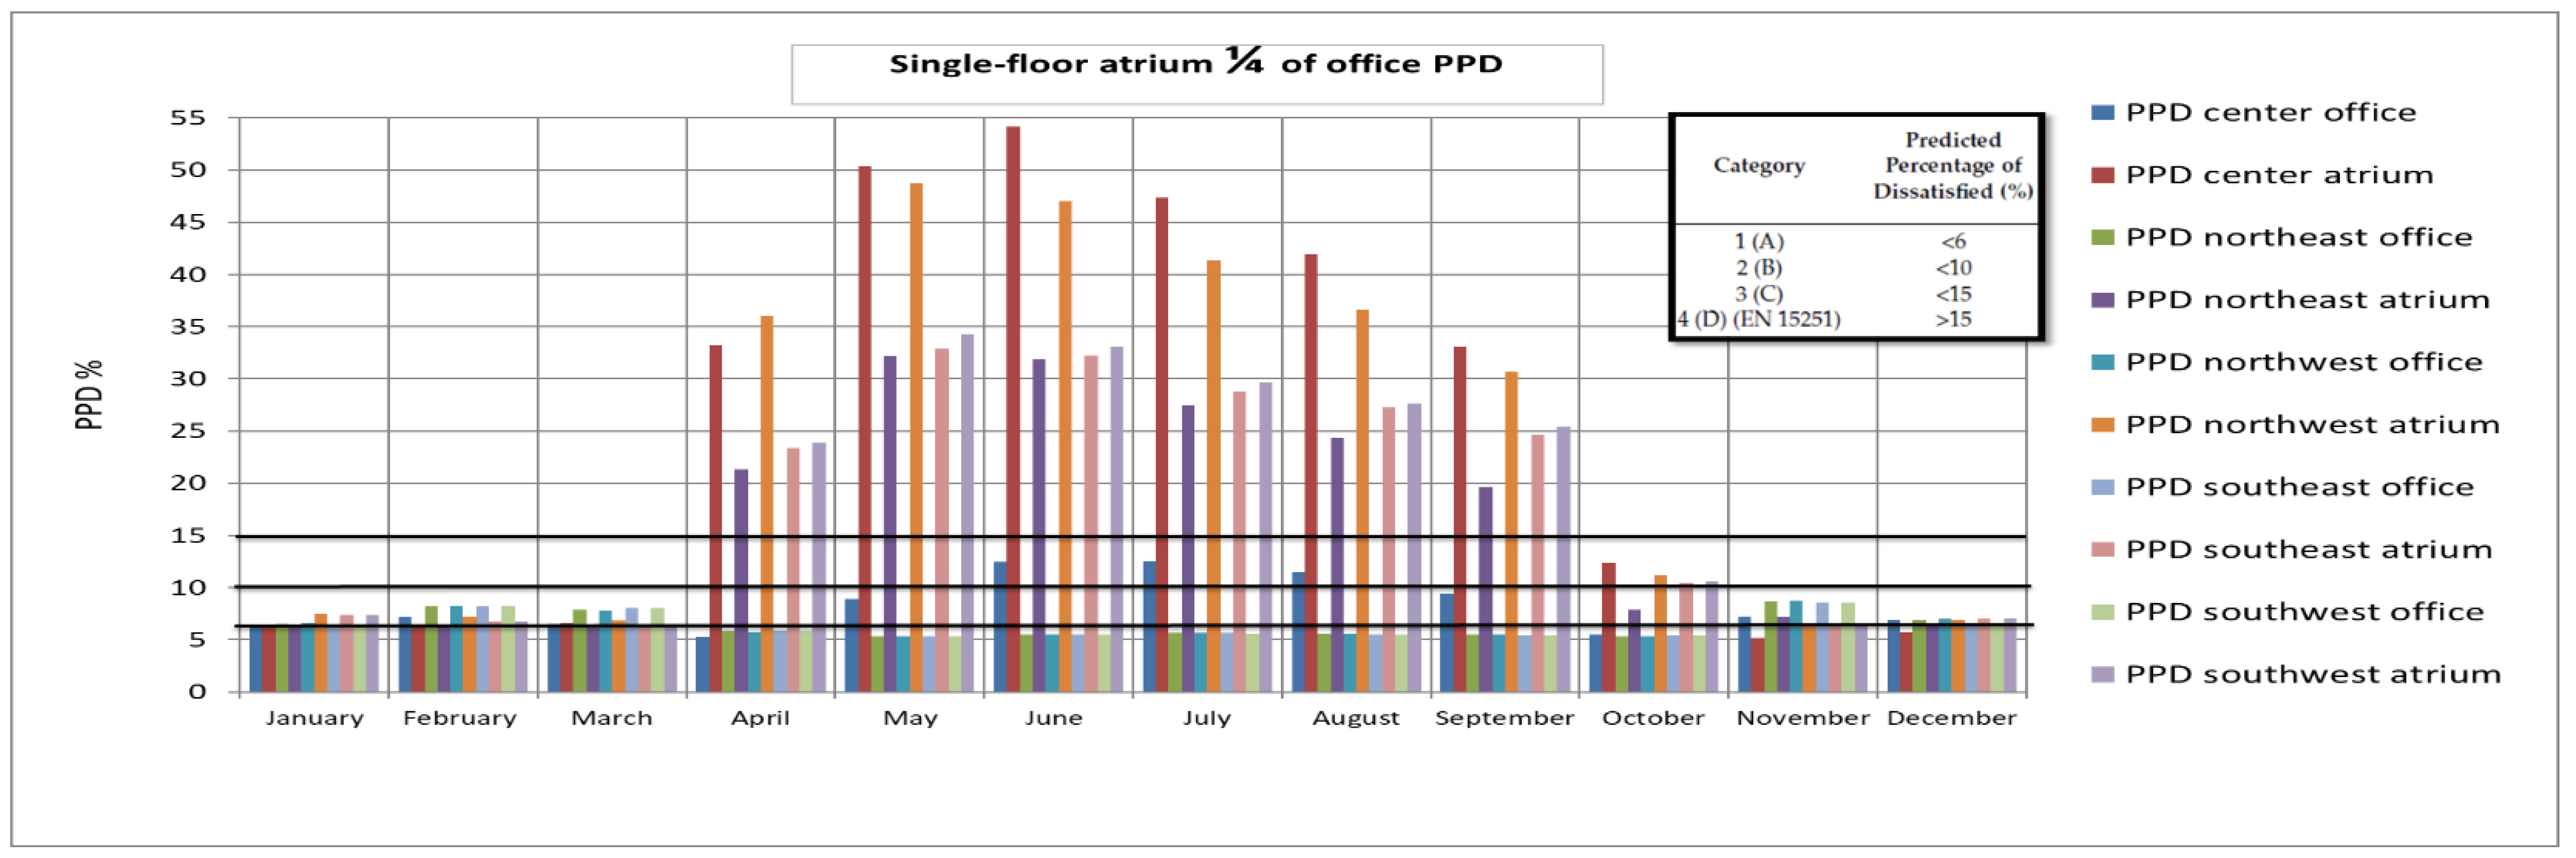
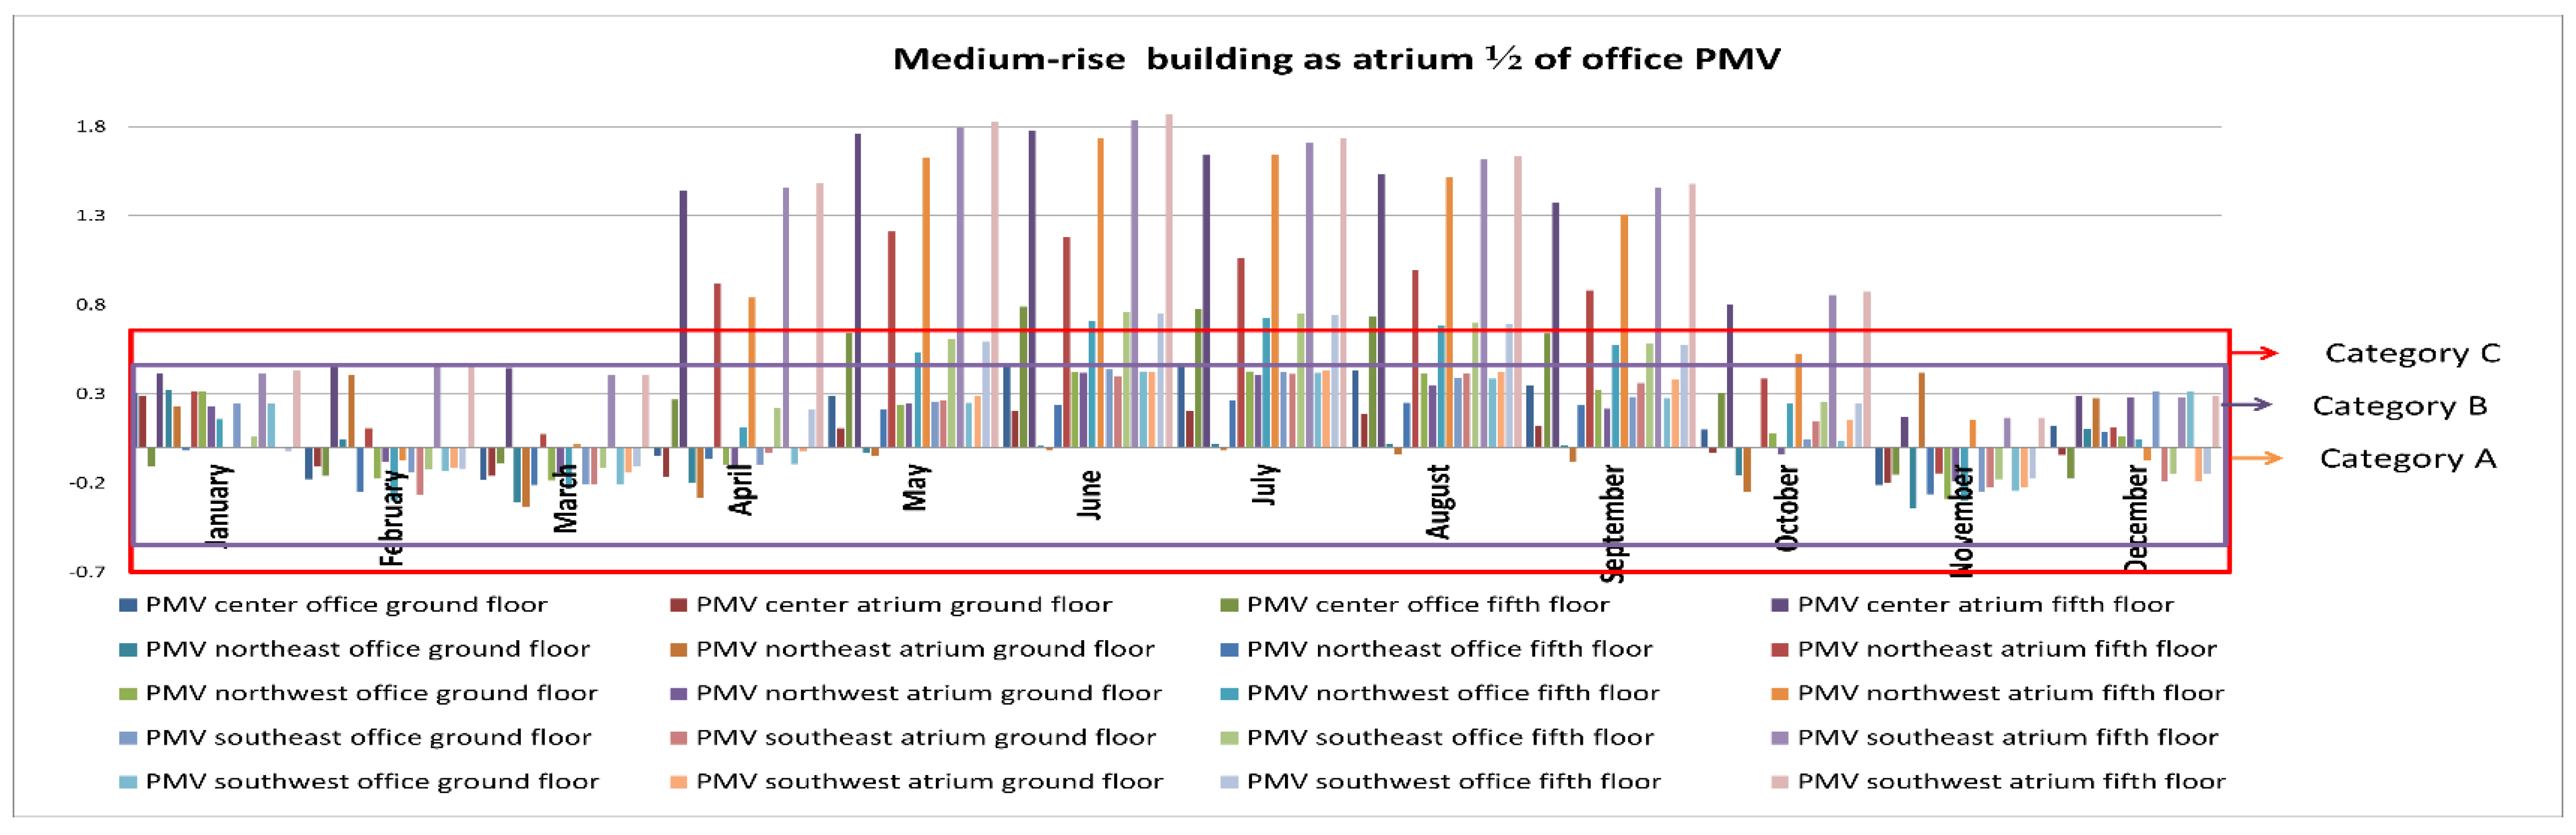
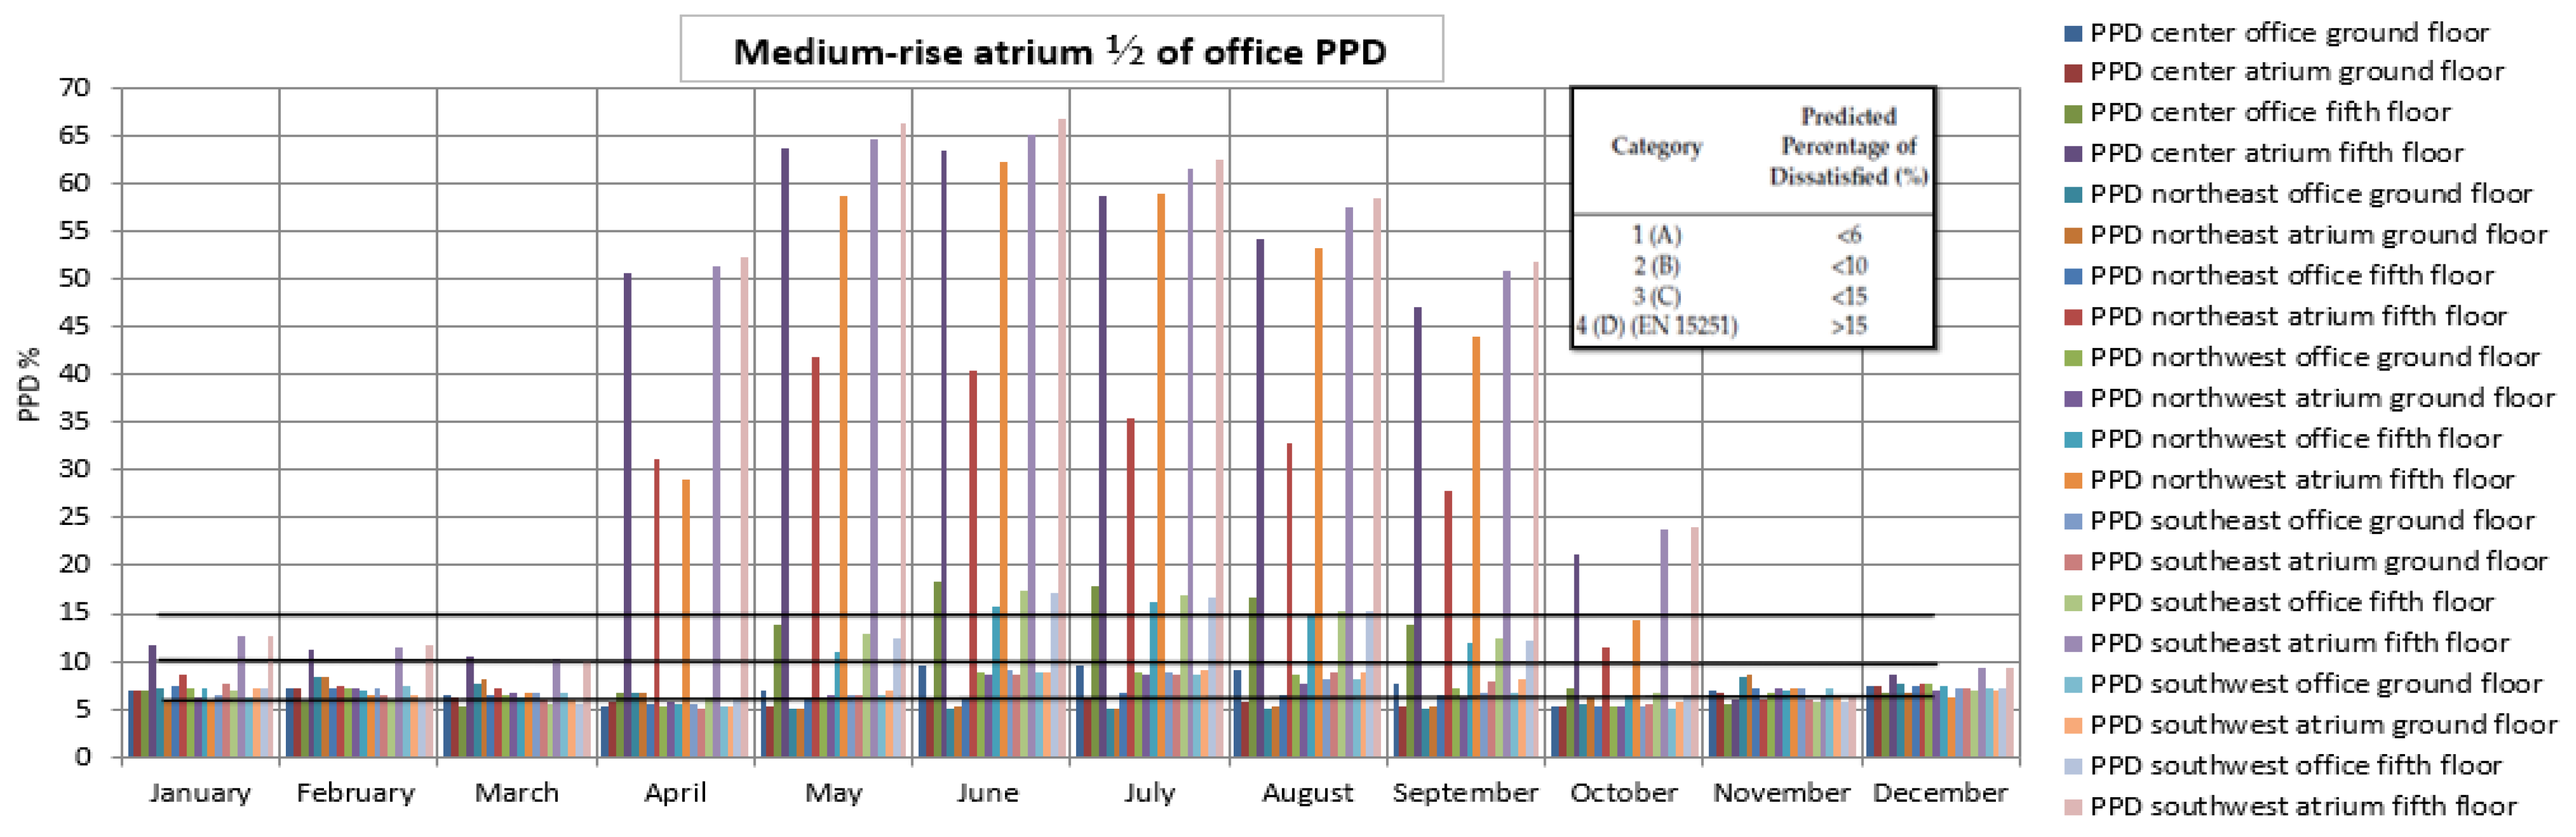
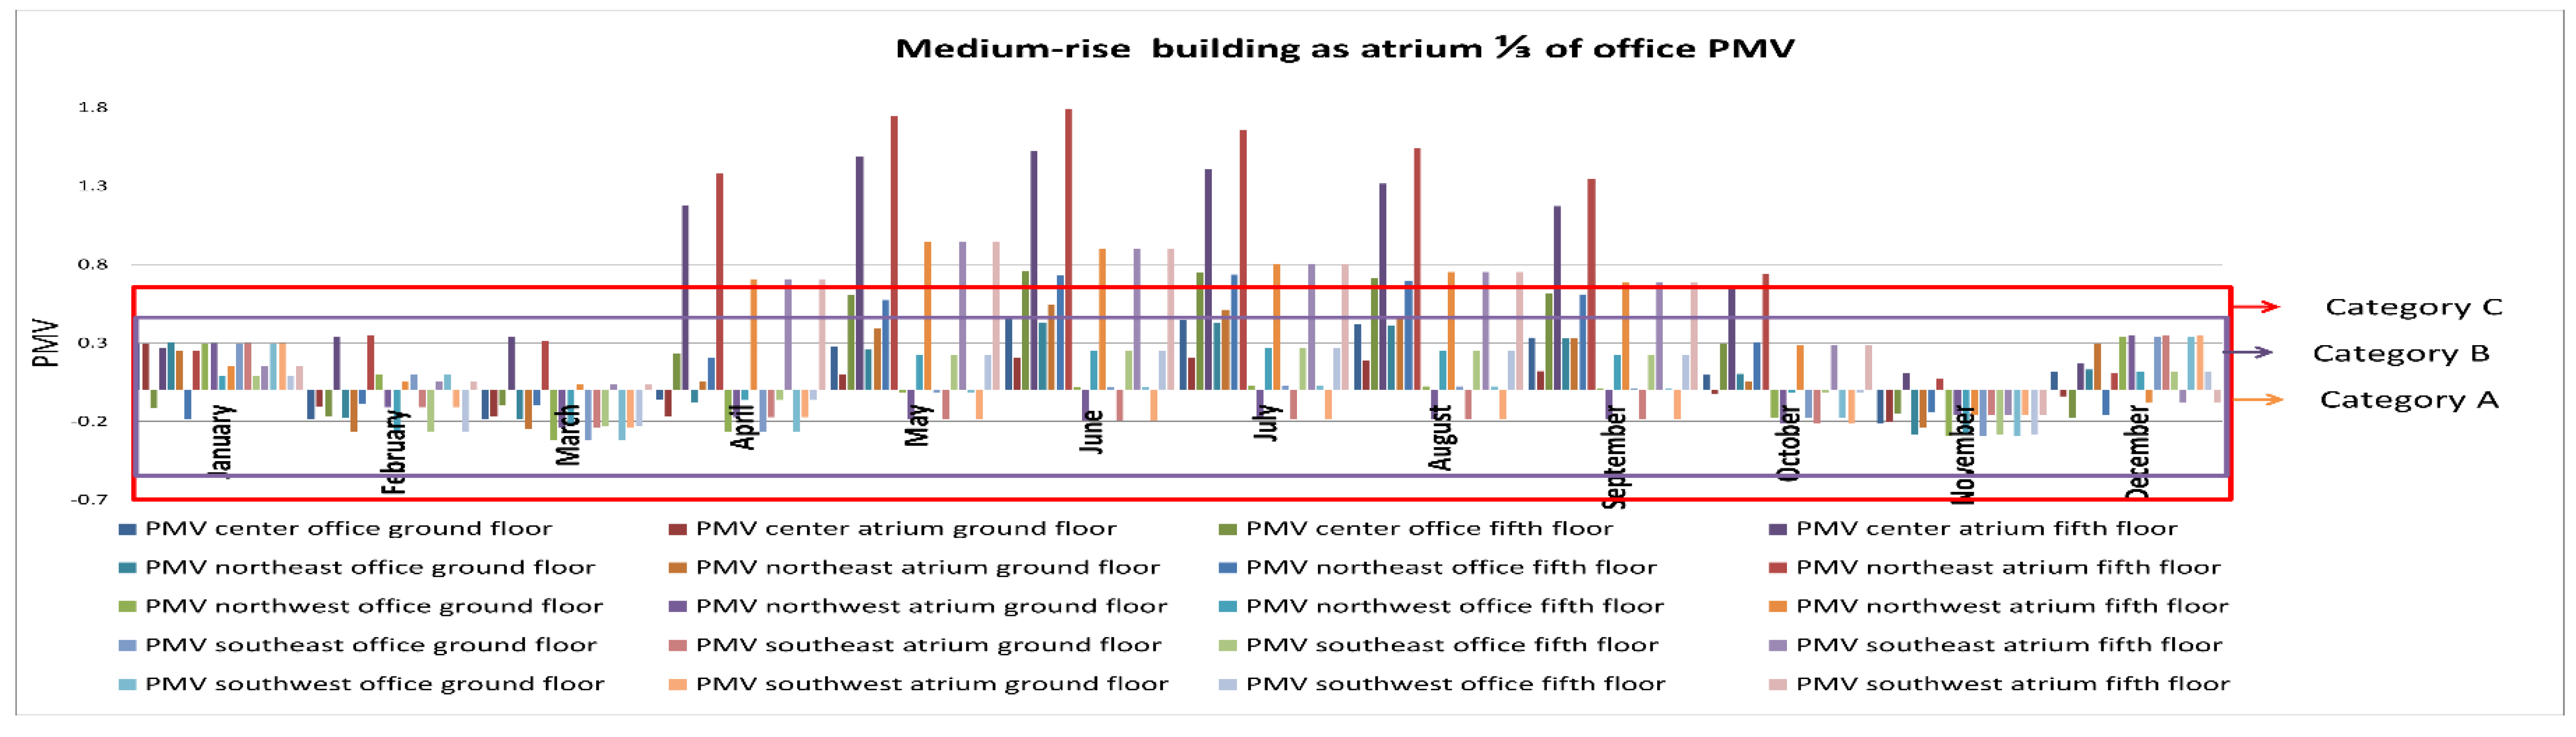
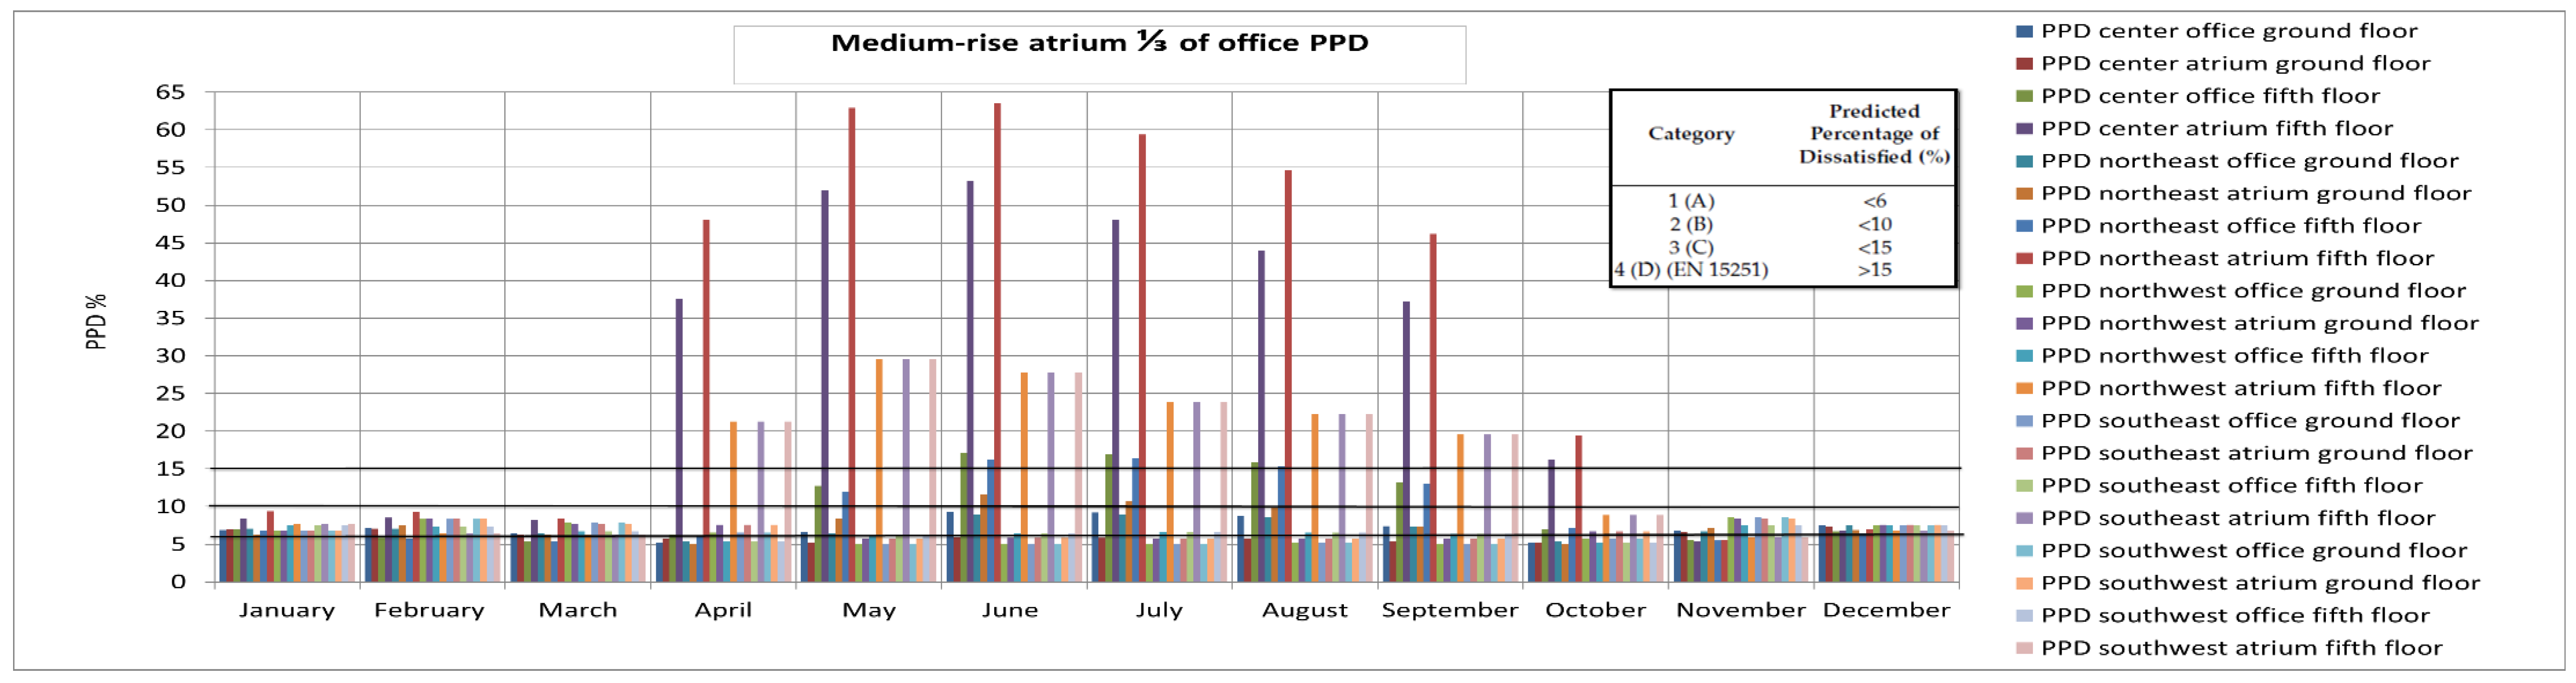
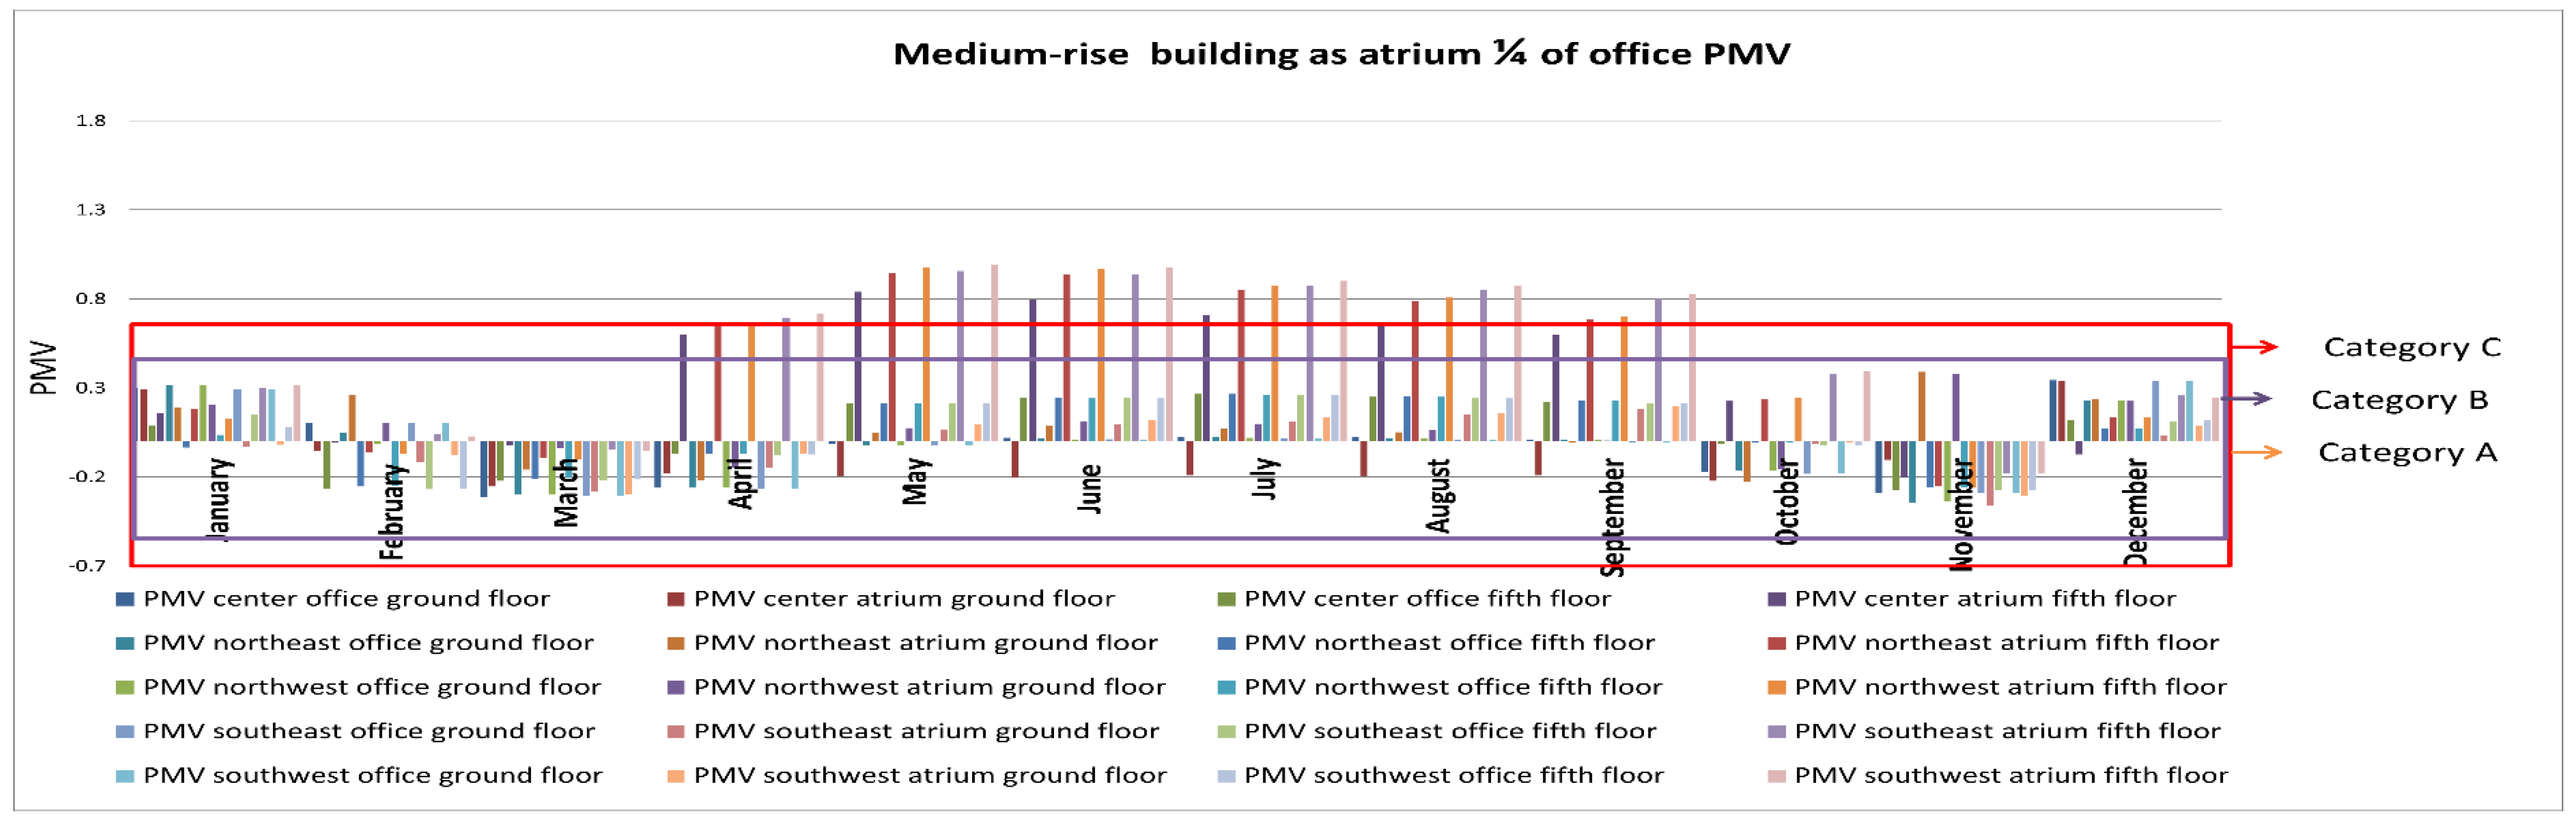
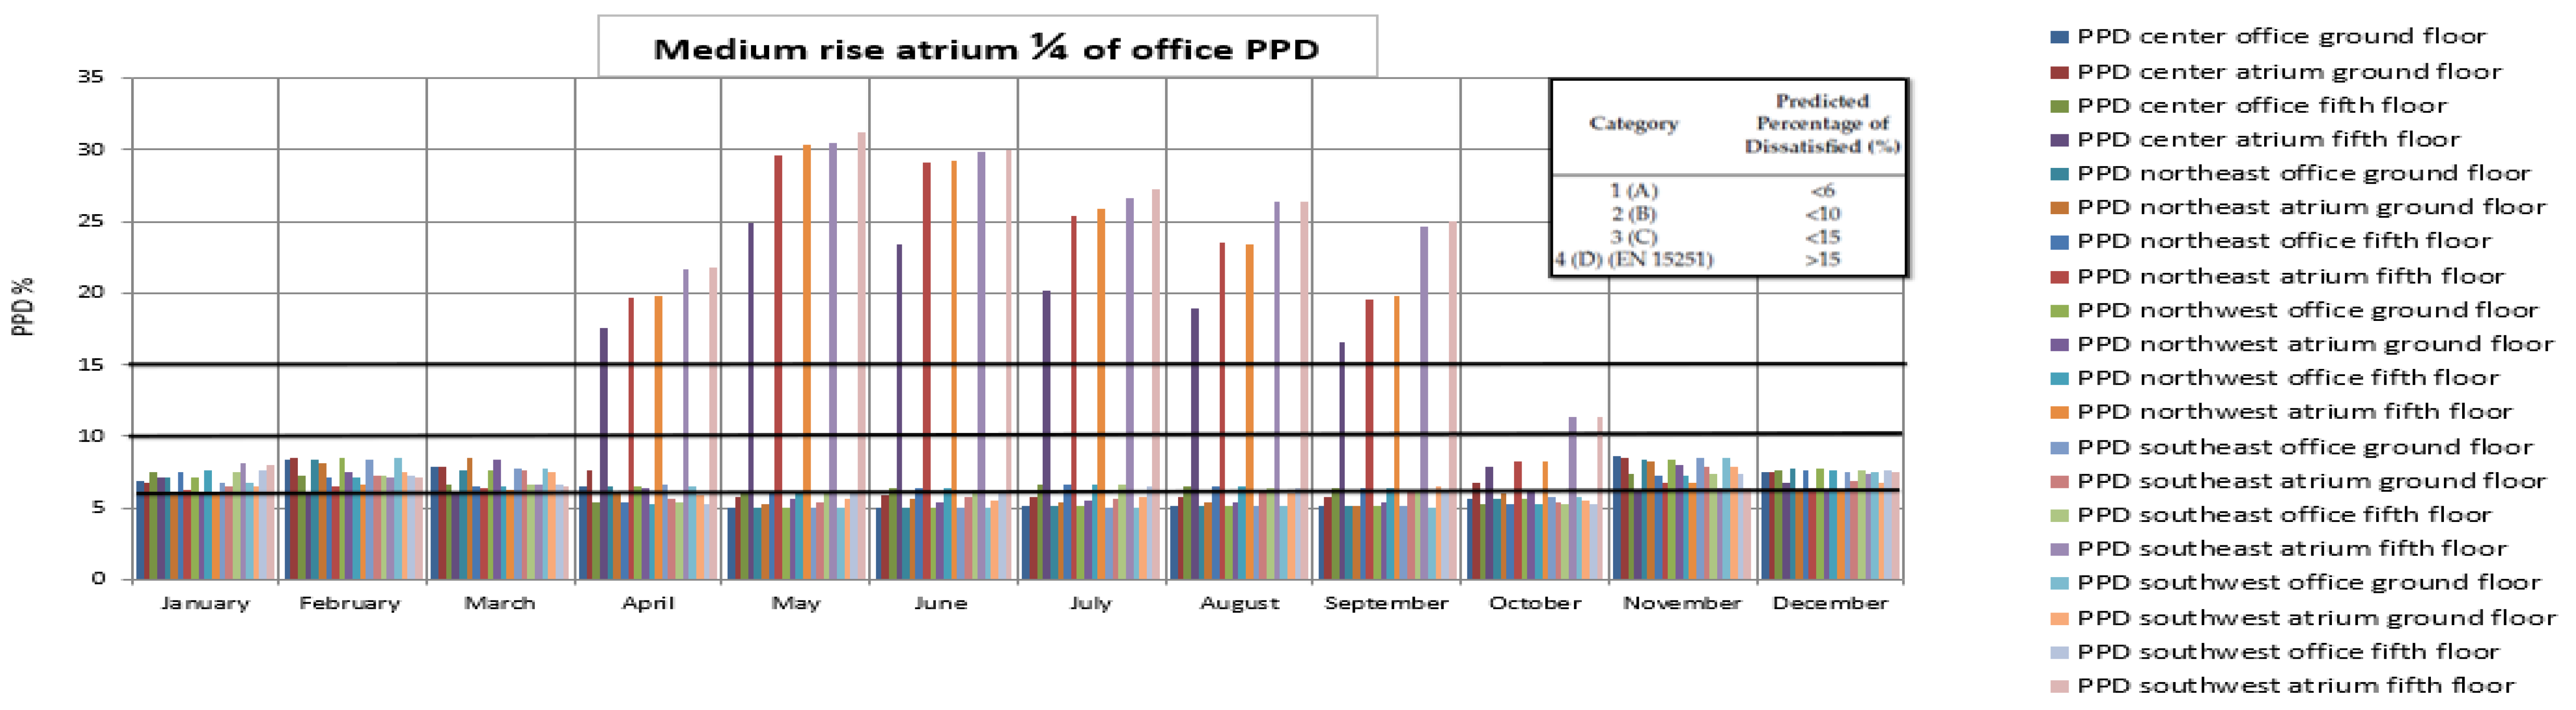
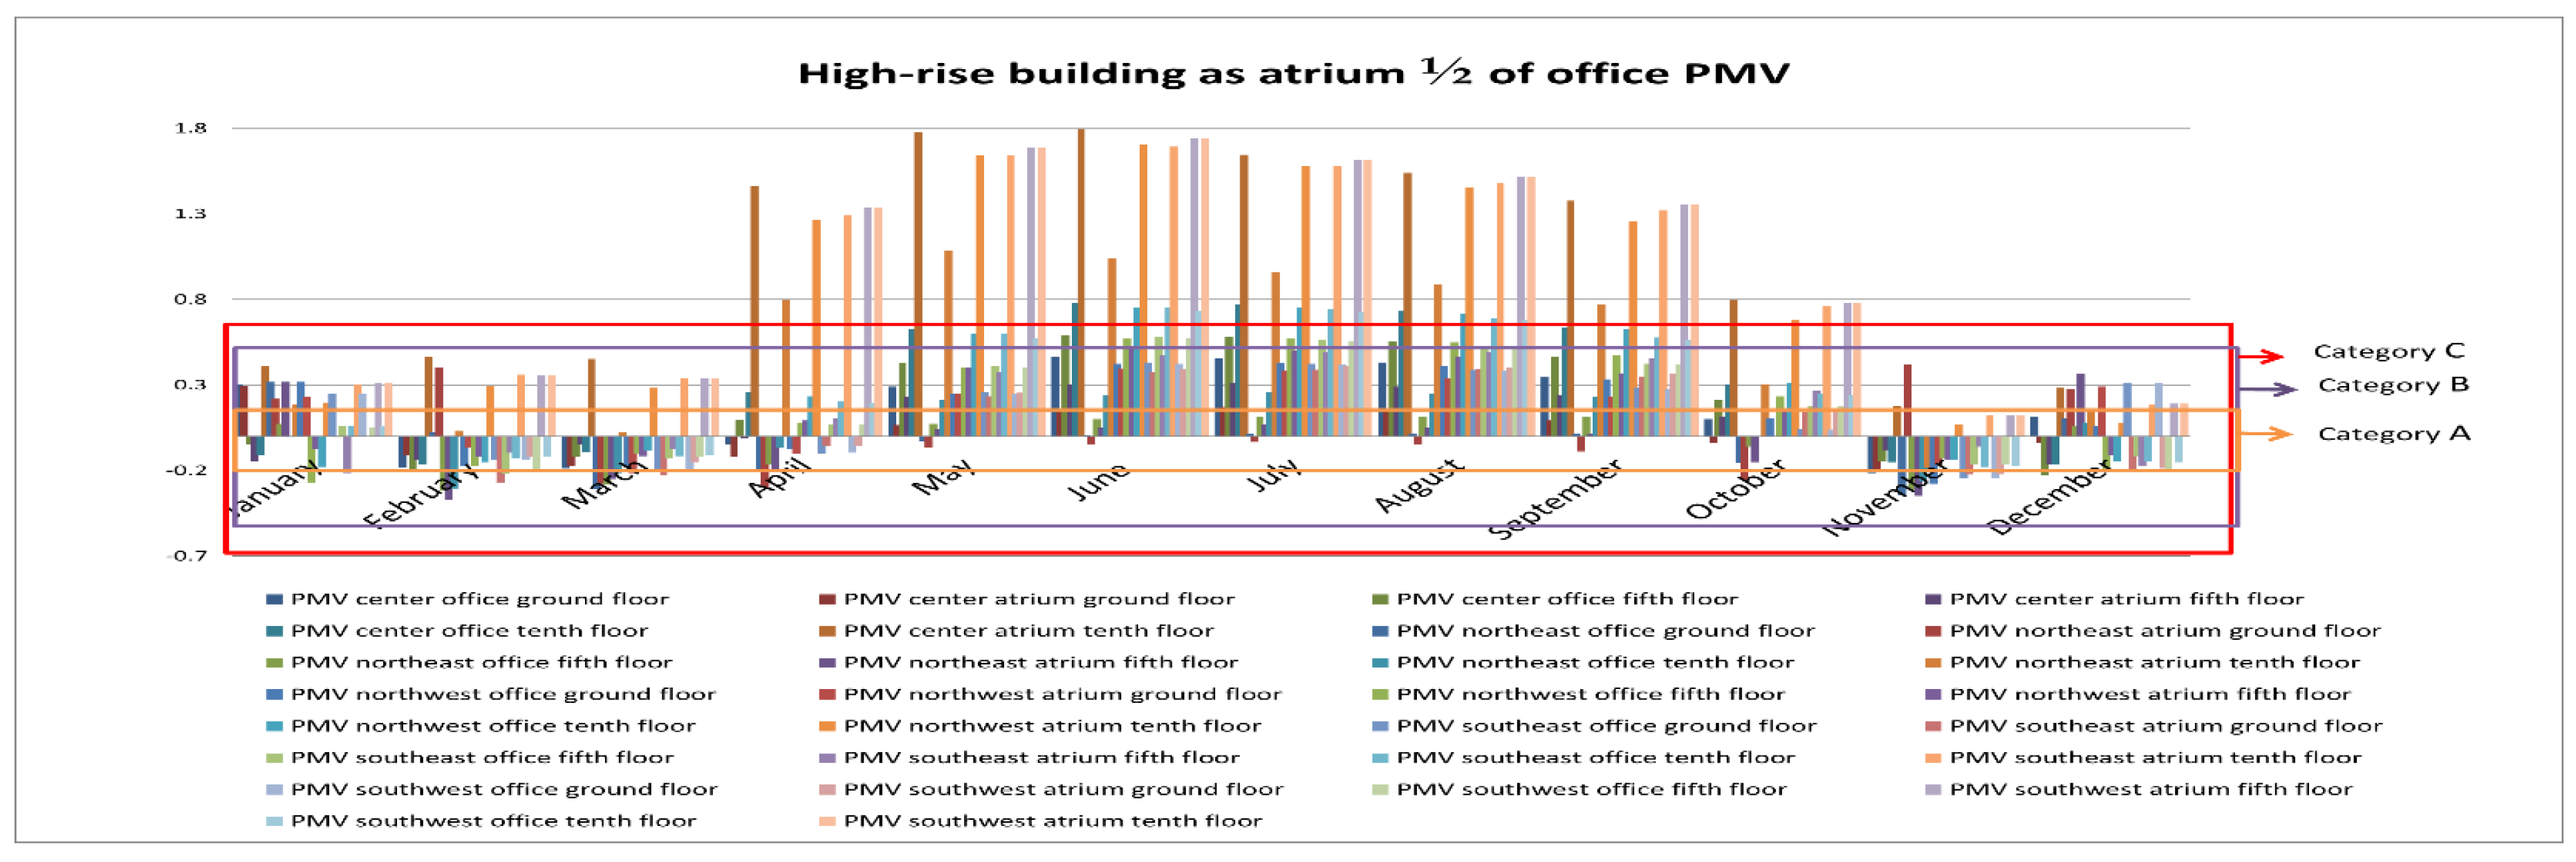
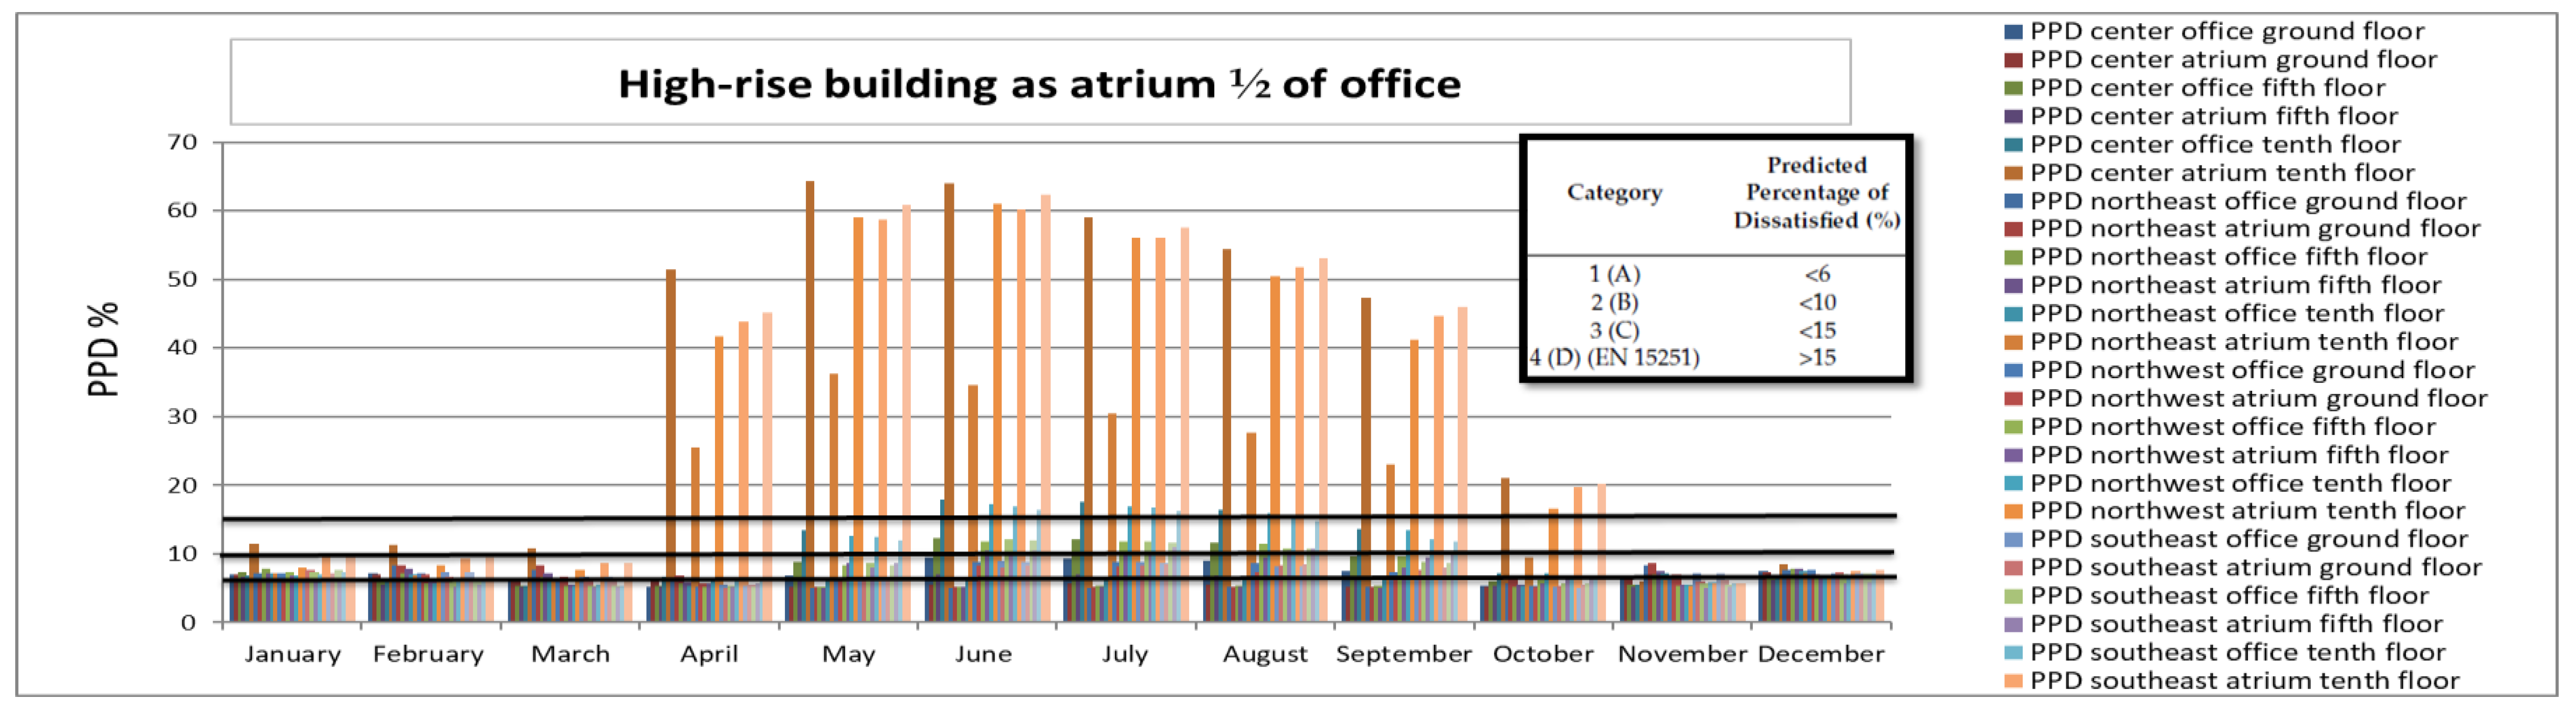
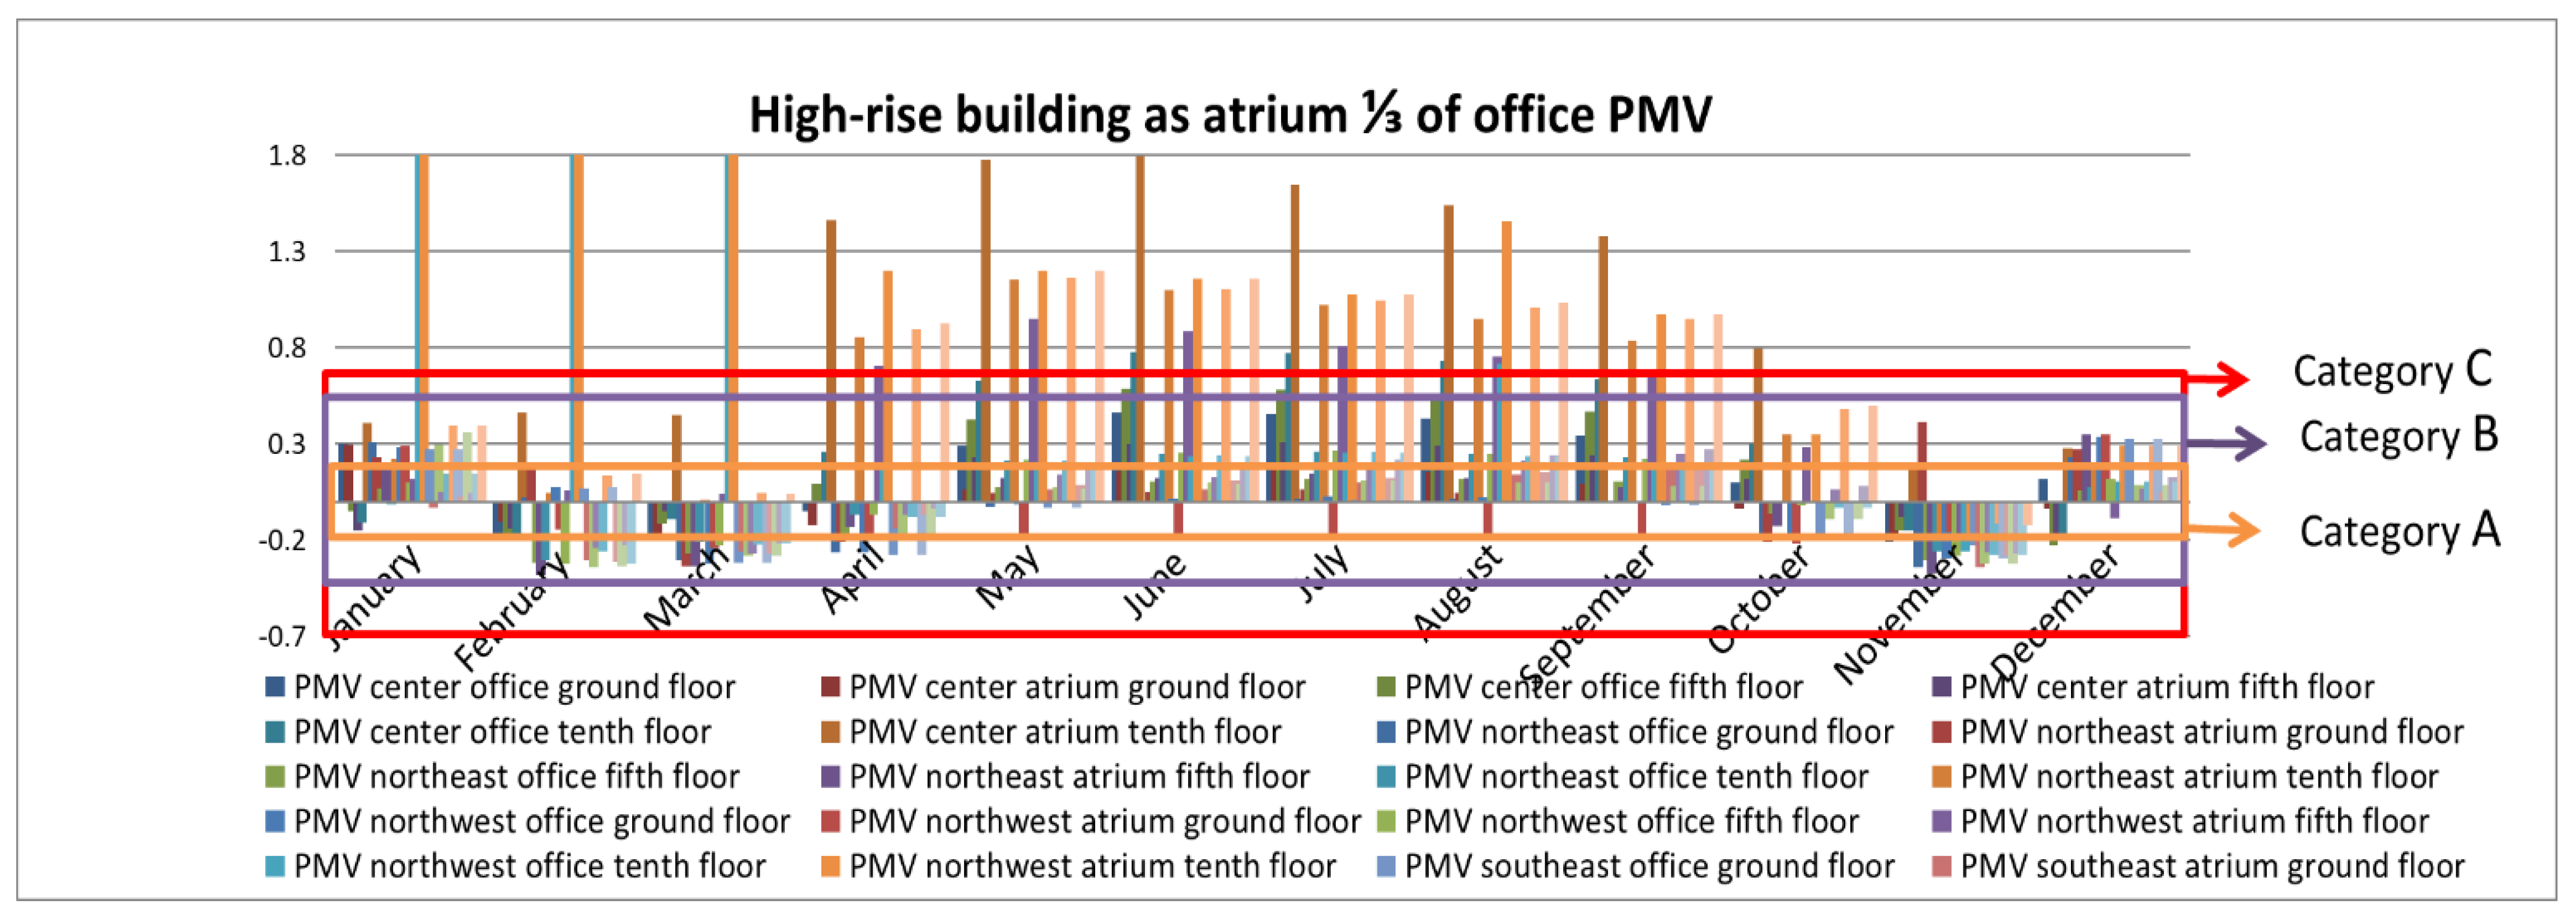
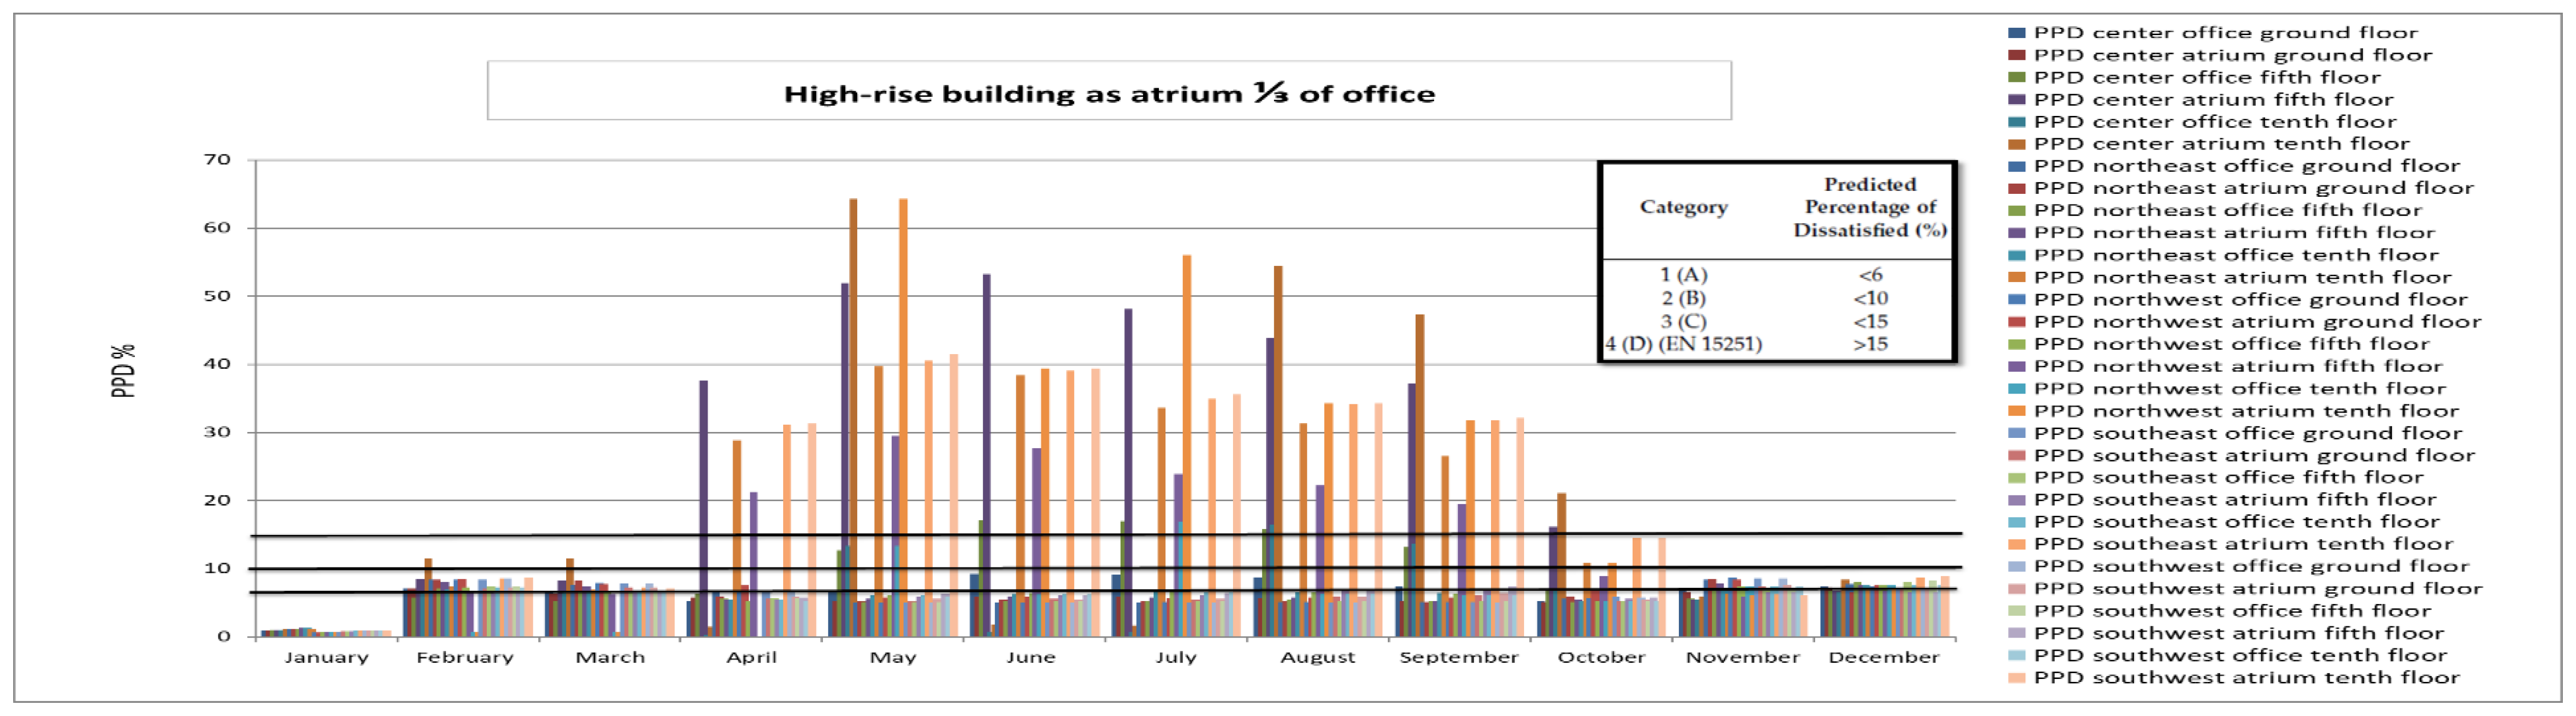
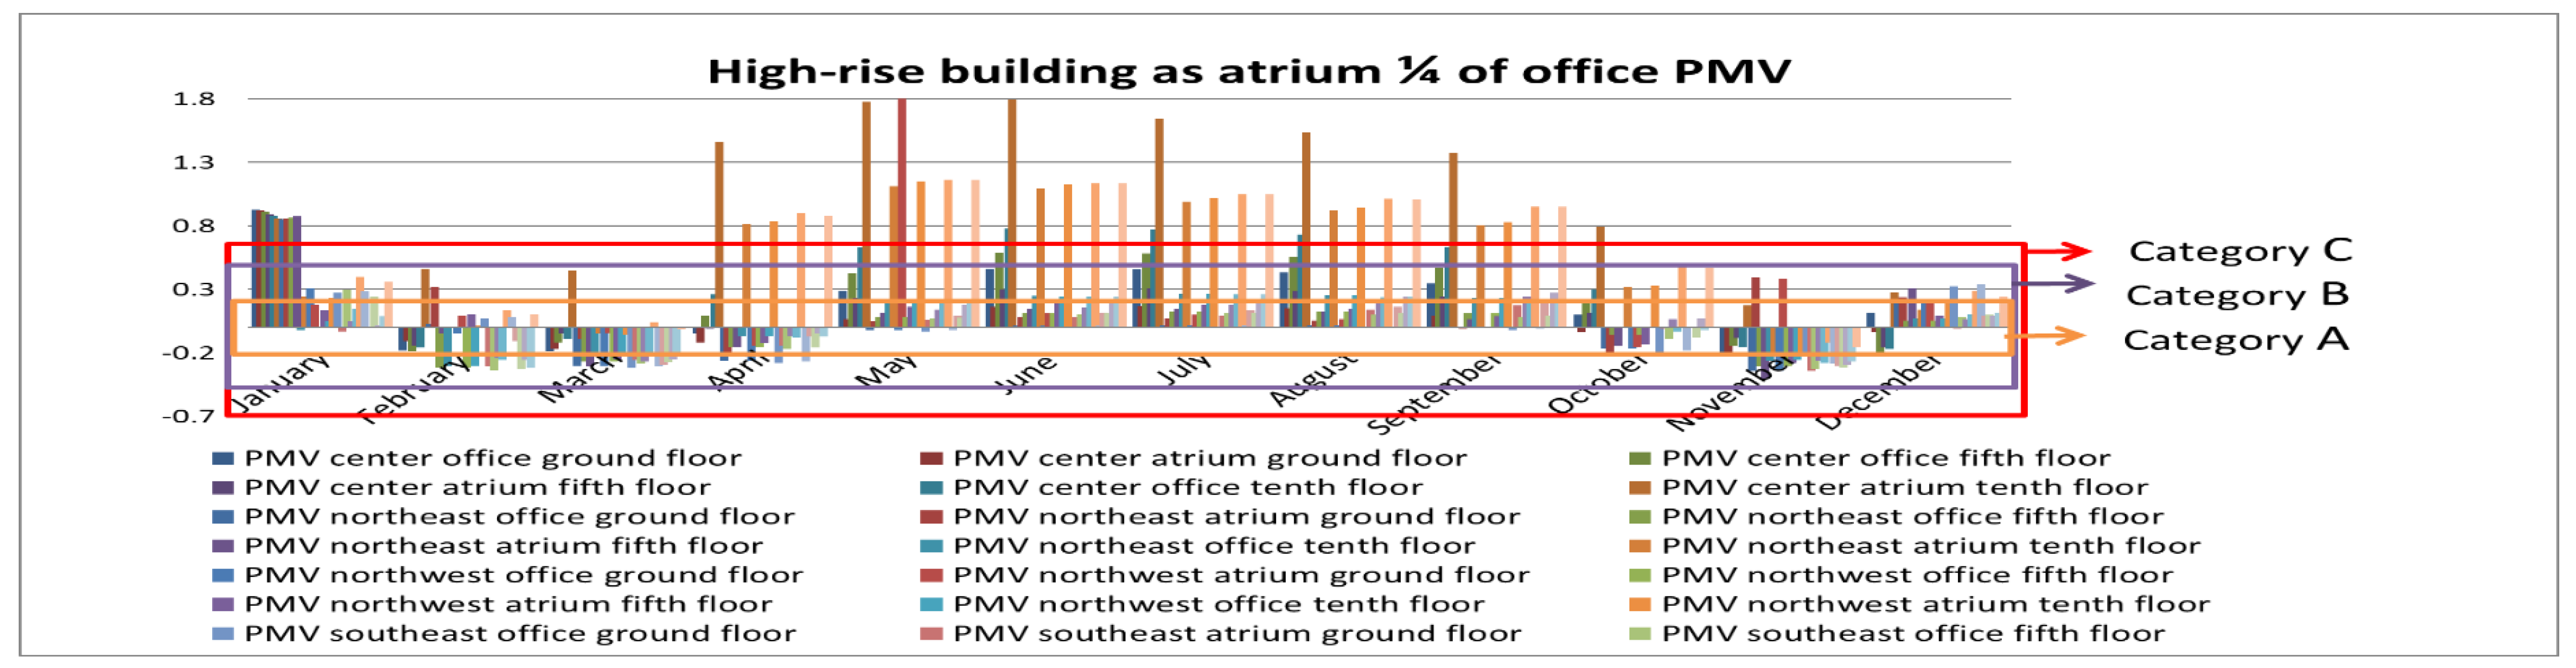
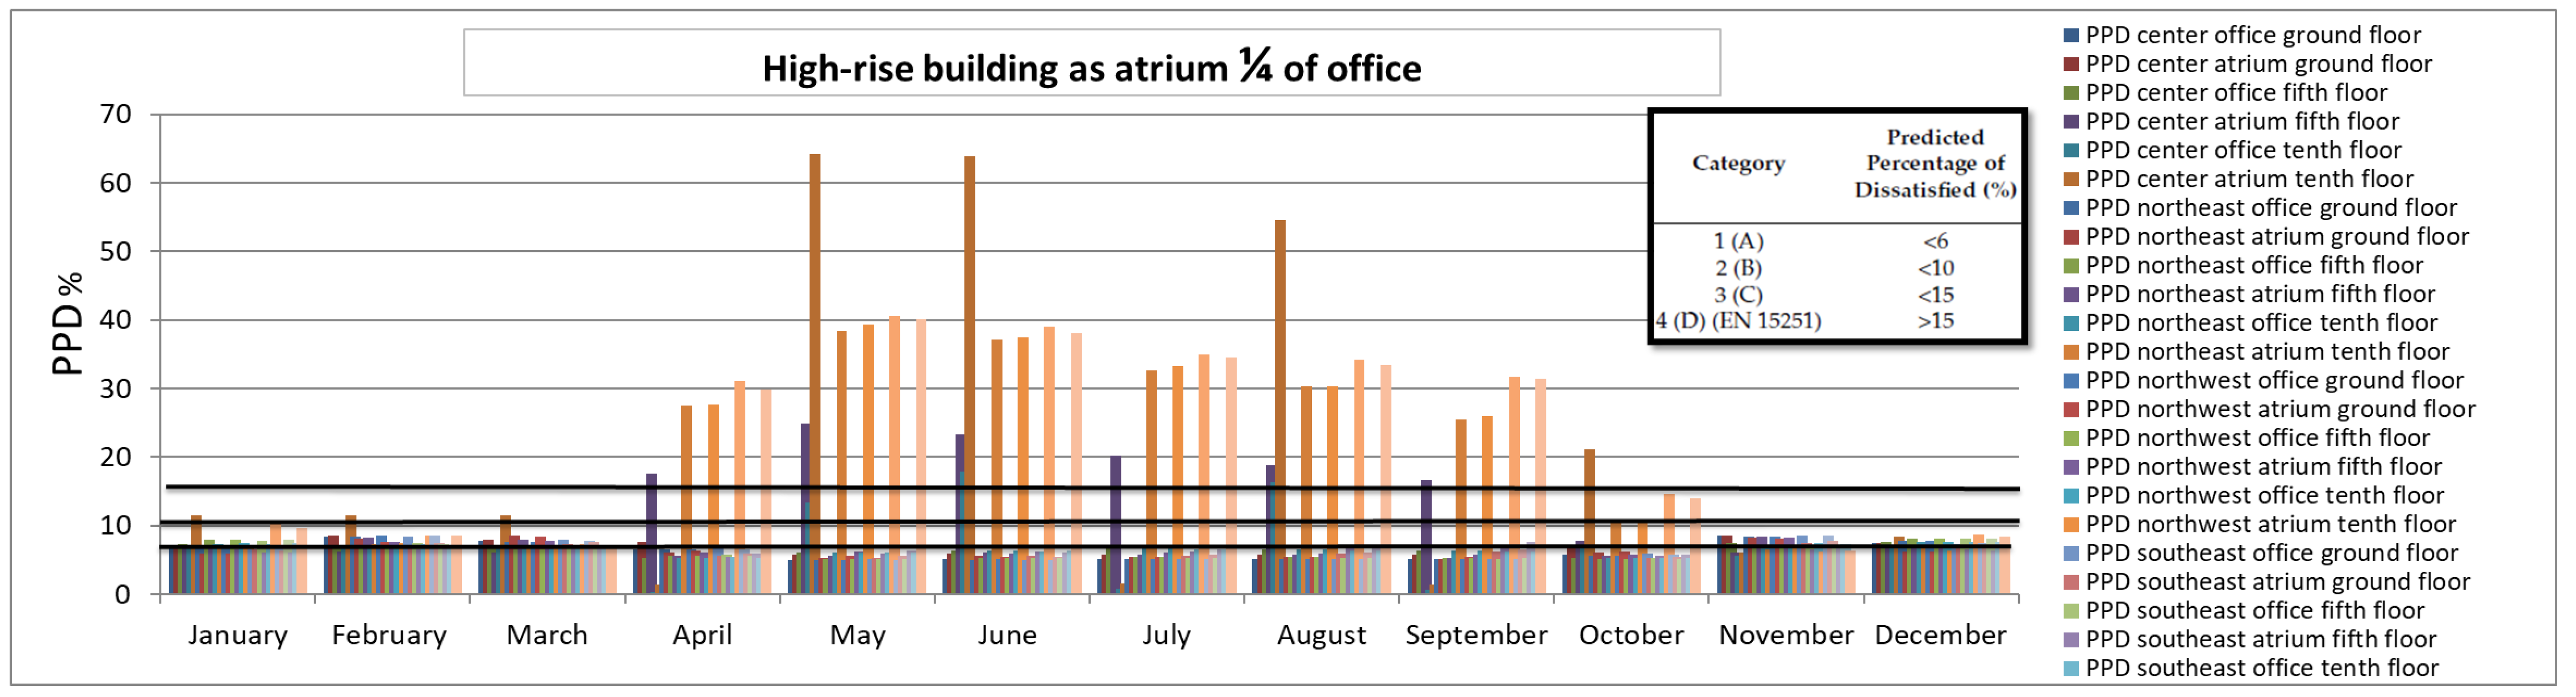
  • The thermal performance and comfort parameters were analyzed based on the American Society of Heating, Refrigerating and Air-Conditioning Engineers (ASHRAE) [2], the International Organization for Standardization (ISO 7730) [25], the European Committee for Standardization (EN 15251) [26] standards as stated in the thermal environmental recommendation’s factor of ISO 7730 [25], and EN 15251 [26], reported as follows: Category 1(A), 2(B), 3(C), and 4(D) (EN 15251), of Predicted Percentage of Dissatisfied (%): <6, <10, <15, and >15; Category 1(A), 2(B), 3(C), and 4(D) (EN 15251) of Predicted Mean Vote Range: −0.20 to 0.20, −0.50 to 0.50, −0.70 to 0.70, and <−0.70 or >0.70; Category 1(A), 2(B), and 3(C) of Percentage of Dissatisfied (PD) Due to Draught (%): <10, <20, and <30; Category 1(A), 2(B), and 3(C) of PD Due to Vertical Air Temperature, the difference (%): <3, <5, and <10; Category 1(A), 2(B), and 3(C) of PD Due to Cool or Warm Floor (%): <10, <10, and <15; and Category 1(A), 2(B), and 3(C) of PD Due to Radiant Temperature Asymmetry (%): <5, <5, and <10.
  • The mechanically conditioned system used in this research was basic air conditioning with no relative humidity (RH) control. This system has an upper limit gain value: 24.0 °C, setback value: 100.0°C, schedule: cooling load. Additionally, it has a lower limit gain value: 21.0 °C, setback value: 10.0 °C, schedule: heating load [23].

4. Results and Discussions

4.1. Naturally Conditioned Building Performance

4.1.1. Natural Ventilation Condition for a Single-Floor Atrium Building Analysis

As can be seen in Table 3 and Table 4, the dynamic thermal simulation models of a single-floor atrium when the proportion of the atrium is half of the total office space in a naturally conditioned building (natural ventilation) is partly due to the tower over the atrium space, which had side windows that were always open in this group. The center atrium placement in the office space at 0% office opening and 100% tower side opening had a 90% acceptable thermal comfort during the cold seasons and an 80% acceptable thermal comfort from May to June (21.3 °C to 26 °C). However, the internal thermal comfort condition decreased slightly from the end of May to the end of September (25 °C to 30 °C). Consequently, when all of the office windows were closed and the passive strategy was applied via the tower, there was no thermal comfort condition in the office zone. The thermal comfort in the atrium space had a better condition than the previous zone with the same parameters: when the external temperature was from 10.9 °C (January) to 26 °C (June), it had a completely suitable (90% acceptability limit) internal thermal comfort condition in the atrium space. Throughout June (25 °C to 27 °C), there was an approximately 80% acceptability for the internal thermal comfort. However, during the warm seasons, there was no thermal comfort above 30 °C. For this group, with the same atrium proportion and placement, when the office window opening ratio was increased to 50% and the prevailing mean outdoor air temperature was increased from 10.9 °C (January) to 26 °C (June), there was a 90% acceptability and 80% acceptable comfort condition in July and August. Additionally, the atrium zone of this group had the same approximate thermal comfort condition as the office zone. At the final office window opening ratio of 100% in this group with the same atrium proportion (atrium volume 1/2 of the office volume) and placement, the office space had an approximately 90% acceptability during January, February, and March, i.e. for the cold season, and May to September. This reduced to an 80% acceptable thermal comfort in November and December. Furthermore, a remarkable occurrence happened in the atrium zone, which had suitable internal thermal comfort conditions throughout the year in both warm and cold seasons. The northeast atrium placement with the same atrium proportion as above (atrium volume 1/2 of the office volume) had a suitable thermal comfort condition in the office and atrium zone when all office windows were closed from January to April and from the end of May until June. The atrium zone of this group also achieved some thermal comfort between 24 °C and 30 °C. The same factors and a 50% office window opening ratio (for the atrium windows, which were connected to the external facade) in the office zone from March to April had a 90% acceptable thermal comfort when the external temperature averaged between 22.5 °C and 28.5 °C. Similarly, the atrium zone in January, April, June, July, and August also had thermal comfort.
When all of the windows connected to the external facade were completely opened in the office zone during March, April, June, July, and August, it had a thermal comfort within the 80% and 90% acceptability limits. Moreover, the atrium zone from January to April and June also had a suitable internal thermal comfort condition. In this group’s northwest atrium placement when all office and external windows were closed, the office zone had an 80–90% comfort acceptability in January, February, March, and April. The atrium zone from January to May had a suitable thermal comfort condition. When external openings were changed to 50%, the office zone had a thermally comfortable internal condition from January to April, as well as in the atrium zone from February to July. When all windows to the external facade openings had been completely opened (100%), the office zone had a suitable thermal comfort condition in March and April, and from June to August. Under the same condition (passive strategy), the atrium zone’s thermal comfort from February to April and July had a 90% acceptability, and a further 80% acceptability in May and June.
In this atrium proportion group (atrium volume 1/2 of the office volume) with a southeast placement, the office zone had 80–90% acceptability limits from January to April (10.9 °C to 13.9 °C, 14 °C, and about 18 °C), which depicted a suitable thermal comfort. In addition, the atrium zone from January to May was also thermally comfortable. When all external window openings had been opened at 50%, the office zone had internal comfort from January to August, while the atrium zone had internal comfort from January to June. Consequently, at 100% of all external window openings in the building facade, the office space had a 90% acceptability from January to July, and an 80% thermal comfort condition throughout April. Similarly, the atrium space had 90% and 80% internal thermal comfort acceptability from January to June, and July and August, respectively. When the atrium was placed in the southwest with all the same factors mentioned above, both the office and the atrium space had thermal comfort from January to April at a 0% office and external atrium window opening ratio (closed). Additionally, the atrium zone had an 80% acceptable thermal comfort in May. However, a 50% window opening ratio in the office and atrium spaces from January to June provided thermal comfort, especially in July in the atrium zone. When all external openings were increased to 100%, the office and atrium zone had the same performance from January to August, where they both had suitable internal thermal comfort.
According to the dynamic thermal simulation models for a single-floor building, when the internal condition was based on a naturally conditioned system (natural ventilation), the total building volume temperature was higher than the external temperature. For instance, for the northeast atrium placement with the atrium volume 1/3 of the office volume when all windows on the outdoor facade were completely closed, except the atrium windows and the tower side opening, there was an overheating problem, especially in July and August when the temperature reached over 36 °C in the office space. This problem was also present for the northwest atrium placement with the same atrium proportion and window opening ratio where the temperature reached as high as 68 °C in the tower space. Additionally, this high temperature was also found when all office windows were 50% opened to the external environment. For the southeast atrium placement of this volume group, at 50% and 100% office window opening ratios, the tower space was 69 °C when the average external temperature was 29 °C in July, while the office and atrium spaces had 45 °C and 63 °C internal temperatures, respectively. At 1/3 of the office volume, the atrium (single-floor) with a southwest placement had a better condition in the hottest months (July and August) when all windows had been opened completely; the office space was at about 29 °C. In this atrium volume group (atrium volume 1/3 of the office volume), the center atrium placement had a better thermal comfort than other simulation models using a naturally conditioned internal system. On the other hand, when this group’s internal condition was changed to a mechanically conditioned internal system and all of the external connection window openings were closed, the center and northeast atrium placements had better thermal comfort performance throughout the year, especially in the summertime.
For the dynamic thermal simulation group with a single-floor building design and atrium volume 1/3 of the office volume with natural ventilation (passive condition), when all of the office window openings were closed in the center atrium type, ventilation occurred through the tower over the atrium side opening at 100%, which resulted in a 90% acceptable thermal comfort from January to April in the office zone and from January to May in the atrium zone. Subsequently, when the office window opening ratio was increased to 50%, the office and atrium zone had a suitable thermal comfort during January, February, and March, and less but still suitable thermal comfort from September to December. However, when the office window openings were increased to the same ratio as the tower side opening (100% window opening), the periods of thermal comfort were still close to the previous ratio simulation (50% window opening). At a 100% opening ratio, the thermal comfort in the office was suitable from January to March and September to October, and from January to June in the atrium zone. In this group of dynamic thermal simulations for the northeast atrium placement, the internal thermal comfort was more suitable for users when all external windows had been closed throughout January and February, and also during the cold season, although the atrium zone of this building had the same condition in the same time period.
At a 50% external window opening ratio, the office and atrium zones had suitable thermal comfort conditions during spring time and somewhat in the cold months. Furthermore, when all external windows were completely opened, thermal comfort was at 80–90% acceptability from January to March in both the office and atrium zones. However, there was also thermal comfort from August to October in the office zone, although it can be mentioned that thermal comfort was somehow achieved in the atrium space between 21.2 °C to 28.4 °C. One significant finding of this research is that when the atrium was placed in the northwest and southeast, and all external windows were 50% open, there was no thermal comfort condition in the office and atrium zones. The northwest atrium placement also did not provide any internal comfort when all external window openings were closed. However, when all windows were completely open, the office zone had thermal comfort during spring, and the atrium zone had thermal comfort during January and February. The southeast atrium placement with all external windows completely closed, except the tower side opening, had a suitable thermal comfort condition from January to March in both the office and atrium zones. However, when all the building’s windows were completely opened, there was no thermal comfort condition with this proportion (atrium volume 1/3 of the office volume). There was also no thermal comfort condition for the southwest placement with a 50% opening of the external office windows and atrium external facade. However, the thermal comfort condition was suitable when all of them were closed during March to April and November to December in the office zone and in January in the atrium zone. Furthermore, when all the building’s windows had been opened completely from January to March and November to December, there was also a suitable thermal comfort condition in both the office and atrium zones.
In this single-floor building simulation group, the atrium volume was set as 1/4 of the office volume with a natural ventilation condition. For the center atrium placement in this group when all facade external windows were closed, except the tower side opening, there was thermal comfort from January to March in the office zone, and November to March in the atrium zone. When the ratio of the external window’s facade opening was changed to 50%, there was no thermal comfort in either the office or the atrium zone. At 100% opening for all the building’s windows, there was thermal comfort from October to March in both the office and atrium zones. For the northeast atrium placement, the 0%, 50%, and 100% window opening ratios had relatively suitable thermal comfort conditions from October to April in both zones. However, the northwest atrium placement at 50% for all external office zone and atrium facade side openings did not provide any thermal comfort throughout the year. Accordingly, when all the aforementioned openings were closed completely, except the tower side, there was thermal comfort in the office zone from November to March, and in the atrium zone in January and February. At 100% opening for all windows in this group, thermal comfort was similarly suitable in the office zone from October to March, and January and February in the atrium zone. The southeast atrium placement with the same factors of this simulation group had thermal comfort from December to about April in the office zone, and also had about 90% acceptability in thermal comfort throughout January and February in the atrium zone. In this simulation group and placement, when all office and atrium facade side opening ratios were set at 50% and 100%, there was no thermal comfort for occupants in any zone. The southwest atrium placement with the same parameters also did not yield any positive internal condition at 0% and 50% office and atrium facade side window opening ratios. However, thermal comfort was suitable for users when all building side windows were opened completely in the office zone from March to May, and throughout March in the atrium zone.

4.1.2. Natural Ventilation Condition for a Medium-Rise Atrium Building Analysis

The dynamic thermal simulation model for a medium-rise atrium building, when the internal condition was based on natural ventilation (naturally conditioned system) via the tower side opening and the building’s windows is all depicted in Table 5, Table 6, Table 7 and Table 8, The atrium volume was 1/2 of the office volume, while the atrium was located in the center of the building. The internal thermal comfort had relatively similar conditions when external temperatures were from 25 °C to 30 °C with the office and all external facade window openings at 0%, 50%, and 100% window opening ratios. Furthermore, the northeast and northwest atrium placements with the same window opening ratios when the external temperature was 22 °C to 28 °C also provided a suitable thermal comfort condition, although the southeast atrium placement had the better function in terms of total building thermal comfort in this proportion group. It is noteworthy that the upper floors provided better internal comfort for the users when the external temperature ranged from 23 °C to 29 °C. An atrium volume 1/3 of the office volume in the medium-rise building had a relatively similar performance to the previous dynamic thermal simulation models with the atrium volume set at 1/2 of the office volume. All of the atrium placements had the same approximate performance at 50% and 100% window opening ratios from 22 °C to 29 °C, providing a suitable thermal comfort condition, especially in the upper floors and in the atrium zones when compared to the office zones. When the atrium volume was decreased to 1/4 of the office volume, the naturally conditioned system utilized in this dynamic thermal simulation group performed somewhat similar to the 1/3 atrium proportion group. A remarkable point in this regard is that during the cold season when external temperatures ranged from 10.9 °C to 17 °C, there was no thermal comfort in the whole medium-rise building. Accordingly, this performance occurred because the window side openings of the tower over the atrium were always open, causing dramatic air movement from outdoor to indoor zones, which had a positive function during warm seasons.

4.1.3. Natural Ventilation Condition for a High-Rise Atrium Building Analysis

As all depicted in Table 9 to Table 10, the high-rise building with an atrium volume 1/2 of the office volume when the atrium was located in the center part of the building and all external facade window openings were completely closed, except the atrium tower side window openings, which were opened completely, illustrated that the internal natural ventilation condition did not provide thermal comfort in any building zones. Similarly, opening all external facade windows at 50% also did not provide any thermal comfort condition for the users throughout the year. However, when all of the building’s windows were opened completely at 100% in the ground floor office and atrium zones, thermal comfort was 90% acceptable for occupants from January to April, and 80% from May to June. Furthermore, during the end of the summer and autumn months, the thermal comfort condition increased in these dynamic thermal simulation parameters. At the same atrium volume (atrium volume 1/2 of the office volume) with a northeastern atrium placement within the building, there was consistently no thermal comfort when all external facade windows were closed. However, when the window opening ratio changed to 50%, all building zones had thermal comfort from January to October. Similarly, at 100% opening for all windows, this group had 80% thermal comfort satisfaction from February to July, which increased to 90% in January, August, and October. Thermal comfort conditions were also acceptable in the fifth and above floors in November and December for this placement group.
When the atrium placement was changed to a northwestern or southeastern location in the office building and all external facade windows openings were set at 0% and 50% opening ratios, there was no thermal comfort for the users. However, at 100% for all window openings, there was thermal comfort from May to August. The southwest atrium placement with the same atrium volume at a 50% window opening ratio for all external facade window openings had thermal comfort throughout the year except in November and December; however, when all office zone windows were closed there was no comfort for the occupants. Additionally, the southwestern atrium placement at 1/2 atrium volume had better thermal comfort during the year than other dynamic thermal simulation groups. For the high-rise building with the atrium volume 1/3 of the office volume for all dynamic thermal simulation models and a natural ventilation internal condition, when the atrium was located in the center of the building, the internal thermal condition was suitable from June to December in the office zones on the ground floor, May to December in the atrium zone of the ground floor, June to September in the middle floors, and May to September in the upper floors when all office external facade windows were closed. The thermal condition was also acceptable when all office external windows were opened at 50% from June to December on the lower floors and from June to November on the upper floors. At 100% window opening from July to December, the thermal condition was also acceptable in all building floors. Similarly, when the atrium placement changed to a northeastern placement at 0%, 50%, and 100% for all external office window openings from June to December, user’s internal comfort was also acceptable, especially on the upper floors.
Also, the northwestern atrium placement with the same volume (atrium volume 1/2 of the office volume) had a similar indoor thermal condition with the northeastern atrium placement. Furthermore, when all external office facade openings were completely closed, except the side windows of the tower over the atrium, which was opened completely, it was found that the upper floors, especially the last floor, had an acceptable condition-based passive performance throughout the summer time. However, when the window facade was opened at 50% and 100%, there was limited thermal comfort from May to December in all office zones. When the atrium volume was 1/2 of the office volume with a southeastern placement, 50% and 100% opening ratios for all external facade window openings provided thermal comfort during the summer and autumn seasons (from July to December). Also, the southwestern atrium placement of this dynamic thermal simulation group at a 0% external facade window opening ratio from June to December in the lower floors had about an 80% acceptability for users’ comfort from July to September, about 90% on the middle floors, and about 80% on the upper floors from June to September. Additionally, when the external facade windows were opened 50% and 100% at the same volume proportion from June to December, the internal thermal condition was acceptable based on passive performance.
The high-rise building with an atrium volume 1/4 of the office volume based on a naturally ventilated internal condition when the atrium was located in the center with a 0% external facade window opening ratio had a suitable thermal comfort from June to December on the lower floors, and in middle and upper floors from June to September. Also, 50% and 100% for all external facade window openings had similar comfort conditions from July to December. The northeastern atrium placement with 0% for all external facade window openings from March to September in lower office zones, and from April to August in lower atrium zones, January to May in upper office zones, February to May in upper atrium zones, the upper floors from January to June in office zones, and January to March in atrium zones had suitable thermal comfort conditions based a passive performance. This group with 50% and 100% for all window openings from August to December in lower office zones had about a 90% user satisfaction, and 80% user satisfaction from July to December in lower atrium zones. Furthermore, from July to November, this dynamic thermal simulation group had a suitable thermal comfort condition in the upper floors of the office and atrium zones. When the atrium placement was changed to the northwest in this volume simulation group, all the atrium zones in the whole high-rise building had better thermal conditions than the office zones when all external facade windows were completely closed. Conversely, the office zones had thermal comfort in the lower floors from July to December, in the middle floors from May to August, and in the upper floors from June to September.
When the external window facade in this group was opened at 50% from July to December, all building zones had about the same thermal comfort condition. In addition, when all external facade windows were opened completely from July to December, internal users’ satisfaction was provided through natural ventilation. For the southeastern and southwestern atrium placements with the atrium volume 1/4 of the office volume, when all external facade windows were closed with natural ventilation (naturally conditioned system) occurring via the tower side window opening over the atrium, there was thermal comfort from June to December in the lower floors and from June to September from the middle floors upwards (for the southeastern atrium placement), and from June to October in lower floors and from June to November in upper floors over the same period. For the southeastern atrium placement and 1/4 atrium volume with 50% and 100% for all external window openings, the high-rise building had a thermal comfort condition from July to December for practically the entire building volume. The internal thermal condition was suitable for the southwestern atrium placement from June to December in the lower floors, and from June to September in the middle and upper floors. In this dynamic thermal simulation group using the same parameters, when all the building’s external facade windows were opened completely, users’ comfort was suitable from June to December in the lower floors and from June to September in the upper floors.

4.2. Mechanically Conditioned Building Performance

4.2.1. Mechanically Conditioned Single-Floor Atrium Building Analysis

As shown in Figure 2, in the group of single-floor atrium building dynamic thermal simulation models where the internal condition was changed to a mechanical system with extended hours, thermal comfort was analyzed based on PMV (predicted mean vote) categories. In this simulation group, when the atrium volume was 1/2 of the office volume, during the cold months from November to March, all of the different atrium placements in the building—center, northeast, northwest, southeast, and southwest—had suitable internal comfort conditions for occupants, especially based on Category C (−0.70 to 0.70), which also covers other categories. The northeastern and northwestern atrium placements had thermal comfort conditions based on Category A just in the office zone throughout the year but the atrium zone had an acceptable condition during cold seasons. While the southeastern and southwestern atrium placements had a thermal comfort condition based on Category B in the office zone during the cold season, similar to the previous simulation model group, they had a negative performance during summertime in the atrium zone. As illustrated in Figure 3, the single-floor office building with an atrium volume 1/2 of the office volume had a reported PPD (predicted percentage dissatisfied) performance that was usually more than the category standards. The southwestern atrium placement in the office and atrium zone had the highest percentages of occupants’ dissatisfaction throughout the year. While the southeastern atrium placement also had a similar situation to the previous placement, the central atrium placement had a better PPD percentage than the other atrium placements with the same condition and design parameters.
As can be seen in Figure 4, in this dynamic thermal simulation model group with an atrium volume 1/3 of the office volume in a single-floor building, the southeastern atrium placement had an acceptable thermal comfort in terms of PMV in all office building zones during the year based on Category B. However, the atrium zone had a negative performance, especially from April to October. In contrast, the southwestern atrium placement in office zones usually had a thermal comfort (PMV) according to Category A, except in November and May, which were based on Category B. Furthermore, the atrium zones from April to the end of September did not have thermal comfort, while their thermal comfort from January to May, November, and December was based on Category B. As illustrated in Figure 5, in this dynamic thermal simulation group with northwestern office zones, internal comfort was usually based on Category A, although in May and December, comfort was achieved was according to Category B. In the atrium zones, October to May were based on Categories A and B, indicating complete comfort, although from April to September, there was no comfort at all. The northeastern atrium placement had a thermal comfort condition based on Category B from December to May and Category A during the other months. The atrium zone in this group had internal comfort based on Category B from October to May, but was in complete discomfort from April to September. When the atrium was located in the center of the building, it had a suitable thermal comfort in the office zone during the year and thermal comfort based on Category C from October to May. In addition to the PPD thermal comfort parameter, the center atrium placement had better comfort than the other (northeast, northwest, southeast, and southwest) atrium placements.
As shown in Figure 6 and Figure 7, when the atrium volume changed to 1/4 of the office volume in a single-floor with a central atrium placement, the office zone had thermal comfort during the year based on Category C, while the atrium zone had the worst internal condition from April to September with the other months’ thermal comfort based on Category C. The northeastern atrium placement in the office zone had thermal comfort from January to December according to Category A. Furthermore, the atrium zone in this group had thermal comfort (PMV) from November to March based on Category A, and Category C in April. The northwestern atrium placement office zone had acceptable internal comfort from January to December based on Category B, with the other months having comfort based on Category A. However, in the atrium zone, April to September had a negative internal comfort, while October to March had thermal comfort based on Category B. The southeastern and southwestern atrium placement office zones had an internal comfort condition throughout the year based on Category B, the same as in the atrium zones from October to March. Furthermore, the PPD of the atrium volume of 1/4 of the office volume with a central atrium placement had better user satisfaction (comfort) in the office zone based on Category C in terms of PPD. Additionally, the southeastern, southwestern, northwestern, and northeastern atrium placement office zones had thermal comfort based on Category C.

4.2.2. Mechanically Conditioned Medium-Rise Atrium Building Analysis

Figure 8 and Figure 9 outline the PMV and PPD for the dynamic thermal simulation when the number of floors increased to a medium-rise building. When the atrium volume in this group was set at 1/2 of the office volume, the office and atrium zones in the lower floors of the central atrium placement had thermal comfort based on Category B, while the office zone in the last floor had comfort condition according to Category C in September to May. Also, the northeastern atrium placement in the whole of the building’s lower floors had thermal comfort based on Category B in November and March. However, the upper floors had thermal comfort according to Categories B and C throughout the year. The northwestern atrium placement in lower floors had a thermal comfort based on Category B throughout the year, and in the last floor of the office zone from September to May based on Category C. The southeastern atrium placement in both zones (office and atrium) was based on Category B during the year, indicating complete thermal comfort. Additionally, the last office zone of the last floor from September to May had thermal comfort according to Category C. The southwestern atrium placement had an annual thermal comfort in all zones on the lower floors based on Category B and the last floor of the last office zone from September to May according to Category C. Also the southwestern atrium placement‘s PPD had the worst internal situation of comfort in the upper floors, while the central atrium placement had an acceptable PPD based on Category C throughout the year.
As illustrated in Figure 10, when the atrium volume was 1/3 of the office volume, it had a completely suitable internal thermal comfort in the office and atrium zones of the ground floor based on Category B throughout the year. Also, the thermal comfort of the upper floors of the last office zone from September to May was achieved according to Category C. The northeastern atrium placement in the whole of the ground floors was based on Categories B and C throughout the year, and based on Category C for the last office floor from September to May, which were all thermally comfortable. The northwestern, southeastern, and southwestern atrium placements in all of the ground zones and the last office zone had a thermal comfort condition based on Category B. As shown in Figure 11, the PPD of the aforementioned group with a southwestern atrium placement had the most negative condition in comparison with other simulation models using a central atrium placement.
As shown in Figure 12, the PMV with the 1/4 atrium proportion (atrium volume 1/4 of the office volume) generally showed the best internal thermal comfort for users. However, the northeastern, southwestern, and northwestern atrium placements for the last atrium floor had a negative internal condition from May to August. As illustrated in Figure 13, the PPD of this dynamic thermal simulation group had the most negative condition for the southwestern atrium placement, especially in the last upper atrium floor. In fact, the atrium in the last fifth floor had a more negative performance than the southeastern and other atrium placements, although the central atrium placement had better user satisfaction in this dynamic thermal simulation model group.

4.2.3. Mechanically Conditioned High-Rise Atrium Building Analysis

As shown in Figure 14 and Figure 15, PMV and PPD were used for assessing the mechanical internal system for generating thermal comfort in high-rise building atrium dynamic thermal simulation models. With an atrium volume 1/2 of the office volume and located in the center of the building, the PMV in all zones (office and atrium zone) of the lower and medium floors was achieved according to Category B, except the atrium zone on the ground floor in January. However, in the upper floors, especially the tenth floor from January to March, the atrium zone’s PMV was achieved based on Category B, while from January to May and September to December, the office zone’s comfort was based on Category C. Furthermore, the atrium zone in the last floor had the most negative performance of all atrium placements from April to October. It is noteworthy that the PPD results were similar to the PMV results. For the northeastern atrium placement simulation group, the PMV of the ground floor in the office zone throughout the whole year had a thermal comfort condition based on Category B (January according Category B, and from February to December based on Category A in office zones). Similarly, in the medium and upper floors, the office zones also had a suitable thermal comfort condition but this changed in the atrium zones. Noticeably, the atrium zone with a different placement on the last floor of the high-rise building had a negative performance, especially from April to September. The predicted percentage of dissatisfaction for the central atrium in the high-rise building was the highest for the upper floors and last floor, although from January to May, and September to December, their thermal comfort was achieved based on Category C. The PPD of the dynamic thermal simulation high-rise building models with a northeastern atrium placement was acceptable in all of the building’s office zones according to Category B. In this simulation group (atrium volume 1/2 of the office volume), when the atrium was located in the northwest, the predicted mean vote showed there was thermal comfort on the lower floors based on Category A and upper floors based on Categories B and C, except the last office zone on the last floor from June to August, which did not have a suitable thermal comfort; similarly, the PPD for the lower floor was also achieved based on Categories B and C. Additionally, the PPD of the last office zone on the last floor was achieved according to Category C from January to May and from September to December. The southeastern atrium placement for the same group (1/2 volume proportion) also had a PMV comfort according to Categories B and C in all lower zones and medium floor zones. Furthermore, in the last office zone from January to June and from October to December, the recorded PMV comfort was achieved based on Category C. Also, the southwestern atrium placement in this simulation group had a similar result, with its PMV under Categories A, B, and C. While the last office zone’s PMV from January to March was achieved according to Category A and from September to December based on Category C, the PPD in this dynamic thermal simulation group with southeastern and southwestern atrium placements was according to Categories B and C in the lower and medium floors; the last office zone also behaved like the other simulation placements.
As can be seen in Figure 16 and Figure 17, the atrium volume was decreased to 1/3 of the office volume in the high-rise atrium building simulations, while the atrium was located in central, northeastern, northwestern, southeastern, and southwestern placements on all floors up to the medium floors, which had a thermal comfort PMV based on Category B, and the last office zone had a suitable thermal comfort condition from January to March and from November (sometimes October) to December. The PPD of the northeastern and northwestern 1/3 volume placements also had similar results throughout the year. On the other hand, the northwestern atrium placement with a 1/3 volume proportion in the high-rise building had the highest level of user dissatisfaction during cold months.
As illustrated in Figure 18 and Figure 19, when the atrium volume was 1/4 of the office volume in the dynamic thermal simulation models, PMV and PPD showed fluctuations in user satisfaction. For instance, office zones from February to December in the central and northeastern atrium placements had thermal comfort conditions relying on their mechanically conditioned system. The PPD of the ground atrium zone in the center atrium high-rise building (1/4 volume proportion) from May to August had the highest figure of all simulation models. However, the northwestern, southwestern, and southeastern atrium placements with the same parameters had an acceptable PPD based on Category A from the ground floors to medium floors, and close to Category B in the cold months. Also, the last office floor had a thermal comfort condition based on Category A in terms of PPD. The northeastern atrium placement of this group (1/4 volume proportion) in all building zones had a thermal comfort based on active performance according to Categories A and B. Furthermore, it is noteworthy that the medium-rise and high-rise atrium building (as an office function) dynamic simulations with the atrium volume 1/4 of the office volume and based on natural ventilation had a more acceptable indoor user comfort than other proportion model scenarios.

5. Conclusions

This research concluded that considering different design alternatives in the early stage of building design can increase indoor thermal comfort with minimal environmental harm. By analyzing and comparing different dynamic simulation models (as different scenarios) based on a hot and humid climate, the interpretation of this research’s findings can be summarized in the following points.
The single-floor atrium building (as an office function) dynamic simulation illustrated that when internal ventilation is based on a naturally conditioned system, there were overheating issues in the internal tower zones even though the tower’s side windows had been opened. The single-floor atrium building (as office function) dynamic simulation with an atrium volume 1/3 of the office volume still had an overheating problem, especially during summer. It is noteworthy that the ratio of the tower side windows over the atrium zone had a direct effect on indoor zones despite whether the building’s facade windows were opened or closed. Passive performance (naturally ventilated condition) in the single-floor atrium building with the atrium volume as 1/2 of the office volume had a better function than other models in this group.
The single-floor dynamic thermal simulation models utilizing passive performance with an atrium volume 1/3 of the office volume when the atrium was located in the center and also with an atrium volume 1/2 of the office volume with central, northeastern, northwestern, and southeastern atrium placements when all the façade’s external windows were completely closed had thermal comfort in cold months. However, when the atrium volume was 1/2 of the office volume with the central, northeastern, northwestern, and southeastern atrium placements and all façade external windows were set at 50% and 100% window opening ratios, it had thermal comfort throughout spring time.
The dynamic thermal simulation medium-rise building with an atrium volume 1/2 of the office volume did not have any thermal comfort throughout the cold months despite different atrium placements and window opening ratios. However, in this simulation group, users’ comfort was more achievable during warm months. When the atrium volume decreased to 1/3 of the office volume with the same naturally conditioned system, the central and southeastern atrium placements at 50% and 100% window opening ratios had a better thermal comfort, especially throughout the warm months. However, in the same simulation group and with the same internal condition, when the atrium volume changed to 1/4 of the office volume, occupants’ comfort was provided throughout the summer time when the window opening ratio was increased accordingly. When the atrium volume decreased to 1/3 of the office volume with the same naturally conditioned system, the central and southeastern atrium placements at 50% and 100% window opening ratios had a better thermal comfort, especially throughout the warm months. However, in the same simulation group and with the same internal condition, when the atrium volume changed to 1/4 of the office volume, occupants’ comfort was provided throughout summer time when the window opening ratio was increased accordingly.
In the dynamic thermal simulation high-rise atrium building, the upper floors generally had a better thermal performance when all window opening ratios were set at 100%, especially in the southwestern atrium placement. In contrast, the 0% and 50% window opening ratios with a central atrium placement had a negative performance in all the building’s zones. In this simulation group, when the atrium volume was half of the office volume, closing all external facade windows had a negative impact on different atrium placements during different seasons. In the high-rise building with a naturally ventilated condition and an atrium volume 1/3 of the office volume, different atrium placements had a suitable thermal comfort during cold months. When the atrium volume decreased to 1/4 of the office volume, there was a remarkable fluctuation in the analysis data. Additionally, the northeastern, northwestern, and southeastern atrium placements at 50% and 100% window opening ratios in the middle floors of this high-rise group had maximum internal user comfort based on a passive strategy. Also, the northeastern atrium placement when all windows were completely opened on the middle floors had thermal comfort throughout the cold months.
According to the predicted mean vote and predicted percentage dissatisfied in single-floor, and medium- and high-rise atrium building simulations, when the atrium volume was 1/3 and 1/4 of the office volume with a mechanical internal condition, it had a better performance throughout the year when the atrium placement was in the central, northwestern, and southwestern placements. In the high-rise building simulation with an atrium volume 1/3 of the office volume, when the internal environment was mechanically conditioned, the occupants had a lower predicted percentage of dissatisfaction than other dynamic thermal simulation models of high-rise buildings in this group when the atrium was placed in the center of the building. Importantly, while the atrium zone of the last floor in the high-rise building (tenth floor) had a discomfort condition, the 1/4 atrium volume of the office volume had a better internal condition based on active performance than other high-rise atrium building dynamic thermal simulation models.

Author Contributions

H.Z.A. and R.A. conceived and designed the study; R.A. performed the experiments and simulations, and wrote the paper; H.Z.A. supervised the study, and provided sources, comments, and major edits for the paper.

Funding

This research received no external funding.

Conflicts of Interest

The authors declare no conflict of interest.

References

  1. Sunanda, W.; Budiarto, R. Performance of glazing materials for atrium in hot & humid climate. MATEC Web Conf. 2018, 186, 02007. [Google Scholar]
  2. The American Society of Heating, Refrigeration and Air-Conditioning Engineers (ASHREA). ANSI/ASHRAE Standard 55-2017. In ASHRAE Standard-Thermal Environmental Conditions for Human Occupancy, American Society of Heating, Refrigeration and Air-Conditioning Engineers; ASHREA: Atlanta, GA, USA, 2017. [Google Scholar]
  3. Modirrousta, S.; Boostani, H. Analysis of atrium pattern, trombe wall and solar greenhouse on energy efficiency. Procedia Eng. 2016, 145, 1549–1556. [Google Scholar] [CrossRef]
  4. Xue, P.; Li, Q.; Xie, J.; Zhao, M.; Liu, J. Optimization of window-to-wall ratio with sunshades in China low latitude region considering daylighting and energy saving requirements. Appl. Energy 2019, 233, 62–70. [Google Scholar] [CrossRef]
  5. Etheridge, D. A perspective on fifty years of natural ventilation research. Build. Environ. 2015, 91, 51–60. [Google Scholar] [CrossRef]
  6. Bedon, C.; Honfi, D.; Machalicka, K.V.; Eliasova, M.; Vokac, M.; Kozłowski, M.; Portal, N.W. Structural characterisation of adaptive facades in Europe-Part II: Validity of conventional experimental testing methods and key issues. J. Build. Eng. 2019, 25, 100797. [Google Scholar] [CrossRef]
  7. Bedon, C.; Honfi, D.; Machalicka, K.V.; Eliasova, M.; Vokac, M.; Kozlowski, M.; Portal, N.W. Structural characterisation of adaptive facades in Europe–Part I: Insight on classification rules, performance metrics and design methods. J. Build. Eng. 2019, 25, 100721. [Google Scholar] [CrossRef]
  8. Rijal, H.B.; Tuohy, P.; Humphreys, M.A.; Nicol, J.F.; Samuel, A.; Clarke, J. Using results from field surveys to predict the effect of open windows on thermal comfort and energy use in buildings. Energy Build. 2007, 39, 823–836. [Google Scholar] [CrossRef] [Green Version]
  9. Tabesh, T.; Sertyesilisik, B. An Investigation into energy performance with the integrated usage of a courtyard and atrium. Buildings 2016, 6, 21. [Google Scholar] [CrossRef]
  10. Albatayneh, A.; Alterman, D.; Page, A.; Moghtaderi, B. The impact of the thermal comfort models on the prediction of building energy consumption. Sustainability 2018, 10, 3609. [Google Scholar] [CrossRef]
  11. Moosavi, L.; Mahyuddin, N.; Ab Ghafar, N.; Ismail, M.A. Thermal performance of atria: An overview of natural ventilation effective designs. Renew. Sustain. Energy Rev. 2014, 34, 654–670. [Google Scholar] [CrossRef]
  12. Sher, F.; Kawai, A.; Gulec, F.; Sadiq, H. Sustainable energy saving alternatives in small buildings. Sustain. Energy Technol. Assess. 2019, 32, 92–99. [Google Scholar] [CrossRef]
  13. Abdullah, A.H.; Meng, Q.; Zhao, L.; Wang, F. Field study on indoor thermal environment in an atrium in tropical climates. Build. Eviron. 2009, 44, 431–436. [Google Scholar] [CrossRef]
  14. Hussain, S.; Oosthuizen, P.H. Numerical investigations of buoyancy-driven natural ventilation in a simple three-storey atrium building and thermal comfort evaluation. Appl. Therm. Eng. 2013, 57, 133–146. [Google Scholar] [CrossRef]
  15. Moosavi, L.; Mahyuddin, N.; Ghafar, N. Atrium cooling performance in a low energy office building in the tropics, a field study. Build. Environ. 2015, 94, 384–394. [Google Scholar] [CrossRef]
  16. Assadi, M.K.; Dalir, F.; Hamidi, A.A. Analytical model of atrium for heating and ventilating an institutional building naturally. Energ. Build. 2011, 43, 2595–2601. [Google Scholar] [CrossRef]
  17. Hussain, S.; Oosthuizen, P.H. Numerical investigations of buoyancy-driven natural ventilation in a simple atrium building and its effect on the thermal comfort conditions. Appl. Therm. Eng. 2012, 40, 358–372. [Google Scholar] [CrossRef]
  18. Ghasemi, M.; Noroozi, M.; Kazemzadeh, M.; Roshan, M. The influence of well geometry on the daylight performance of atrium adjoining spaces: A parametric study. J. Build. Eng. 2015, 3, 39–47. [Google Scholar] [CrossRef]
  19. Doheim, R.M.; Yohanis, Y.G.; Nadjai, A.; Elkadi, H. The impact of atrium shape on natural smoke ventilation. Fire Saf. J. 2014, 63, 9–16. [Google Scholar] [CrossRef]
  20. Gocer, O.; Tavil, A.; Ozkan, E. Simulation model for energy performance and user comfort evaluation of atrium buildings. Proc. SimBuild 2006, 2, 17–25. [Google Scholar]
  21. Su, Y.M. Improvement of ventilation and thermal comfort using the atrium design for traditional folk houses-Fujian earthen building. World Acad. Sci. Eng. Technol. Int. J. Civ. Environ. Struct. Constr. Archit. Eng. 2017, 11, 469–477. [Google Scholar]
  22. Aram, R.; Alibaba, H.Z. Thermal comfort and energy performance of atrium in Mediterranean climate. Sustainability 2019, 11, 1213. [Google Scholar] [CrossRef]
  23. EDSL Tas. Software Package for the Thermal Analysis of Buildings. Available online: http://www.edsl.net/main/Support/Documentation.aspx (accessed on 2 May 2019).
  24. Average Weather in Famagusta. Available online: https://weatherspark.com/y/97693/Average-Weatherin-Famagusta-Cyprus-Year-Round (accessed on 5 June 2019).
  25. International Organization for Standardization (ISO). Ergonomics of the Thermal Environment—Analytical Determination and Interpretation of Thermal Comfort Calculations of the PMV and PPD Indices and Local Thermal Comfort Criteria; Standard 7730; The International Organization for Standardization (ISO): Geneva, Switzerland, 2005. [Google Scholar]
  26. Standard, C.B. EN 15251, indoor environmental input parameters for design and assessment of energy performance of buildings addressing indoor air quality. In Thermal Environment, Lighting and Acoustics; European Committee for Standardization: Brussels, Belgium, 2007. [Google Scholar]
Figure 1. The general workflow of dynamic thermal simulation models of this research.
Sustainability 11 06213 g001
Figure 2. The PMV (predicted mean vote) of a mechanically conditioned single-floor building with an atrium volume ½ of the office volume and different atrium placements.
Sustainability 11 06213 g002
Figure 3. The PPD (predicted percentage dissatisfied) of a mechanically conditioned single-floor building with an atrium volume ½ of the office proportion and different atrium placements.
Sustainability 11 06213 g003
Figure 4. The PMV (predicted mean vote) of a mechanically conditioned single-floor building with an atrium volume ⅓ of the office volume and different atrium placements.
Sustainability 11 06213 g004
Figure 5. The PPD (predicted percentage dissatisfied) of a mechanically conditioned single-floor building with an atrium volume ⅓ of the office volume and different atrium placements.
Sustainability 11 06213 g005
Figure 6. The PMV (predicted mean vote) of a mechanically conditioned single-floor building with an atrium volume ¼ of the office volume and different atrium placements.
Sustainability 11 06213 g006
Figure 7. The PPD (predicted percentage dissatisfied) of a mechanically conditioned single-floor building with an atrium volume ¼ of the office volume and different atrium placements.
Sustainability 11 06213 g007
Figure 8. The PMV (predicted mean vote) of a mechanically conditioned medium-rise building with an atrium volume ½ of the office volume and different atrium placements.
Sustainability 11 06213 g008
Figure 9. The PPD (predicted percentage dissatisfied) of a mechanically conditioned medium-rise building with an atrium volume ½ of the office volume and different atrium placements.
Sustainability 11 06213 g009
Figure 10. The PMV (predicted mean vote) of a mechanically conditioned medium-rise building with an atrium volume ⅓ of the office volume and different atrium placements.
Sustainability 11 06213 g010
Figure 11. The PPD (predicted percentage dissatisfied) of a mechanically conditioned medium-rise building with an atrium volume ⅓ of the office volume and different atrium placements.
Sustainability 11 06213 g011
Figure 12. The PMV (predicted mean vote) of a mechanically conditioned medium-rise building with an atrium volume ¼ of the office volume and different atrium placements.
Sustainability 11 06213 g012
Figure 13. The PPD (predicted percentage dissatisfied) of a mechanically conditioned medium-rise building with an atrium volume ¼ of the office volume and different atrium placements.
Sustainability 11 06213 g013
Figure 14. The PMV (predicted mean vote) of a mechanically conditioned high-rise building with an atrium volume ½ of the office volume and different atrium placements.
Sustainability 11 06213 g014
Figure 15. The PPD (predicted percentage dissatisfied) of a mechanically conditioned high-rise building with an atrium volume 1/2 of the office volume and different atrium placements.
Sustainability 11 06213 g015
Figure 16. The PMV (predicted mean vote) of a mechanically conditioned high-rise building with an atrium volume ⅓ of the office volume and different atrium placements.
Sustainability 11 06213 g016
Figure 17. The PPD (predicted percentage dissatisfied) of a mechanically conditioned high-rise building with an atrium volume 1/3 of the office volume and different atrium placements.
Sustainability 11 06213 g017
Figure 18. The PMV (predicted mean vote) of a mechanically conditioned high-rise building with an atrium volume ¼ of the office volume and different atrium placements.
Sustainability 11 06213 g018
Figure 19. The PPD (predicted percentage dissatisfied) of a mechanically conditioned high-rise building with an atrium volume ¼ of the office volume and different atrium placements.
Sustainability 11 06213 g019
Table 1. The dynamic thermal simulation models as sample volume groups.
Single-Floor
(One Floor)
Medium-Rise Floors
(Five Floors)
High-Rise Floors
(Ten Floors)
Sustainability 11 06213 i001 Sustainability 11 06213 i002 Sustainability 11 06213 i003
Table 2. The dynamic thermal simulation models as plan groups (1: office zone and 2: atrium zone).
Atrium Placement in the BuildingAtrium Proportion as 1/2 of Office Proportion
         Sustainability 11 06213 i004
Atrium Proportion as 1/3 of Office Proportion
         Sustainability 11 06213 i005
Atrium Proportion as 1/4 of Office Proportion
         Sustainability 11 06213 i006
Center Sustainability 11 06213 i007 Sustainability 11 06213 i008 Sustainability 11 06213 i009
Northeast Sustainability 11 06213 i010 Sustainability 11 06213 i011 Sustainability 11 06213 i012
Northwest Sustainability 11 06213 i013 Sustainability 11 06213 i014 Sustainability 11 06213 i015
Southeast Sustainability 11 06213 i016 Sustainability 11 06213 i017 Sustainability 11 06213 i018
Southwest Sustainability 11 06213 i019 Sustainability 11 06213 i020 Sustainability 11 06213 i021
Table 3. The adaptive model analysis of a single-floor building (one floor atrium building, northeast: NE, northwest: NW, southeast: SE, southwest: SW, O: office zone, A: atrium zone).
Atrium Placement.Atrium ProportionWind. Opening RatiosZoneFloorMonths90% Accept.80% Accept.
Center1/20%OGroundMay to June**
50%January to June
July *
100%January to March*
AJanuary to April
NE0%O*
A
50%OMarch to April
AJanuary to April*
100%OMarch to April
A
NW0%OJanuary to February*
March to April *
AJanuary to April*
May *
50%OJanuary to February
March to April*
AFebruary to July*
100%OMarch to April
June to August*
AFebruary to April *
May to June*
SE0%OJanuary to February
March to April *
AJanuary to April*
April to May *
50%OJanuary to June*
A
100%OJanuary to July
A January to June
July to August *
SW0%OJanuary to April*
A*
50%OJanuary to June
AJanuary to July*
100%OJanuary to August
0%January to April*
SW50%AJanuary to April *
OJanuary to June
AJanuary to July *
100%OJanuary to August
AWhole year *
Table 4. The adaptive model analysis of a single-floor building (one floor atrium building, northeast: NE, northwest: NW, southeast: SE, southwest: SW, O: office zone, A: atrium zone).
Atrium PlacementAtrium ProportionWind. Opening RatiosZoneFloorMonths90% Accept.80% Accept.
Center1/3 0%OGroundJanuary to April
AJanuary to May
50%OJanuary and May
February to March *
AJanuary to March*
April and June *
100%OJanuary to March
September to December
*
April *
AJanuary to July*
NE0%OJanuary to February
March to April *
AJanuary to May*
50%OJanuary to June
April to July *
AJanuary to July*
100%O
AJanuary to August
NWOMarch to April
AJanuary to April
SEOJanuary to February
0%AApril *
SWOMarch to May and October*
AJanuary
100%OJanuary to March
November to December
*
April to July *
AJanuary to March
May to September
*
Center1/40%OJanuary to April*
AJanuary to May
100%O and AJanuary to August
NE0%OJanuary to July *
50%May to July
AJanuary to June
100%OMarch to April*
NW0%March to May
November to December
AJanuary to March
100%OJanuary to May
ADecember *
SE0%OApril to May
October to November
February to March*
ADecember to February
SW100%OApril to May
October to November
AMarch
Table 5. The adaptive model analysis of a medium-rise building (five-floor atrium building, northeast: NE, northwest: NW, southeast: SE, southwest: SW, O: office zone, A: atrium zone).
Atrium PlacementAtrium ProportionWind. Opening RatiosZoneFloorMonths90% Accept.80% Accept.
Center1/20%OGroundJune to October*
AJune to July *
August to September*
OFifthMay *
June to September
50%GroundJune to September*
AJune to October
September *
OFifthJune to October*
May *
100%Ground June to September*
October *
AJune to September*
October *
NE0%OGroundJune to October*
AFifthMay to July
O
50%OGround June to October
May *
AJune to October*
OFifth
100%O and AGroundJune to September
Table 6. The adaptive model analysis of a medium-rise building (five-floor atrium building, northeast: NE, northwest: NW, southeast: SE, southwest: SW, O: office zone, A: atrium zone).
Atrium PlacementAtrium ProportionWind. Opening RatiosZoneFloorMonths90% Accept.80% Accept.
Center1/20%OGround June to October*
A June to July *
August to September*
OFifthMay *
June to September
50%Ground *
AJune to October
September *
OFifthJune to October*
May *
100%Ground June to September*
October *
A June to September*
October *
NE0%OJune to October*
A
OFifthMay to July
50%GroundJune to October
May *
AJune to October*
OFifth
100%O and AGroundJune to September
October *
OFifthJune to September*
October *
NW0%GroundJuly to October*
FifthMay to June
50%GroundJune to September
October *
AJune to September*
October *
OFifthJune to September*
October *
0% October *
GroundJuly to October*
FifthMay to June**
50% Ground June to September
FifthOctober *
NE100%OJune to September*
Table 7. The adaptive model analysis of a medium-rise building (five-floor atrium building, northeast: NE, northwest: NW, southeast: SE, southwest: SW, O: office zone, A: atrium zone).
Atrium PlacementAtrium ProportionWind. Opening RatiosZoneFloorMonths90% Accept.80% Accept.
NW1/2100%OGround June to September*
October *
AJune to September*
October *
OFifthJune to September*
October *
SE0%, 50%, and 100%GroundJune to October*
A
OFifth
SWGround
A
OFifth
Center1/3 0%Ground
A
OFifthMarch to June
50% and 100%O and A GroundJune to September
October *
OFifthJune to September*
October *
NE and NW0%GroundJune to October*
AGroundJuly to August *
OFifthSeptember to November
May
*
50%Ground May to June
July to August *
AMay to June*
OFifth
July to August *
100%Ground May to September*
AAugust to October
July *
OFifthAugust to October*
July *
SE and SW0%O and AGroundJune to September*
FifthMay to October
1/3 50% and 100%OGroundJune to September*
FifthOctober *
June to September*
October *
Center1/4 0%GroundJune to September*
A
OFifthMay to June
September *
Table 8. The adaptive model analysis of a medium-rise building (five-floor atrium building, northeast: NE, northwest: NW, southeast: SE, southwest: SW, O: office zone, A: atrium zone).
Atrium PlacementAtrium ProportionWind. Opening RatiosZoneFloorMonths90% Accept.80% Accept.
Center 50%O and AGroundJune to August*
October *
OFifthJuly to August*
100%O and AGround
May *
NE0%June to August*
AOctober *
OFifthMay to June*
50% and 100%O and AGroundMay to September
OFifthMay *
NW0%O and AGroundMay to September*
OFifthMay to June
September to October
50% and 100%O and A GroundJune to September
May to October *
OFifthJune to September*
May to October *
SE0%GroundMay to September*
AOctober *
OFifthMay to June*
50% and 100%O and A GroundSeptember *
June to September*
OFifthSeptember *
1/4 June to September*
SW0%GroundMay to September
A June to August
A GroundJuly to September *
OFifthMay
September to November
*
50% and 100%O and AGround May to September
October *
Table 9. The adaptive model analysis of a high-rise building (10-floor atrium building, northeast: NE, northwest: NW, southeast: SE, southwest: SW, O: office zone, A: atrium zone).
Atrium PlacementAtrium ProportionWind. Opening RatiosZoneFloorMonths90% Accept.80% Accept.
NE1/2100%OFifth and TenthNovember and December *
NWAGroundMay and July*
OFifth and Tenth
GroundJune to August *
SWO and A Ground, Fifth, TenthWhole year
50%November and December
January to September*
Center1/3 0%OGroundJune to December
AMay to December
OFifthJune to September
TenthMay to September
50%Ground June to December
AJuly to December
OTenthJune to November
Center100%O and A Ground, Fifth, and TenthJuly to December
NE0%, 50%, and 100%June to December *
NW0%OTenth*
50%O and A Ground, Fifth, and Tenth
100%
SE0%GroundWhole year *
Fifth, and TenthJune to September
50%Ground, Fifth, and TenthJuly to December
100%May to December*
SW0%Ground June, November, and December *
July, August, and September*
Center1/2100%OJanuary to April
A
OFifthMay to June *
TenthWhole year*
NE50%Ground January to October
100%AFebruary to July *
January, August, September, and October*
O
Table 10. The adaptive model analysis of a high-rise building (10-floor atrium building, northeast: NE, northwest: NW, southeast: SE, southwest: SW, O: office zone, A: atrium zone) (cont.)
Atrium PlacementAtrium ProportionWind. Opening RatiosZoneFloorMonths90% Accept.80% Accept.
SE1/3 0%O and AGroundJune to December**
OFifth and TenthJune to September
50% and 100%O and AGround, Fifth, and TenthJuly to December
SW0%OFifthJune and July
Center1/450% and 100%O and ATenthAugust and September *
Ground, Fifth, and TenthJune to December
0%OGround*
Fifth and TenthJune to September
50% and 100%O and AGround and FifthJuly to December
NE1/3 0%OGroundMarch to May
June to September *
AApril to July*
August *
OFifthJanuary to May*
TenthFebruary to May
January and June *
50%AgroundAugust to December*
July to December*
NE1/350%OFifth and TenthJuly to November
100%GroundMarch to September
AJuly to November
OFifthJan. to May
TenthJanuary, May, June, and August *
February, March, and April*
NW0%GroundJune *
July to December*
AMay to December *
June to November*
OFifthMay to Aug.
TenthJune to September
50%GroundJuly to December*
100%Fifth and TenthJuly to December
July to December

