Abstract
A lot of attention has been paid in the last years to urban freight transport (UFT) activities generated by specific market segments such as food, retail, or home deliveries, while relatively little attention has been paid to the transport of goods to and from construction sites in urban areas. Although transport of construction materials represents up to 30% of freight movements in cities and even more in terms of pollutant emissions. Using data collected over eight months in four construction sites, this paper provides a better understanding of the urban freight transport activity related to construction and presents the potential benefits of the implementation of construction consolidation centres (CCCs). A CCC is an innovative approach, which aims at increasing the efficiency and effectiveness of logistics processes by reducing the number of deliveries. Consequently, the use of a CCC in urban areas can reduce congestion and pollutant emissions due to construction freight movements. This paper presents results of CCC usage simulations for the four construction sites mentioned above. The results suggest that the distribution of goods to and from construction sites is peculiar as compared to other, better-known, urban supply chains and reinforce the call to researchers and decision makers from both private and public sides to devote more attention to this market segment.
1. Introduction
Cities are by far the fastest growing territorial units of our times. In 2018, around 55% of the world’s population lived in urban areas. This share is expected to grow up significantly. It is estimated that by 2050, 68% of the world population is likely to be living in cities or other urban centres [1], which requires significant investment in the construction of new buildings and infrastructures and the refurbishment of old ones. The construction sector is unique in the sense of the one-of-a-kind nature of its projects, site production, and temporary multi-organization [2]. When compared to the other economic sectors, the construction sector suffers from a poor productivity performance [3] and is waiting for a radical change to reinvent itself completely like retail or manufacturing did some decades ago. While a lot of attention has been paid in the last years to urban freight transport (UFT) activities generated by specific market segments such as food, retail, or home deliveries, relatively little attention has been paid to the construction logistics. Yet, it represents a major market segment, generating up to 30% of the tonnage carried within cities [4]. Distribution related to the construction activity often results in significant disturbances to the daily life of citizens, such as congestion, safety hazards, noise, and air pollution. It can also lead to economic losses for construction companies if not properly managed. Indeed, delays to deliveries could disrupt work plans and delay the completion of construction projects. Logistics plays a major role in construction, yet it is still too often considered as a secondary issue by many operators. This paper, based on the work carried out within the SUCCESS project, concluded in April 2018, aims to provide a better understanding of the UFT activity related to the construction industry and to explore some approaches that could improve the current situation. Financed by the European Union’s Horizon 2020 programme, the project brought together eleven partners from the public and private sectors with the aim to reduce the negative impacts and costs of UFT generated by the construction sector through improved supply chain management and construction consolidation centres. It aimed to make the most of this sector’s enormous potential for improvement by exploring and testing new tools and methods, including the potential creation of CCCs, in order to provide replicable solutions and improve the use of the existing transport infrastructure and the level of cooperation among the different stakeholders of the construction supply chain.
2. Methodology
We present two comparative analyses: One comparing the four construction sites using the data collected onsite and another one trying to generalise the findings and to compare construction-related UFT patterns to other commonly observed UFT patterns. Both quantitative and qualitative analyses have been set up to provide insight into UFT activities generated by the construction sector. The analyses are based on the observation of four construction projects located in the European cities of Luxembourg City, Paris, Valencia, and Verona (Table 1). The quantitative analysis relies on data on the freight movements of building materials to and from the four construction sites. The data were collected over eight months (spanning between Q4 2015 and Q3 2016) during which more than 4000 deliveries and pick-ups were recorded. Freight movements inside the construction sites (i.e., from the material reception to its final point of use) were collected, too. The data collection covered partially or completely all construction phases for all projects: Structural works, casing, technical trades (e.g., electricity and plumbing), finishing, and landscaping. The main contractors collected data manually on a daily basis according to the same set of metrics including, among others, delivery distance, delivery time, delivery schedule, unloading time, and unloading process. The SUCCESS project put in place a quality process to ensure consistent data quality all along the collection period. This gave confidence in the opportunity to analyse the data to better understand the state of the art and identify potential improvements. If the number of observed construction sites is limited, their diversity in terms of size (i.e., medium to large construction sites), location (e.g., city centre of a large-sized city, suburbs of a medium-sized city), type of building (e.g., office, mixed-used building), and the duration of the data collection offered a real opportunity to investigate construction logistics operations in Europe. We believe that the collected data are sufficiently representative of construction logistics activities in European cities and therefore can be used to compare urban construction logistics activities with more traditionally studied urban logistics activities. The indicators related to generic UFT come from a literature review [5,6] that demonstrates that European cities share similar or sometimes identical patterns.

Table 1.
Overview of the construction projects and sites.
The simulations related to the introduction of a CCC rely on a stochastic optimization approach for the freight trip generation [7]. Different scenarios have been designed by the partners from the private sector depending on the economic context of the four cities. The scenarios did not aim to transport freight to all the construction sites of a city but rather to a part of future construction projects (i.e., they did not include the observed projects described in Section 3). Considering the scope of the defined scenarios, only one CCC serving one to several construction sites was considered in each city, with the notable exception of Paris, where the demand is higher and the construction company belonging to the SUCCESS consortium is one of the biggest construction companies in France. In this case one or two CCCs serving several sites were considered. The optimal location of the CCCs was determined among a given set of realistic options identified with the help of the construction companies and/or the municipalities. The economic savings were computed with the help of a cost-benefit analysis (CBA) process, where the revenues for construction companies come from economic savings due to the better labour performance on the site (savings in personnel) and the better utilization of building materials (savings due to unsorted bins and reduced handling/theft/damage/overstock). The cost estimate comes from the use of the CCC, which includes the cost of the facility, personnel, vehicles, and general expenses. Emissions were computed with the COPERT© software tool jointly designed by EMISIA (a spin-off from University of Thessaloniki), the European Environment Agency (EU), the Joint Research Centre (EU), and Aristotle University of Thessaloniki (GR).
3. Overview of the Construction Sites
All the observed projects were located in congested areas in medium-sized and large cities (Table 1). The fact that the sites were located in congested and densely inhabited areas and close to relevant infrastructures made the distribution of building materials challenging. This was especially the case in Paris and Verona where the construction sites were close respectively to protected sites and to an active hospital.
3.1. Neudorf Breweries Complex in Luxembourg City (LU)
The project consisted of the transformation and renovation of an old factory into office/residential/commercial buildings in a district situated in a valley. The site is up against a hill and is located in a residential area to the East of Luxembourg City. The site is few minutes away from the Kirchberg business district and the city centre of the capital. The Neudorf Breweries are located on the main thoroughfare of the district that connects the airport to the city centre.
3.2. Fontenoy-Ségur Complex in Paris (FR)
The project consisted of the transformation and renovation of two office buildings with an architecture dating back to the 1930s. The eight-storey complex is designed for government departments, including those of the Prime Minister and several administrative authorities. The Fontenoy-Ségur complex is located on the seventh arrondissement of Paris, one of the most prestigious neighbourhoods near the Eiffel Tower and the UNESCO headquarter.
3.3. Parque Central—Russafa in Valencia (ES)
The project consisted of the transformation of former railway yards near the main train station as part of the urbanization of a green area named Valencia Parque Central. The urbanization of the Russafa zone includes the refurbishment of four buildings, the erection of three buildings (out of the scope of the SUCCESS project), two fountains, and a waterfall. The park is located in the Eixample district, one of the most important commercial areas of Valencia, and is close to the Russafa area, one of the oldest parts of the city, which is going through an extensive renovation. Valencia’s Parque Central is located between two of the main arterial thoroughfares connecting the city centre to the surrounding neighbourhoods of the city.
3.4. Borgo Trento Hospital in Verona (IT)
The project consisted of the construction of two hospital buildings inside a hospital complex in operation. The Borgo Trento site is located to the North of the city centre and close to the old town and the ring road.
4. Comparison of the UFT Patterns between the Four Construction Sites
4.1. Stakeholders
In each site, a main contractor was responsible for the overall coordination of the project (the projects were not divided into separate lots). The high fragmentation of the construction sector results in a large number of stakeholders and suggests potentially high benefits in consolidating building materials. The four construction sites involved many trade subcontractors (e.g., electricity and plumbing companies) focused on their own activities and relatively autonomous in the selection of their suppliers. For one of the sites, 66 distinct shippers delivered building materials over eight months. Most of the subcontractors collaborated for the first time with the main contractor who coordinated the activities according to an agreed plan. The construction projects resulted in a temporary collaboration. However, only two of the main contractors (in Luxembourg City and Paris) used framework agreements to work on long-term collaborative arrangements with their subcontractors. The framework agreement allows the construction company to instruct another party to carry out works or provide goods or services, by reference to pre-agreed terms, over a pre-agreed period.
4.2. Vehicles
The type of vehicles delivering freight to the construction sites was quite varying from site to site. All sites taken together, more than 20 types of delivery vehicles were identified, ranging from semi-trailers to mini-vans, some being very specific to the construction sector (inloader trailers) or the material delivered (e.g., concrete pump trucks). However, the prevalent tendency was the use of heavy goods vehicles (HGVs) as reported in Table 2. A notable exception was a site where freight was mainly delivered with light good vehicles (LGVs) due to local regulations imposing their use. It is also worth observing that the majority of delivery vehicles allow the handling of goods not only from the rear or side of the vehicles, but also from the top (e.g., platform trucks, platform cabs) to ease the unloading with a crane.
Table 2.
Analysis of deliveries and pick-ups on four urban construction sites over eight months.
4.3. Handling of Building Materials
In all sites, the cost of materials represented 30–40% of the overall construction costs. Considering the lack of space on site and the dynamic nature of the activities, the logistics of materials on a construction site is challenging. Each subcontractor manages its own materials and the potential storage area increases with the construction progress by using newly erected floors as additional storage. In Paris, considering the high footprint of the building on the site, the sole solution was to store materials in the existing floors (cf. Table 1). In Verona and Luxembourg City, the storage space increased with the progress of the construction works.
For all four sites, the most frequent loading unit was the pallet, sometimes by a vast majority (82.6% for site 3), sometimes by a lower proportion (39.8%).
The way to handle goods varied depending on the equipment and organisation of each site. One site used mainly its crane to unload the goods in addition to the truck’s crane, while two others used mainly the forklift in combination with either the site crane or a construction lift.
The average weight of deliveries varied from site to site and depending on the delivery vehicle. However, the average weight of materials delivered daily was uniform among the sites: Between 8 and 10 tons per day.
4.4. Deliveries
The accessibility of the sites depended strongly on the configuration of the sites themselves and evolved during the construction. The location and number of entrance and exit gates is one of the first logistics issues to solve when planning construction activities. The decision has a direct impact on the frequency and scheduling of deliveries. In Luxembourg City, drivers needed to enter backwards into the site because there was not enough space to do a U-turn. For the same reason, the site could not receive simultaneous deliveries. When there was not enough available space on the site, trucks had to double park and unload directly on the street before 6 am. In Paris, the delivery vehicles accessed the site through one of the two entrances. The limited space on the site obliged the main contractor to rent public space to create the entrance and exit gates. In Verona, the entrance and exit gates were separate. To avoid excessive congestion, a detailed schedule of the entrance slots for the incoming trucks was required. Temporary traffic lights regulated the movement of vehicles when they left the construction site to facilitate reinsertion into the traffic flow. In Valencia, the two entrance/exit gates and the abundance of available space eased the deliveries.
The scheduling of deliveries was the standard for three sites out of four with more than two thirds of deliveries scheduled. One of the three sites even rejected any unscheduled deliveries. The remaining sites used the scheduling only for 13% of deliveries. With regard to the scheduling approach, both fixed and time window scheduling were used.
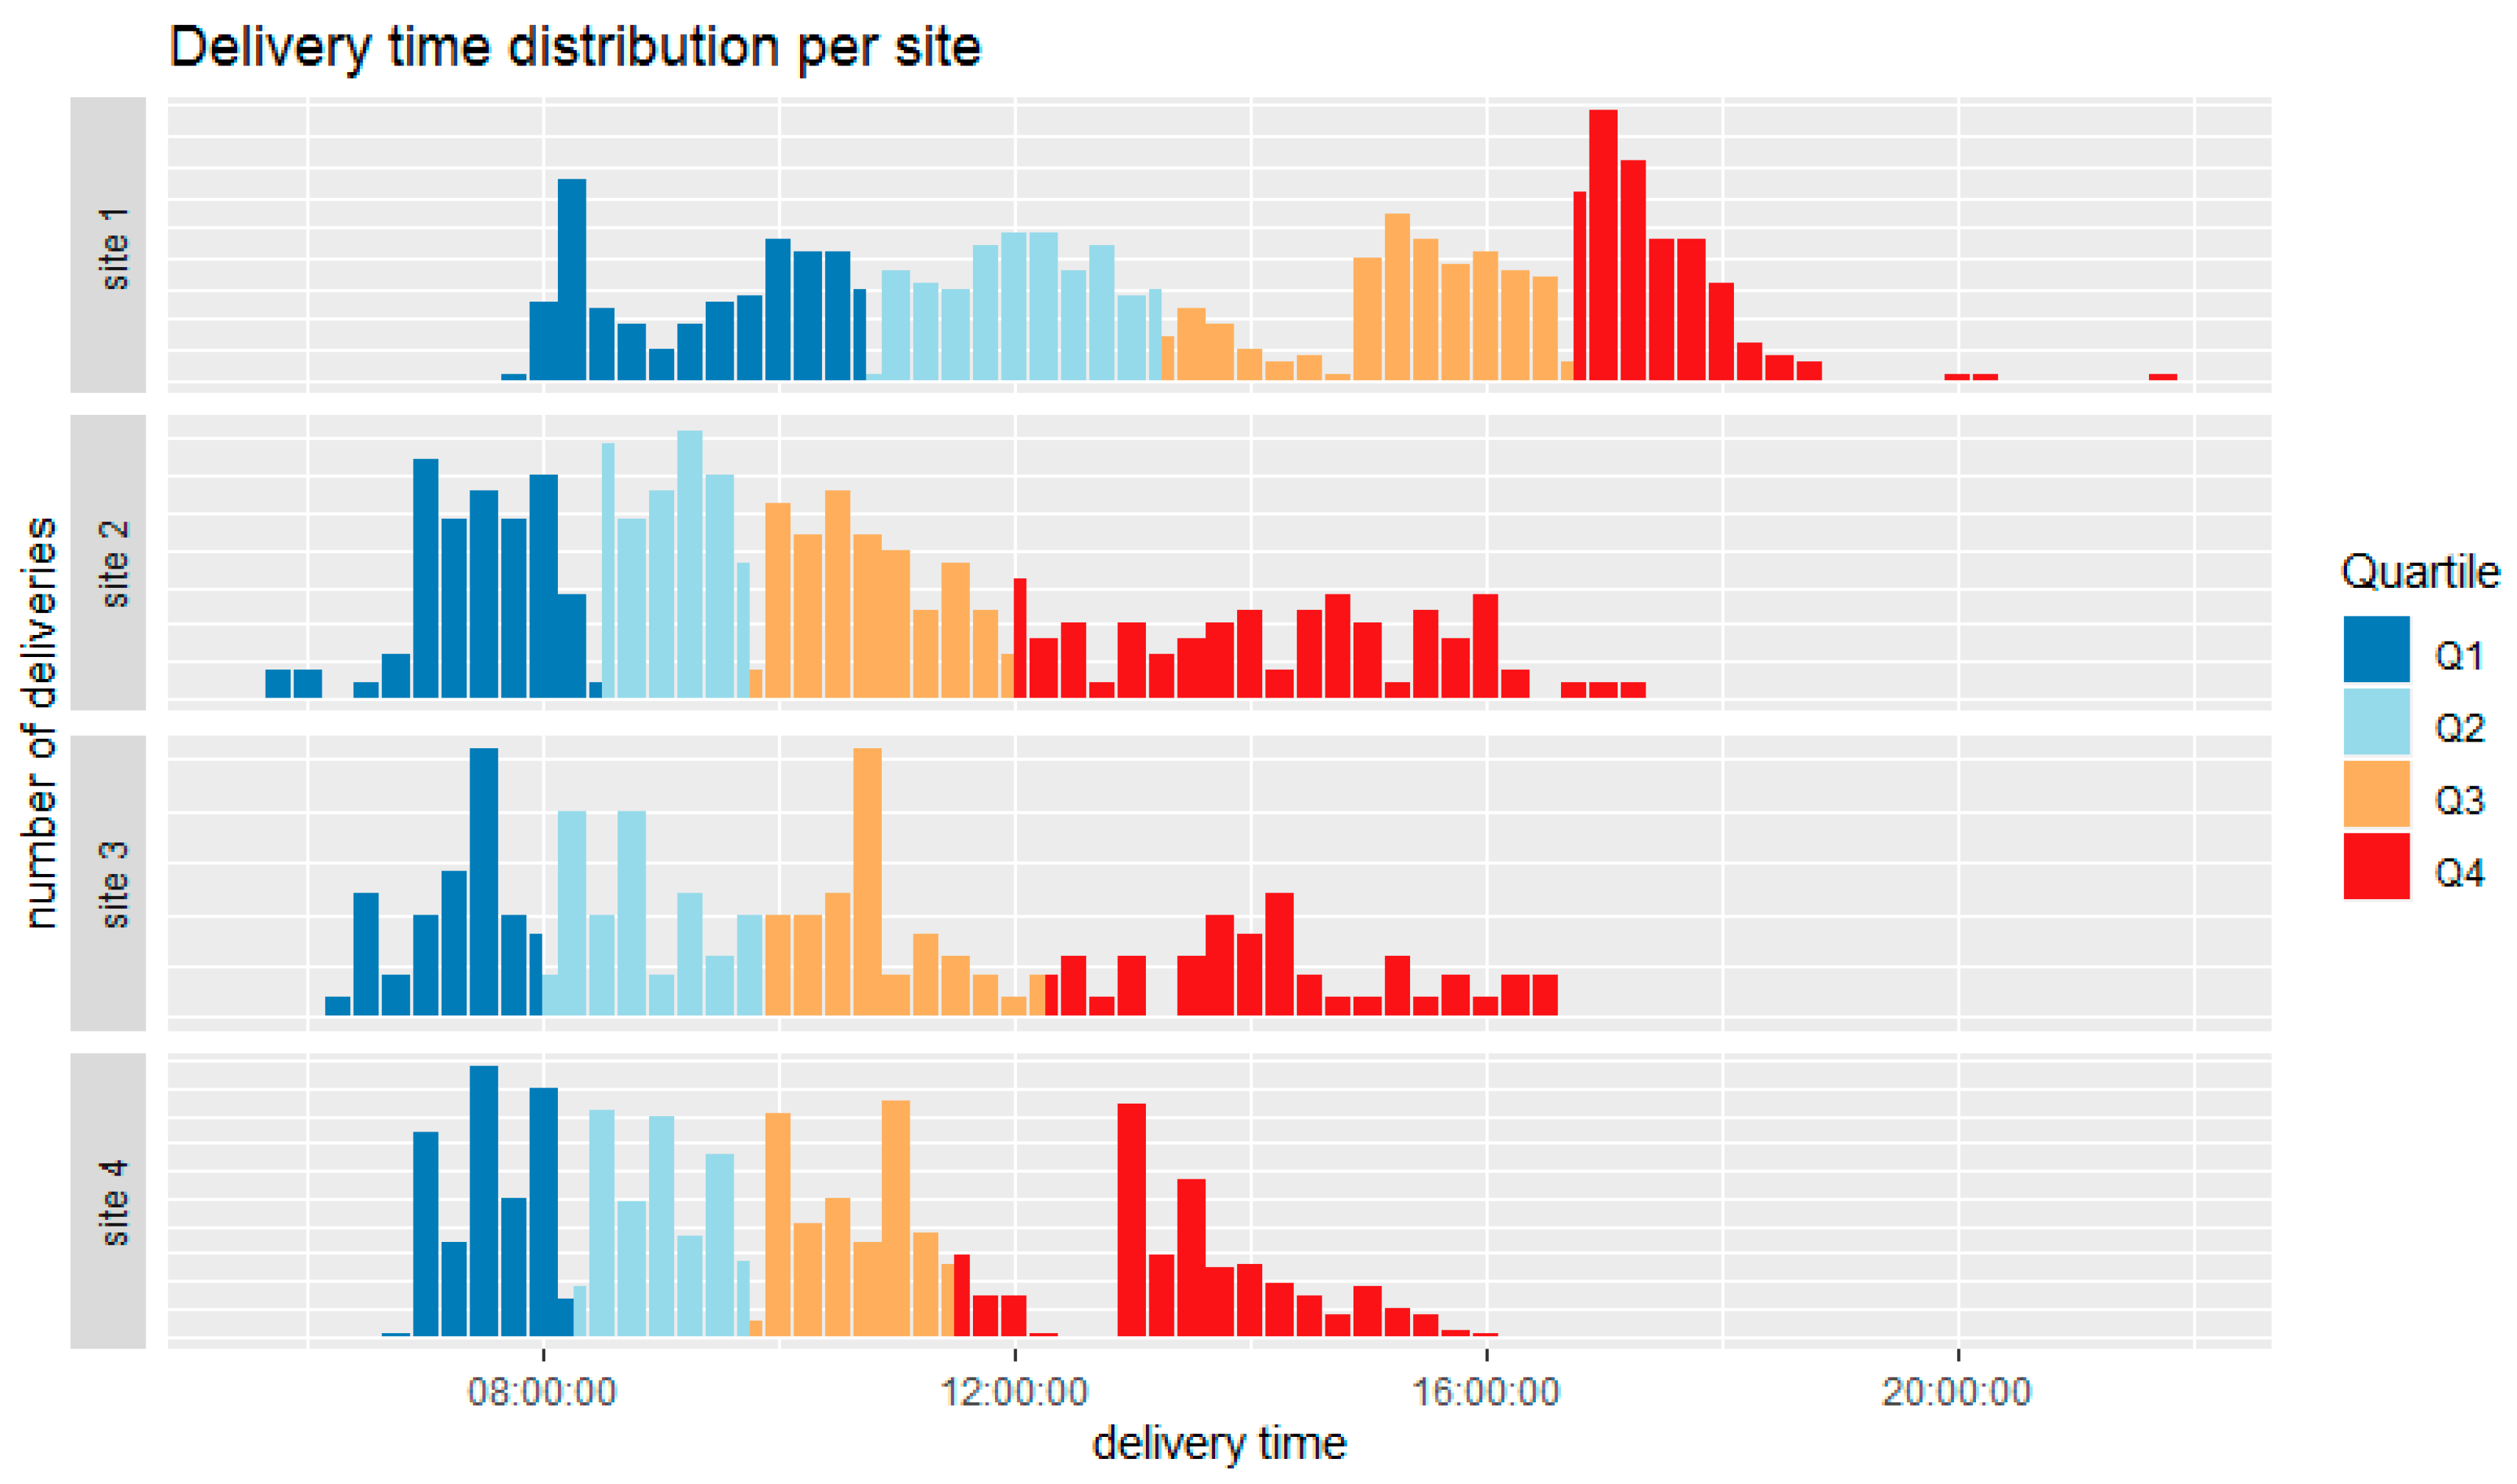
In three sites out of four, most deliveries occurred in the morning (25% of deliveries occurred before 8:30 am, 50% before 10 am and 75% before 12:15 pm). For the remaining sites, deliveries were more distributed during the day. The distribution of delivery time per site is shown in Figure 1. The average duration of deliveries ranges from 34 min to 1 h.

Figure 1.
Delivery time distribution per site.
For all sites, it was quite usual to see the delivery vehicles stopped either in traffic jams before reaching the site, or before being allowed to enter the construction site, or even inside the construction site, before being allowed to unload (waiting for the unloading equipment to be available). On average, and depending on the site, the vehicles were stopped between 18 and 36 min for each delivery.
The sites received deliveries between two and ten times a day. The number of deliveries was somehow correlated to the size of the construction project but also to the size of the vehicles used. However, as stated before, the average weight of the materials delivered daily was quite homogeneous across the sites.
The location of the unloading area depended on the organisation of the site; deliveries were unloaded on a delivery zone for three sites and at the point of use in the building under construction for one site. It has to be noted that delivering at the point of use makes the delivery duration longer.
Below we report anonymously and in an order that does not refer to the previous table the findings for the four construction sites. The results of the comparison between construction sites are summarized in Table 2. For conciseness, not all recorded times and durations are reported in the table. For example, the duration of trucks’ stops inside the site was recorded but not reported.
4.5. Logistics Organization
The human and material resources to manage the transport of material from their reception on the site to the final point of use were managed differently from site to site. In Luxembourg City, Valencia and Verona, the subcontractors managed the handling equipment themselves with the sole exception of the tower cranes. In Verona, a dedicated person checked carefully the origin and quality of the provided material. In Paris, a construction logistics team was appointed to improve the operations on site when it came to coordinate material flows for all the subcontractors. The dedicated team was composed of a management team working for the main contractor, a subcontracted delivery team managing access, deliveries and housekeeping, and a subcontracted waste team collecting and sorting waste on site. The main contractor managed the handling equipment and allowed the subcontractors to use them. The handling equipment were quite diverse with two tower cranes, three lifts, and forklift trucks. The main contractor requested the subcontractors to plan the deliveries using an online booking system designed for scheduling a delivery area and material-handling equipment. This practice was quite advanced considering that construction is among the least digitised sectors [8].
4.6. Regulation
Transport related to the construction UFT generally follows standard transport rules. Close collaboration with the local authorities is requested to put in place, when necessary, signs asking pedestrian to use the opposite pavement, lower speed limits, or traffic lights. Special requests to rent public space, to change weight restrictions or time windows are common. In Luxembourg City and Paris, the main contractor rented public spaces (respectively €7200 for the first six months of the project and €1 million for all the project duration) to create delivery zones, set up a part of living accommodation and offices, and set up the lifts.
5. Comparison with Other Commonly Observed UFT Patterns
Based on the previous findings on construction related UFT patterns, a comparison with other commonly observed UFT patterns is presented according to a set of dimensions partially inspired from literature [5,8,9,10] and partially developed specifically for this study. The set of dimensions allows us to cast some light on the similarities and differences in terms of stakeholders, vehicles, delivery, material, technology maturity, etc.
Despite some differences between the four construction sites, we found significant similarities from which we could identify construction-specific UFT patterns that we compared against generic UFT patterns (i.e., UFT patterns for retail, food, and services in urban areas). The results are summarized in Table 3. They suggest that the distribution of goods to and from construction sites is peculiar as compared to other urban supply chains. This reinforces the need for researchers and decision makers from both private and public sides to devote more attention to this market segment.
Table 3.
Comparison highlighting the specificities of construction-related urban freight transport (UFT).
6. Approaches Transforming Construction Supply Chains
The construction logistics and supply chain management have received so far little interest from the research and professional sectors [11] despite the fact that the construction industry suffers from low productivity [3]. The SUCCESS project reported 22 good practices to improve supply chain management and logistics in construction [12]. Among these, some look particularly promising such as the building information modelling (BIM) or the logistics team. We focus here our attention on the promise of construction consolidation centres (CCC) to optimise the delivery of building materials and equipment bringing environmental, societal, and economic benefits. The CCC is a logistics facility through which building materials are dropped off before being consolidated, sorted, and delivered to construction sites. The CCC is usually close to urban centres (less than 50 km) with easier access for suppliers to deliver their goods and enough space for big trucks to perform manoeuvres and unloading operations. Building materials are handled with appropriate equipment and stored in dry and secure locations. On call off from the site, the CCC operator makes up consolidated loads and delivers them on a just-in-time basis with appropriate vehicles. The CCC can also provide a range of other value-added logistics and retail services such as off-site assembling, mock-up space, kitting, warehousing, quality control, reverse logistics, etc.
To quantify the potential benefits of introducing a CCC, different scenarios in which a CCC serves one or multiple construction sites that may come up in the next few years have been simulated for each of the four cities and compared to the baseline, where no CC is used. Details of the simulation assumptions, process, and results are reported in [7]. Assumptions have been predetermined either based on practitioners’ advices per country or based on the analysis of data collected during the observation of pilot sites. For example, the load factor has been assumed to be 75% of trucks’ capacity. For average speed, routing, and traffic, the assumptions were provided by the Google distance matrix API, using standard parameters (i.e., average traffic on the roads during working days). However, due to lack of data for formulating assumptions, no specific traffic model was considered for the computation of pollutant emissions, which relied on standard values provided within the COPERT© tool. The simulation models rely on data collected on the four sites and assess environmental and socio-economic impacts related to the introduction of a CCC. The simulation process can be summarized as follows:
- (a)
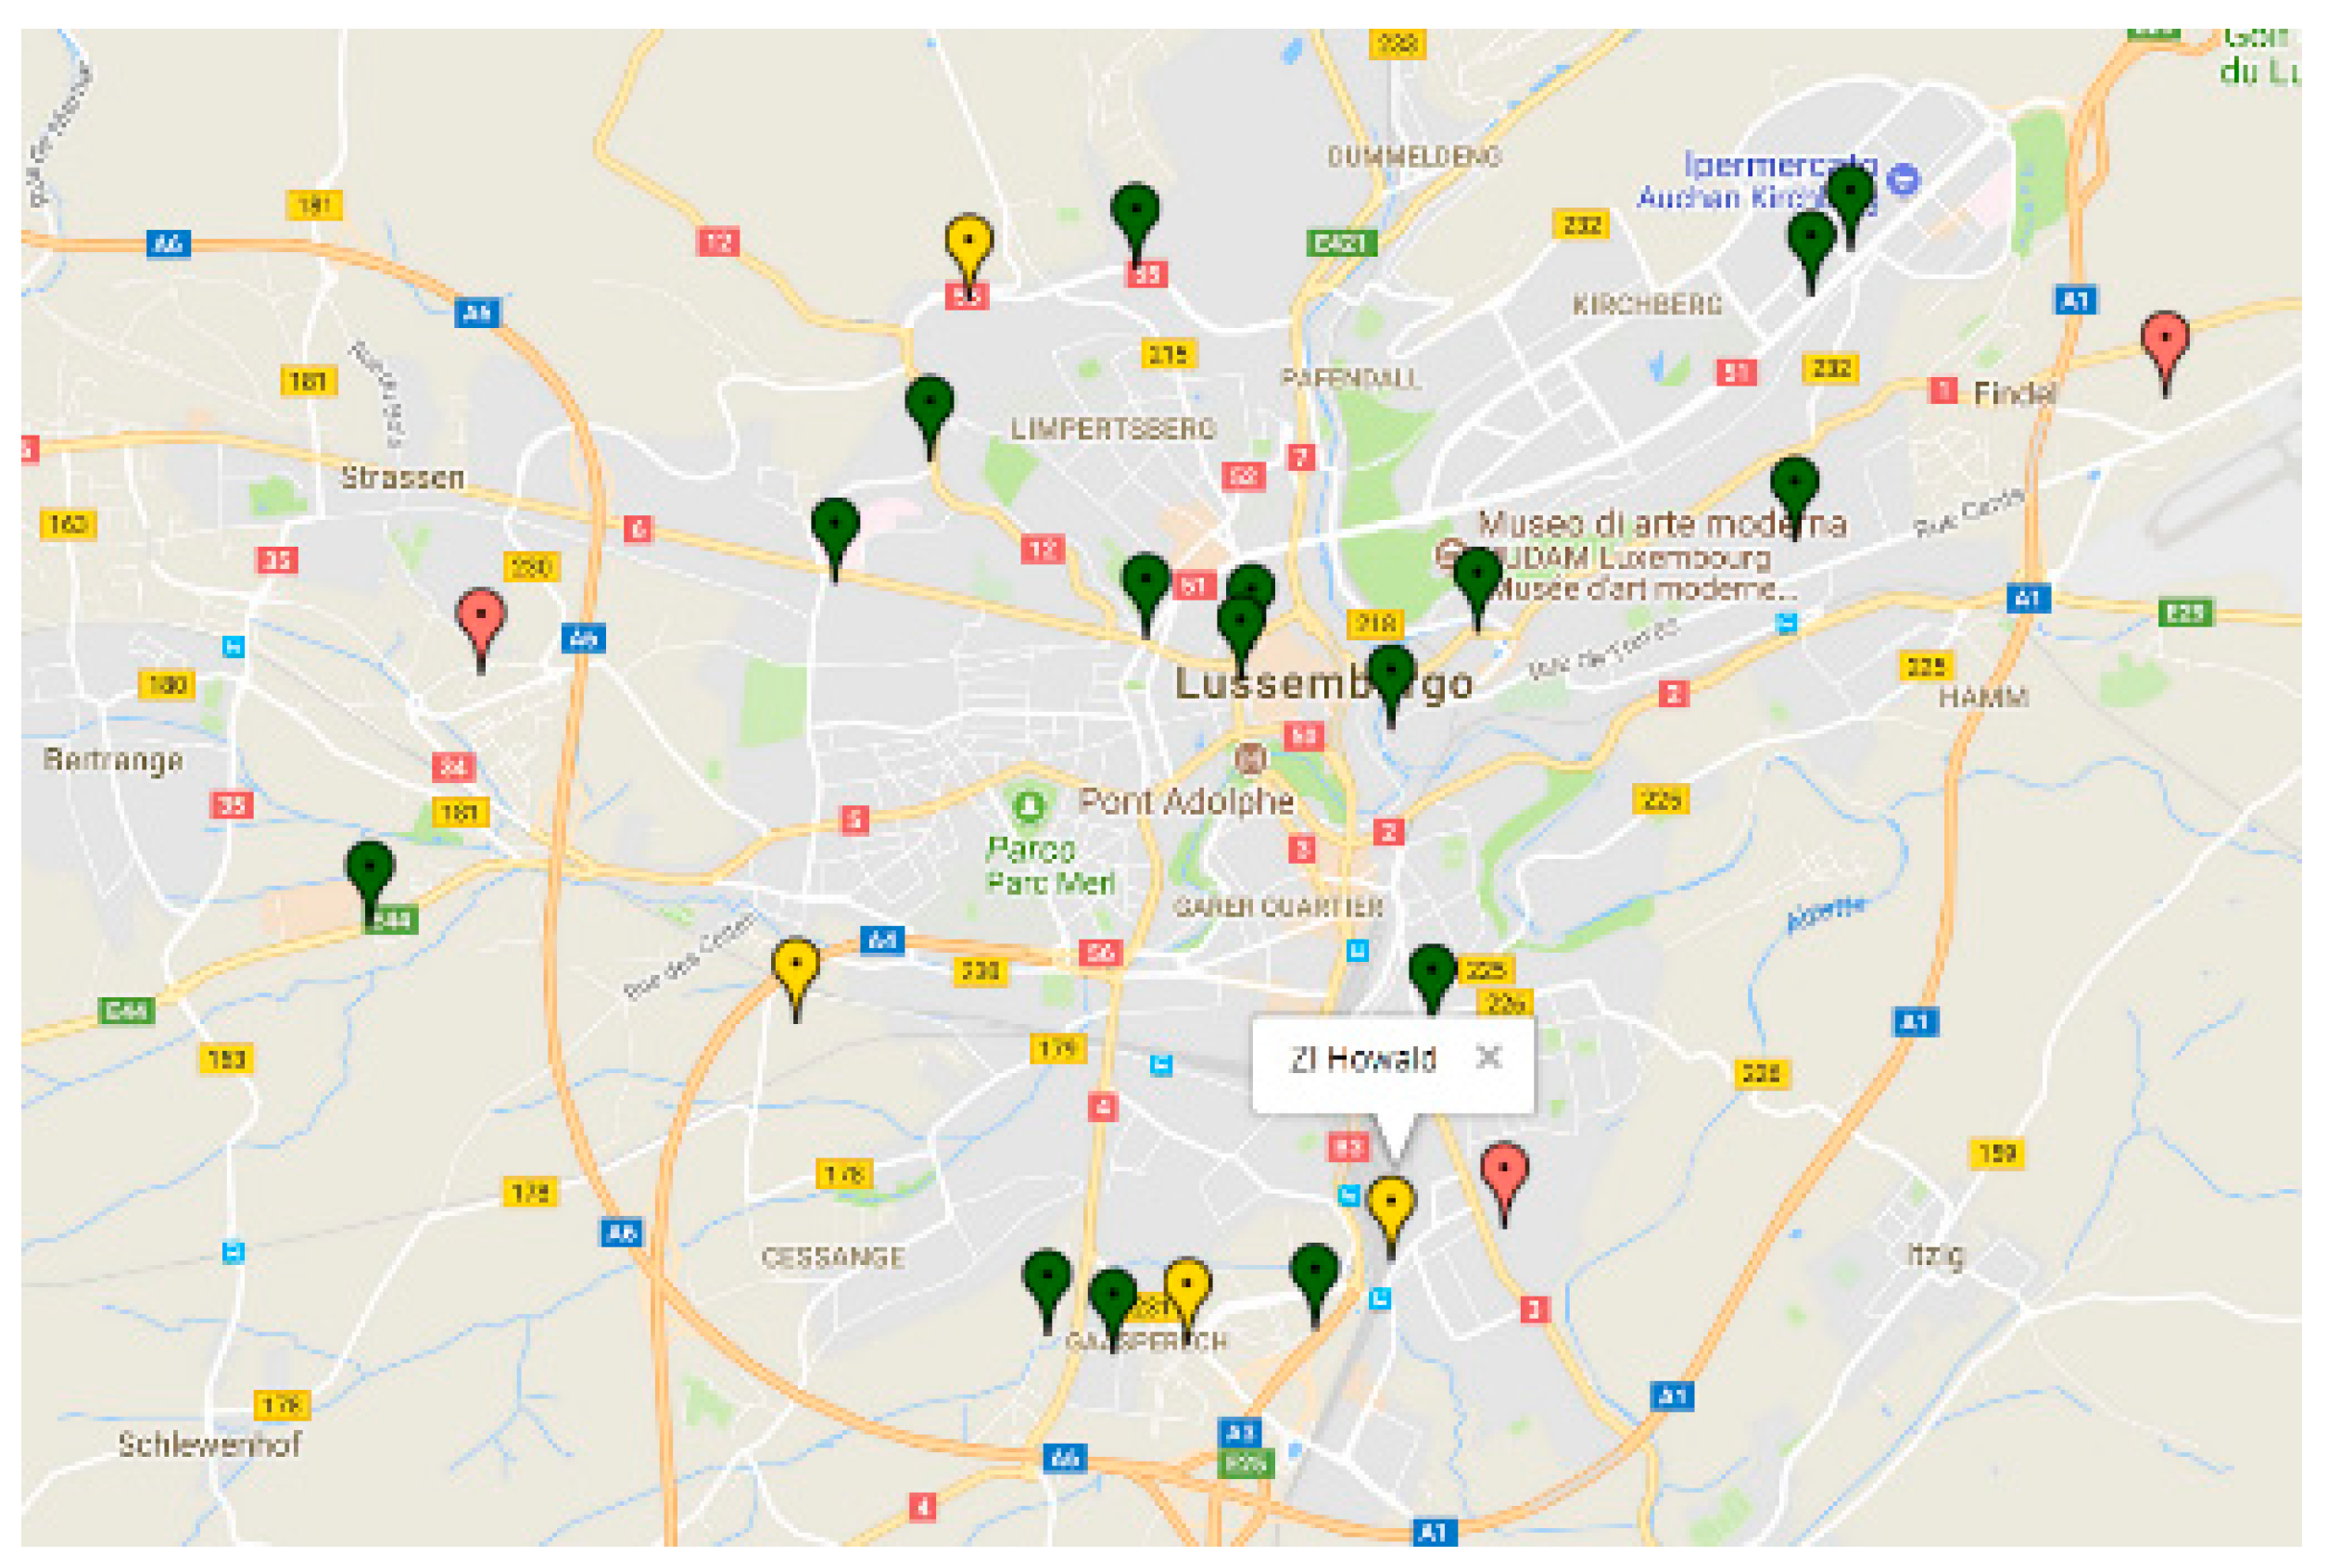
- Initial data for each country are collected to generate stochastic scenarios. For example, for the pilot case of Luxembourg, six CCC candidates locations have been identified by the pilot and its stakeholders, four of them being represented in Figure 2. In addition, the pilot and its stakeholders provided assumptions on future construction sites, material demand, and vehicles types.
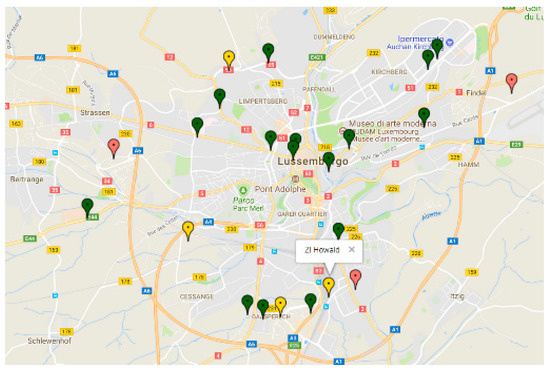 Figure 2. Example of possible locations for construction consolidation centres (CCC) in Luxembourg. CCC candidate locations are shown in yellow, construction sites in green and suppliers in red; the selected CCC appears with a call out box.
 - (b)
- These data are used to feed a mathematical model of the stochastic facility location problem, using a mixed integer linear programming solver, which gives the optimal choice for the CCCs location, i.e., the location that lowers the material flows (km × m3) over the simulation period (three years).
- (c)
- Then, with the choice of the optimal CCC location for each city, scenarios are assessed: No use of CCCs (baseline) versus use of CCC(s) for one or several construction sites with vehicle allocation and routing optimisation on the second echelon (only) or on both echelons. A set of C++ programs run the simulations for the distances and times of the flows in the different scenarios. Readers interested in the mathematical models used at each step are suggested to read [13].
- (d)
- The results of this evaluation are next used both by the COPERT© software and by cost-benefit analysis models to evaluate, respectively, the pollutant emissions and the economical sustainability and opportunity of using the CCC(s).
- (e)
- The results for each scenario are compared to the baseline (no use of CCCs).
The main results of these simulations are reported in Table 4 below:
Table 4.
Results of simulating the introduction of one or more CCCs.
The results demonstrate the potential positive impact of using a CCC in the considered cases with a strong variability depending on the scenario. For the best-case situation (best-case scenario for the most important site, i.e., Paris), the simulation results show that the use of a CCC can reduce the number of freight vehicles by four delivery vehicles per day. Concerning pollutant emissions in absolute value, still using the best-case situation for a CCC configuration, per year, CO2 emissions can be reduced from 245 tons (baseline situation) to 190 tons, NOx emissions from 2300 to 1500 kg and PMx emissions from 174 to 151 kg. The variability of the results suggests that a careful analysis of the situation is primordial before implementing a CCC to secure its sustainability. To support this approach, the SUCCESS project developed a number of tools (freely available for all at the link http://www.success-urbanlogistics.eu/successful-tools/) to identify the best location of a CCC and to assess the costs and benefits that a CCC would bring for a given set of projects. Since there is no one-size-fits-all solution to tackle such challenge, another tool provides guidance on the solution(s) to implement given the complexity of the logistics and the urban environment of a (set of) construction site(s).
7. Conclusions
The results of our analysis suggest that the distribution of goods to and from construction sites is barely comparable to other urban supply chains, despite the fact that the construction sector is a major contributor of freight movements in urban areas. Indeed, the analysis of the construction supply chain compared to generic UFT shows significant differences in the logistics patterns with ten out of the eleven observed characteristics differing (cf. Table 3). The attention of researchers and of private and public decision makers should be raised to take into better account the role of this sector in the study of city logistics and design of transport policies. The CCC could represent an effective approach to managing the construction supply chain, reducing traffic in urban centres at busy times and ensuring that resources are used more efficiently [14]. A CCC has much more storage space than a typical construction site, so it can be used as a sort of back-up for some materials, where they are stored in a safe place. While delays in delivery to construction sites cannot be ruled out entirely, they are likely to be less serious if the materials are not transported from further afield. Again, more attention should be given to such kind of best practices, both from researchers and decision-makers, if one aims at making urban development more sustainable.
Author Contributions
Writing—original draft preparation, C.G. and S.R.; Conceptualization and methodology, C.G. and S.R.; Data curation, S.R.; Supervision, F.F.; Review edition, F.F.
Funding
This paper is part of the SUCCESS project, funded from the European Union’s H2020 research and innovation programme under grant agreement no. 633338 (www.success-urbanlogistics.eu).
Acknowledgments
The authors thank the construction companies that were part of the consortium for collecting and providing data used in this study.
Conflicts of Interest
The authors declare no conflict of interest.
References
- UN DESA. United Nations 68% of the World Population Projected to Live in Urban Areas by 2050, Says UN; United Nations Department of Economic and Social Affairs: New York, NY, USA, 2018. [Google Scholar]
- Koskela, L. Application of the New Production Philosophy to Construction; Technical Report No. 72; CIFE: Nice, France; Stanford University: Stanford, CA, USA, 1992; p. 81. [Google Scholar]
- Groves, D. The construction industry’s productivity problem. In The Economist; The Economist Group: London, UK, 2017. [Google Scholar]
- Dablanc, L. Freight Transport for Development Toolkit: Urban Freight; The World Bank: Washington, DC, USA, 2009; pp. 1–57. [Google Scholar]
- Schoemaker, J.; Allen, J.; Huschebek, M.; Monigl, J. Quantification of urban freight transport effects I. BESTUFS Consort. 2006, 76. [Google Scholar]
- Dablanc, L. City Distribution, a Key Element of the Urban Economy: Guidelines for Practitioners. In City Distribution and Urban Freight Transport; Edward Elgar Publishing: Cheltenham, UK, 2011; ISBN 978-0-85793-275-4. [Google Scholar]
- Unimore; et al. Simulation results. In SUCCESS Project; Brussels, Belgium, 2018; p. 231. [Google Scholar]
- McKinsey. Imagining Construction’s Digital Future; McKinsey: New York, NY, USA, 2016. [Google Scholar]
- Serouge, M.; Patier, D.; Routhier, J.-L.; Toilier, F. Enquête Marchandises en Ville Réalisée en Île-de-France Entre 2010 et 2013; HAL: Paris, France, 2014; p. 126. [Google Scholar]
- Taniguchi, E. City Logistics: Modelling, Planning and Evaluation; Routledge: Abingdon, UK, 2017; ISBN 978-1-317-50404-7. [Google Scholar]
- Guerlain, C.; Renault, S.; Ferrero, F. Urban Freight: What about Construction Logistics; TRA: Vienna, Austria, 2018. [Google Scholar]
- LIST; et al. Report on good practices in the EU and USA in construction logistics in urban area. In SUCCESS Project; Brussels, Belgium, 2017; p. 88. [Google Scholar]
- Unimore; et al. Mathematical programming tools for construction logistics optimisation problems. In SUCCESS Project; Brussels, Belgium, 2017. [Google Scholar]
- Guerlain, C.; Renault, S.; Ferrero, F.; Faye, S. Decision Support Systems for smarter and sustainable construction logistics. Sustainability 2019, 11, 2762. [Google Scholar] [CrossRef]
© 2019 by the authors. Licensee MDPI, Basel, Switzerland. This article is an open access article distributed under the terms and conditions of the Creative Commons Attribution (CC BY) license (http://creativecommons.org/licenses/by/4.0/).