Article

Multi-Criteria Decision-Making Approach for Selecting Wind Energy Power Plant Locations

1
King Saud University, Industrial Engineering Department, College of Engineering, Riyadh-11421, Saudi Arabia
2
King Saud University, Advanced Manufacturing Institute, Riyadh-11421, Saudi Arabia
*
Author to whom correspondence should be addressed.
Sustainability 2019, 11(21), 6112; https://doi.org/10.3390/su11216112
Submission received: 15 September 2019 / Revised: 23 October 2019 / Accepted: 28 October 2019 / Published: 2 November 2019

Abstract

:
In pursuit of green technology innovations, the energy industry is showing an interest in sustainable sources such as wind energy generation. The Saudi Arabian energy industry has a 2030 target to generate and transmit electricity to major customers nationwide and other neighboring Gulf countries. However, the selection of wind energy power plant locations is a concern because the decision process involves social, technological, economical, and environmental factors. The originality of this study lies in (1) proposing an integrated quantitative and qualitative multi-criteria decision making framework for selecting wind-energy power plant locations; (2) applying the proposed framework in the context of the energy industry in a gulf region country and investigating expert-based and entropy-based criterion weight assignments; (3) choosing five possible alternative wind energy power plant locations with 17 response criteria for each alternative to help decision makers identify the best possible alternative; and (4) establishing the superiority of one alternative over another (if it exists). The presented approach extends considerable support to the comparing and ranking of alternatives along with its validation and sensitivity analysis. Based on the proposed multi-criteria decision-making approach, an appropriate wind energy power plant location has been successfully selected among the five alternatives.

1. Introduction

Non-renewable sources of energy are being continuously depleted. Moreover, the use of fossil fuels is perilous to the environment, and their precarious nature is gradually becoming prominent [1]. In addition, the concept of a smart city is gaining popularity. By 2050, 66% of the earth’s inhabitants will reside in cities [2]. Therefore, there will be an increase in the demand for energy. Several other factors also contributed to the increase in the demand of energy, such as, increases in population [3], climate change [4], advances in technology increase the availability of products which require energy [5], increases in means of transportation (cars, aero planes, etc.) [6]. Progress in the use of renewable energy (RE) is an imperative part of realizing the sustainable and smart cities of the future [7]. Since 1997, renewable energy sources have been gaining more attention with the adoption of the Kyoto protocol [8], and the focus is now on harnessing renewable sources of energy such as solar, wind, geothermal, hydropower, and tidal [1,9]. In late 2008, European countries set up a 20-20-20 climate and energy package with three targets to achieve until 2020. The first one requires to cut the greenhouse gas emissions of European nations by 20% with 1990 as baseline year. The second target is to receive 20% of energy consumption from renewable energy sources (RES). The final target is to cut total primary energy consumption by 20% by 2020 compared to projections published in 2007 and in 2009 [10]. Among the different sources of energy, wind energy is gaining popularity because of technological developments, easy installation of wind turbines, efficiency, long life, and smaller space requirements relative to solar power harnessing [11,12]. Many studies have been conducted on installing wind energy in different terrains such as in urban environments [7,13], wind farms [14], and offshore [1,15]. However, there are several environmental issues also associated with energy such as ecological disturbance, wildlife safety, visual pollution, noise, electromagnetic interference, and local climate change [16,17,18]. Various measures have been taken by the countries to mitigate the adverse effect of different energy sources, and agreements and protocols had been instituted, such as Copenhagen Accord [19].
Recent advances in the wind energy domain are quite visible. In the last 15 years, there has been a 9% yearly increment in the installation of wind energy in Europe [20], and a similar trend can be observed worldwide. Many developed and developing countries are moving towards wind energy. For example, 40% of the domestic energy consumption in Denmark is fulfilled through wind energy, which is likely to increase by 50% until 2020 [21]. China reached a wind power generation capacity of 149 GW with the addition of 19.3 GW in 2016 [22]. These examples show conclusively that wind energy provides a sustainable alternative to fossil fuel-based energy resources, and they are paving the way for other countries to capitalize on this renewable and green energy source. Figure 1 shows the cumulative market forecast of wind energy by region (2018–2022) published by Global Wind Energy Council (GWEC) [23].
Figure 1 shows that African and Middle Eastern countries are still lagging behind in exploiting wind energy. However, initiatives, which will improve the situation, have been considered by these countries. Saudi Arabia has started efforts to launch the country’s first large-scale wind farm, which has a total output of 400 MW [24]. The demand for electrical energy in Saudi Arabia is surging at a startling rate and is anticipated to reach approximately 55 GW by 2020 [25]. Therefore, it is vital for Saudi Arabia to exploit renewable energy, especially wind energy.
Numerous studies on wind resource estimation have been reported for various places in Saudi Arabia [25,26,27]. The performance of wind turbine generators (WTG) depends on numerous factors, not only technical, but also depending on the location in which they are installed. Eltamaly and Farh [28] studied five locations across Saudi Arabia to assess the wind energy resources. Both technical and economical assessments were conducted. A computer program was developed, and based on collected data, the most suitable type of WTG was recommended for each wind farm site that will minimize the cost of energy generation. Shaahid et al. [25] presented a feasibility study to establish a wind power plant in the western part of Saudi Arabia. The study was based on economic parameters. The wind speed during the year was studied, and based on that, the cost of wind energy production was calculated. Tagle et al. [29] investigated the potential of wind energy resources in Saudi Arabia. A simulation system was used to examine the effect of the change in internal climate on the periodic wind power density.
Meteorological factors such as temperature, relative humidity, atmospheric pressure, and worldwide solar fallout are greatly reliant on site and time, while wind speed and direction are extremely varying components amid these factors. Therefore, it is essential to understand the fluctuation in wind speed and accessibility through different hours of the day and various months of the year for the efficacious and cost-effective utilization of wind energy [30]. Thus, it is necessary to thoroughly investigate the site of interest to determine the viability of wind farm development.
The site selection for wind power plants requires an exhaustive assessment of numerous factors, and tradeoffs among these factors need to be made. Many socio-economic issues are associated with finalizing a site for a wind power plant. Therefore, when dealing with various factors and their interactions to determine the best solution, multi-criteria decision making (MCDM) techniques offer an efficient solution. Compared with single criterion approaches, the benefit of MCDM is that several factors or characteristics are engaged to obtain a unified decision. Several studies have been conducted by researchers in this field. MCDM approaches have been widely used in different fields such as site selection for electrical grids for hybrid renewable energy systems [31], location selection of shopping malls [32], and for ranking sustainable sugarcane farms [33]. Wang et al. [7] presented a comprehensive literature survey about the application of multi-criteria decision analysis in the decision making process of sustainable energy development. Ioannou et al. [34] used the soil and water assessment tool (SWAT) and hydrologic simulation model for predicting the streamflow data. This data is useful for selecting the sites for hydropower projects. Ioannou et al. [35] developed a spatial decision support system for the selection of sites for biomass power plant. Decision system was based on analytic hierarchy process (AHP) combined with fuzzy logic. Six criteria were selected and the importance of each criterion was assigned based on experts’ opinion.
Noorollahi et al. [36] analyzed wind energy resources based on technical, monetary, ecological, and geographical factors. An MCDM technique with equal weights was applied, and the best locations for wind power plants were obtained. Rodman and Meentemeyer [37] applied a GIS (Geographic Information Science) model, in which vital factors were classified into three groups (physical, ecological and socio-economic), with a set of rules to investigate the appropriateness of wind-energy power plants in Northern California, US. San Cristóbal [38] presented a case study in Spain in which a compromise technique known as the VIKOR method was applied as an MCDM for selecting the renewable energy project launched by the Spanish government. The weight was selected through an analytical hierarchy process, and a biomass project followed by wind power plants emerged as the most suitable option. The adopted MCDM technique uses the outranking principle to rank the options, integrated with ease of use and reduced intricacy. The method conducts a pair-wise comparison of options to rank them according to various criteria. The technique has been applied in geothermal projects [39,40,41] and for hydroelectrical power plant site selection [42]. Kyriakopoulos et al. [43] applied hierarchical cluster analysis to develop two typologies for regions in Greece based on energy consumption characteristics such as domestic, industrial etc. energy consumption, number of renewable energy sources installed. Cluster analysis was applied twice, firstly using electrical consumption variables only, and then using variables of electricity consumption, number and installed power of RES plants. Based on developed methodology and characteristics, the regions were classified into four clusters. Alkaradaghi et al. [44] proposed a model for landfill site selection that was based on GIS data, and the MCDM method integrated with a weighted linear combination (WLC) was used for decision making. Thirteen scientific and environmental criteria were chosen and based on these criteria, seven sites were recommended as suitable for landfill sites. Gavériaux et al. [45] used the multi-criteria decision analysis and GIS based methodology to predict the most appropriate area for offshore wind turbine farm. In the phase of analysis, inappropriate areas were identified, then the appropriate ones were ranked, and finally a cost analysis was done. The case study was for Hong Kong bay. Several zones were identified for the offshore wind power plant based on the developed methodology. Erdin and Ozkaya [46] used elimination and choice translating reality (ELECTRE), an MCDM approach, to select a site for any type of renewable energy, such as solar, wind, biomass, and hydroelectricity, in Turkey. The objective was to show the energy firms the potential of the different regions in Turkey as renewable energy sources. Seven regions were selected, and based on experts’ scores, weights were calculated for different types of renewable energy sources. Based on their approach, the Mediterranean region was selected as the most suitable for renewable energy sources. Konstantinos et al. [47] developed a methodology for selecting wind farm location using the AHP, and the Technique for Order Preference by Similarity to Ideal Solution (TOPSIS), combined with GIS. The region under study was Eastern Macedonia and Thrace in Greece. Seven qualitative criteria (Wind speed, slope, elevation/height, distance from cities, distance from coastline, etc.), and three qualitative criteria were selected. Wind Speed came out to be the most important criteria. Based on a decision support method, 34 locations were allocated that were further refined to 17 and ranked by TOPSIS.
Therefore, according to the literature, it can be said that the decision-making process for selecting locations for wind power plants is very complex. The selection has to take into consideration numerous contrary objectives due to the existence of multifaceted social, technological, economical, and ecological aspects. Conventional single-criterion decision-making techniques are no longer able to handle these issues.
The objective of this study is to propose an integrated quantitative and qualitative MCDM framework for selecting wind-energy power plant locations, and the proposed framework takes into consideration the strategies of the energy sector in the gulf region. In this study, five possible wind-energy power plant locations were chosen with 17 response criteria for each alternative to assist decision makers in identifying the best possible alternative. In addition, this study will assist in establishing the superiority of one alternative over another. The 17 criteria were selected after discussion with experts and from literature [47,48,49]. One researcher focused on a certain criterion and the other focused on another. For example, Al-Awami et al. [50] considered economic and environmental impact; Strazzera et al. [51] focused on social acceptability; Heydarian-Forushani et al. [52] concentrated on power demand; Alsyouf [53] discussed about the natural/unnatural events that affects the operation if wind energy plants, and so on. However, none of the previous research used as many criteria as the authors have considered in this research work.
This paper is organized in five sections: Section 1 is an introduction; Section 2 presents the problem and visual preference ranking organization method for enrichment of evaluations (PROMETHEE) approach for selecting wind power plant locations; Section 3 compares and rank orders the alternatives; subsequently, Section 4 presents a sensitivity analysis with subjective and objective criteria weights; and finally, Section 5 concludes the research findings.

2. Selection of Wind Power Plant Locations: the MCDM Approach

In pursuit of green technology innovations, the energy industry in the gulf shows an interest in sustainable wind energy generation. The industry has a 2030 target to generate and transmit electricity to major customers in Saudi Arabia and other Gulf countries. It needs to be concerned with multiple factors, for example, gulf energy generation policies, public awareness, industrial base, and possibility of risk and future uncertainty. An alternative power plant location and adopted technology for wind power plant has its own risks in terms of security and safety, and there is also uncertainty due to natural or unnatural future events. Government policies, development and incentive schemes should support and encourage significant investment in renewable energy sector. Given the continuously increasing consumption of electricity in the gulf region, the industry decided to build a renewable wind power plant. Five site locations have been proposed by the management, who are interested in the careful selection and evaluation of alternative wind power plant site locations. A systematic multi-criteria analysis approach is adopted to identify the competitiveness of each alternative. The multiple criteria chosen to evaluate the wind power plant sites are availability and speed of the wind; advantages and disadvantages of the site; risk and uncertainty of the technology used; expected energy demand; and government policies and support (see Figure 2).
The most commonly used MCDM approaches include the AHP, ELECTRE, and the PROMETHEE [54]. Compared with AHP and ELECTRE, PROMETHEE has the ability to incorporate decision-making using positive and negative preference flows. Concepts such as preference flow, weights, geometrical analysis for interactive aid (GAIA) planes, as well as sensitivity analyses, make the PROMETHEE approach attractive in the assessment of alternatives. Partial and complete rankings also help identify the most preferred alternative. However, decision makers are often interested not only in ranking alternatives but also in establishing the superiority of one alternative over another (if it exists). The adopted MCDM methodology for an efficient selection of wind power plant location (WPPL) is explained in detail below.
Step 1:Construction of decision matrix: Suppose there are m alternative WPPLs and n evaluation criteria in ranking these WPPLs; Xij is the jth criterion’s value for the ith WPPL. The structure of the decision matrix is as presented in Table 1 below.
Step 2:Estimation of Criterion Weight: The estimation of weights is either subjective or objective. In the adopted approach, variations in criteria weights are used to evaluate the deviation in the ranking of alternative WPPLs. Wj is the weight associated with the jth criterion. The adopted approach considers both types of weights. The objective weight method makes use of mathematical models such as the entropy analysis [55]; one can quantify the amount of uncertainty using the entropy analysis; details of this method are explained below.
To eliminate the influence of criteria units or scale of measurements, it is necessary to standardize the criteria using equations of relative optimum membership degree. The decision matrix values of the jth criterion in the ith WPPL can be standardized using Equation (1).
S i j = [ X i j min j X i j max j X i j min j X i j ] ,
where Sij is the standardized criterion value for the jth criterion of the ith WPPL; Xij is the jth criterion’s value for the ith WPPL; and (i = 1, …, m) and (j = 1, …, n); refer to Table 1.
After standardization of all evaluation criteria, the decision matrix is expressed as:
S i j = [ S 11 S 12 S 1 n : : : : : : : : S m 1 S m 2 S m n ]
According to the definition of entropy, Ej is the entropy (for the objective weight) of the jth criterion and is determined by Equation (3).
E j = i = 1 m [ S i j ln ( S i j ) ] ln ( m )
Subsequently, based on Ej of the jth criterion, Wj, the criterion objective weight, is determined by using Equation (4).
W j = 1 E j [ 1 j = 1 n E j ]
The entropy weight represents useful information of the evaluation criterion. Therefore, the higher the entropy weight of the evaluation criterion, the more important the criterion. The reverse is also true.
Step 3:Estimation of outranking flows: A generalized preference function Pj(a, b) is initially constructed and assigns Pj(a, b) to each criterion j. Each Pj(a, b) has a value between 0 and 1. The outcome implies the following (where (a, b) is a pair of alternatives, and j is the criterion; refer to Table 1):
For criterion j (j ϵ 1,…,n) any one of the following preferences occurs if the a alternative is compared with b: if Pj(a, b) = 0, then there is no preference for alternative a over b; or if Pj(a, b) ≈ 0, then a weak preference exists for alternative a over b; or if Pj(a, b) ≈ 1, a strong preference exists for alternative a over b; or if Pj(a, b) = 1, a strict preference exists for alternative a over b for criterion j.
Subsequently, using the preference function, the preference index Π(a, b) which has a value in the interval between 0 and 1, is computed for each pair of alternatives using Equation (5).
Π ( a ,   b )   =   [   j = 1 n W j P ( a ,   b ) j ]   ÷   [   j = 1 n W j ]
In Equation (5), Wj is the weight associated with each criterion, and the preference index Π(a, b) expresses the preference for alternative a over alternative b, considering all k criteria (j ϵ 1,…, k). If Π(a,b) = 0, then there is a zero preference for alternative a over b; or if Π(a, b) ≈ 0, then a low preference exists for a over b; or if Π(a, b) ≈ 1, then a high preference exists for alternative a over b, or if Π(a, b) = 1, then a perfect preference exists for a over b.
Finally, using the preference index, outranking flows Φa+ and Φa are quantified using Equations (6) and (7), respectively, where m is number of alternatives (i ϵ m), excluding a.
Φ a + = 1 m 1 i = 1 m Π ( a ,   i )       ( i a )
    Φ a = 1 m 1 i = 1 m Π ( i , a )       ( a i )      
Step 4:Determination of net outranking flow and complete ranking: To obtain the dominance of each alternative over the others, the above estimated outranking flows Φa+ and Φa for each alternative are used. Outranking flow Φa+ quantifies to what extent alternative a dominates over the other alternatives, while Φa quantifies to what extent alternative a is dominated by the other alternatives. Outranking relations are deduced by knowing the outranking flow for any two alternatives.
Based on the outranking relations between any two alternatives, a partial ranking is computed as follows: If {[(Φa+ > Φb+) and (Φa− < Φb−)] or (Φa+ ≥ Φb+) or (Φa− ≤ Φb−)}, then alternative a is preferred over b; or if {(Φa+ = Φb+)} and/or {(Φa = Φb)}, then alternative a has a preference over b; otherwise, the information is inconsistent, and then alternative a is incompatible with b. Net outranking flow Φ for alternative a is obtained using Φa = Φa+ – Φa; while the net outranking flow Φ for alternative b is obtained using Φb = Φb+ – Φb. A complete ranking is subsequently obtained as follows: If Φa > Φb, then alternative a has a complete preference over alternative b; if Φa = Φb, then alternative a has a complete indifference over alternative b.

3. Application of the MCDM Approach

The stepwise application of the above presented approach is as follows.
Step 1:Construction of decision matrix: This step is used to designate possible alternative wind power plant locations to evaluate. The MCDM approach compares various activities that are assessed on numerous criteria. A menu-driven online expert survey is used to obtain the relevant data for each alternative. There are 17 criteria to evaluate each WPPL; scales of measurement, weights, and preference functions are associated with these criteria; initially, equal weights are set for these criteria (see Table 2).
From Table 2, it is evident that the wind power plant location (WPPL) alternative WPPL1 has an average wind speed and availability of 4 m/s and 500 W/m2, respectively. The choice of alternative WPPL1 has high concern with respect to environmental impact. According to the judgement of experts, WPPL1 has highly supportive government policies and local community for the project endeavor along with an elevated demand for power. Similarly, geo-experts found the topography of the WPPL1 location to be good and suitable for the wind energy power plant installation. The same location is found to have a very low security and safety threat as well as availability of alternative power at a distance of 9.5 km at a moderate cost.
Step 2:Estimation of criterion weight: The adopted approach accommodates multiple qualitative and quantitative criteria, and the choice of preference function depends on the type of criterion and the deviation in criteria values. The set of weights and preference functions are presented in Table 3. Set 1 represents an equal weight allocation for all response/criteria measures. Set 2 represents technical experts who have knowledge about the working of wind turbines; the variation in the expert scale is due to subjectivity. Finally, Set 3 is an objective weighting, which eliminates the manmade disturbances and ensures that the results are in a better accordance with the facts. Thus, V-shaped and L-shaped preference functions are chosen for quantitative and qualitative criteria, respectively [56]. A V-shaped preference function is preferred when there is a need to accommodate a small deviation in criteria values, whereas for moderate deviations in criteria values, an L-shaped preference function is desired.
Step 3:Estimation of outranking flows: As presented in the previous section, a number of experts were surveyed, and their opinions are taken as different scenarios for ranking and evaluation purposes. As large mathematical computations are needed, the adoption of the VISUAL PROMETHEE software is preferred.
There are two PROMETHEE rankings: PROMETHEE I and PROMETHEE II. In PROMETHEE I two preference flows (Φ+ and Φ) are used, and it is a partial ranking method that allows for an incomparability between WPPL alternatives when both (Φ+ and Φ) preference flows produce conflicting rankings. In PROMETHEE II, a net preference flow (Φ) is used, and it is a complete ranking method.
From Table 2 it is evident that no alternative with or without mixing was found to be best, satisfying all criteria. Using PROMETHEE, the outranking flows were obtained for each alternative, as presented in Table 4.
Step 4: Determination of net outranking flow and complete ranking: Using the above estimated outranking flows, the partial and complete ranking and network and GAIA plane values are obtained and presented in Figure 3, Figure 4, Figure 5 and Figure 6.
In Figure 3, the left-hand column corresponds to the outranking flow Φ+ and the right-hand column to the outranking flow Φ for each alternative. Outranking flows are oriented such that the best ones are increasing from left to right. The middle column corresponds to net flow. For each alternative, a representative line is drawn from its Φ+ to the corresponding Φ score. For any given two alternatives, if the representative lines are parallel, the alternative represented by the top line is preferred. In contrast, if the two lines intersect, the corresponding alternatives are incomparable. In Figure 3, for the outranking flow Φ+, alternative WPPL3 dominates all other alternatives, and WPPL4 highly underperforms compared with all other possible alternatives. However, for outranking flow Φ, alternative WPPL4 dominates all other alternatives, and WPPL1 highly underperforms compared with all other possible alternatives. Generally, these two outranking flows induce two different rankings. To circumvent this scenario, a complete ranking based on net flow Φ was obtained and is shown in Figure 4, in which the top half corresponds to Φ+ and the bottom half to Φ− scores for each alternative.
From Figure 4 it is evident that WPPL3 supersedes all alternatives. Simultaneously, using the outcome of the PROMETHEE approach, a network was drawn (refer to Figure 5) in which each alternative is represented by a “node” and its preference over other alternatives by an “arrow”. Figure 5 also shows alternative WPPL3 to be highly preferred over all other alternatives, and WPPL4 is once again the least preferred.
Interestingly, alternative WPPL1 is preferred over WPPL2 and WPPL5. Subsequently, to identify conflicts between criteria and to highlight groups of alternatives performing well for a given criterion, Visual PROMETHEE represents the above results in the GAIA plane (refer to Figure 6).
In the GAIA plane in Figure 6, which is widely considered the best two-dimensional representation of any multi-criteria problem, alternatives are represented in the quadrants; alternatives that are similar to each other in performance appear in same quadrant or close to each other, while those that differ are placed in opposite quadrants from each other and away from each other. The response measures showing similar preferences are oriented in same direction in the GAIA plane, while conflicting response measures are pointed in opposite directions. From Figure 6, it is apparent that the WPPL5 score is opposite to WPPL3. WPPL4 scores better for criteria C01, C02, C17, and C12. Furthermore, from the same GAIA results, one can observe that WPPL1 performs well on only two criteria, C10 and C06. Similarly, for the same criteria, WPPL2 scores better but is far away from WPPL4.
The above analysis was conducted by assigning equal weights (refer to Set 1 in Table 3) to each response measure. As decision-makers may not typically have any predetermined weights in mind, a sensitivity analysis is needed. In the present study, a special feature of the Visual PROMETHEE software, known as walking weights, was adopted for this purpose. The details of the sensitivity analysis and results are presented in the following section.

4. Sensitivity Analysis

A sensitivity analysis is conducted to understand the effect of input parameter deviations on the outcome parameters of any model. In the present study, variations in criteria weights are used to evaluate deviations in the ranking of alternative wind energy power plant locations. The aim is to validate the inference by conducting a sensitivity analysis which helps to establish the robustness in the decision to finalize the wind energy power plant locations. Three sets (equal weights, expert subjective scaling, and objective weights) of criteria weights (refer to Table 3) are chosen for the sensitivity analysis. The sensitivity analysis was conducted by assigning response criteria weights as listed in Table 3. Set 1 represents an equal weight allocation for all response measures.
Technical experts who have knowledge about the working of wind turbines gave high weights (90%) to wind speed (C01), wind density (C02), surrounding environment (C03), and power loss (C14) compared with other criteria. In contrast, these experts gave the least weight to technology cost (C08), supply cost (C15), and environment concerns (C17). The other group of experts, who are more concerned with government development policies, supported the technical experts on C01 and C02 and added power demand (C05), minimum technology cost (C08), and supply cost (C15) to the maximum weights. In addition, they suggested that moderate weights be given to both development schemes (C16) and environment concerns (C17). The variation in the expert scales is due to subjectivity.
In any outranking multi-criteria decision analysis, decision makers have to use weights to express the importance of criteria and sub-criteria. For example, a set of feasible weights and threshold values are defined with known subjective preference judgments among the alternatives. Numerous methods are available in the literature, and most of them are classified into two groups: subjective and objective weights. Subjective weights are set based on the decision maker’s experiences, knowledge expertise, and judgment and perception of the problem; for example. Delphi methods [57] and AHP [58]. However, objective weighting eliminates the manmade disturbances and produces results that are more in accord with the facts. The objective weights method makes use of mathematical models, such as entropy analysis [55]. Accordingly, this sensitivity analysis was done by relying on the expert-assigned weights (refer to Set 2 in Table 3) using Visual PROMETHEE. The outcomes of the sensitivity analysis are presented in Figure 7a–d.
Similarly, Figure 8a–d represent the analysis corresponding to partial ranking, complete ranking, network diagram, and GAIA plane for the entropy weights application. In the case of the entropy weights application (refer to Set 3 in Table 3), relatively higher weights are assigned to the natural/unnatural events and customer acceptability, and relatively lower weights are assigned to proximity to power supply and environmental issues.
From the results of the sensitivity analysis, it is evident that wind energy power plant locations WPPL4 and WPPL5 are the worst choices compared with the other alternatives, while WPPL3 is the best overall choice (Table 5).

5. Discussion and Conclusions

Non-renewable energies are continuously being depleted, while the global demand for energy is sharply increasing. Greenhouse effects are gaining more attention, so global energy planners are focusing more on solar, wind, geothermal, hydropower, and tidal energies as renewable energy sources. It is evident that changing from one energy system to another or adopting any new energy system has risk and uncertainty, and one has to evaluate multiple alternatives based on numerous performance parameters. In this study, a framework is suggested through which energy planners can evaluate and select the locations for wind energy power plants with an objective of satisfying the regional competitive energy requirements.
Decision managers had the following major criteria: wind power density and speed, power plant location advantages and disadvantages; technology used, risk and uncertainty, expected energy demand, and government policies as well as government support. Using an interactive tool, wind energy power plant alternative locations and other details were obtained. It is evident that there are numerous contrary objectives due to the multifaceted social, technical, economic, and ecological aspects that exist. As conventional single-criterion decision-making techniques are no longer able to handle this complex task, an efficient MCDM technique is provided to the management to help them choose a site for a wind energy power plant in Saudi Arabia. Furthermore, variations in criteria weights are used to evaluate the sensitivity and the deviation in the rankings of five alternative wind energy power plant locations.
Based on this study, the following conclusions can be drawn:
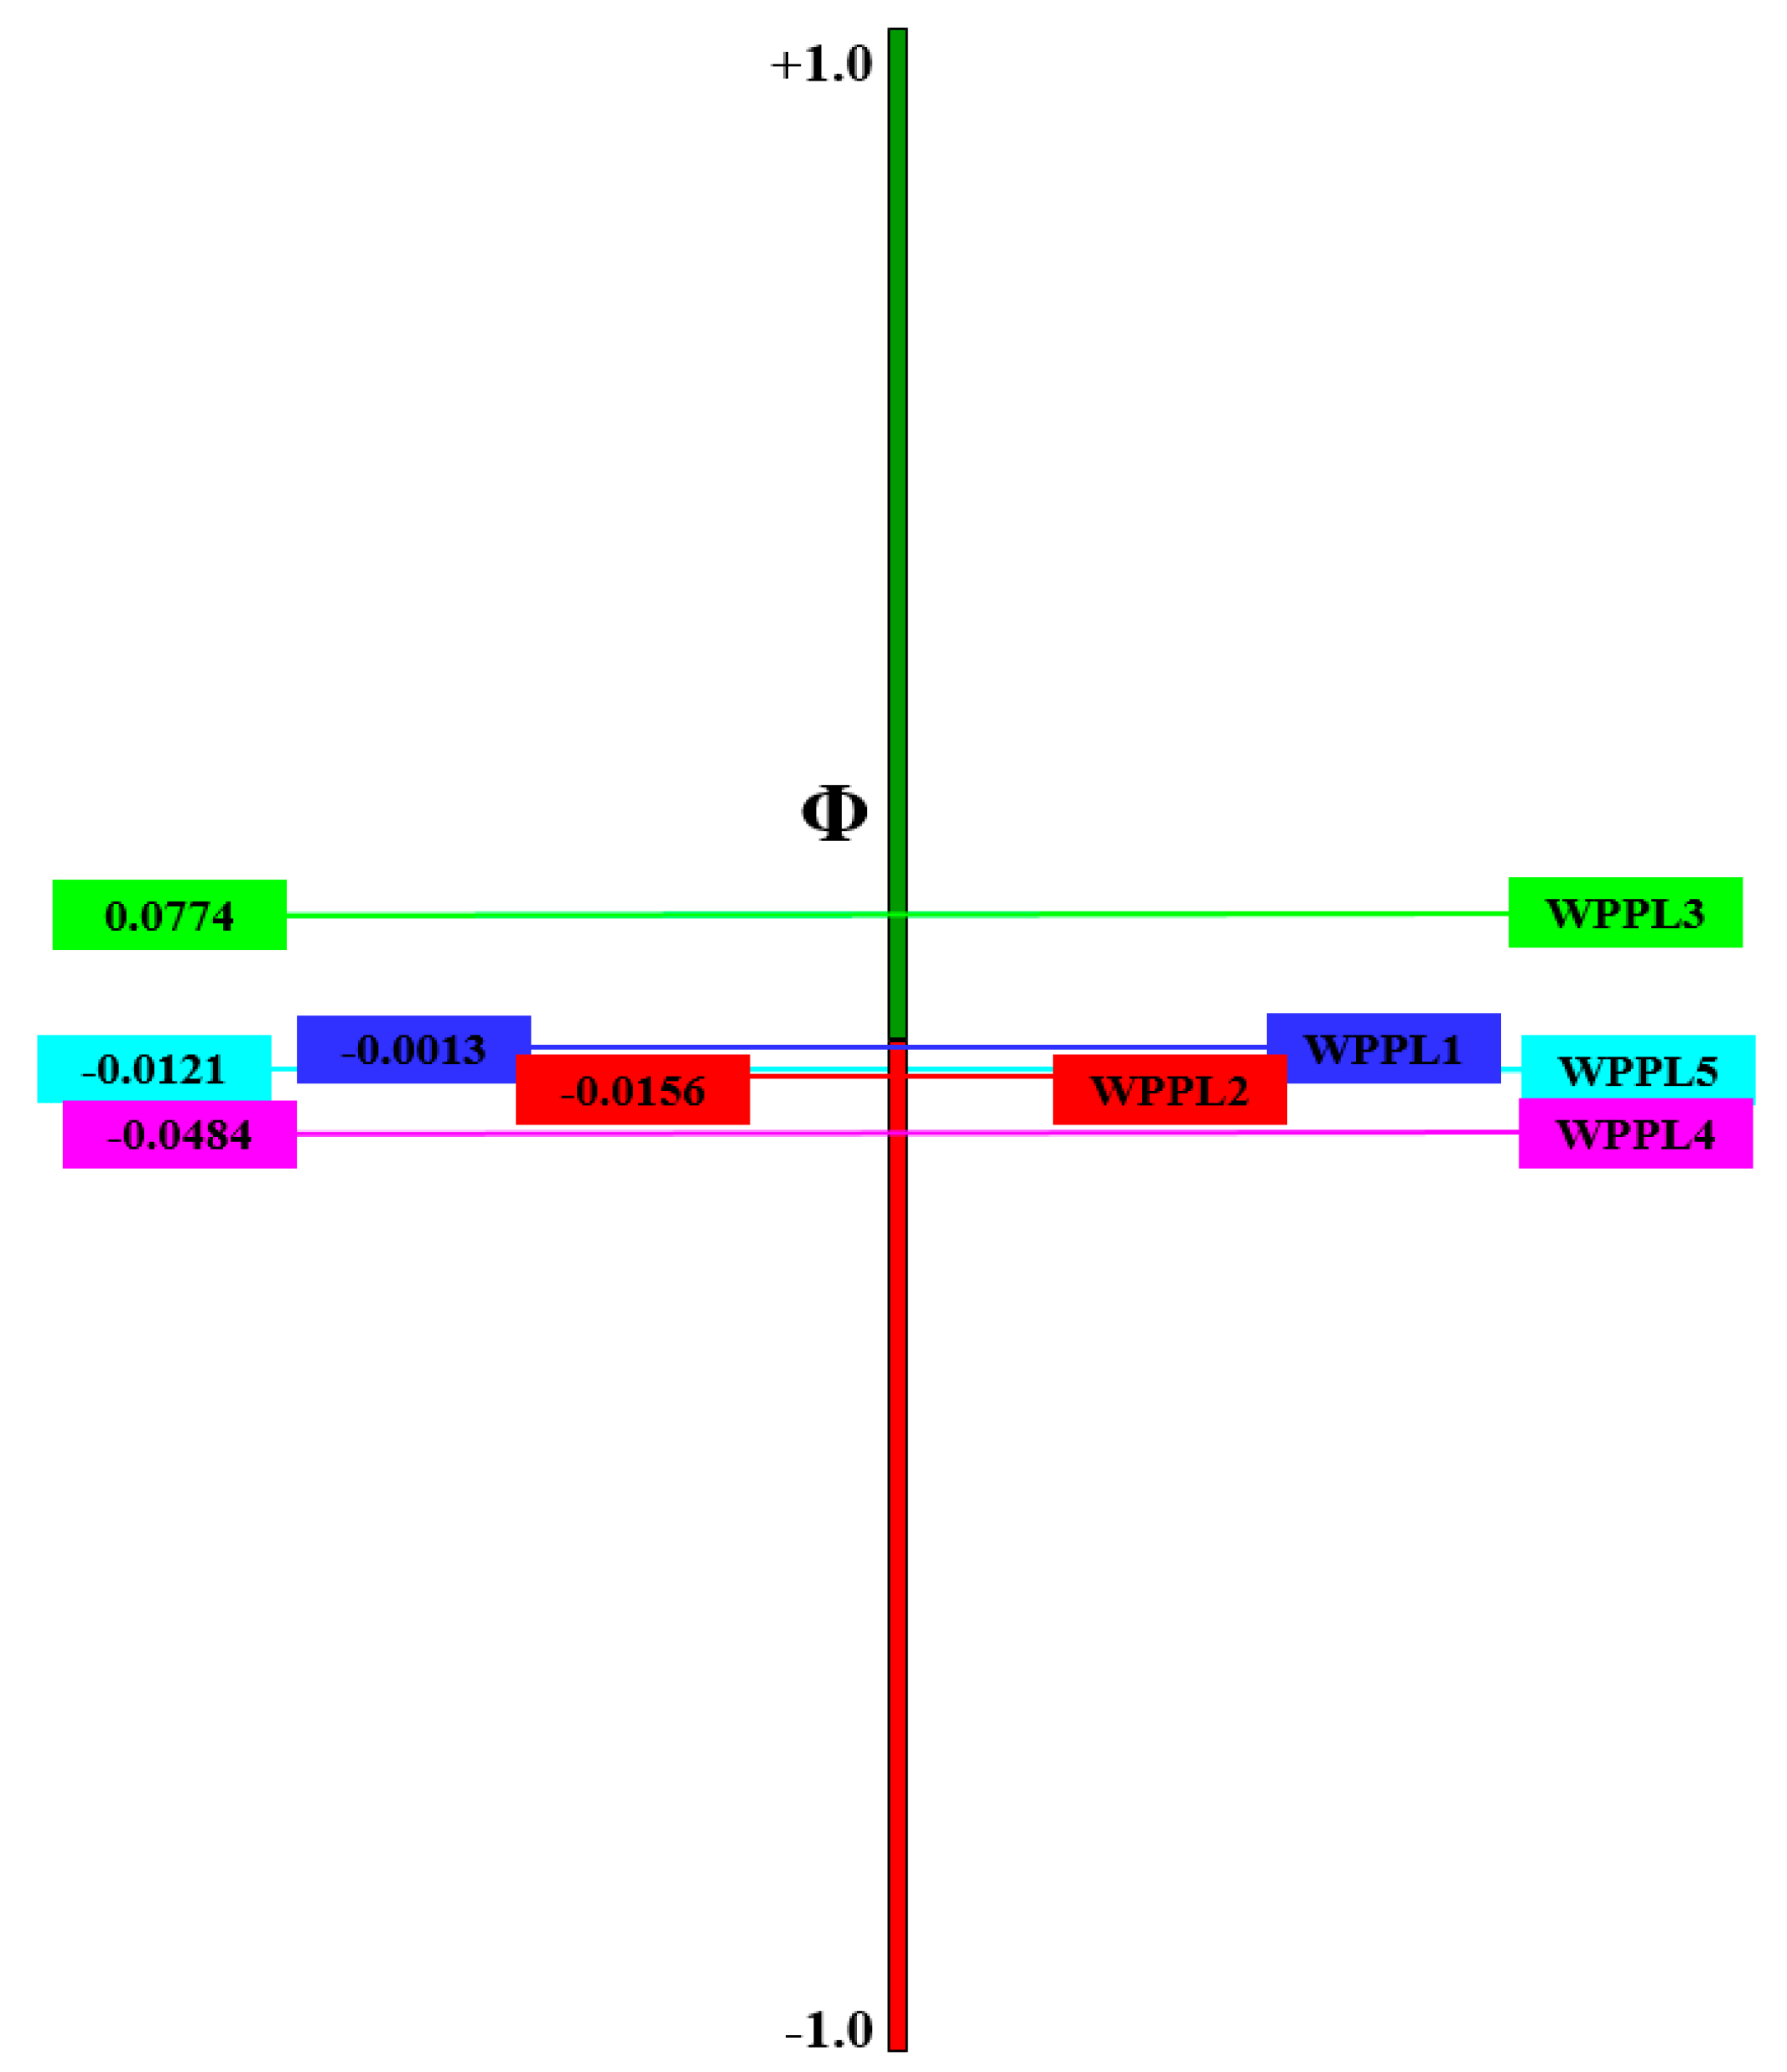
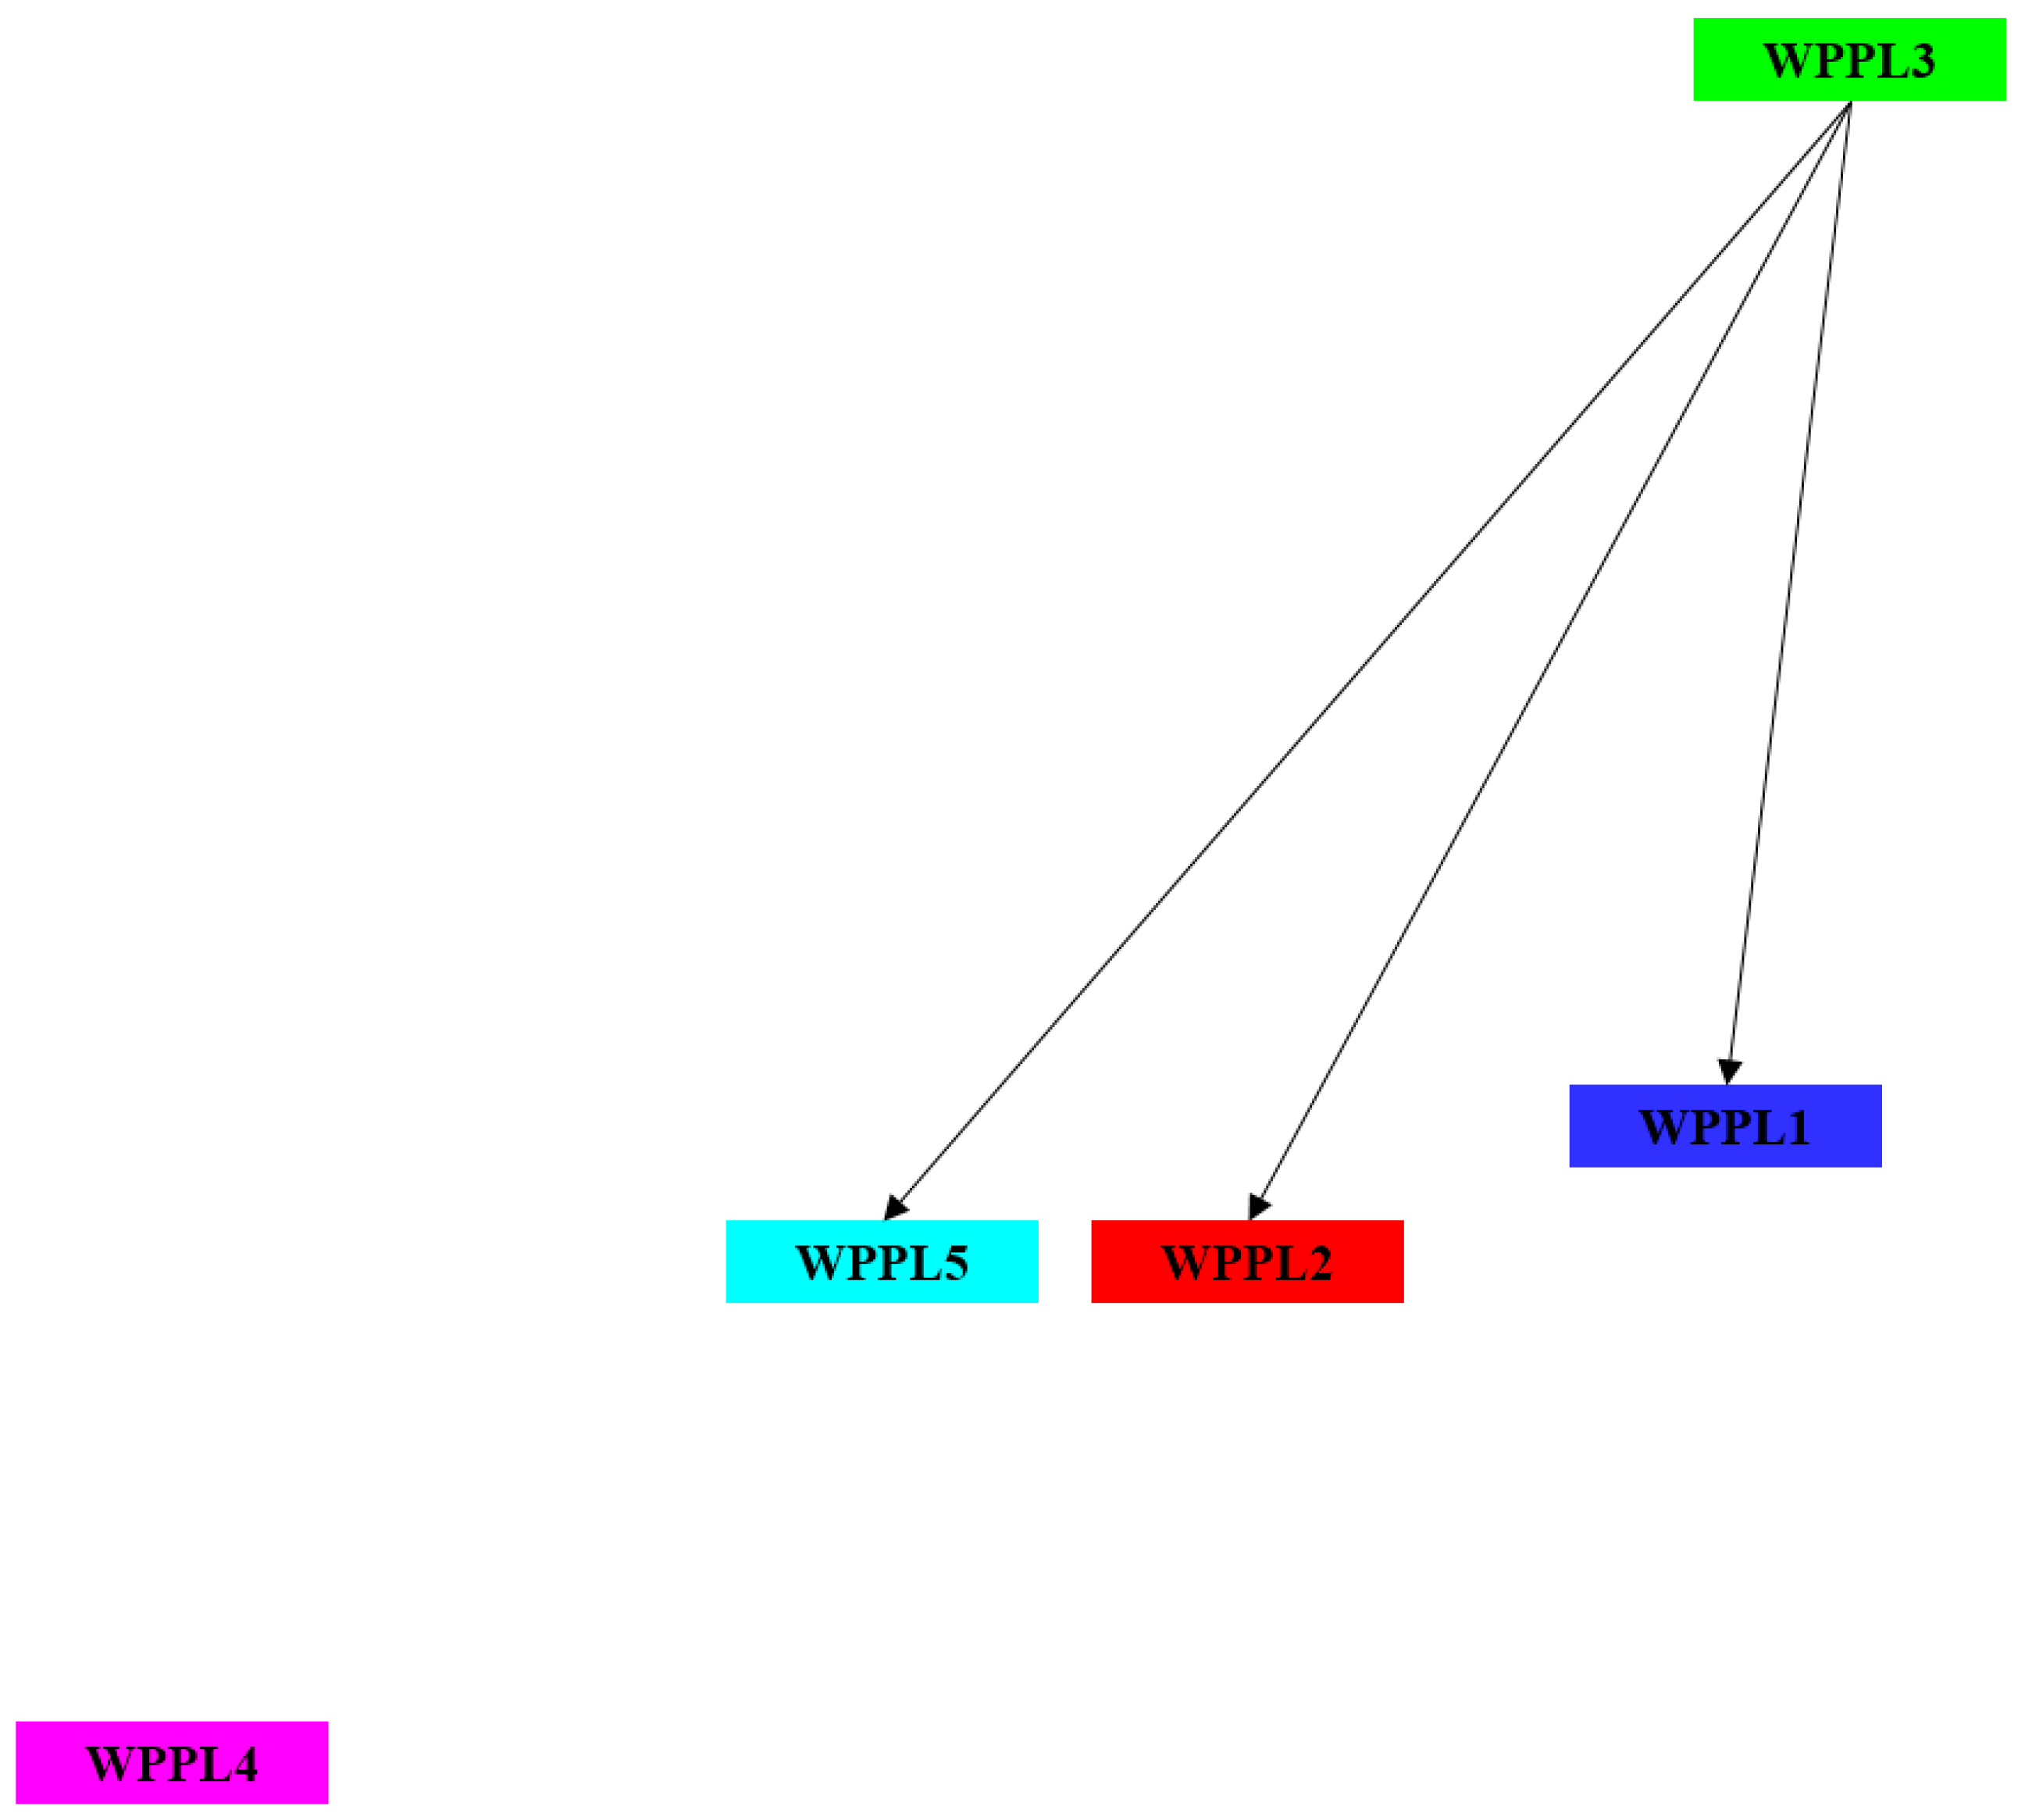
  • If the management wants to set equal criteria weights, WPPL3 is the best choice, and WPPL4 and WPPL5 are the worst choices.
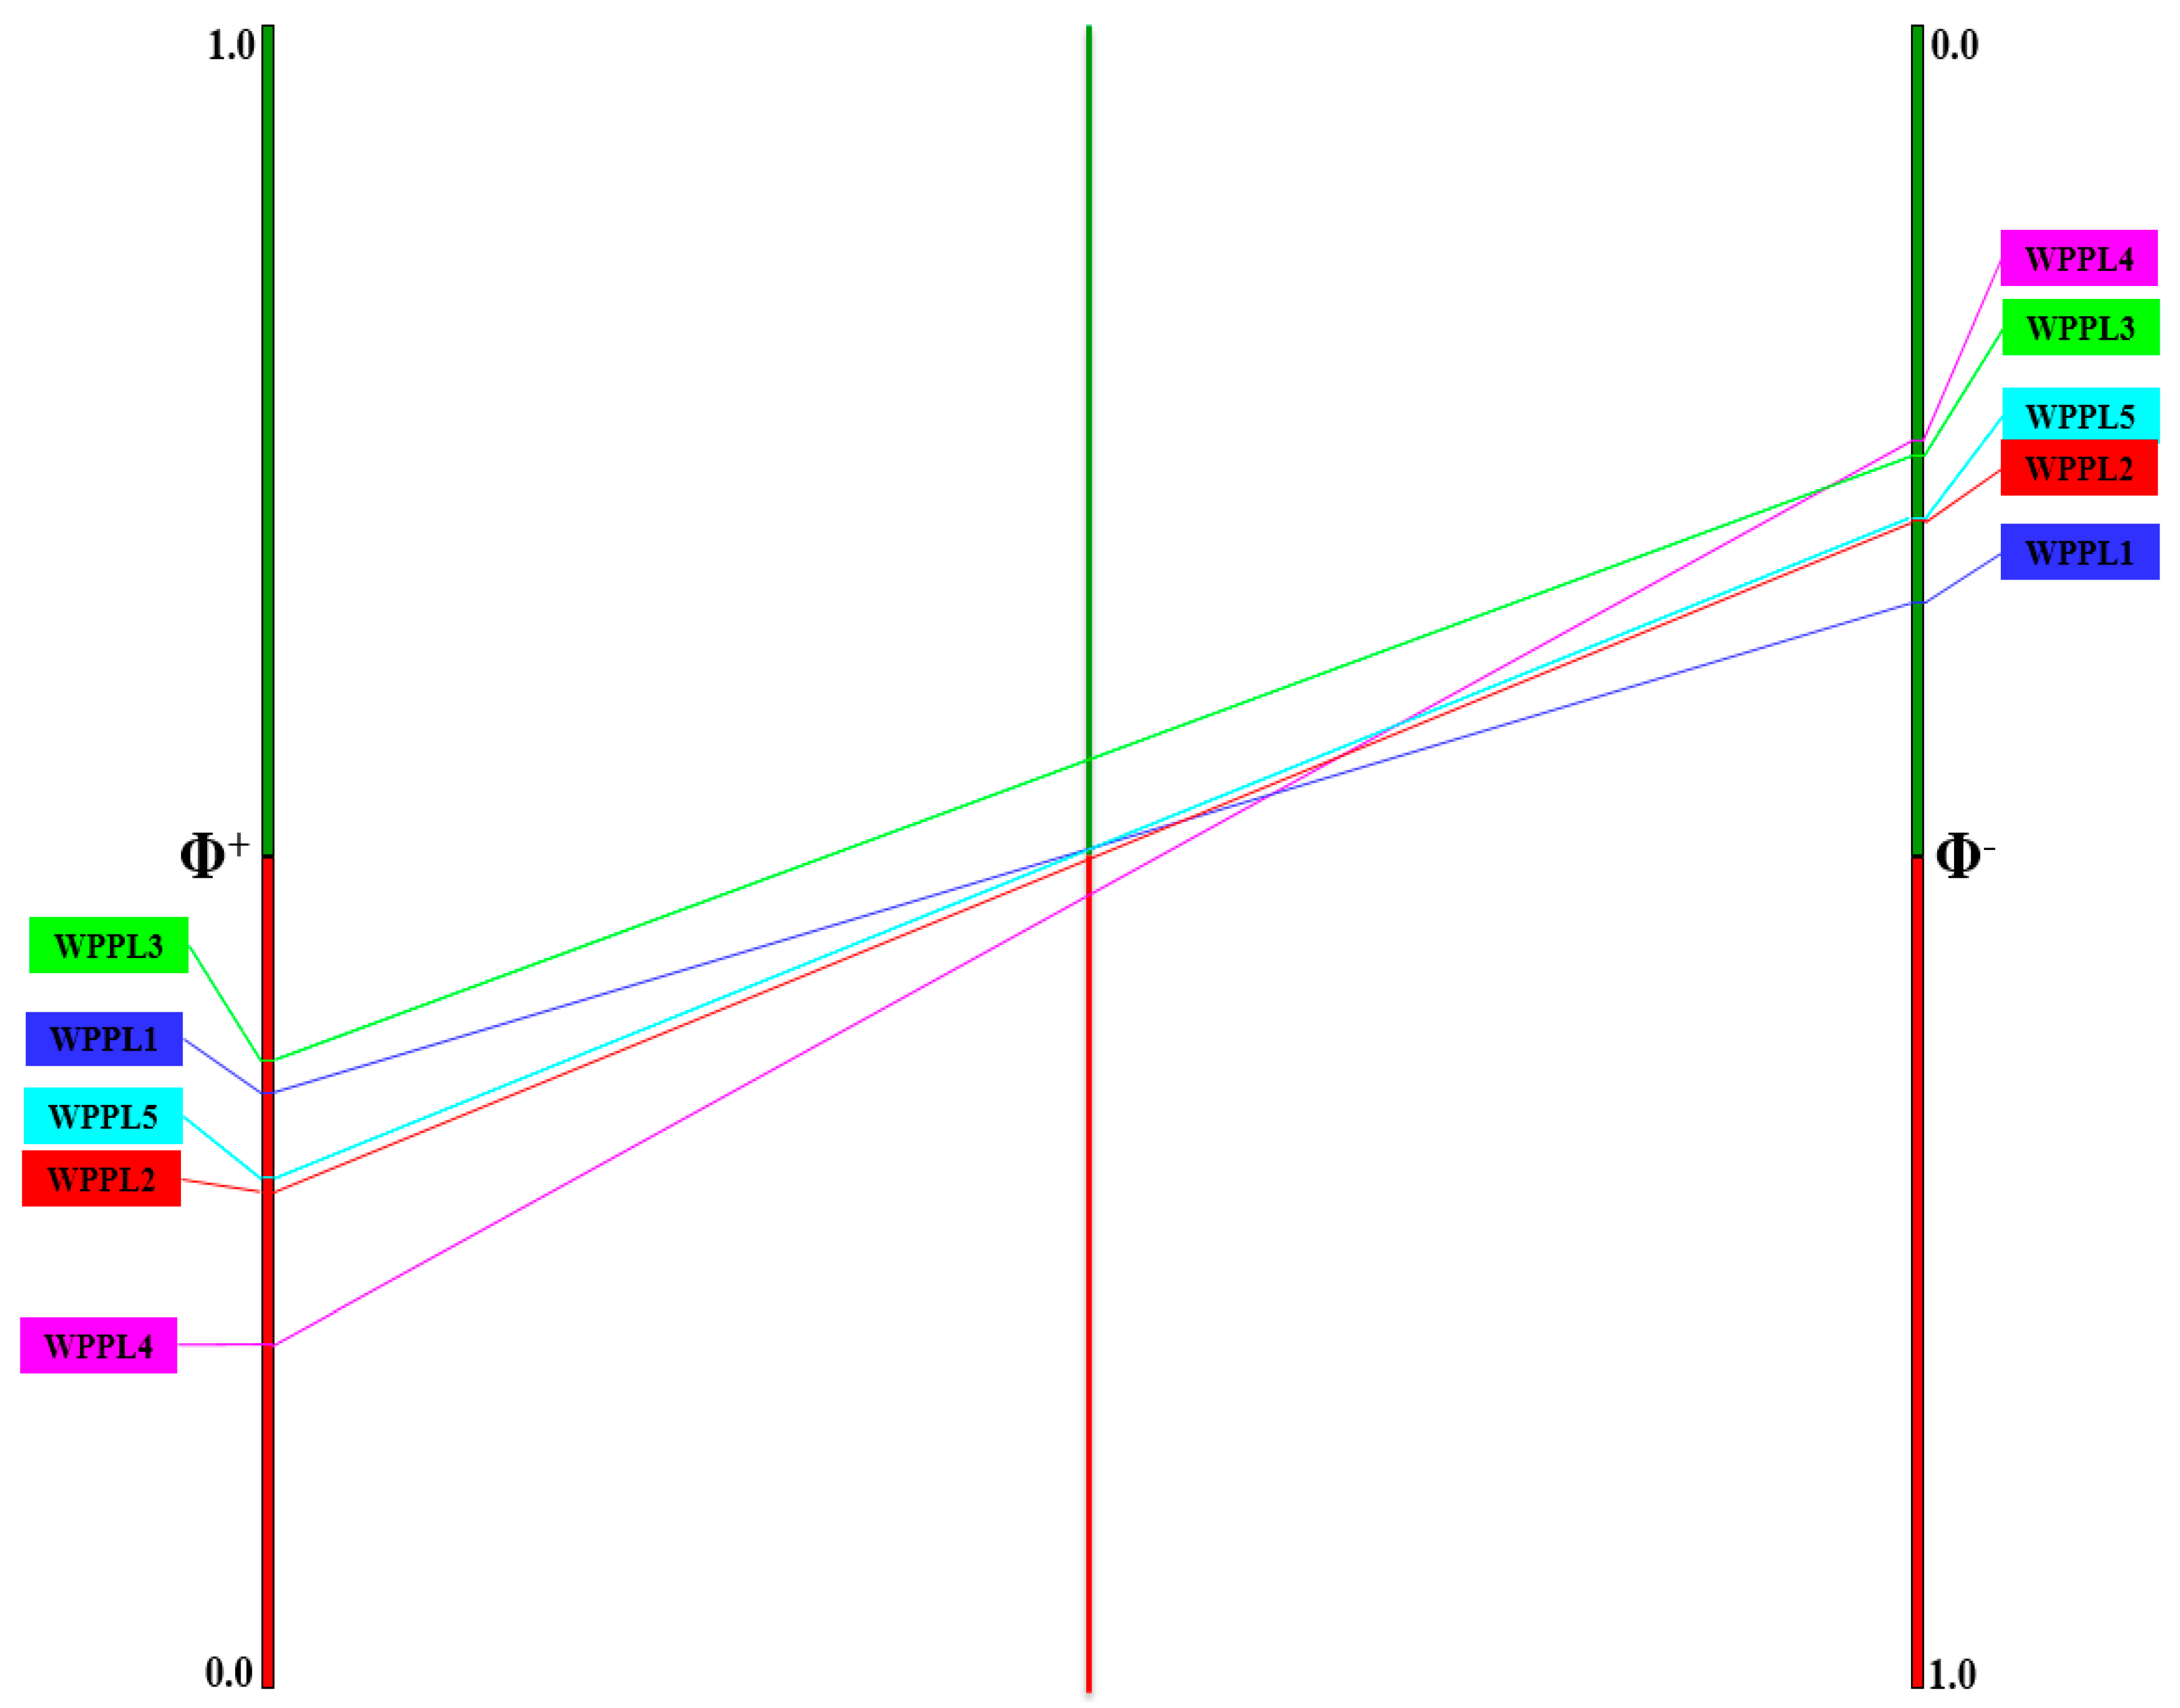
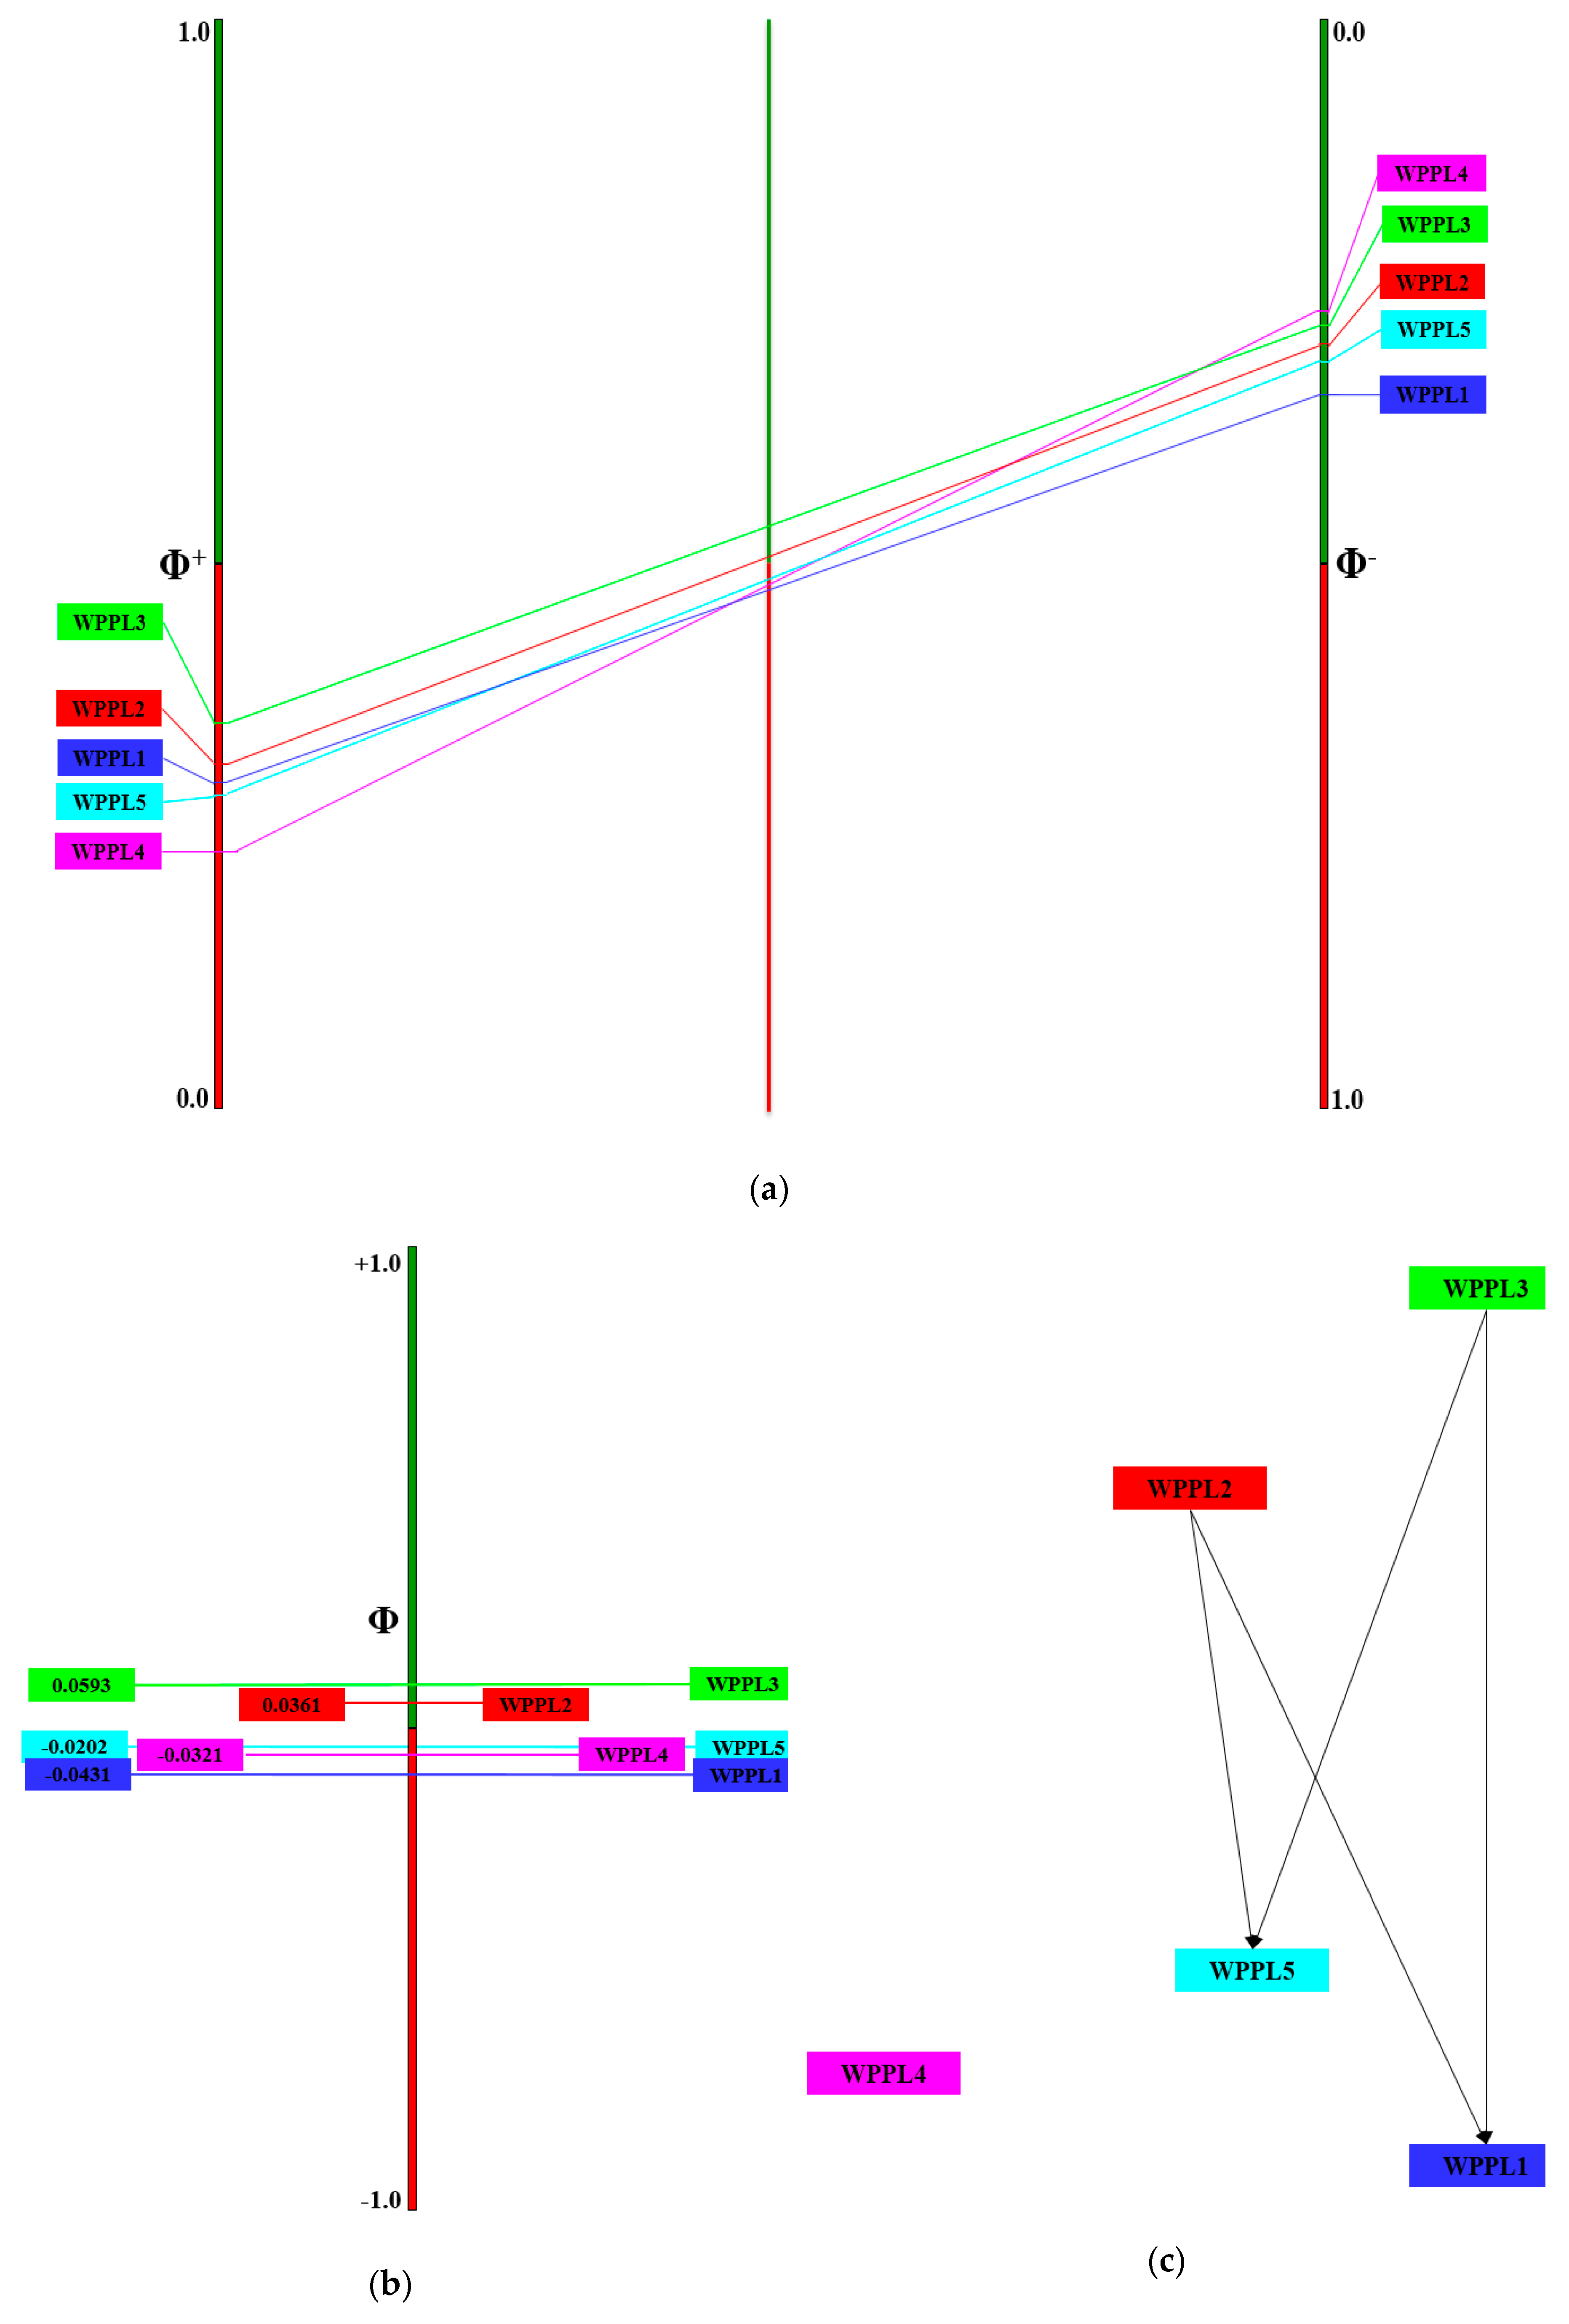
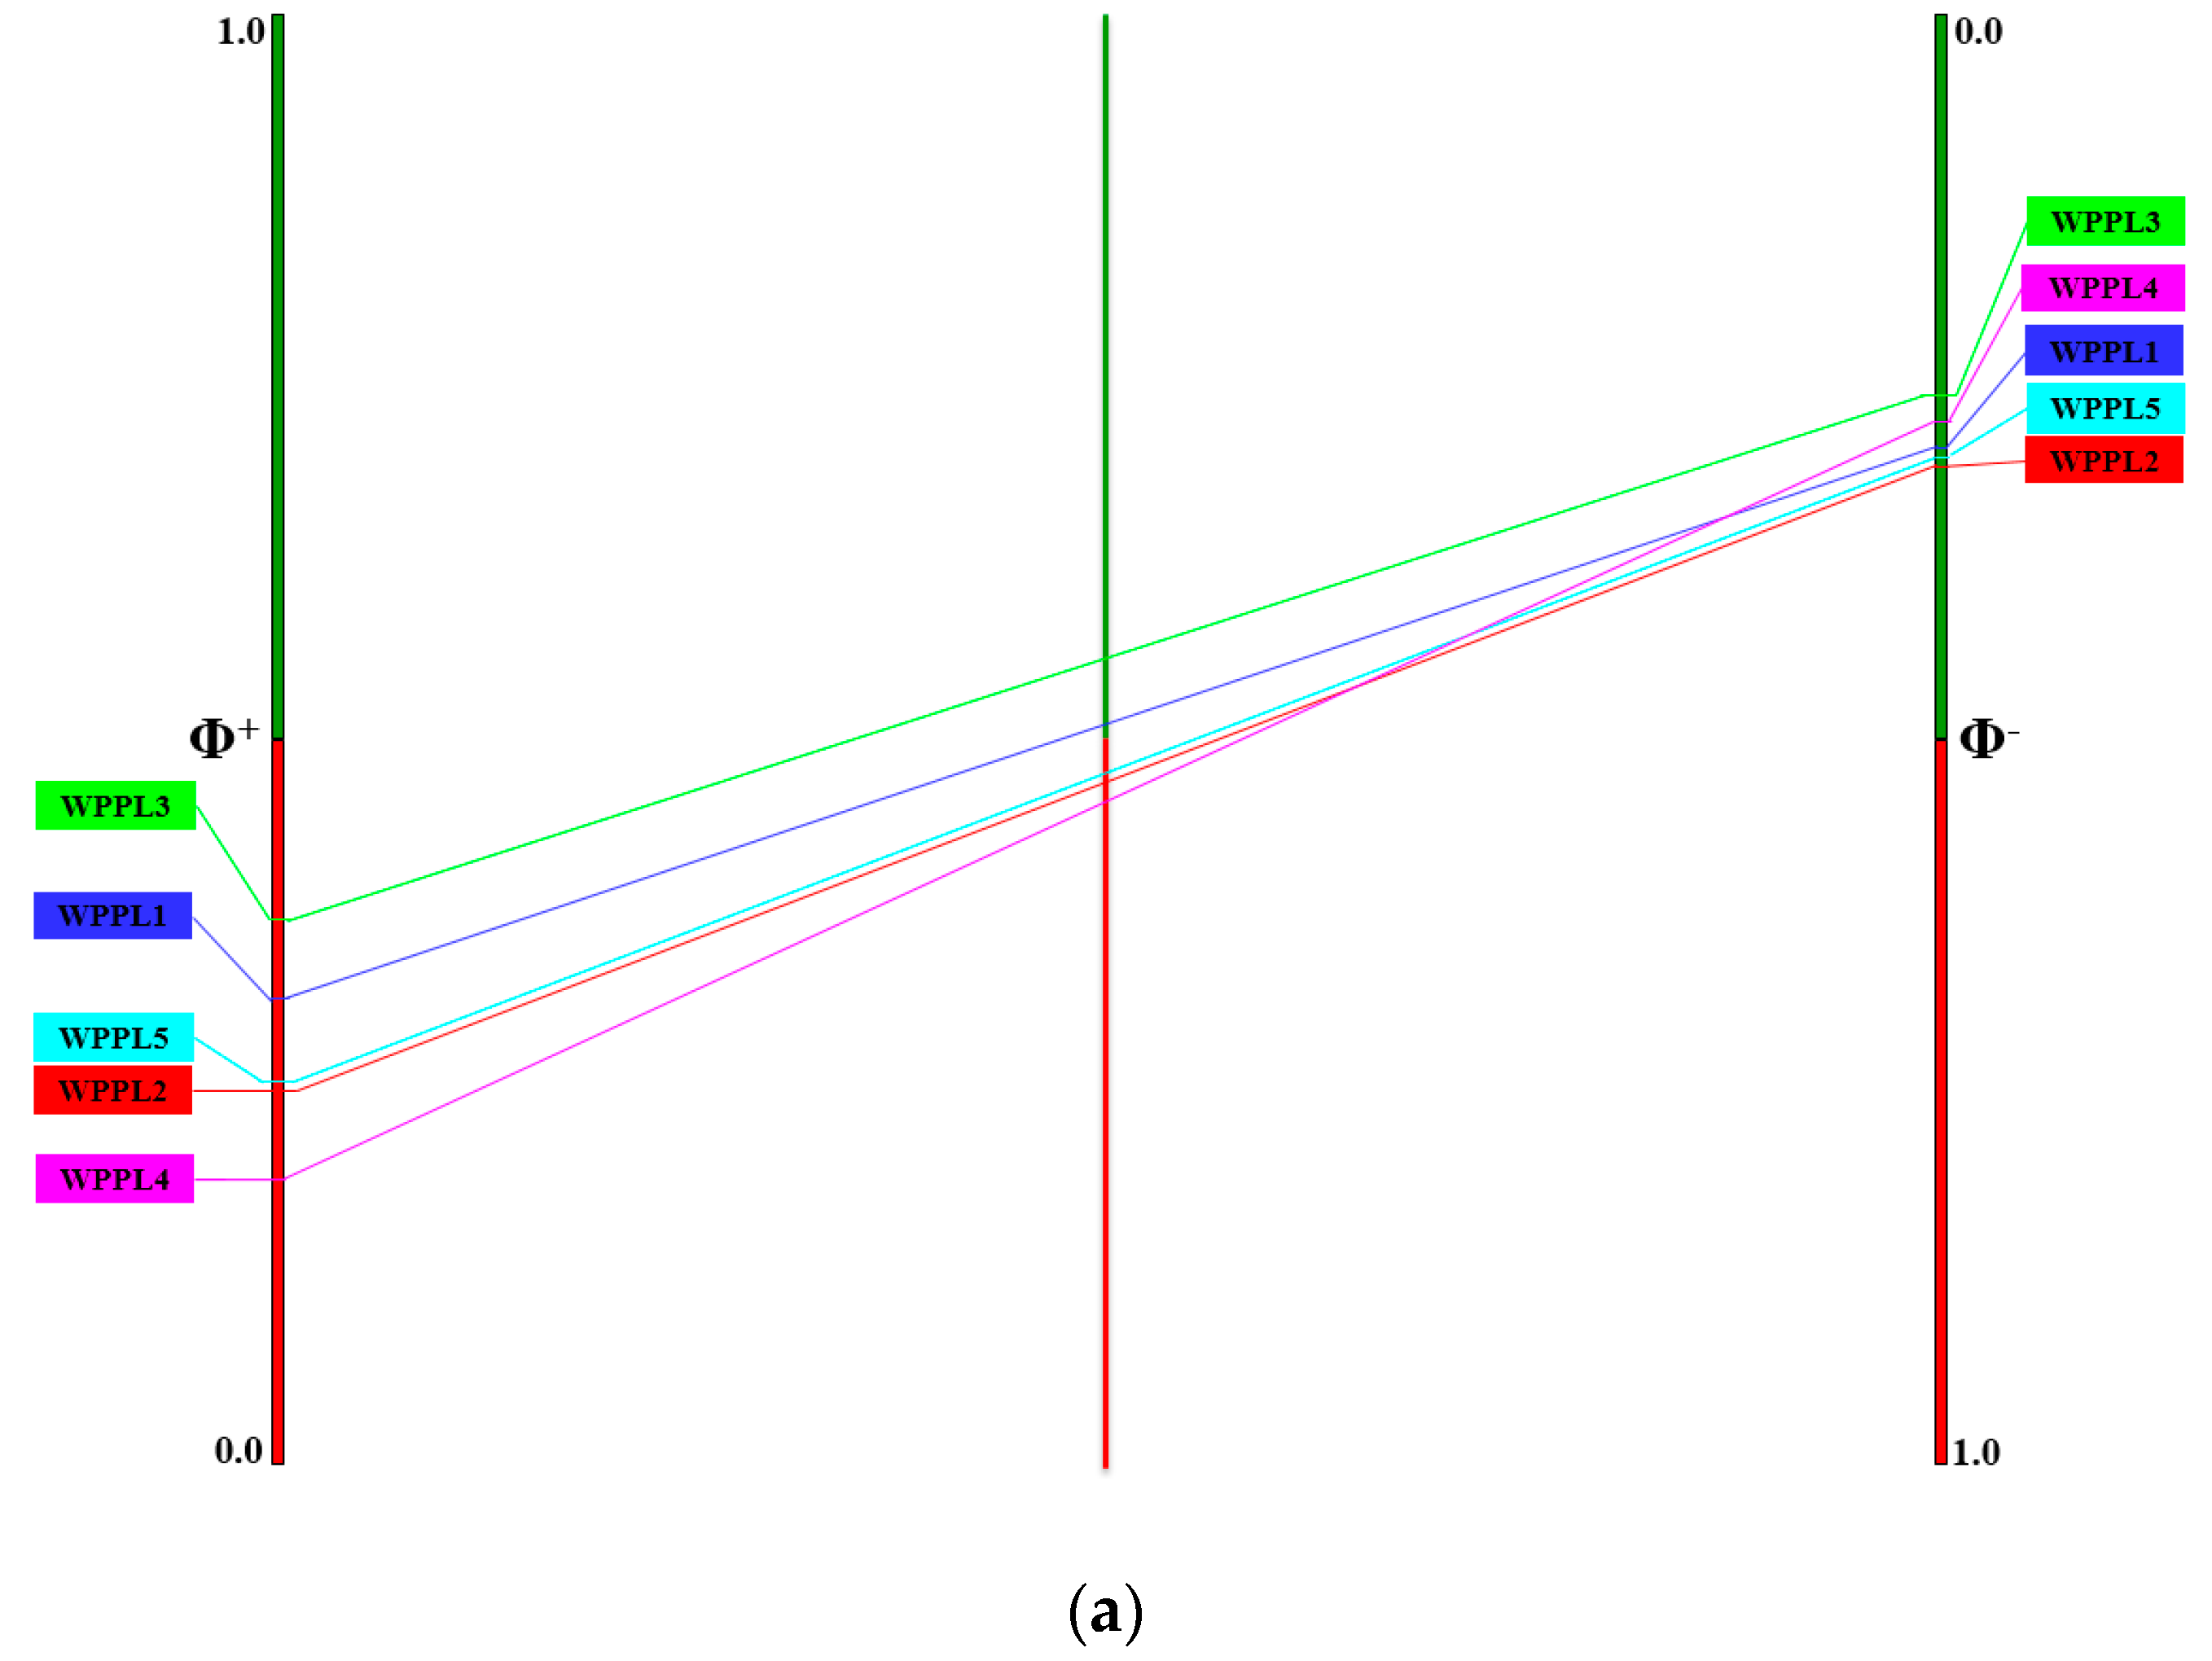
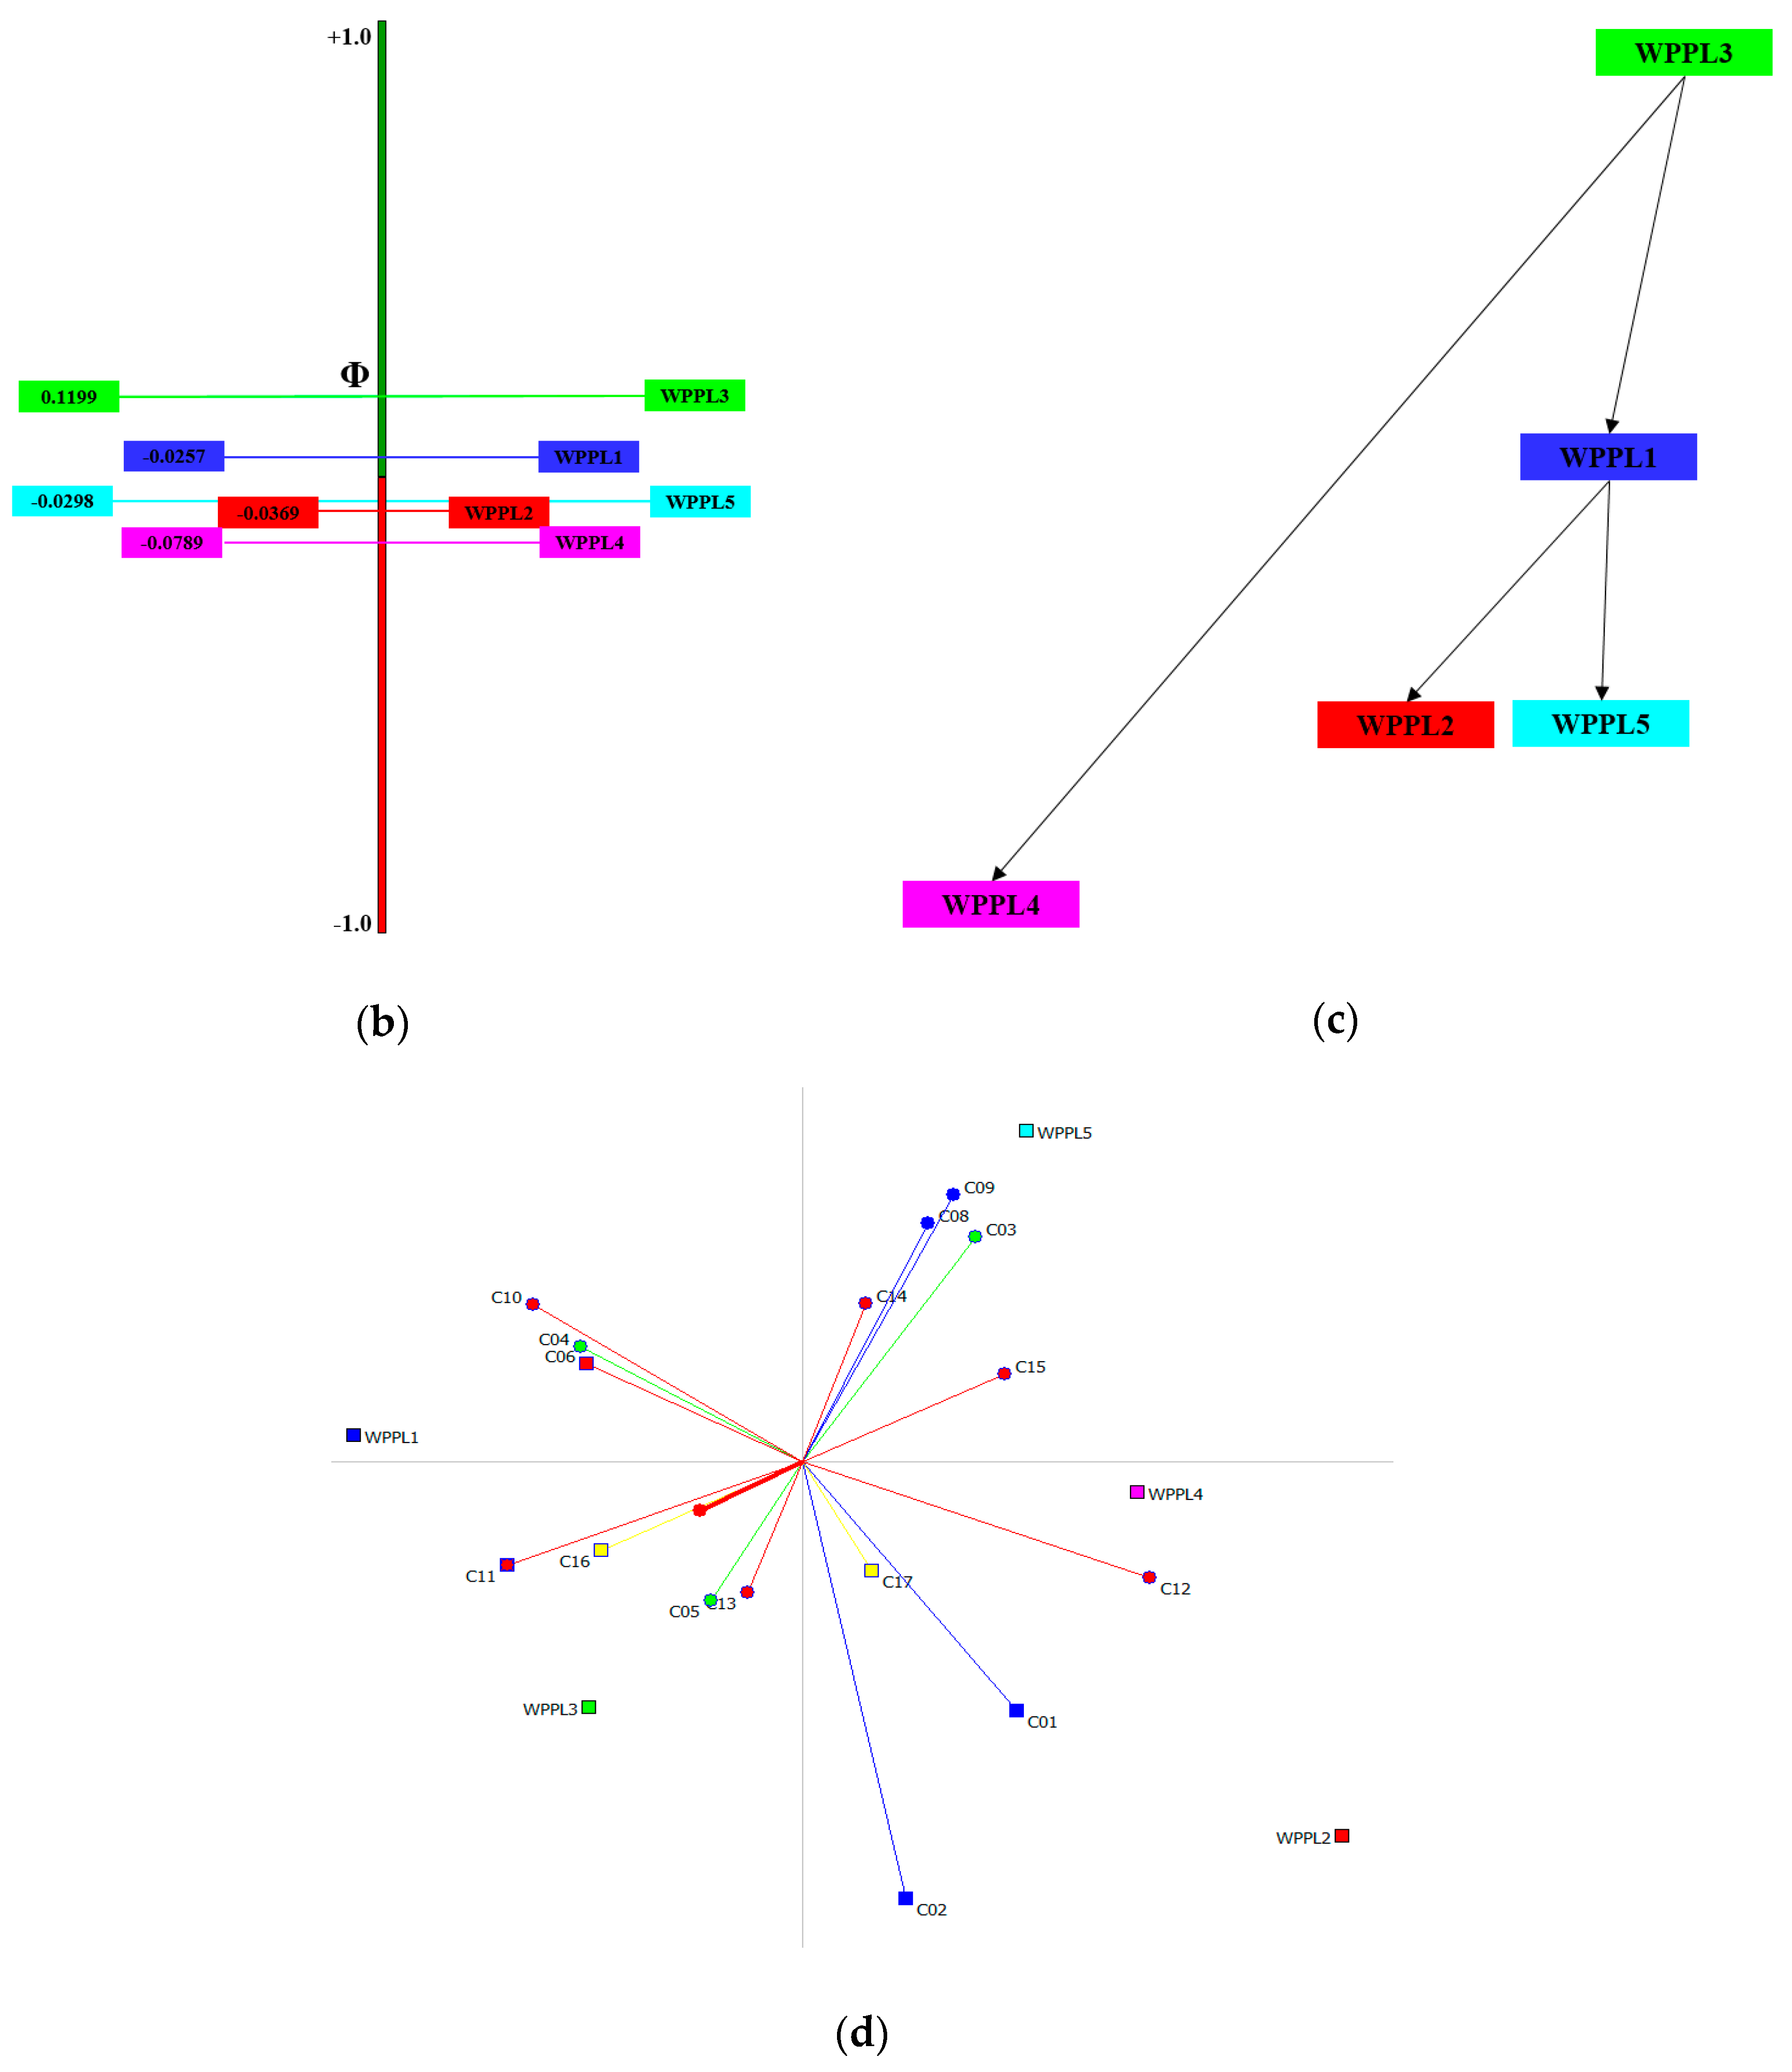
  • However, if the management wants to give a high preference to wind density and speed, or if the concern is for environmental issues over all other criteria, the order of site choices is found to be WPPL3, WPPL1, WPPL5, WPPL2, and WPPL4.
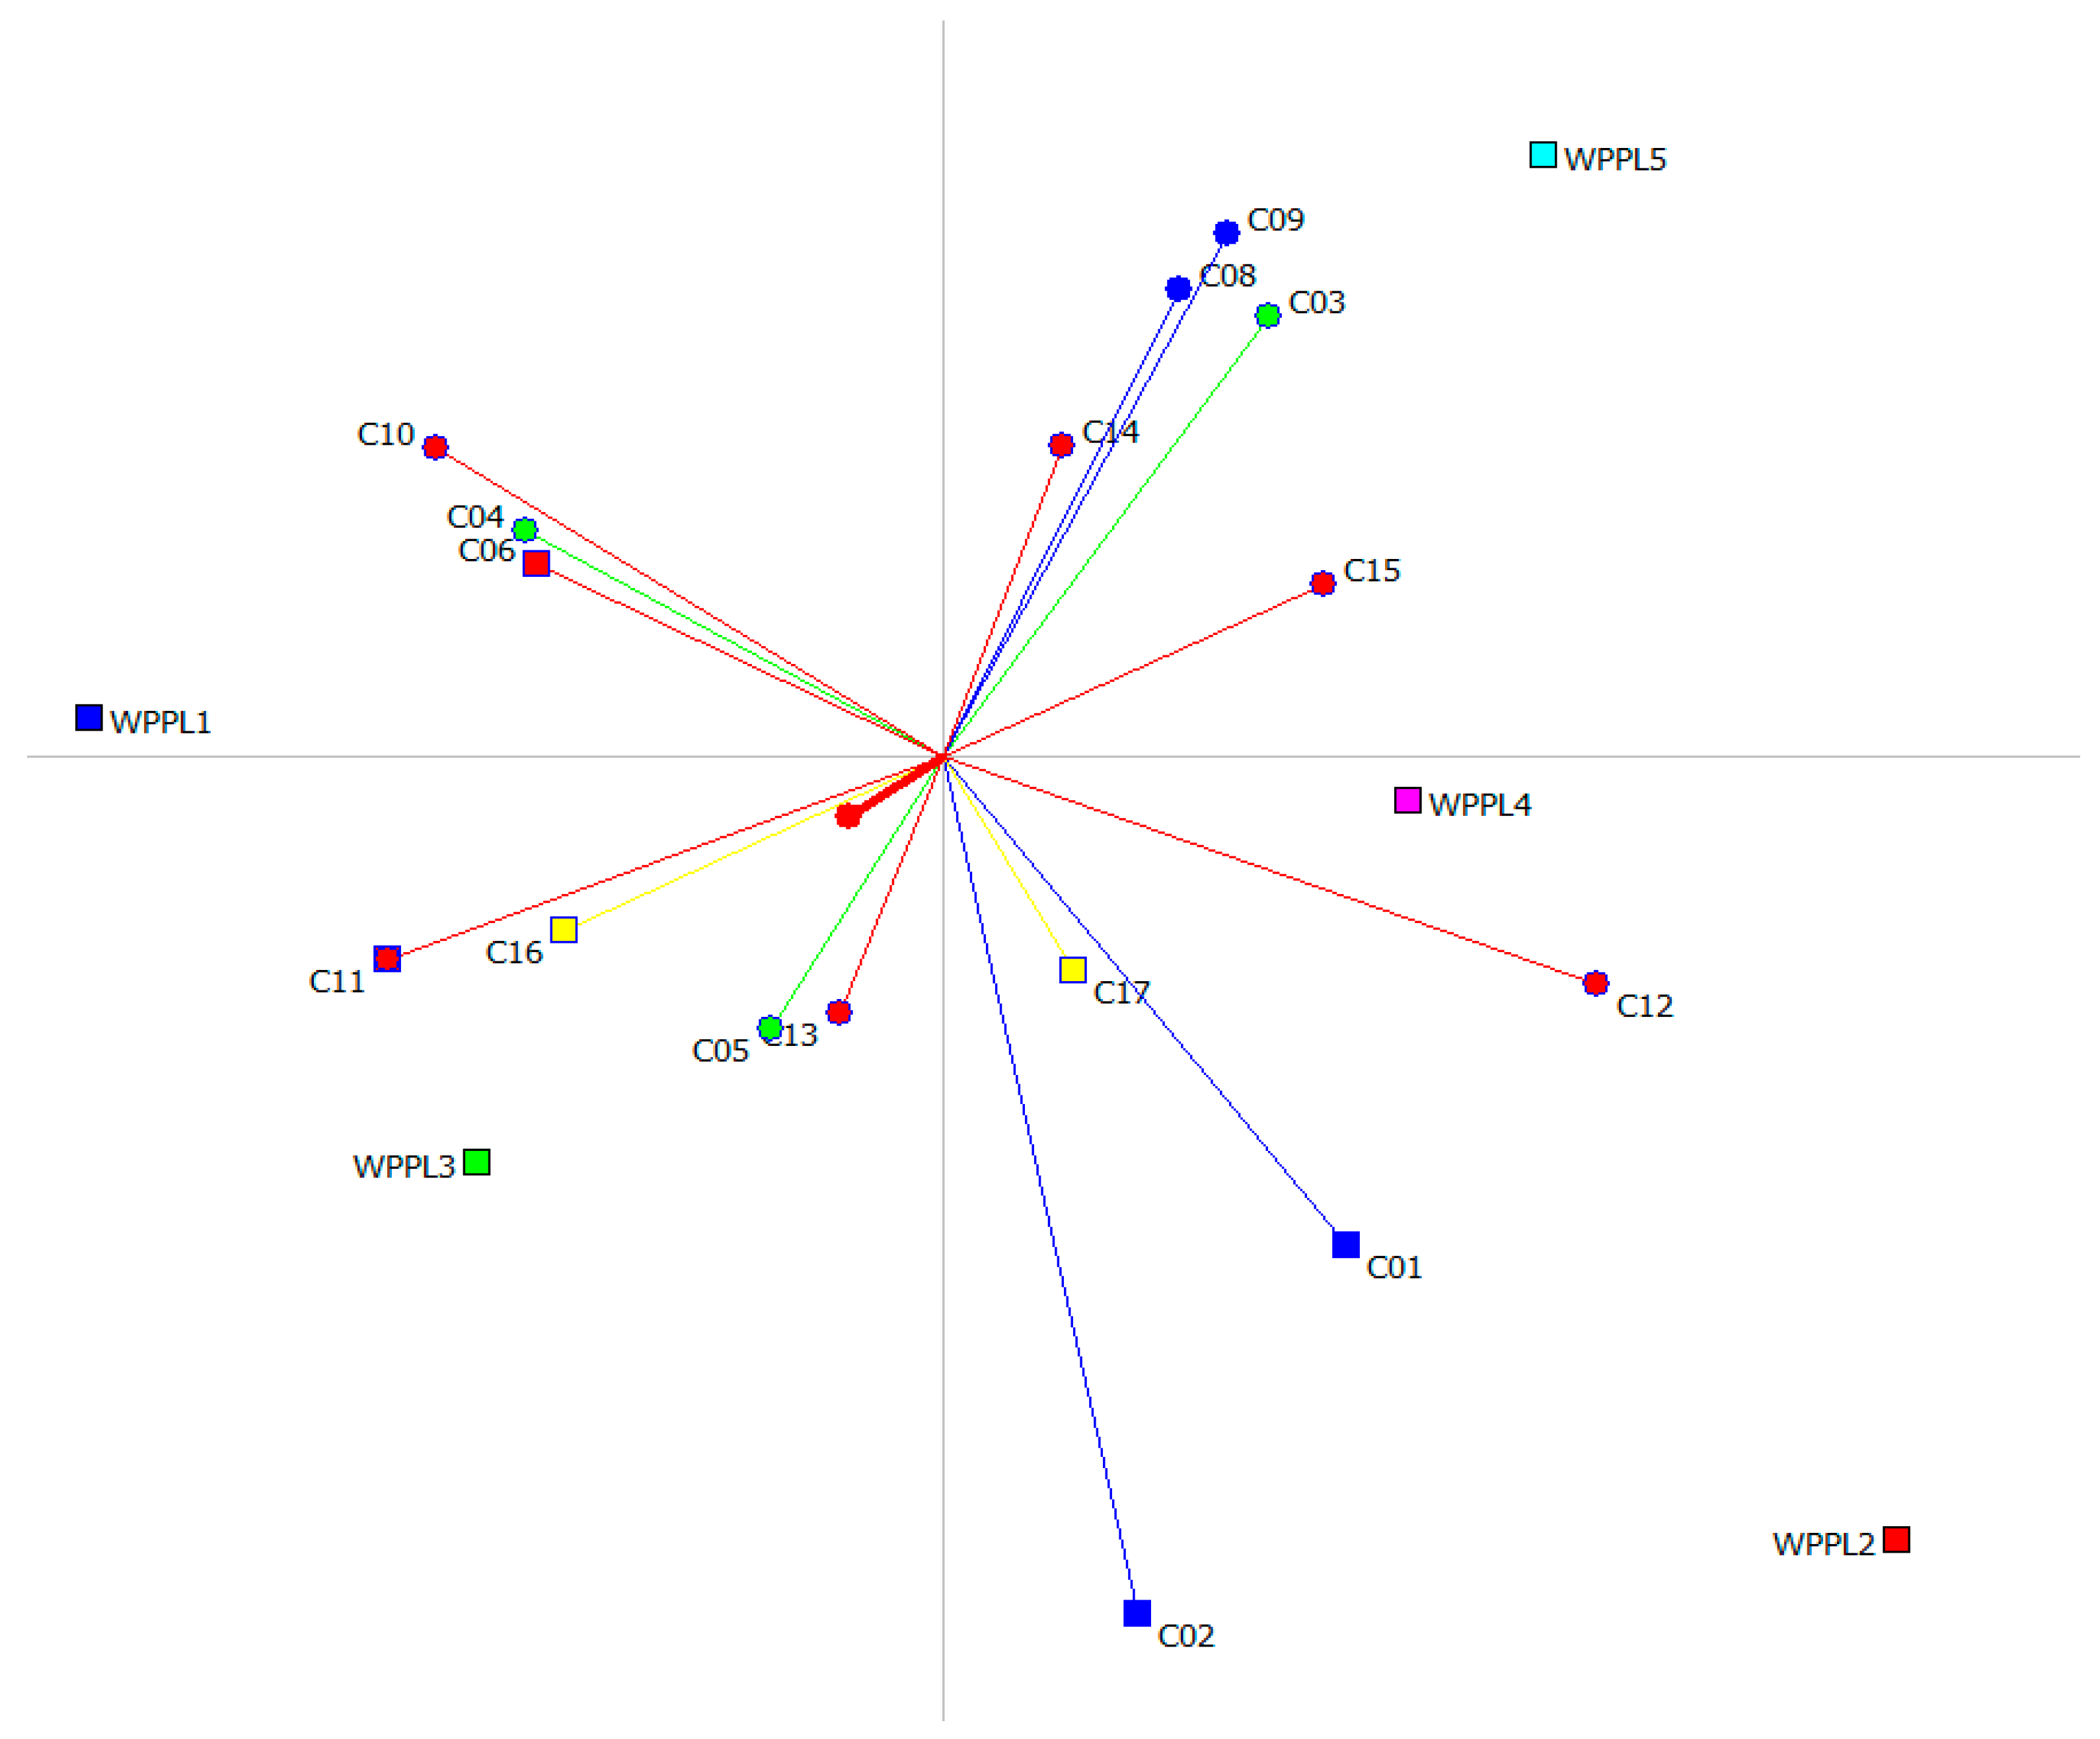
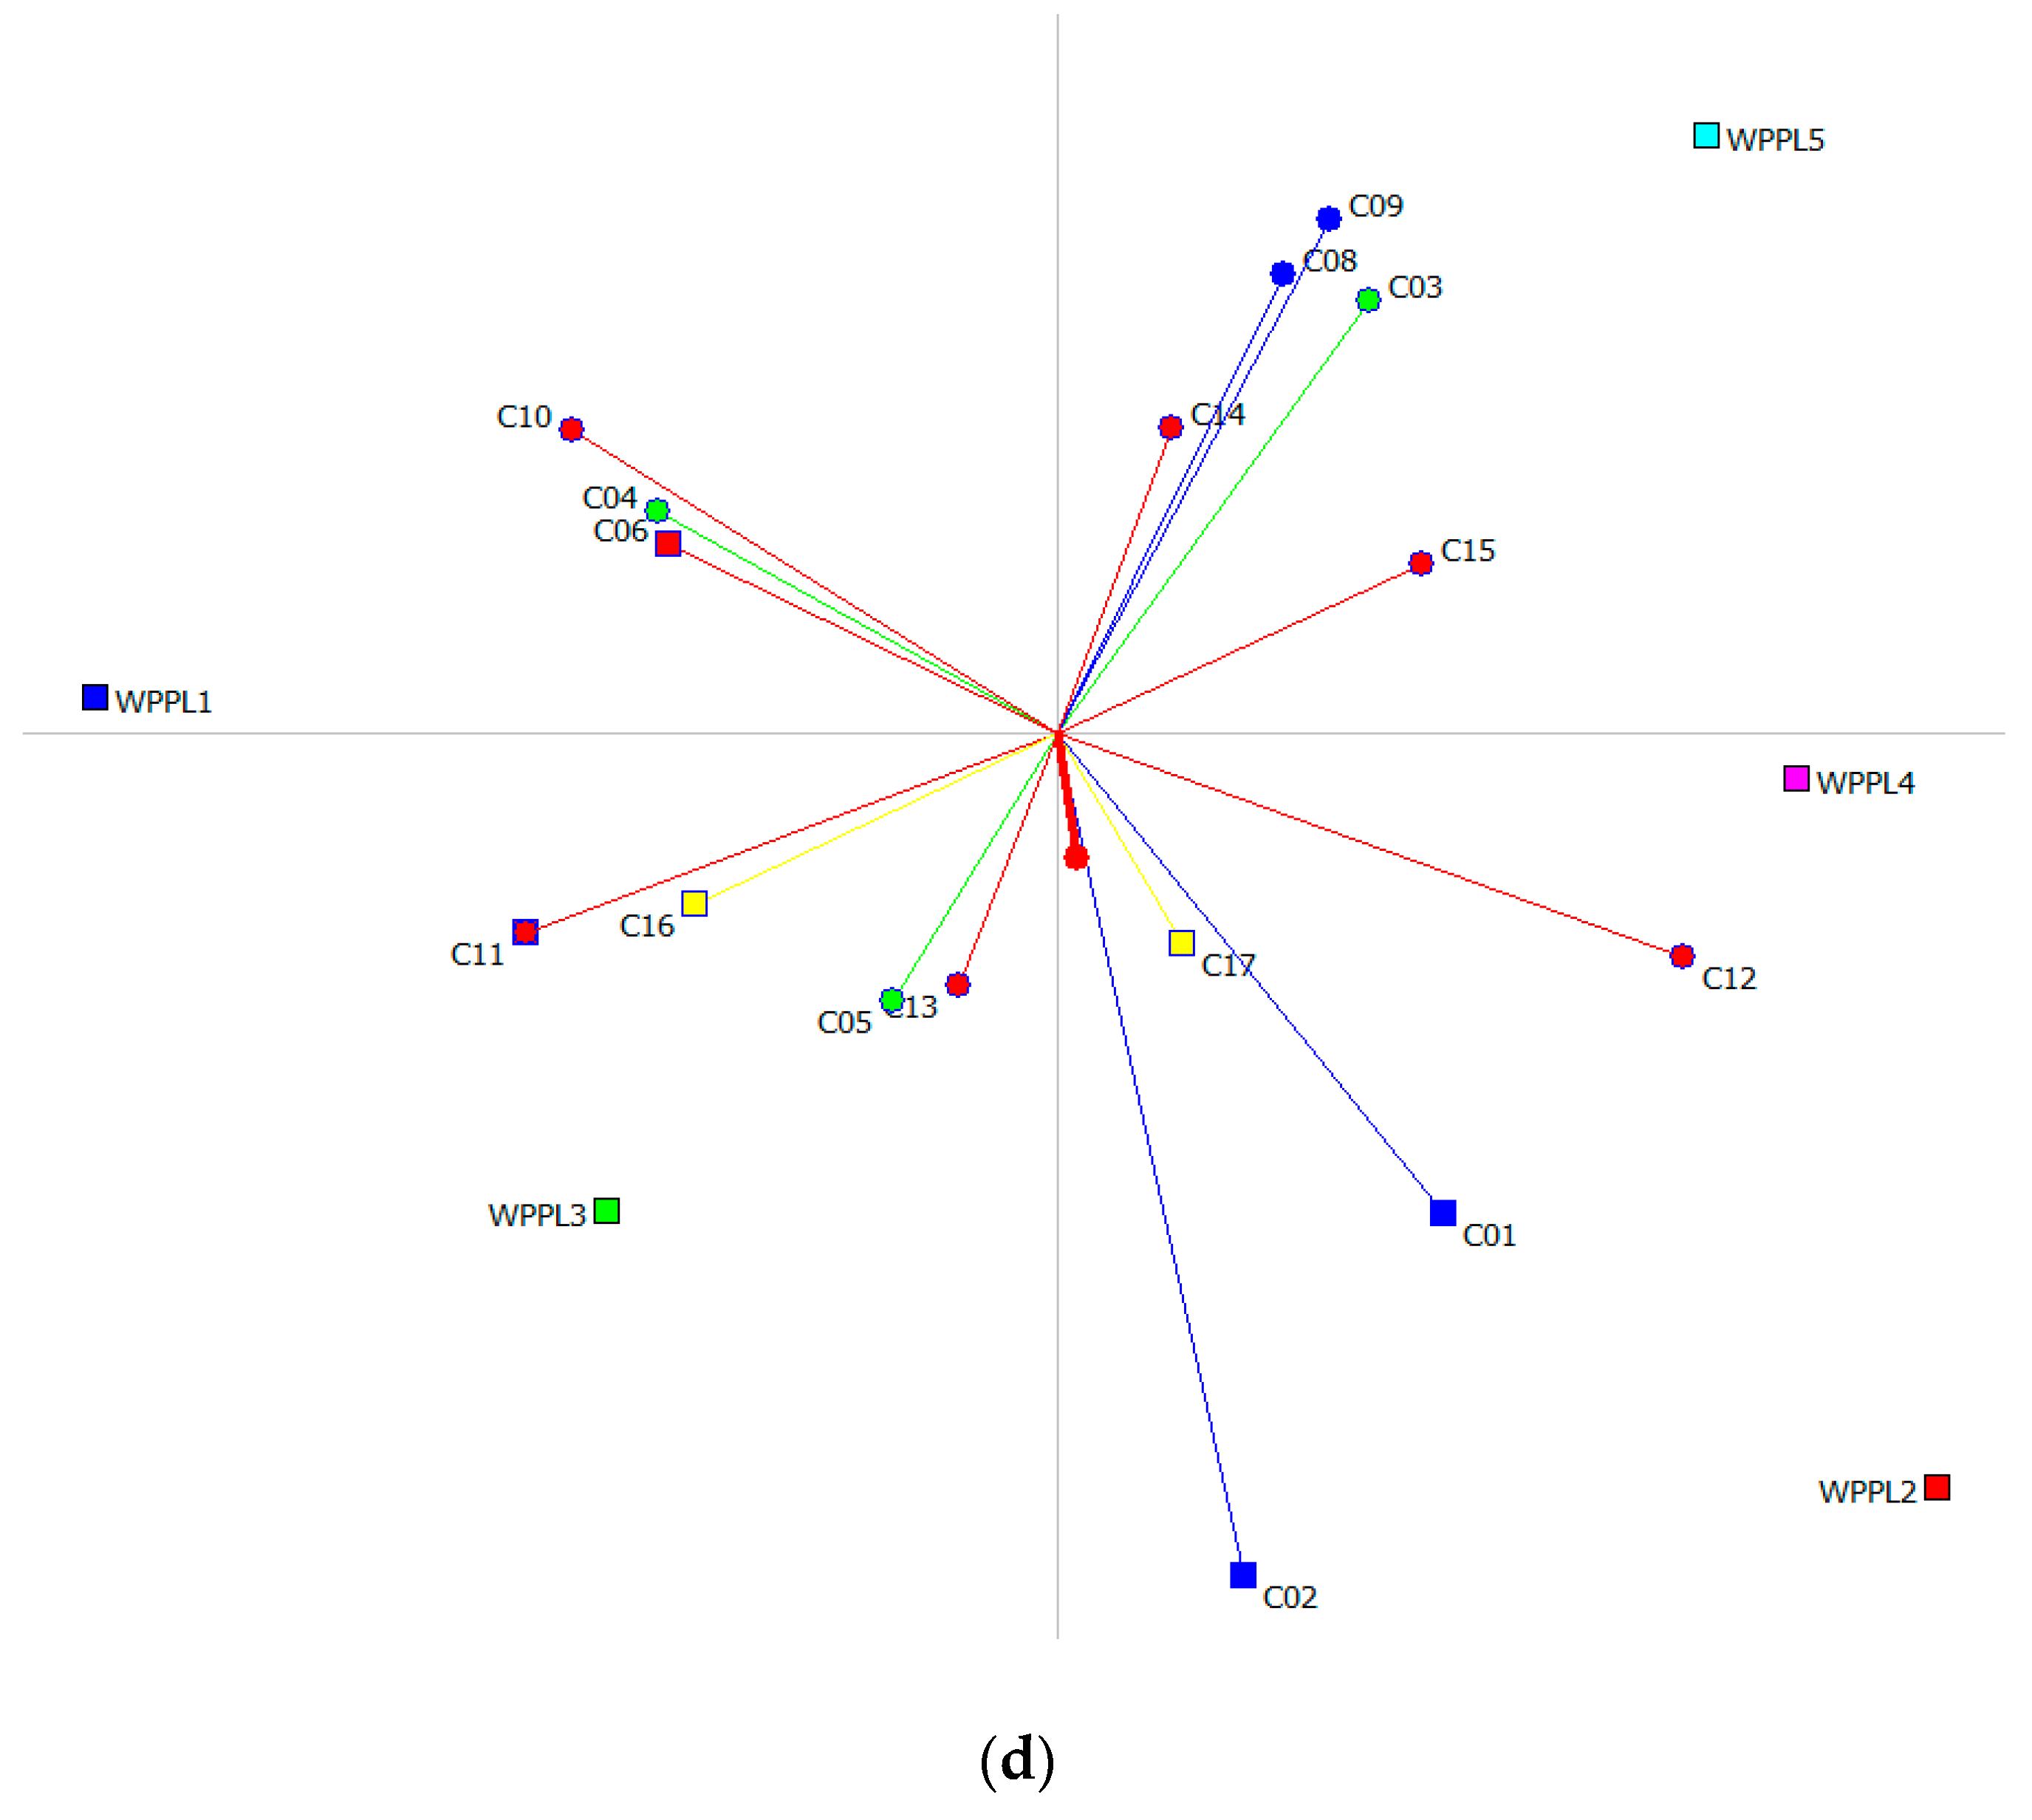
  • Similarly, when the same management wants to give a high and equal preference to wind density and speed and has an objective to minimize the costs related to technology and power distribution, the wind energy power plant locations order of preference is found to be WPPL3, WPPL2, WPPL5, WPPL4, and WPPL1.
  • The presented visual PROMETHEE approach is preferable because it establishes a preference of a wind energy power plant location over other locations and is unbiased in the decision-making process.
Thus, the proposed MCDM approach provides flexibility to the decision makers while considering all the criteria and their objectives simultaneously. The application of this approach can assist policy makers to easily overcome contradictory parameters and recommend optimum locations that are suitable for both citizens and stake holders and simultaneously are economically and environmentally friendly. In the future, we hope that this decision support system will allow the search for site locations for wind power plants to be more practical and efficient. Furthermore, the approach can provide guidance to other decision-making problems, such as evaluations of power plant systems, energy sources, new technologies, and other sustainability related decisions. The entropy weight can help decision makers to determine the objective weight of each criterion, so that subjective factors in the evaluation process can be effectively circumvented; and the PROMETHEE method is employed to establish the superiority of an alternative over another (if it exists) based on criterion with linear preference, and then calculates the positive flow, negative flow and net flow of each alternative, then rank alternatives according to the value of net flow. Therefore, it can be said that the combination of these techniques provides an effective framework for selecting the wind power plant locations.

Author Contributions

Conceptualization, A.U.R. and U.U.; Methodology, A.U.R.; Data Curation, A.U.R. and Y.S.U.; Validation, A.U.R. and U.U.; Formal Analysis, A.U.R. and M.H.A.; Investigation, A.U.R. and M.H.A.; Resources, A.U.R.; Writing—Original Draft Preparation, A.U.R., Y.S.U., and M.H.A.; Writing—Review and Editing, A.U.R., Y.S.U., and M.H.A.; Supervision, A.U.R. and U.U.; Funding Acquisition, A.U.R. and U.U.

Funding

This research was funded by the Deanship of Scientific Research at King Saud University; grant number RG-1439-005.

Acknowledgments

The authors extend their appreciation to the Deanship of Scientific Research at King Saud University for funding this work through research group No (RG-1439-005).

Conflicts of Interest

The authors declare no conflict of interest.

References

  1. Li, C.; Zhuang, T.; Zhou, S.; Xiao, Y.; Hu, G. Passive vibration control of a semi-submersible floating offshore wind turbine. Appl. Sci. 2017, 7, 509. [Google Scholar] [CrossRef]
  2. United Nations; Department of Economic and Social Affairs. World Urbanization Prospects; United Nations: New York, NY, USA, 2015; Available online: http://esa.un.org/unpd/wup/Publications/Files/WUP2014-Report.pdf (accessed on 10 January 2018).
  3. OECD. Green Growth Studies: Energy; OECD Publishing: Paris, France, 2011. [Google Scholar]
  4. Pérez-Andreu, V.; Aparicio-Fernández, C.; Martínez-Ibernón, A.; Vivancos, J.-L. Impact of climate change on heating and cooling energy demand in a residential building in a mediterranean climate. Energy 2018, 165, 63–74. [Google Scholar] [CrossRef]
  5. BBC. Reasons for Increase in Demand for Energy. 2019. Available online: https://www.bbc.co.uk/bitesize/guides/zpmmmp3/revision/2 (accessed on 10 October 2019).
  6. Liu, Z. Supply and demand of global energy and electricity. In Global Energy Interconnection; Liu, Z., Ed.; Academic Press: Boston, MA, USA, 2015; pp. 101–182. [Google Scholar]
  7. Wang, B.; Cot, L.D.; Adolphe, L.; Geoffroy, S.; Sun, S. Cross indicator analysis between wind energy potential and urban morphology. Renew. Energy 2017, 113, 989–1006. [Google Scholar] [CrossRef]
  8. United Nations Framework. Kyoto Protocol; United Nations: New York, NY, USA, 1998. [Google Scholar]
  9. Blinc, R.; Zidans, A.; Šlaus, I. Sustainable development and global security. Energy 2007, 32, 883–890. [Google Scholar] [CrossRef]
  10. Peña, J.I.; Rodríguez, R. Are eu’s climate and energy package 20-20-20 targets achievable and compatible? Evidence from the impact of renewables on electricity prices. Energy 2019, 183, 477–486. [Google Scholar] [CrossRef]
  11. Lee, A.H.I.; Chen, H.H.; Kang, H.-Y. Multi-criteria decision making on strategic selection of wind farms. Renew. Energy 2009, 34, 120–126. [Google Scholar] [CrossRef]
  12. Serri, L.; Lembo, E.; Airoldi, D.; Gelli, C.; Beccarello, M. Wind energy plants repowering potential in italy: Technical-economic assessment. Renew. Energy 2018, 115, 382–390. [Google Scholar] [CrossRef]
  13. Chong, W.; Gwani, M.; Tan, C.; Muzammil, W.; Poh, S.; Wong, K. Design and testing of a novel building integrated cross axis wind turbine. Appl. Sci. 2017, 7, 251. [Google Scholar] [CrossRef]
  14. Aydin, N.Y.; Kentel, E.; Sebnem Duzgun, H. Gis-based site selection methodology for hybrid renewable energy systems: A case study from western turkey. Energy Convers. Manag. 2013, 70, 90–106. [Google Scholar] [CrossRef]
  15. Han, C.; Nagamune, R. Position control of an offshore wind turbine with a semi-submersible floating platform using the aerodynamic force. In Proceedings of the IEEE Canadian Conference on Electrical and Computer Engineering (CCECE), Vancouver, BC, Canada, 15–18 May 2016. [Google Scholar]
  16. Dai, K.; Bergot, A.; Liang, C.; Xiang, W.-N.; Huang, Z. Environmental issues associated with wind energy—A review. Renew. Energy 2015, 75, 911–921. [Google Scholar] [CrossRef]
  17. Lima, F.; Ferreira, P.; Vieira, F. Strategic impact management of wind power projects. Renew. Sustain. Energy Rev. 2013, 25, 277–290. [Google Scholar] [CrossRef] [Green Version]
  18. Schomer, P.; Pamidighantam, P. A critical analysis of: Wind turbine health impact study: Report of independent expert panel. Proc. Meet. Acoust. 2013, 20, 040008. [Google Scholar] [CrossRef]
  19. Lau, L.C.; Lee, K.T.; Mohamed, A.R. Global warming mitigation and renewable energy policy development from the kyoto protocol to the copenhagen accord—A comment. Renew. Sustain. Energy Rev. 2012, 16, 5280–5284. [Google Scholar] [CrossRef]
  20. Houghton, T.; Bell, K.R.W.; Doquet, M. Offshore transmission for wind: Comparing the economic benefits of different offshore network configurations. Renew. Energy 2016, 94, 268–279. [Google Scholar] [CrossRef] [Green Version]
  21. Danish Energy Agency (DEA). The Danish Energy Model: Innovative, Efficient and Sustainable; DEA: Copenhagen, Denmark, 2016; Available online: https://ens.dk/sites/ens.dk/files/Globalcooperation/the_danish_energy_model.pdf (accessed on 15 July 2019).
  22. World Wind Energy Association (WWEA). WWEA Quarterly Bulleting Issue 1–206: Community Wind Special. 2016. Available online: http://www.wwindea.org/wwea_bulletin_issue_1_2016/ (accessed on 10 January 2018).
  23. Global Wind Energy Council (GWEC). Global Wind Market to Reach 841 Gigawatts in 2022, Predicts GWEC. 2018. Available online: http://www.gwec.net/wp-content/uploads/2012/06/Annual-Installed-Capacity-by-Region-2008-2016.jpg (accessed on 10 July 2019).
  24. Graves, L. Saudi Arabia Looks Past Oil and Pushes Ahead with Wind Energy Ambitions. 2017. Available online: https://www.thenational.ae/business/energy/saudi-arabia-looks-past-oil-and-pushes-ahead-with-wind-energy-ambitions-1.609330 (accessed on 12 January 2018).
  25. Shaahid, S.M.; Al-Hadhrami, L.M.; Rahman, M.K. Potential of establishment of wind farms in western province of Saudi Arabia. Energy Procedia 2014, 52, 497–505. [Google Scholar] [CrossRef]
  26. Alawaji, S.H.; Eugenio, N.N.; Elani, U.A. Wind energy resource assessment in Saudi Arabia: Part ii: Data collection and analysis. Renew. Energy 1996, 9, 818–821. [Google Scholar] [CrossRef]
  27. Rehman, S.; Al-Abbadi, N.M. Wind shear coefficients and energy yield for Dhahran, Saudi Arabia. Renew. Energy 2007, 32, 738–749. [Google Scholar] [CrossRef]
  28. Eltamaly, A.M.; Farh, H.M. Wind energy assessment for five locations in Saudi Arabia. J. Renew. Sustain. Energy 2012, 4, 022702. [Google Scholar] [CrossRef]
  29. Tagle, F.; Castruccio, S.; Crippa, P.; Genton, M.G. Assessing potential wind energy resources in Saudi Arabia with a skew-t distribution. arXiv 2017, arXiv:1703.04312. Available online: https://repository.kaust.edu.sa/bitstream/handle/10754/626467/1703.04312v1.pdf?sequence=2 (accessed on 25 June 2019).
  30. Baseer, M.A.; Meyer, J.P.; Alam, M.M.; Rehman, S. Wind speed and power characteristics for Jubail industrial city, Saudi Arabia. Renew. Sustain. Energy Rev. 2015, 52, 1193–1204. [Google Scholar] [CrossRef] [Green Version]
  31. Konneh, A.D.; Howlader, O.H.; Shigenobu, R.; Senjyu, T.; Chakraborty, S.; Krishna, N. A multi-criteria decision maker for grid-connected hybrid renewable energy systems selection using multi-objective particle swarm optimization. Sustainability 2019, 11, 1188. [Google Scholar] [CrossRef]
  32. Erdin, C.; Akbaş, E.H. A comparative analysis of fuzzy topsis and geographic information systems (gis) for the location selection of shopping malls: A case study from turkey. Sustainability 2019, 11, 3837. [Google Scholar] [CrossRef]
  33. Deepa, N.; Srinivasan, K.; Chang, C.Y.; Bashir, A.K. An efficient ensemble vtopes multi-criteria decision-making model for sustainable sugarcane farms. Sustainability 2019, 11, 4288. [Google Scholar] [CrossRef]
  34. Ioannou, K.; Kosmatopoulos, L.; Zaimes, G.N.; Tsantopoulos, G. Geoinformatics as a tool for the application of energy policy. Int. J. Sustain. Agric. Manag. Inform. 2018, 4, 4–22. [Google Scholar]
  35. Ioannou, K.; Tsantopoulos, G.; Arabatzis, G.; Andreopoulou, Z.; Zafeiriou, E. A spatial decision support system framework for the evaluation of biomass energy production locations: Case study in the regional unit of drama, Greece. Sustainability 2018, 10, 531. [Google Scholar] [CrossRef]
  36. Noorollahi, Y.; Yousefi, H.; Mohammadi, M. Multi-criteria decision support system for wind farm site selection using GIS. Sustain. Energy Technol. Assess. 2016, 13, 38–50. [Google Scholar] [CrossRef]
  37. Rodman, L.C.; Meentemeyer, R.K. A geographic analysis of wind turbine placement in northern California. Energy Policy 2006, 34, 2137–2149. [Google Scholar] [CrossRef]
  38. San Cristóbal, J.R. Multi-criteria decision-making in the selection of a renewable energy project in Spain: The vikor method. Renew. Energy 2011, 36, 498–502. [Google Scholar] [CrossRef]
  39. Goumas, M.G.; Lygerou, V.A.; Papayannakis, L.E. Computational methods for planning and evaluating geothermal energy projects. Energy Policy 1999, 27, 147–154. [Google Scholar] [CrossRef]
  40. Goumas, M.; Lygerou, V. An extension of the promethee method for decision making in fuzzy environment: Ranking of alternative energy exploitation projects. Eur. J. Oper. Res. 2000, 123, 606–613. [Google Scholar] [CrossRef]
  41. Haralambopoulos, D.A.; Polatidis, H. Renewable energy projects: Structuring a multi-criteria group decision-making framework. Renew. Energy 2003, 28, 961–973. [Google Scholar] [CrossRef]
  42. Mladineo, N.; Margeta, J.; Brans, J.P.; Mareschal, B. Multicriteria ranking of alternative locations for small scale hydro plants. Eur. J. Oper. Res. 1987, 31, 215–222. [Google Scholar] [CrossRef]
  43. Kyriakopoulos, G.L.; Arabatzis, G.; Tsialis, P.; Ioannou, K. Electricity consumption and res plants in Greece: Typologies of regional units. Renew. Energy 2018, 127, 134–144. [Google Scholar] [CrossRef]
  44. Alkaradaghi, K.; Ali, S.S.; Al-Ansari, N.; Laue, J.; Chabuk, A. Landfill site selection using MCDM methods and GIS in the sulaimaniyah governorate, Iraq. Sustainability 2019, 11, 4350. [Google Scholar] [CrossRef]
  45. Gavériaux, L.; Laverrière, G.; Wang, T.; Maslov, N.; Claramunt, C. GIS-based multi-criteria analysis for offshore wind turbine deployment in Hong Kong. Ann. GIS 2019, 25, 207–218. [Google Scholar] [CrossRef]
  46. Erdin, C.; Ozkaya, G. Turkey’s 2023 energy strategies and investment opportunities for renewable energy sources: Site selection based on electre. Sustainability 2019, 11, 2136. [Google Scholar] [CrossRef]
  47. Konstantinos, I.; Georgios, T.; Garyfalos, A. A decision support system methodology for selecting wind farm installation locations using AHP and TOPSIS: Case study in eastern Macedonia and Thrace region, Greece. Energy Policy 2019, 132, 232–246. [Google Scholar] [CrossRef]
  48. European Commission. Key Performance Indicators for the European Wind Industrial Initiative; Strategic Energy Technologies Information System (SETIS): Brussels, Belgium, 2011; Available online: https://setis.ec.europa.eu/system/files/Key_Performance_Indicators_Wind.pdf (accessed on 20 July 2019).
  49. Gonzalez, E.; Nanos, E.M.; Seyr, H.; Valldecabres, L.; Yürüşen, N.Y.; Smolka, U.; Muskulus, M.; Melero, J.J. Key performance indicators for wind farm operation and maintenance. Energy Procedia 2017, 137, 559–570. [Google Scholar] [CrossRef]
  50. Al-Awami, A.T.; Sortomme, E.; El-Sharkawi, M.A. Optimizing economic/environmental dispatch with wind and thermal units. In Proceedings of the 2009 IEEE Power & Energy Society General Meeting, Calgary, AB, Canada, 26–30 July 2009; pp. 1–6. [Google Scholar]
  51. Strazzera, E.; Mura, M.; Contu, D. Combining choice experiments with psychometric scales to assess the social acceptability of wind energy projects: A latent class approach. Energy Policy 2012, 48, 334–347. [Google Scholar] [CrossRef]
  52. Heydarian-Forushani, E.; Golshan, M.E.H.; Moghaddam, M.P.; Shafie-khah, M.; Catalão, J.P.S. Robust scheduling of variable wind generation by coordination of bulk energy storages and demand response. Energy Convers. Manag. 2015, 106, 941–950. [Google Scholar] [CrossRef]
  53. Alsyouf, I. Wind energy system reliability and maintainability, and operation and maintenance strategies. In Wind Energy Systems; Sørensen, J.D., Sørensen, J.N., Eds.; Woodhead Publishing: Cambridge, UK, 2011; pp. 303–328. [Google Scholar]
  54. Wu, Y.; Zhang, B.; Wu, C.; Zhang, T.; Liu, F. Optimal site selection for parabolic trough concentrating solar power plant using extended promethee method: A case in china. Renew. Energy 2019, 143, 1910–1927. [Google Scholar] [CrossRef]
  55. Zhou, M.; Liu, X.-B.; Yang, J.-B.; Chen, Y.-W.; Wu, J. Evidential reasoning approach with multiple kinds of attributes and entropy-based weight assignment. Knowl.-Based Syst. 2019, 163, 358–375. [Google Scholar] [CrossRef]
  56. Belton, V.; Stewart, T. Multiple Criteria Decision Analysis: An Integrated Approach; Kluwer Academic Publishers, Springer: New York, NY, USA, 2002; pp. XIX, 372. [Google Scholar]
  57. Varho, V.; Rikkonen, P.; Rasi, S. Futures of distributed small-scale renewable energy in Finland—A Delphi study of the opportunities and obstacles up to 2025. Technol. Forecast. Soc. Chang. 2016, 104, 30–37. [Google Scholar] [CrossRef]
  58. Siksnelyte, I.; Zavadskas, K.E.; Streimikiene, D.; Sharma, D. An overview of multi-criteria decision-making methods in dealing with sustainable energy development issues. Energies 2018, 11, 2754. [Google Scholar] [CrossRef]
Figure 1. Cumulative market forecast of wind energy by region (2018–2022) (adapted from Global Wind Energy Council, GWEC [23]).
Sustainability 11 06112 g001
Figure 2. Multiple criteria and their sub-criteria chosen for the evaluation of wind power plant locations.
Sustainability 11 06112 g002
Figure 3. Partial ranking.
Sustainability 11 06112 g003
Figure 4. Complete ranking.
Sustainability 11 06112 g004
Figure 5. Ranking network.
Sustainability 11 06112 g005
Figure 6. Geometrical analysis for interactive aid (GAIA) plane.
Sustainability 11 06112 g006
Figure 7. For weight Set 2 (refer to Table 3): (a) Partial ranking; (b) Complete ranking; (c) Ranking network; and (d) GAIA plane.
Sustainability 11 06112 g007aSustainability 11 06112 g007b
Figure 8. For weight Set 3 (refer to Table 3): (a) Partial ranking; (b) Complete ranking; (c) Ranking network; and (d) GAIA plane.
Sustainability 11 06112 g008aSustainability 11 06112 g008b
Table 1. Decision matrix with criterion weights.
Evaluation Criterion (j)→
Alternative WPPL (i)↓
12n
1X11X12X1n
2X21X22X2n
....
.
a
.
Xa1
.
Xa2

.
Xan
....
bXb1Xb2Xbn
....
mXm1Xm2Xmn
Criterion Weight →W1W2Wn
Table 2. Sample data for each alternative obtained via a menu-driven online expert survey.
Criteria
Alternative Wind-Energy Power Plant Locations🡫Average Wind SpeedAverage Wind Power DensityEnvironmental IssuesAcceptabilityPower DemandType of TerrainGeological SuitabilityTechnology CostTip-Speed RatioSecurity and Safety ThreatsNatural/Unnatural EventsProximity to Electric Power SupplyTransportation FacilityPower Grid LossSupply CostDevelopment Scheme for RegionCultural Environmental Concerns
Criteria Codes 🡪C01C02C03C04C05C06C07C08C09C10C11C12C13C14C15C16C17
Measurement Scale 🡪m/sW/m2Impact5-point5-point5-point5-point5-point5-pointImpactImpactkm5-pointImpactImpact5-pointImpact
Criteria Weights Wj 🡪11111111111111111
WPPL14500h#554533vll9.53mm53
WPPL27650m232333vhh494mvl32
WPPL36620vh524533ml19.85vhm54
WPPL46.4540h241333mh31.43hl43
WPPL55410l413233mh25.53lvl34
#vl: very low; l: low; m: moderate; h: high; vh: very high; 1: very bad; 2: bad; 3: average; 4: good; and 5: very good.
Table 3. Criteria weights to evaluate wind energy power plant locations.
CriteriaSubjective WeightsObjective Weights
Set 3 (Entropy)
Codes (Refer to Table 2)Preference FunctionSet 1 (Equal Weights)Set 2 (Expert Survey)
C01V-shape0.0588240.078740.055382
C02V-shape0.0588240.078740.055335
C03V-shape0.0588240.0688980.052863
C04L-shape0.0588240.0551180.07033
C05L-shape0.0588240.0688980.052806
C06L-shape0.0588240.0590550.060281
C07L-shape0.0588240.0551180.057649
C08L-shape0.0588240.0590550.052806
C09V-shape0.0588240.0590550.052806
C10L-shape0.0588240.0472440.049216
C11L-shape0.0588240.0492130.077748
C12V-shape0.0588240.0472440.04911
C13L-shape0.0588240.0472440.068237
C14L-shape0.0588240.0570870.050231
C15L-shape0.0588240.0688980.068237
C16L-shape0.0588240.0501970.068237
C17L-shape0.0588240.0501970.058727
Table 4. Outranking flows for each alternative corresponding with the sets of criteria weights.
Alternative Wind Energy Power Plant Locations (WPPL)🡫Set 1 Equal WeightsSet 2 Experts Survey Subjective WeightsSet 3 Entropy Weights Objective Weights
ΦΦ+ΦΦΦ+ΦΦΦ+Φ
WPPL1−0.00130.31620.3175−0.04310.30190.3450.02570.32280.2971
WPPL2−0.01560.28590.30150.03610.31680.2808−0.03690.26750.3043
WPPL30.07740.36170.28420.05930.35540.29600.11990.37990.2599
WPPL4−0.04840.22150.2699−0.03210.23670.2688−0.07890.19780.2767
WPPL5−0.01210.28810.3002−0.02020.29480.3150−0.02980.2690.2988
Table 5. Preference order of alternatives corresponding with the sets of criteria weights.
Rank of Alternatives
Weights Assigned to Criteria Opted for Evaluation of Wind Power Plant Location
Alternatives↓Set 1
Equal Weights
Set 2
Subjective Weights
Set 3
Objective Weights
WPPL1252
WPPL2424
WPPL3111
WPPL4545
WPPL5333

