Article

Maize Open-Pollinated Populations Physiological Improvement: Validating Tools for Drought Response Participatory Selection

1
Instituto de Tecnologia Química e Biológica António Xavier, Universidade Nova de Lisboa, 2780-157 Oeiras, Portugal
2
Escola Superior Agrária de Coimbra, Instituto Politécnico de Coimbra, 3045-601 Coimbra, Portugal
3
Centro de Estudos Florestais, Instituto Superior de Agronomia, Universidade de Lisboa, 1349-017 Lisboa, Portugal
4
LEAF, Instituto Superior de Agronomia, Universidade de Lisboa, 1349-017 Lisboa, Portugal
*
Author to whom correspondence should be addressed.
Sustainability 2019, 11(21), 6081; https://doi.org/10.3390/su11216081
Submission received: 30 September 2019 / Revised: 29 October 2019 / Accepted: 30 October 2019 / Published: 1 November 2019
(This article belongs to the Special Issue Genetic Resources for Sustainable Agriculture)

Abstract

:
Participatory selection—exploiting specific adaptation traits to target environments—helps to guarantees yield stability in a changing climate, in particular under low-input or organic production. The purpose of the present study was to identify reliable, low-cost, fast and easy-to-use tools to complement traditional selection for an effective participatory improvement of maize populations for drought resistance/tolerance. The morphological and eco-physiological responses to progressive water deprivation of four maize open-pollinated populations were assessed in both controlled and field conditions. Thermography and Chl a fluorescence, validated by gas exchange indicated that the best performing populations under water-deficit conditions were ‘Fandango’ and to a less extent ‘Pigarro’ (both from participatory breeding). These populations showed high yield potential under optimal and reduced watering. Under moderate water stress, ‘Bilhó’, originating from an altitude of 800 m, is one of the most resilient populations. The experiments under chamber conditions confirmed the existence of genetic variability within ‘Pigarro’ and ‘Fandango’ for drought response relevant for future populations breeding. Based on the easiness to score and population discriminatory power, the performance index (PIABS) emerges as an integrative phenotyping tool to use as a refinement of the common participatory maize selection especially under moderate water deprivation.

1. Introduction

Conventional plant breeding has been efficient in increasing the yield of most major crops, especially under favorable environments [1]. For example, in the USA, maize yields increased by more than five-fold since 1930, mainly due to the development of uniform hybrid varieties [2]. However, conventional plant breeding was less successful in traditional low-input or organic farming systems in which more severe stress conditions are experienced [3]. In this context, participatory plant breeding (PPB) programs are arising worldwide as an alternative solution [4] to meet the needs of small-scale farmers normally overlooked by conventional breeding. Participatory breeding differs from conventional breeding mainly on the active participation of other actors besides breeders, such as farmers and/or consumers [3,5].
Portugal was one of the first European countries to adopt maize more than five centuries ago, and is characterized by its great diversity of historical maize populations that can still be found under cultivation [3,6]. In this way, Portuguese maize populations (Open-Pollinated Varieties—OPVs) are still evolving and adapting both to the local environment and human uses, namely, to bread production (‘breadability’) [7].
To answer the needs of the Portuguese farmers concerning their maize populations (yield, biotic stress resistance, ‘breadability’, intercropping systems), a successful long-term maize PPB program has been running in Portugal since 1984 [8,9,10]. As part of this program, farmers are encouraged to add simple, low-cost population improvement methodologies to their selection criteria, increasing its efficiency, and allowing them to optimize the use of their own maize populations [6]. Maize populations are subject to stratified mass selection with two parental (male and female) controls at farmers’ fields, in a breeder and farmer partnership, with the farmer establishing the breeding objectives [11]. Selection takes place not only after harvesting, at the storage facilities (considering ear morphological traits) as traditionally applied by the farmer, but also during crop growing before harvest (considering plant architecture ideotype, root and stalk quality traits) [12]. Several improved OPVs were generated by this PPB program [3]. The farmer’s motivation and time availability/field dimensions (the bigger the field, the larger amount of time needed for stratified selection) seem to be the two main limitations for the successful implementation of this participatory approach [11]. Reliable, low-cost, fast and easy-to-use selection tools are needed to attract farmers to these participatory breeding approaches. This PPB program was recently extended to other Portuguese maize OPVs production areas and to organic production systems.
Both Portuguese and foreign farmers [13] are increasingly concerned with climate change impacts. Indeed, the probability of more severe and persistent droughts may increase [14] especially in areas such as the Mediterranean basin. The expected global average annual maize yield loss rate due to drought is about 19%, being the Iberian Peninsula among the areas with the highest maize drought risk [15].
Maize is a crop susceptible to drought [16], and flowering is the most critical period [17]. Irrigation helps to guarantee yield and quality under dry and warm climates, and it has expanded worldwide namely in Portugal, allowing higher yields with for example hybrid varieties. However, irrigation poses increasing pressure on the available water resources in dry regions such as the Mediterranean [18]. Therefore, breeding for higher crop tolerance to drought is imperative for modern agriculture and horticulture in dry and warm areas [19] and for low-input farming systems [20].
Incorporation of tolerance/resistance to drought is becoming an important selection objective of ongoing PPB programs and implies the existence of sources of tolerance/resistance traits and adequate and feasible phenotyping approaches and related technologies [21]. Lower water requirements of some Portuguese maize landraces are among the major reasons given by Portuguese farmers to keep on producing them instead of hybrid varieties [6]. Therefore, traditional maize landraces can be a potential source of genes to develop maize varieties better adapted to drought [22,23]. In addition, the Portuguese maize OPVs have considerable high levels of inter and intra molecular genetic diversity [24,25] which allows agronomical improvement [11]. However, detailed morphological and eco-physiological studies to evaluate their diversity of response to drought are limited [26,27] and few field studies using this national germplasm have been performed [9,10,11,25,28,29].
Selecting for drought tolerance/resistance based on yield is a complicated task due to the complex nature of the trait and its low heritability [30,31,32,33,34]. The task becomes particularly complex for participatory breeding approaches in which selection tools are to be applied directly by farmers.
Leaf/canopy physiological traits complement yield-based selection and may help to improve selection response (genetic gain) because of their higher heritability under drought conditions. Nevertheless, this is only valid when those traits have enough genetic variability and are genetically correlated with yield [35]. Leaf gas exchange parameters (e.g., net photosynthesis—An or stomatal conductance to water vapor—gs) are eco-physiological traits that can help to more robustly assess crops’ physiological condition and evaluate the effect(s) of genetic variability in response to stress [36,37]. Indeed, leaf gas exchange together with cell turgescence and growth (plant elongation) are among the most sensitive and primary processes affected negatively by drought, being reduced for example by lower relative water content (RWC) and water potential [38,39]. In turn, stomata guard cells are highly sensitive to water stress. Closure of stomata under water stress conditions reduces transpiration and related leaf evaporative cooling, which results in a higher leaf temperature (Tleaf) [40,41,42]. The inverse relationship between Tleaf and gs allows to estimate gs on the basis of Tleaf measurements [42] as it has been previously shown in maize [27,43,44]. Tleaf is a remote and non-destructive selection parameter that can be useful to phenotype and identify outstanding genotypes under stress conditions [21,45]. Another, non-destructive and low-cost parameter for drought resistance selection is leaf color. The so-called ‘stay-green’ character can translate leaf longevity and indirectly plant’s photosynthetic capacity along the growing cycle [46]. The stay-green indicates reduced rates of senescence, higher tolerance to post-flowering drought and stalk lodging, resulting in a competitive advantage of ‘stay-green’ genotypes under dry conditions [46,47]. Chl a fluorescence has also become a popular method to detect plant stress [48,49]. Low-cost devices are now available in the market which promotes the usage of fluorometry. Parameters such as maximum quantum yield of PSII (Fv/Fm) and vitality indices, e.g., performance index expressed on absorption basis (PIABS), were also successfully applied to distinguish genotypes response to stress (e.g., Medicago truncatula and Lathyrus sp.) [50,51].
In this study, we combined field and controlled conditions experiments to assess: 1) the best phenotyping criteria to refine ongoing participatory maize breeding strategies to select for drought or tolerance under field conditions, and 2) the existence of genetic variability within traditional maize landraces for drought response, allowing a stratified selection of individual genotypes better adapted to dry conditions. We compared the response to progressive water deficit imposition by water withholding of different maize OPVs, monitoring morpho-physiological parameters, either by remote (e.g., thermal imaging) or contact (Chl a fluorescence) sensors. We further validated these measurements using individual leaf gas exchange.

2. Materials and Methods

2.1. Plant Materials

Seeds from four maize OPV populations, ‘Fandango’ (FN), ‘Pigarro’ (PG), ‘Caniceira’ (CA) and ‘Bilhó’ (BL), were provided by Escola Superior Agrária de Coimbra (ESAC, Portugal) and used in this study (Table 1).
PPB OPVs seeds have been multiplied under the same edaphic-climatic conditions within the PPB program (‘Pigarro’ from 2017 mass selection, and ‘Fandango’ from 2016 mass selection). Seeds from farmer’s OPVs were obtained directly from the farmers in the same year of the trials. Seeds were kept in cold storage (4 °C) until sowing. The ‘Pigarro’ and ‘Fandango’ populations are both OPVs selected through the Portuguese participatory maize breeding program, known to maintain genetic diversity of maize populations [25]. ‘Pigarro’ is a white flint type FAO 300 cycle, with high kernel-row numbers (18 to 28) and selected from a traditional Portuguese landrace [28]. ‘Fandango’ is a yellow dent type FAO 600 cycle synthetic composite, selected from the intercrossing of 77 yellow, elite inbred lines (dent and flint; 20% Portuguese and 80% American germplasm), with big kernel-row number and large ear size [9]. Although with different genetic background, these two populations have high genetic diversity and high bread-making ability [24,25]. ‘Caniceira’ and ‘Bilhó’ are two OPVs representative of the Portuguese farmers’ maize populations still under production and considered to be genetically heterogeneous and distinct from each other [25]. These two OPVs are both white, flint type, FAO 200 cycle, collected directly from their producing farmers and were only subjected to traditional farmer’s selection (not yet included in the PPB program). The ‘Caniceira’ and ‘Bilhó’ OPV populations were selected at different altitudes, in two different eco-geographic conditions and contrasting water availability. In Portugal, higher altitude cultivation is associated with lower water availability, which may have allowed development of more adapted landraces to drought. ‘Bilhó’ is still in production at 800 m altitude at Travassos site, Portugal (41°25′24″ N, 7°50′39″ W), and ‘Caniceira’ at 65 m altitude at Tocha site, Portugal (40°30′86″ N, 8°75′45″ W).

2.2. Experimental Setup

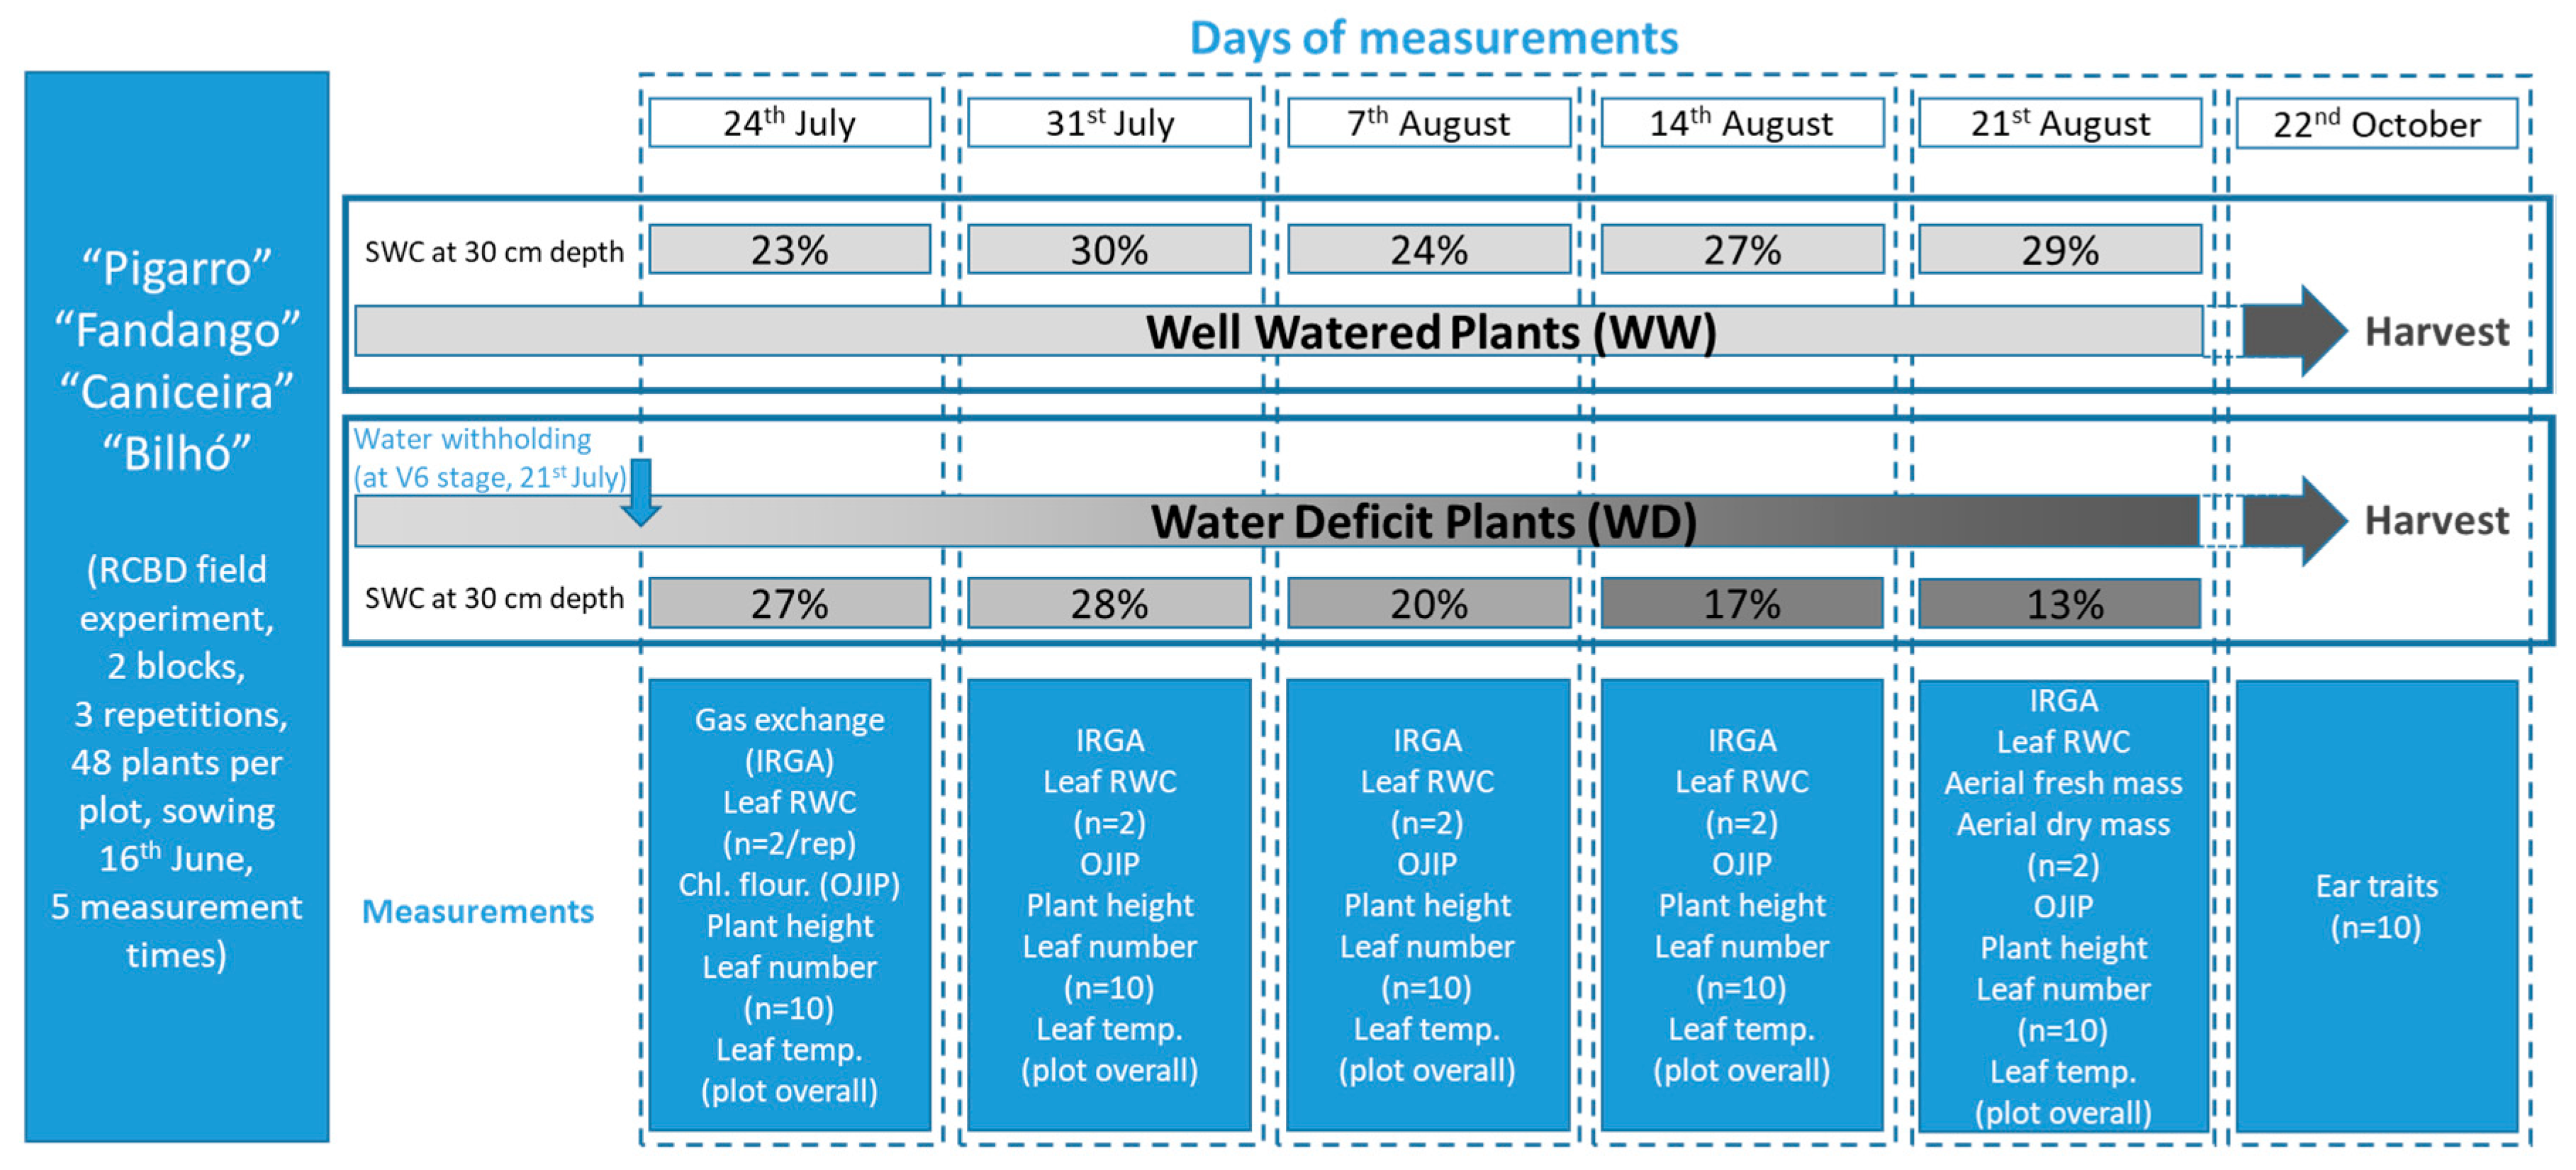
2.2.1. Field Conditions

A field trial to evaluate the effect of water deficit around flowering time, was established at Coimbra, Portugal (40°13′0.22″ N, 8°26′47.69″ W, 25 m altitude), with the four different maize OPV, ‘Pigarro’, ‘Fandango’, ‘Caniceira’ and ‘Bilhó’. This site is part of the Mondego River irrigation perimeter, a very high-yielding maize area where the average maize hybrids yield is 14.5 t.ha−1 [52]. Soils have an alluvial origin and are characterized at 0–20 cm and 20–40 cm, respectively, by a pH of 5.65 and 5.75. Regarding soil texture, the percentage of soil with a particle size less than 0.2 mm diameter was 83.4% and 82.8%; and a high content in organic matter (2.91% and 2.55%). A compact layer at 40 cm deep exists, restricting root development below this depth. A randomized complete block design, with three replications, was applied, with a total of 24 plots. Each plot consisted of three rows of plants (4.3 m long with 0.75 m between rows). Sowing occurred on 16th June 2018. Plots were overplanted by hand and thinned at the six-leaf stage [53] for a final stand of about 50,000 plants per ha. Plots were mechanically and/or hand-weeded as necessary and managed according to common organic agricultural practices for maize in the region. All plants were drip irrigated before water stress imposition on the 21st July. After that, only the Well-Watered (WW) treatment was irrigated as needed in order to maintain about 30% Soil Water Content (SWC) at 30 cm deep and more than 30% SWC beyond 30 cm depth, measured by TDR (time-domain reflectometer, Delta-T Devices Ltd., Cambridge, UK) (last WW irrigation on the 31st August). The irrigation volume applied under WW conditions since the beginning of June until end September was 533 mm. Under water-deficit (WD) conditions this value was only 30 mm. Total rainfall during the same period was 108 mm. During the same period, the average maximum temperature was 28 °C and the average minimum temperature was 16 °C. Relative humidity (RH) varied between 56% and 97% (Figure 1). Several morphological and eco-physiological parameters (see section “Measured parameters” for more details) were measured at five different moments along water stress imposition period (from V6 until R1 phenological stages) (Figure 2). Harvest was done by hand on 22nd October 2018, and several ear traits were assessed.

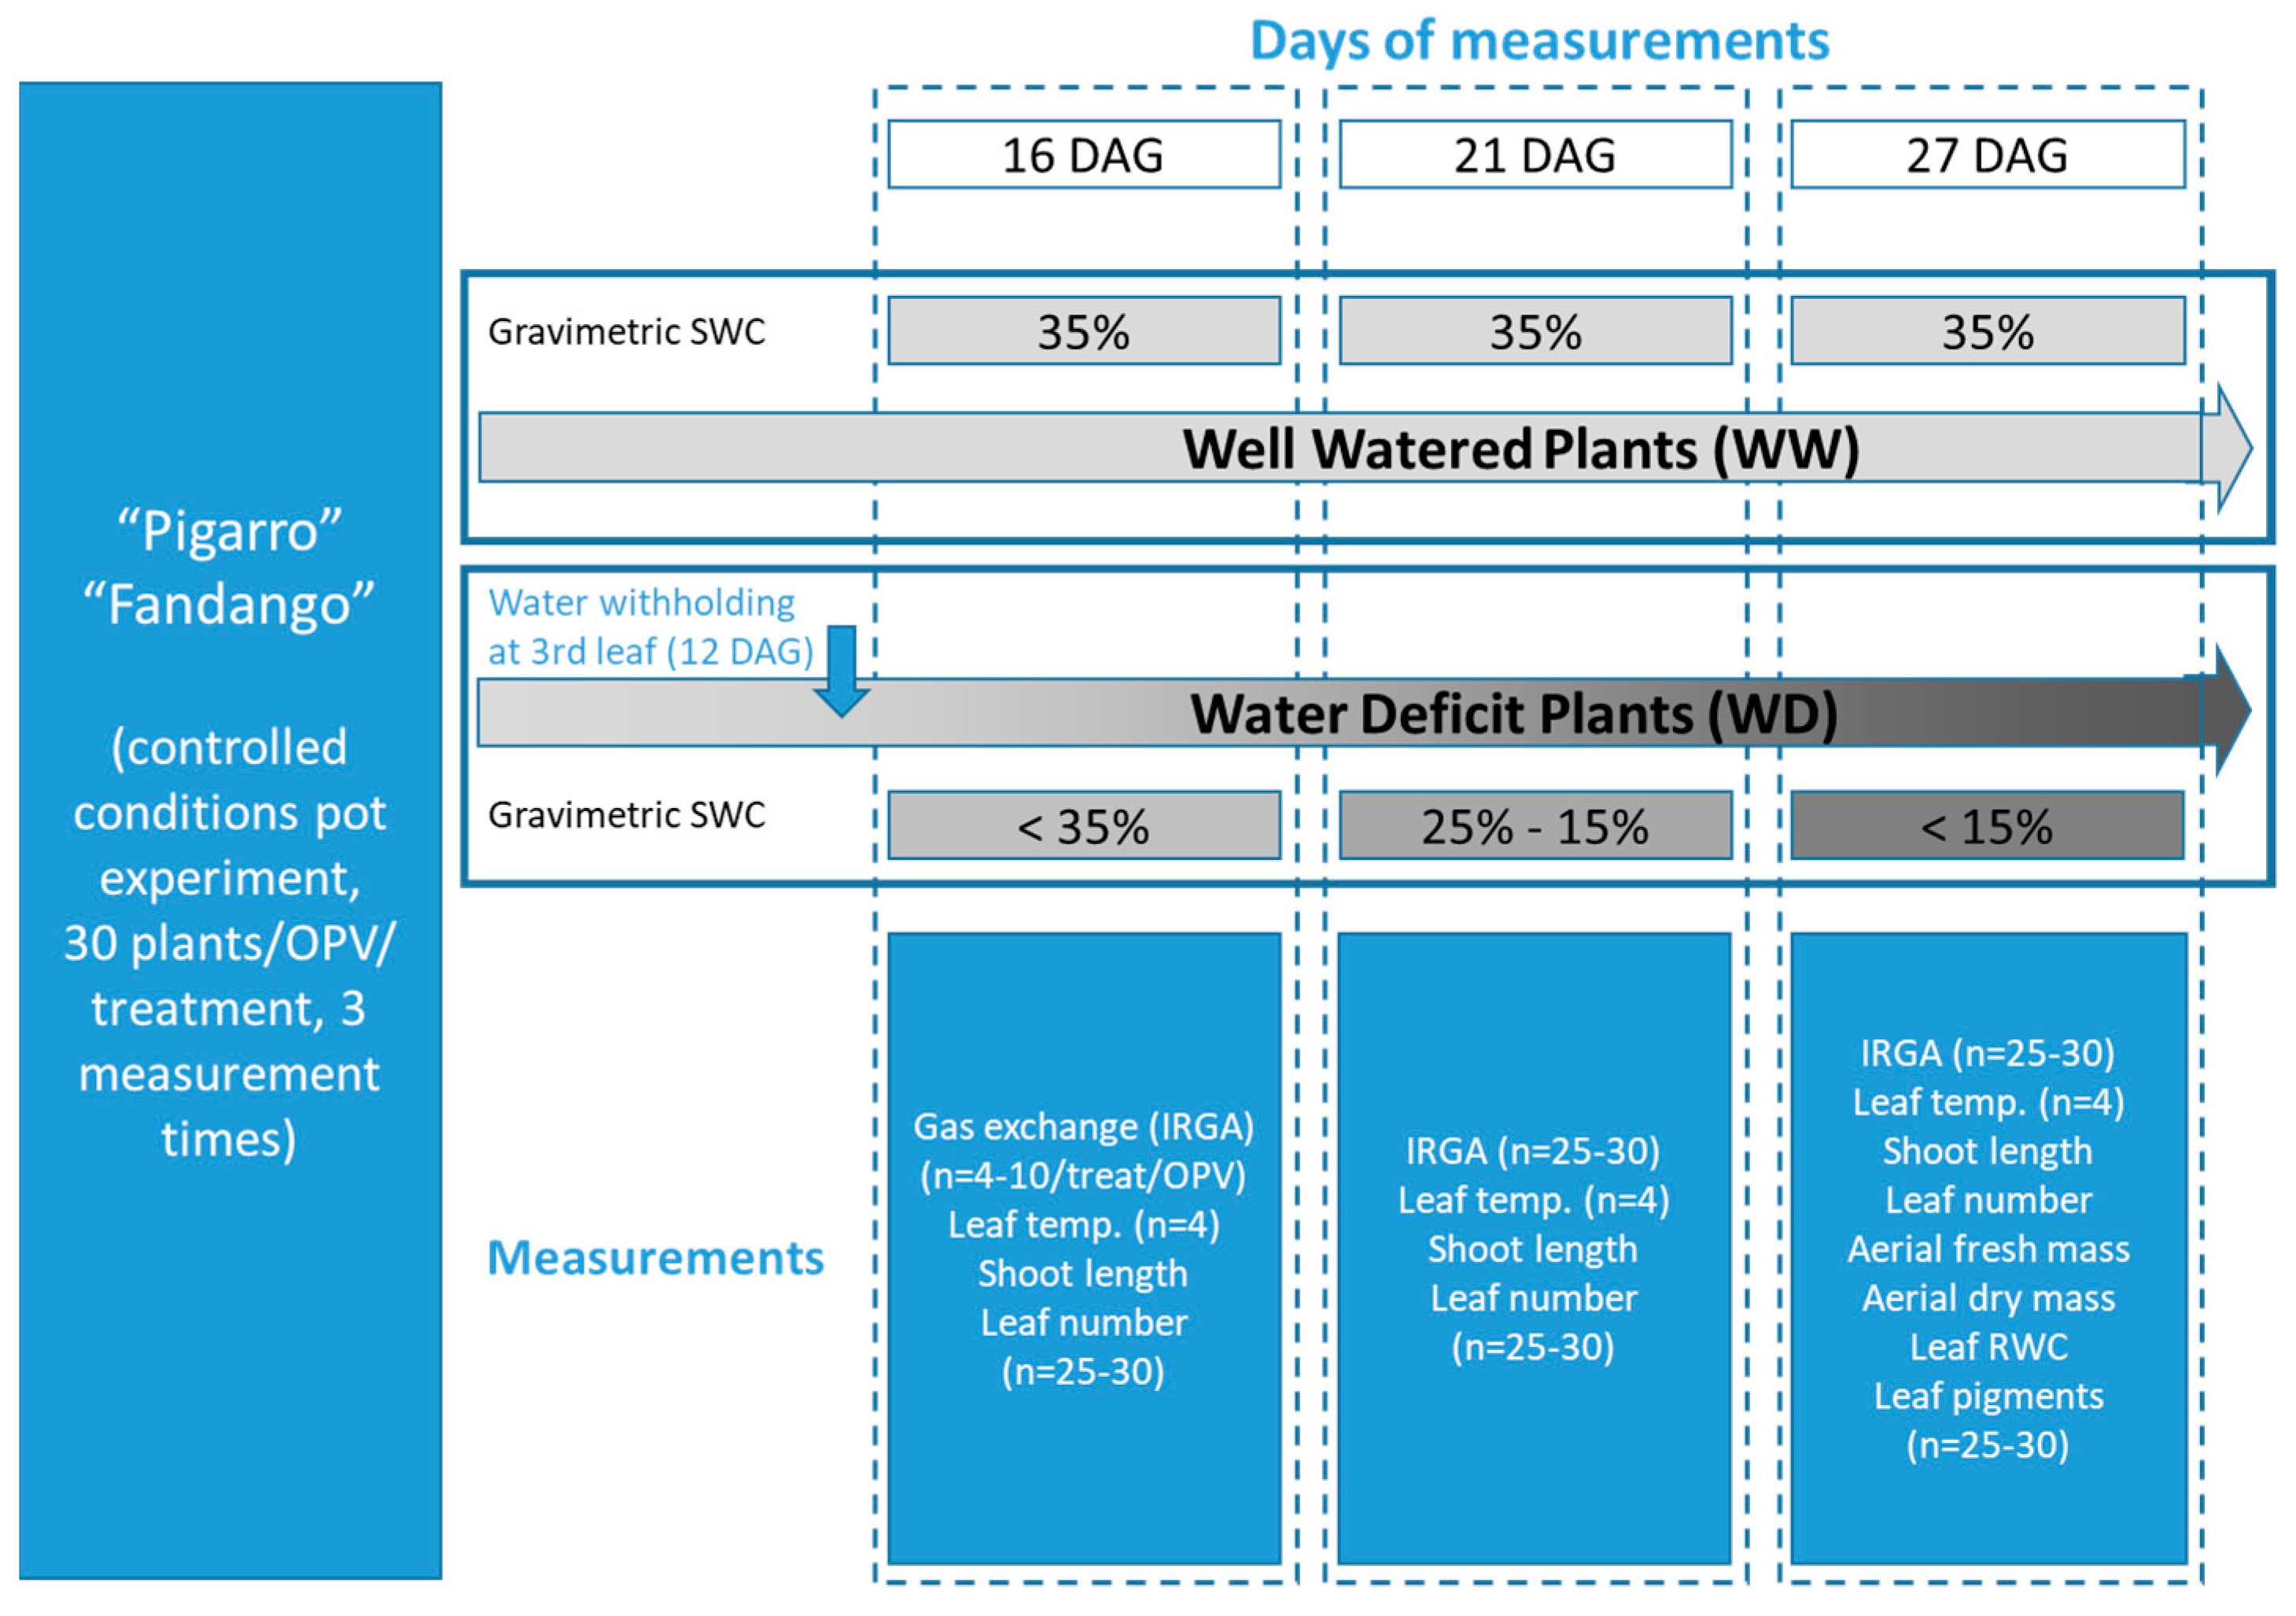
2.2.2. Growth Chamber Conditions

In this trial, only the ‘Fandango’ and ‘Pigarro’ maize OPVs were used, which were the ones showing the highest yields under field-grown conditions (data from the field conditions experiment, present study). Seeds of both OPVs were disinfected in distilled water with 10% of commercial bleach plus detergent (Domestos) mixture for 10 min. Seeds were then washed several times with distilled water to remove traces of disinfectant solution. At least 60 seeds per population were pre-germinated onto Petri dishes with wet filter paper, and placed into a dark growth chamber during 72 h at 25 °C. Individual seedlings (one per pot) were transferred to plastic pots (0.7 dm3) filled with a substrate mixture composed of soil, turf, and vermiculite (2:1:1). A total of 120 seedlings (60 individuals for each population) were grown in a ‘walk-in’ growth chamber (2.96 m2 of area) organized into two separated growing benches (0.74 m × 2.00 m). A different water treatment was allocated to each bench. Day/night air temperature was set at 26/20 °C, with a 47/60% day/night RH and a 12 h photoperiod. Light intensity at plant level was 230–260 µmol m−2 s−1 provided by LEDs (LumiGrow, Pro325Tm). All pots were irrigated until seedlings reach the V3 phenological stage. At this stage, seedlings of both OPVs were divided into two experimental groups. One group corresponded to the plants that were kept well-watered (WW, control treatment) and another group to the plants that were subjected to water withhold (WD, water-deficit treatment). For each treatment, at least 30 individuals per population were used. SWC was monitored using a gravimetric method. WW seedlings were irrigated whenever needed to maintain a SWC of 35% throughout the trial. Different morphological and eco-physiological parameters (see section “Measured parameters” for more details) were measured at three different times during stress imposition, more precisely 16, 21 and 27 days after germination (DAG) (Figure 3). Germinated seeds were transferred to pots on the 1st February 2019, and the last measurements taken on the 28th February 2019.

2.3. Measured Parameters

2.3.1. Soil and Substrate Water Content

SWC under field conditions was measured 11 times along the experiment using the TDR (time-domain reflectometer) profile probe model PR 2/6. Six tubes for the access of TDR probe were installed randomly in the field trial (three under WW conditions and three under the water withhold treatment). SWC profiles were determined with 10 cm of interval up to a maximal 40 cm depth and 20 cm of interval up to 100 cm depth (10, 20, 30, 40, 60, 80, and 100 cm depth) along the experiment. The principle of TDR measurements of soil water content is based on the strong correlation observed between relative dielectric permittivity of wet soil and its volumetric water content [54,55,56,57,58]. Under controlled conditions, the SWC was determined by a gravimetric method described as follows. Pots were watered until 100% field capacity, left to drain for 2 h and then weighed to estimate the 100% SWC. To estimate the 0% SWC, pots were let to dry completely in an oven at 70 °C until the weight was constant. SWC along the trial was monitored by weighing pots and expressing their weight as a percentage of field capacity weight.

2.3.2. Individual Leaf Gas Exchange

A portable Infra-Red Gas Analyzer (IRGA) system (LCpro+, ADC BioScientific Ltd., Hertfordshire, UK) was used for leaf gas exchange measurements under both field and chamber conditions. Stomatal conductance to water vapor (gs), net CO2 assimilation or net photosynthesis (An), and transpiration rate (E) were measured. An (µmol CO2 m−2 s−1), E (mol H2O m−2 s−1), and gs (mol H2O m−2 s−1) values were further used to estimate the instantaneous Water Use Efficiency (WUE: An/E). Leaf gas exchange measurements were registered every 60 s at each condition to ensure stable measurements and values were corrected to the effective leaf area enclosed in the leaf chamber when needed.
Measurements under field conditions were done between 10:00 and 15:00 solar time, in all the five observation dates, on two plants per repetition (selected among the ones used for Chl a fluorescence and morphological monitoring). The sixth fully expanded leaf was used in leaf gas exchange measurements. Leaf chamber conditions were set at 27 °C, 370–380 ppm of CO2 and a light intensity of 1739 µmol m−2 s−1. Air flow rate was set at 200 µmol s−1. Measurements were done after allowing leaves to adapt for 1–2 min inside the leaf chamber.
For the trial in the growth chamber, rapid light response curves (An/I curves) were established for the two populations subjected to WW and WD conditions at 16, 21 and 27 DAG. Light response curves were made by subjecting leaves to a sequence of decreasing stepwise light intensities during 2–3 min: 1739, 1304, 1044, 869, 652, 217, 86, 0 µmol m−2 s−1. Light intensity was set and applied by an external LED light unit (ADC BioScientific Ltd., Hertfordshire, UK). Beside light intensity, leaf chamber conditions were set at 23 °C and atmospheric CO2 conditions (370–380 ppm) Air flow rate was set at 200 µmol s−1. Three to five plants per population and treatment were measured at each time point. From the plotted curves, Amax was estimated as the highest An value measured and the light intensity at which it occurs defined as the light saturation point (LSP). The photosynthetic apparent quantum yield (ɸ) was estimated as the initial slope of the An/I curve, the intercept with the y-axis estimated the rate of dark respiration (Rd), the apparent light compensation point (LCP) as the light value at which the rate of CO2 fixation by photosynthesis is similar to the rate of CO2 released by respiration and photorespiration as described in Reference [59]. Complementary instantaneous leaf gas exchange measurements were done at saturating light (1044 µmol m−2 s−1) on 27 DAG, using the fourth fully expanded leaf. Measurements were done after allowing leaves to adapt for 10 min inside the leaf chamber. Leaf area correction was done whenever the leaf area was smaller than the leaf chamber of the IRGA.

2.3.3. Plant Water Status

Plant water status was assessed by measuring leaf Relative Water Content (RWC), in accordance with Čatský’s work [60]. Under field conditions, measurements were done at each of the five measuring days, in two plants per repetition whereas under chamber conditions all plants were measured at the end of the trial (Figure 2 and Figure 3). Three leaf discs, of 0.636 cm2 each, were excised from the leaves. RWC was estimated as [(FW − DW)/(TW − DW)] × 100, where FW is the fresh weight of the discs, TW is the turgid weight after overnight rehydration of the discs, by floating in distilled water, in the dark, at 24 °C. The dry weight (DW) of the discs was obtained after oven-dried at 80 °C until a constant weight was achieved.

2.3.4. Leaf Temperature

At controlled conditions, infrared thermal images were obtained by using a ThermaCam B20 camera (FLIR Systems Inc., Wilsonville, OR, USA) equipped with an uncooled 320 × 240 microbolometer matrix detector in the 7 to 13 mm band, with an emissivity (ε) set at 0.96. Background temperature was determined by measuring the surface temperature of a crumpled sheet of aluminum foil positioned near the leaves of interest with an ε = 1.0 [61]. Thermal images were taken from the top of plants, at a distance of about 1.6 m (Figure 4). Two trays with 4 plants were imaged at each time. The leaf temperature (Tleaf) was measured (in °C) as the average of 4 plants, using 2–3 region of interest (ROI) per plant, for each maize population and treatment (Figure S1). Images were analyzed with the imaging analysis software ThermaCAM Researcher (FLIR Systems, Inc., USA) by selecting 2–3 leaves/plant using the function area tool to select each respective ROI or points in the selected leaves.
At field conditions, we used a FLIR E50bx (FLIR Systems Inc., Wilsonville, OR, USA), 7.5–13 µm, 240 × 180 pixels, with a ε set at 0.96. Measurements were done at five different moments of the trial: 24th and 31st July, and at 7th, 14th and 21st August, between 12:00 and 15:00 solar time. Measurements were done from the lateral side of plants, at a distance of 3 m. In addition, and to have an overview of the full trial and related plant temperatures of both WW and WD maize plants, images were taken at 50 m distance from plants. Images were analyzed with the ThermaCAM Researcher (FLIR Systems Inc., Wilsonville, OR, USA) by selecting ROIs from the aerial part of the plants. The average ROI temperature was considered to estimate the temperature difference (ΔT) between WD and WW plants. RGB images were recorded to support the analysis of thermal images (Figure 4).

2.3.5. Chlorophyll a Fluorescence

Chl a fluorescence measurements were made only under field conditions using a Chl a fluorometer (OS30p+, Opti-Sciences Inc., Hudson, NH, USA) in all of the five measurement days, using 10 plants/repetition (the same tagged for morphological follow up) between 10:00 and 15:00 solar time. The sixth fully expanded leaf was dark-adapted for 30 min by placing light-withholding leaf clips. Leaves were then exposed to a saturating light pulse with sufficient intensity to ensure closure of all PSII reaction centers (actinic/saturating light set to 3500 µmol and modulation light intensity set to 40%: 1400 µmolm−2s−1) for 1 s in order to obtain the OJIP Chl a fluorescence transient rise [51]. The kinetics of the rapid fluorescence rise was recorded and several biophysical parameters, such as PIABS and Fv/Fm automatically computed [62].
The performance index, expressed on absorption basis (PIABS), is an integrative indicator of the main photochemical processes function such as absorption and trapping of excitation energy, electron transport further than primary quinone and dissipation of excess excitation [63]. The Fv/Fm is the maximum quantum efficiency of PSII and is a commonly used parameter to assess stress [51,64].

2.3.6. Leaf Photosynthetic Pigments

Chl a (Chla) and b (Chlb), and carotenoids (carotenes and xanthophylls) (Ccx) were quantified only for controlled growing conditions, on the last measurement day (27 DAG). Two leaf discs with a total area of 1.27 cm2, were excised after leaf gas exchange measurements. The discs were immediately submerged in 95% ethanol and kept in the dark at 4 °C until full extraction of pigments. The absorbance of the extract was measured at 470 nm, 648.6 and 664.1 nm in an Ultrospec 4000 UV-Visible spectrophotometer (Pharmacia Biotech, Cambridge, UK), and the concentrations of Chla, Chlb, and Ccx (all in g cm−2) estimated according to Reference [65]. The sum of Chla and Chlb, their ratio, and the ratio between the sum of chlorophylls (TChl) and carotenoids [(Chla + Chlb) /Ccx] were subsequently calculated.

2.3.7. Growth and Morphology

Plant growth was assessed under field conditions by measuring plant stem height (PH (cm)) from the stalk basis to the last leaf insertion before the tassel, and the number of leaves per plant (LN) (both in 10 plants per replication, tagged in the plot middle row) at each of the five measuring dates. We also measured the fresh (FB (g)) and dry aerial (DB (g)) biomass (two plants/repetition) at the last measuring date (21st August). For DB calculation plants were dried over 18 days in an oven at 40 to 45 °C (Memmert Model UFE 800, Memmert GmbH+Co. KG, Germany) until constant weight. We monitored the same two plants used for IRGA measurements (Figure 2). After harvest, ears were dried at 30–35 °C in an oven (Memmert Model UFE 800, Memmert GmbH+Co. KG, Germany) until a ∼15% in moisture was reached. Several ear traits (ear weight (EW (g)), ear length (EL (cm)), 1000 kernel weight (TKW (g)), n° of kernels/ear row (KNR)) were recorded in each plot, on 10 ears per repetition when applicable.
Under chamber conditions, growth was monitored by measuring shoot elongation (shoot length (SL (cm))) and by counting leaf number at each of the three measuring dates (leaf number (LN)). Plant aerial fresh biomass (FB (g)) and dry biomass (DB (g)) were measured at the end of the trial (Figure 3). DB was determined after subjecting the material to 100 °C drying oven until constant weight.

2.4. Data Analysis

The phenotypic data acquired in both trials (field and controlled conditions) were analyzed independently. Trait data related to leaf gas exchange performance, plant water status, leaf temperature, Chl a fluorescence, plant growth and morphology, and photosynthetic pigments content were subjected to quality control of residuals. Normal distribution was assessed as well as the existence of outliers and homogeneity of variance. Data transformation was applied when needed so that the residuals more closely meet the assumptions of normality. The traits whose values were transformed were re-coded by adding the suffix ‘tran’ (if Box-Cox transformed) or ‘sqrt’ (if squared root transformed) to the initial code label (Table S1).
To test how the two imposed water regimes would affect the different maize populations under study, a univariate analysis of variance using the generalized linear model (GLM) framework, with the identity link function and a normal distribution as the probability distribution, was conducted. The statistical model included a constant, the populations, the treatment and their interaction (Y = Constant + TREATMENT + POPULATION + (TREATMENT × POPULATION)). Tukey’s post-hoc tests at 95% confidence level were performed to compare the means of the different traits at each experimental condition. In the case of categorical traits (such as leaf number) a non-parametric test (the Mann–Whitney U test) was applied for water treatment effect mean comparison.
Pairwise phenotypic correlations were calculated between traits. Principal components analysis (PCA) on standardized data was subsequently performed to capture global phenotypic variation among the maize populations analyzed, identify outstanding genotypes (especially under controlled conditions where a bigger number of individual plants/population was analyzed) and to extract specific phenotypic traits relevant for the discrimination of agronomic groups. All analyses were performed in Genstat® software (VSN, Hemel Hempstead, UK), 19th edition [66].

3. Results

3.1. Field Trial

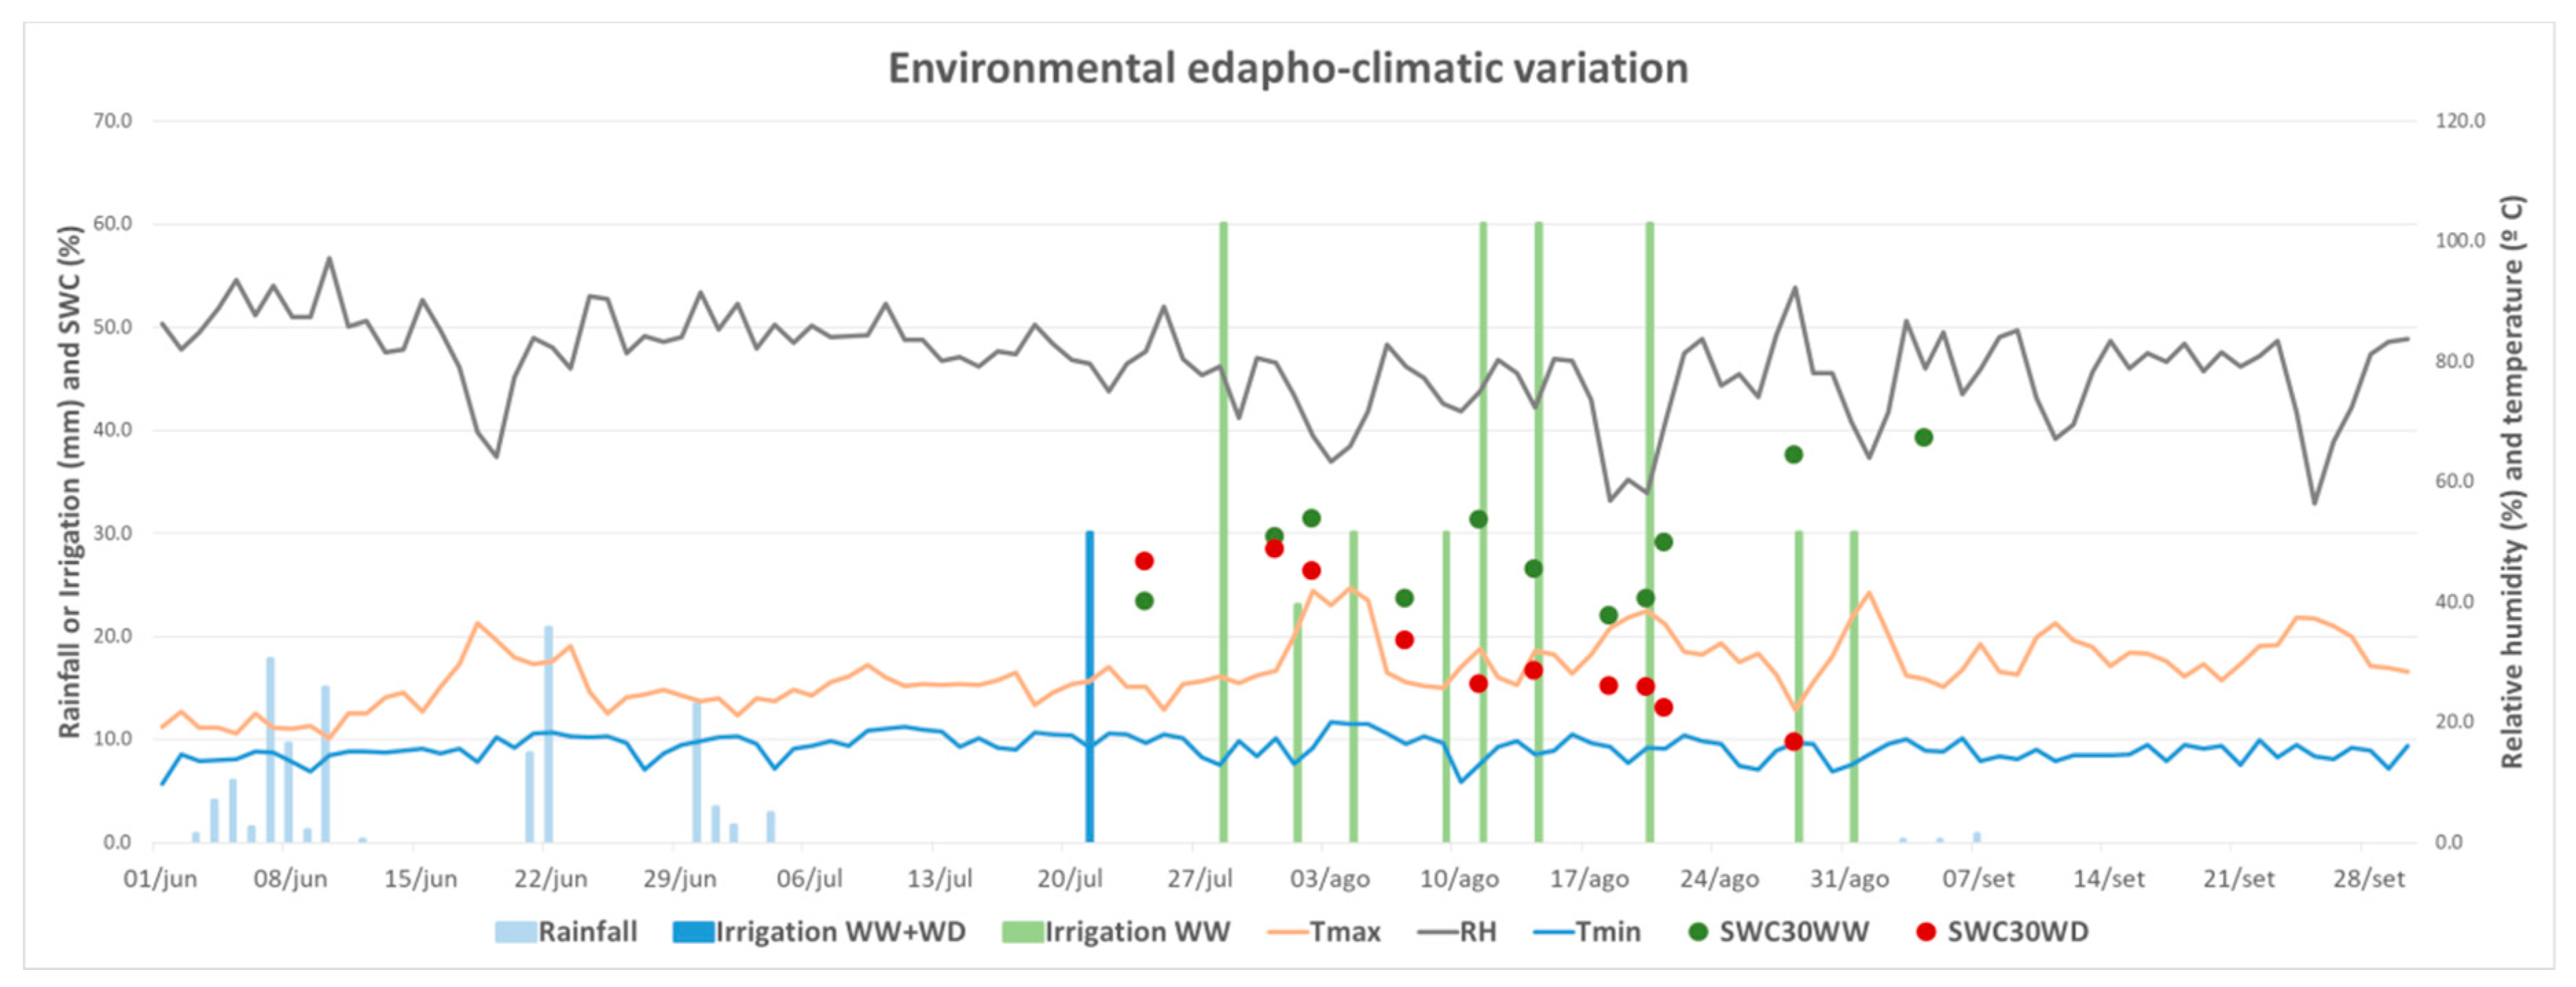
3.1.1. Soil Water Content

The SWC at 30 cm deep in the WD treatment reached 27% on 24th July, 28% on 31st July, 20% on 7th August, 17% on 14th August and 13% on the 21st August as indicated by the TDR measurements. The 30 cm depth has been selected from the water profiles because at 40 cm deep the soil presented a compact layer, which restricts root development and the use of available water at deeper soil layers. During the experiment and on the WW treatment, the SWC at 30 cm was on average 27% (Figure 1).

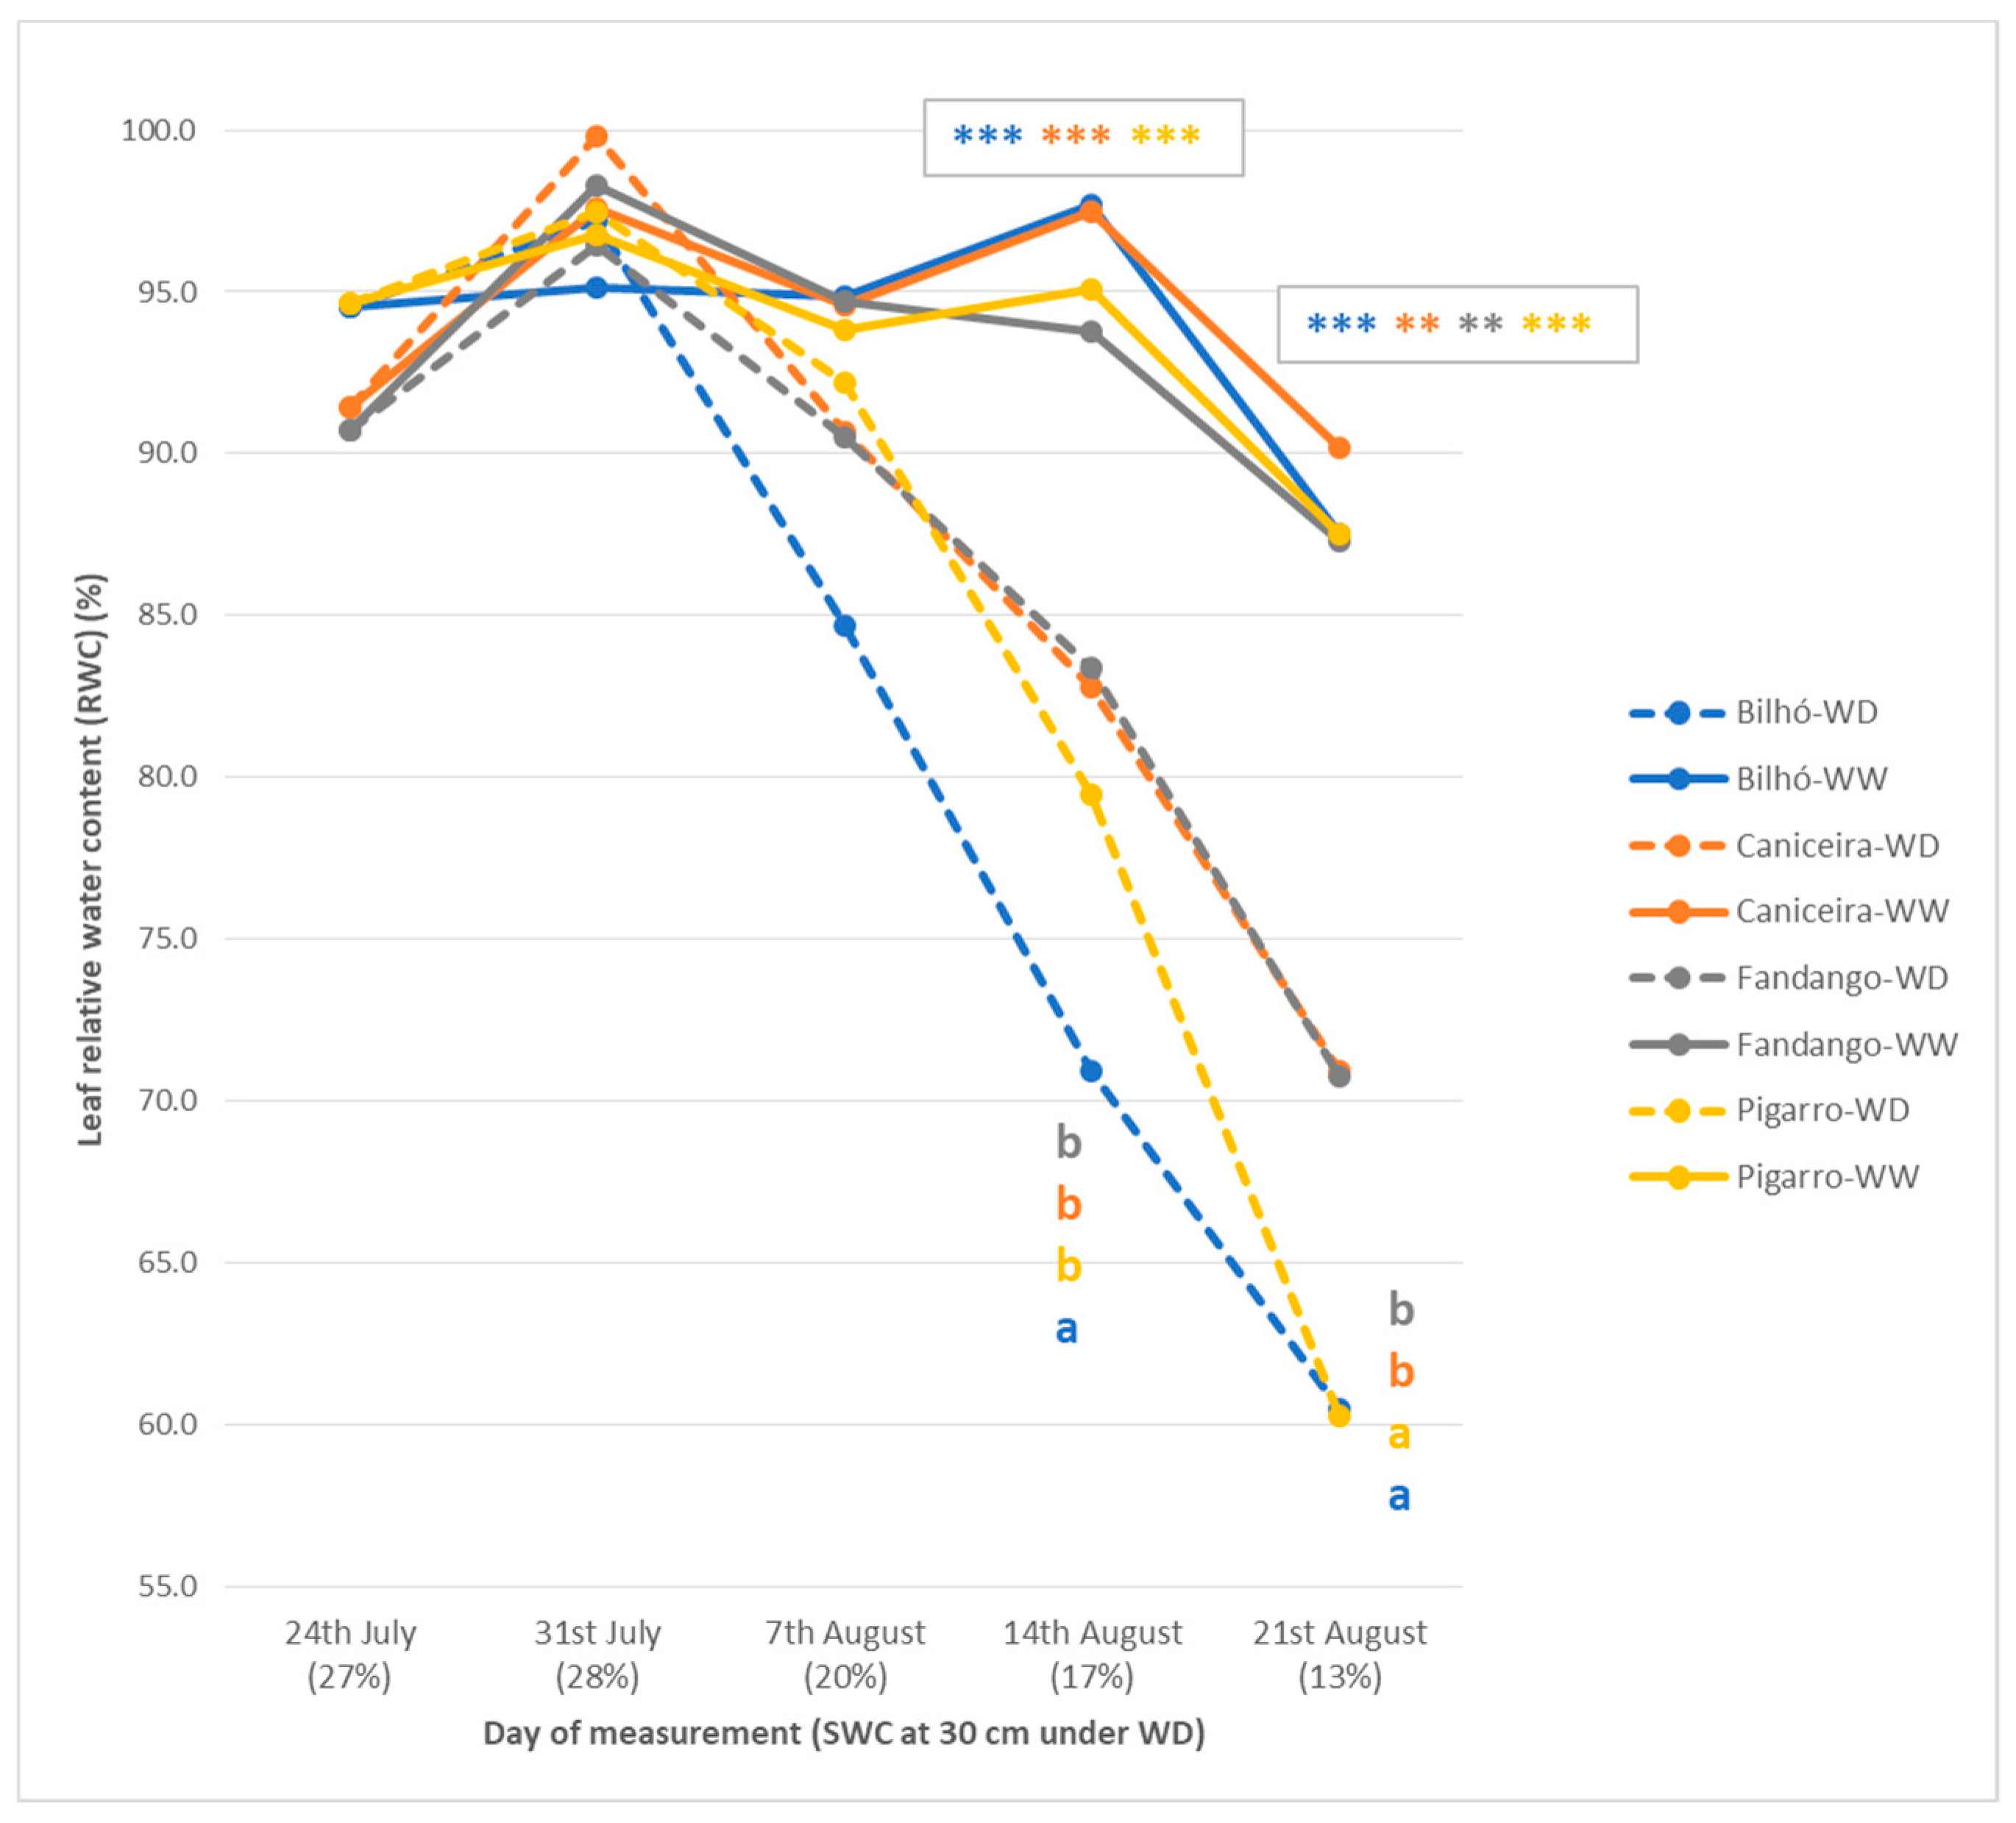
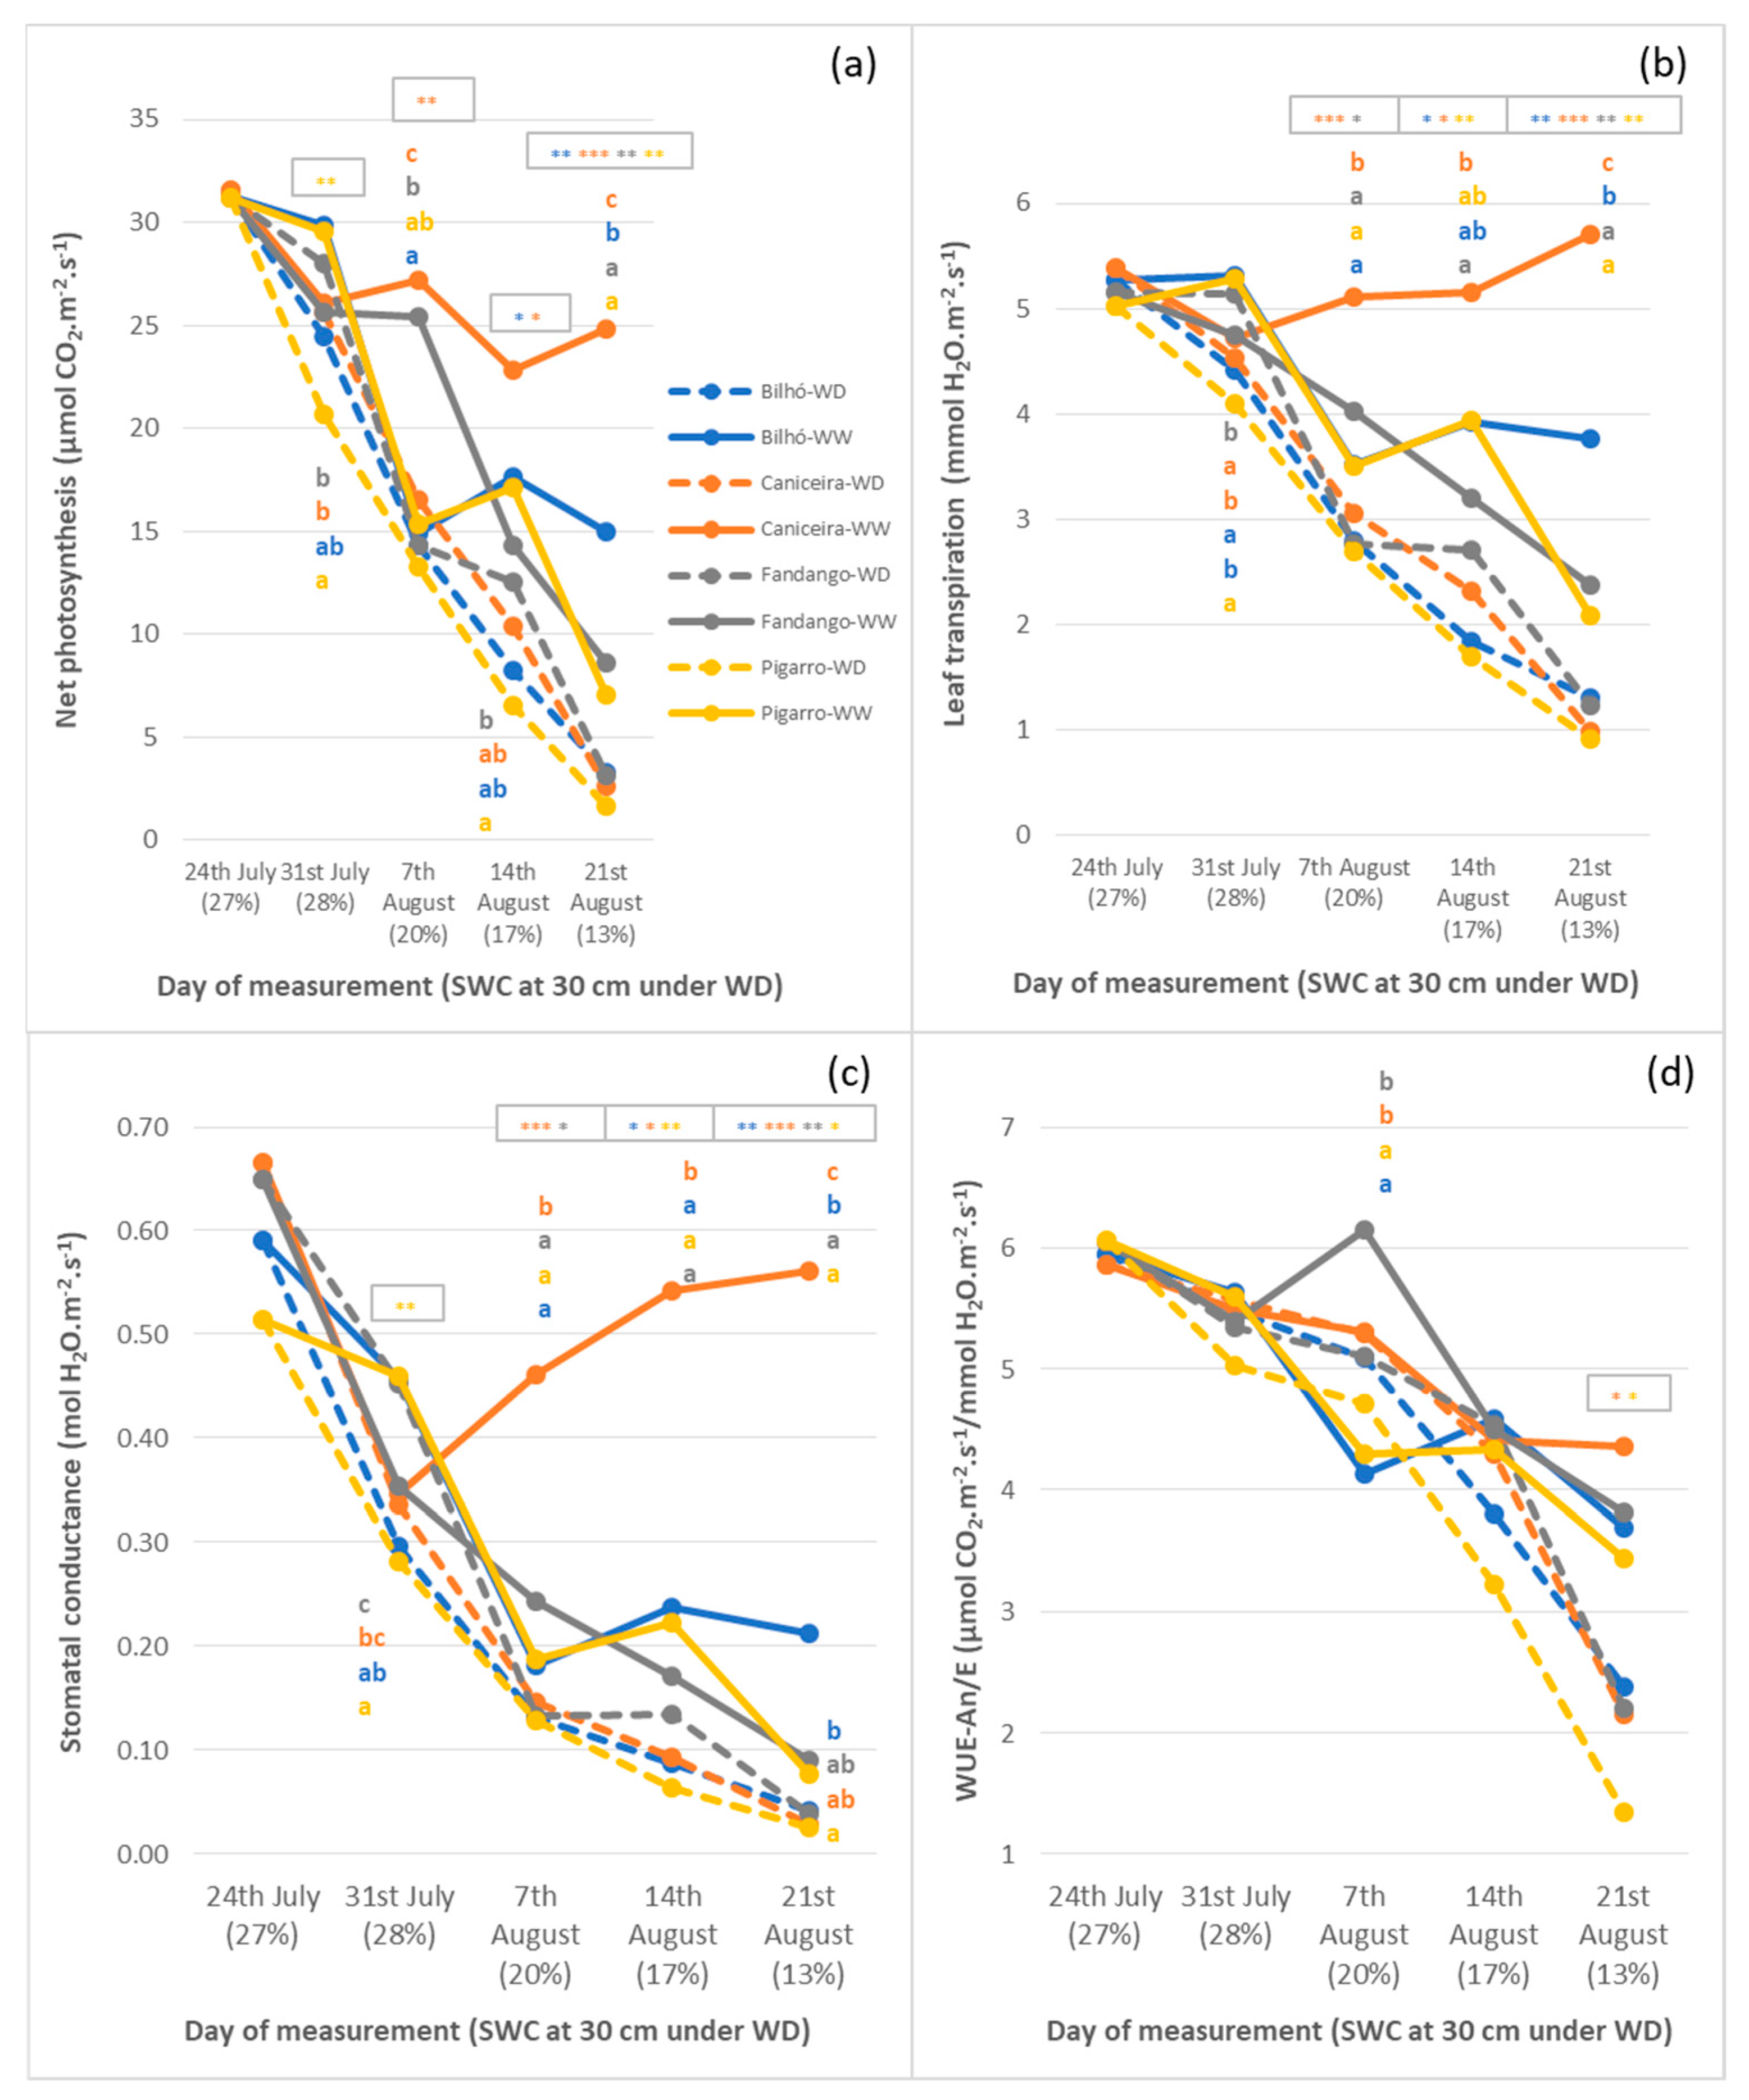
3.1.2. Plant Water Status, Leaf Temperature and Gas Exchange Performance

The imposed water-deficit reduced significantly leaf RWC (visible from 17% SWC) (Tables S2–S5). ‘Fandango’ was the most resilient population, showing only significant differences in comparison to WW conditions at the highest stress level (maintaining under stress 81% of its RWC at WW conditions). ‘Bilhó’ in turn, had the fastest decay in RWC, but at the higher stress level, ‘Pigarro’ showed similar reduction (69% of its RWC at WW conditions) (Figure 5).
Tleaf was up to 2.5–2 °C higher in WD plants under field conditions (Figure S2) but maize complex architecture on adult plants posed limitations on the use of thermography to distinguish different populations subjected to water deprivation. At a mild water stress imposition (20% SWC) it was possible to observe a simultaneous negative effect on An, E, gs as compared to control conditions (Tables S2–S5). This was especially the case of the ‘Caniceira’ population (with 60% of An, 60% E and 32% gs at 20% SWC as compared to WW conditions). The leaf RWC of ‘Caniceira’ was quite stable and was kept around 90% at this SWC (20% SWC). ‘Caniceira’ also had the highest gas exchange parameters values throughout the experiment under WW conditions (Figure 6).
Under more severe water deficit (17% SWC) only ‘Fandango’ was able to keep its leaf gas exchange parameters similar to the control. At the most severe stress (13% SWC) the four populations have similar An, E and WUE (Figure 6, Tables S2–S5). However, only under these extreme stress conditions, we were able to find a significant effect on WUE values for ‘Caniceira’ and ‘Pigarro’ with a steeper decrease (49% and 39% respectively) as compared to WW conditions.

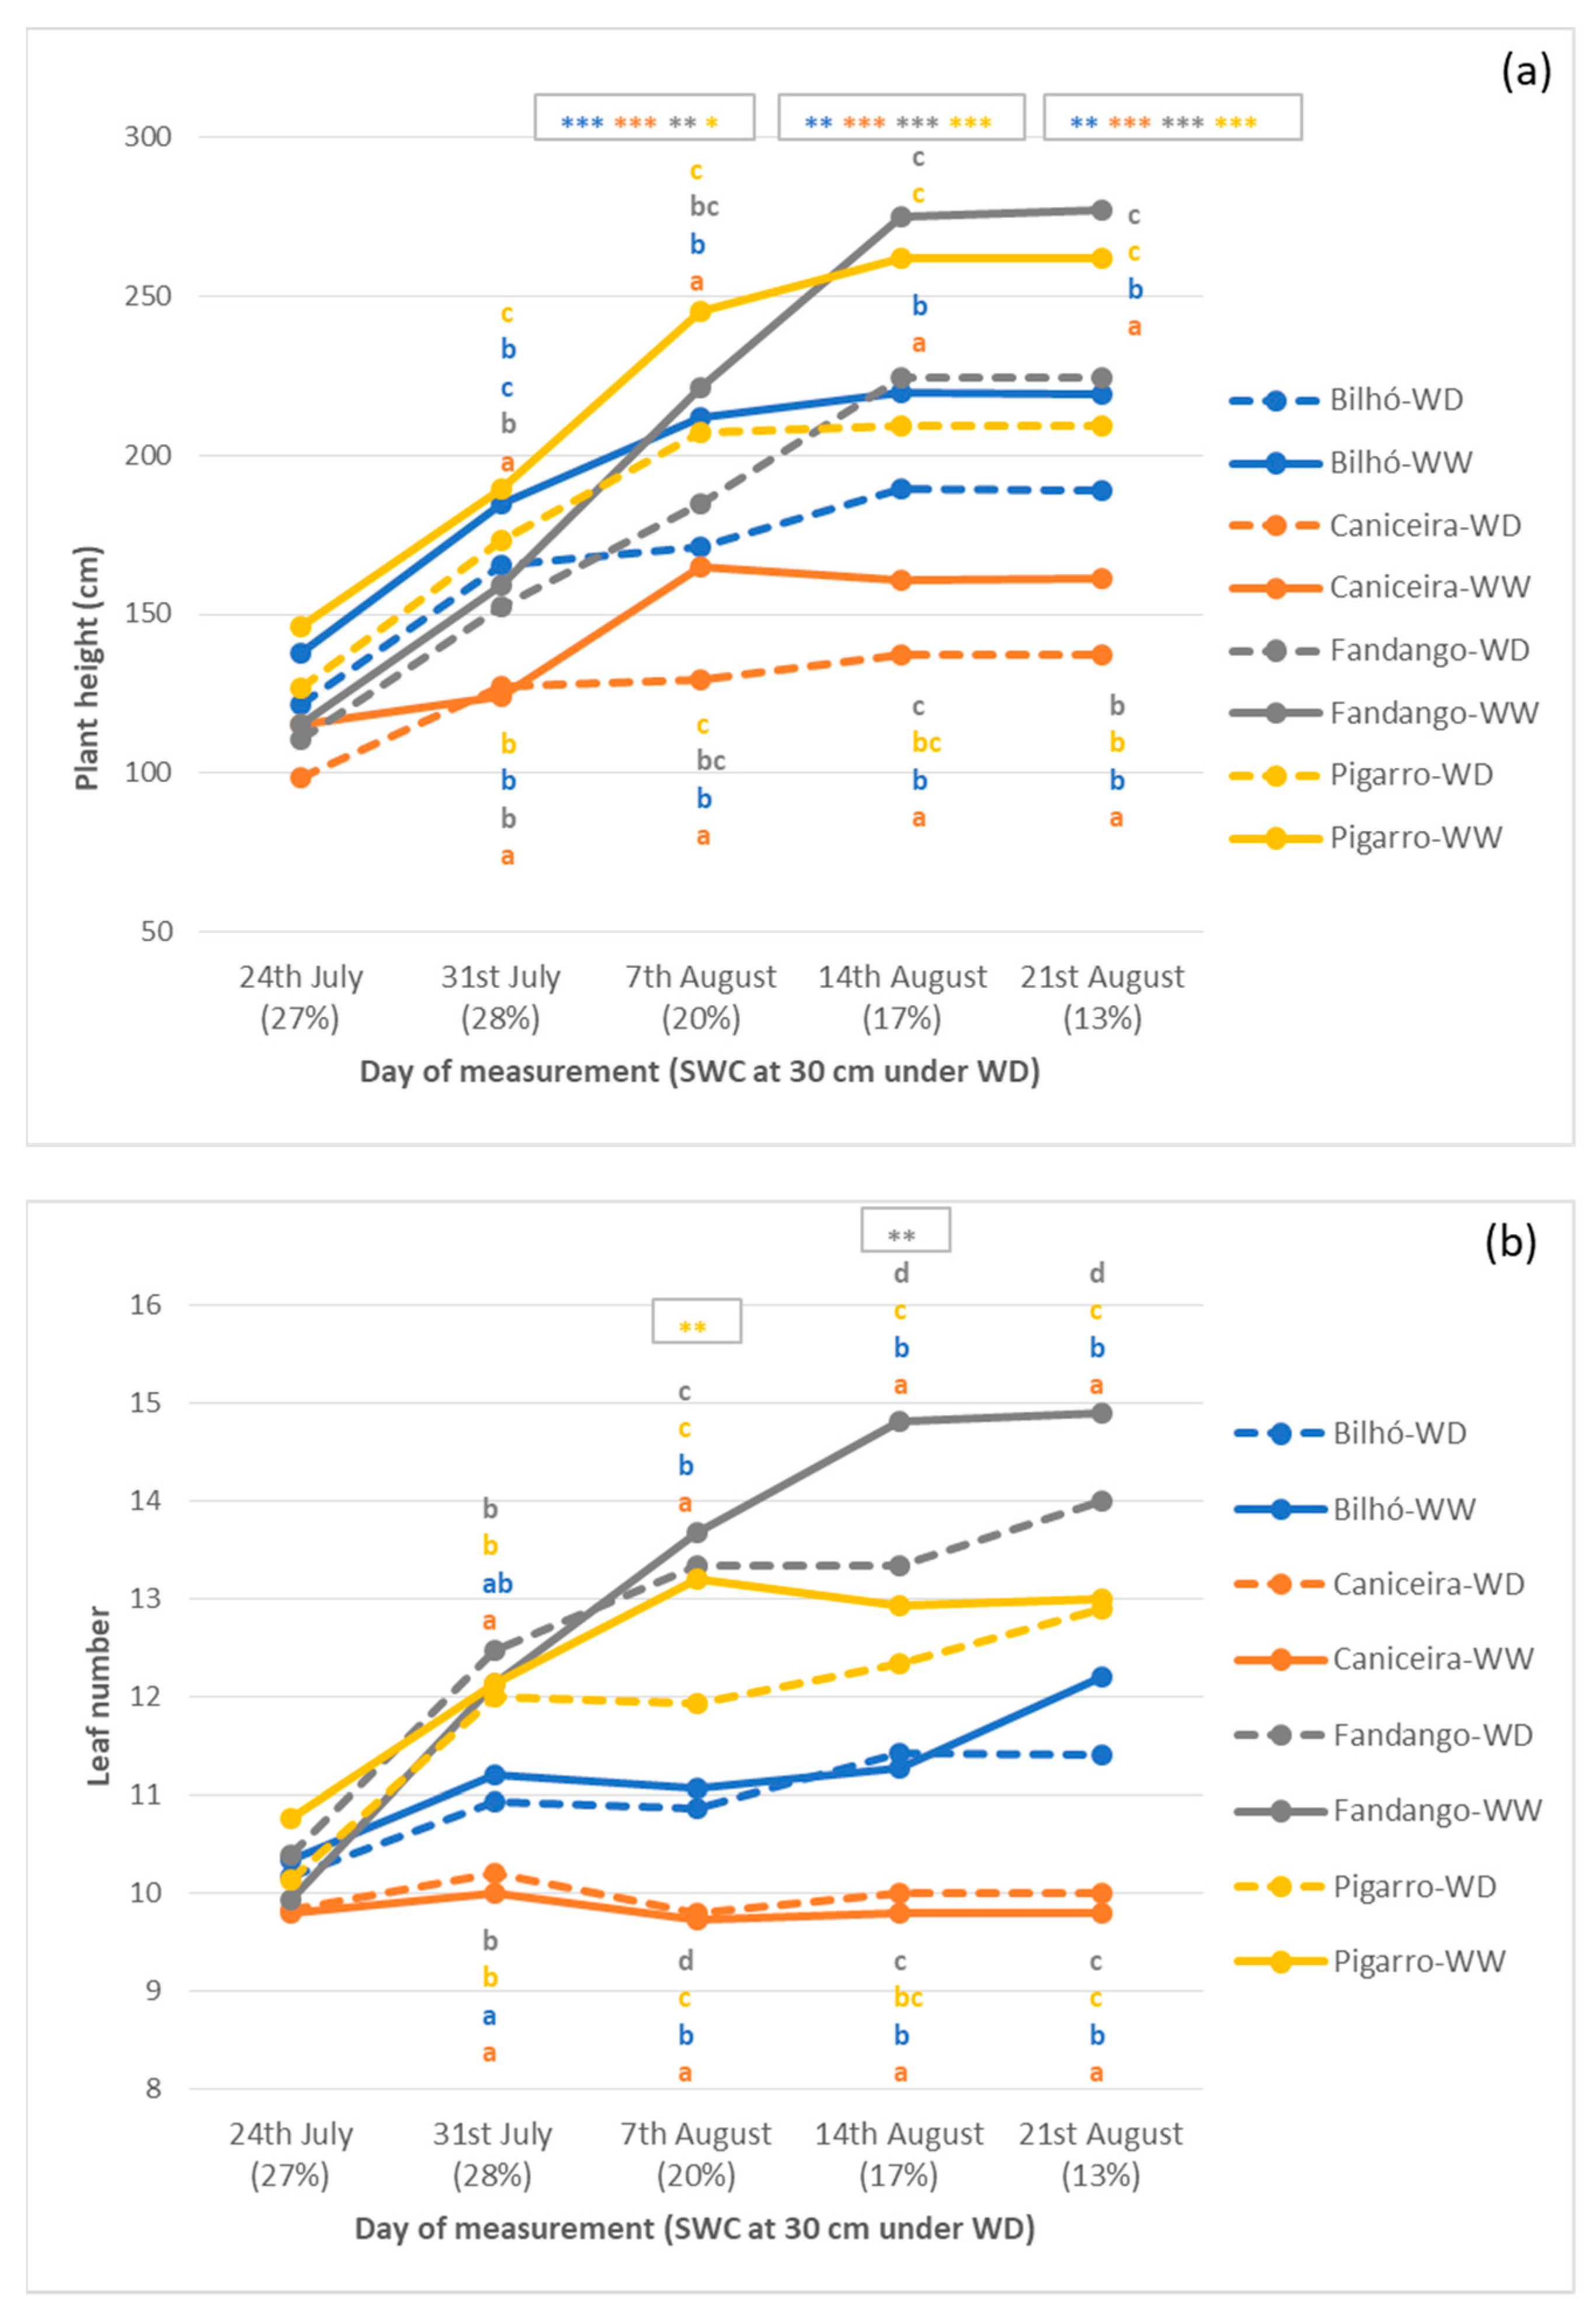
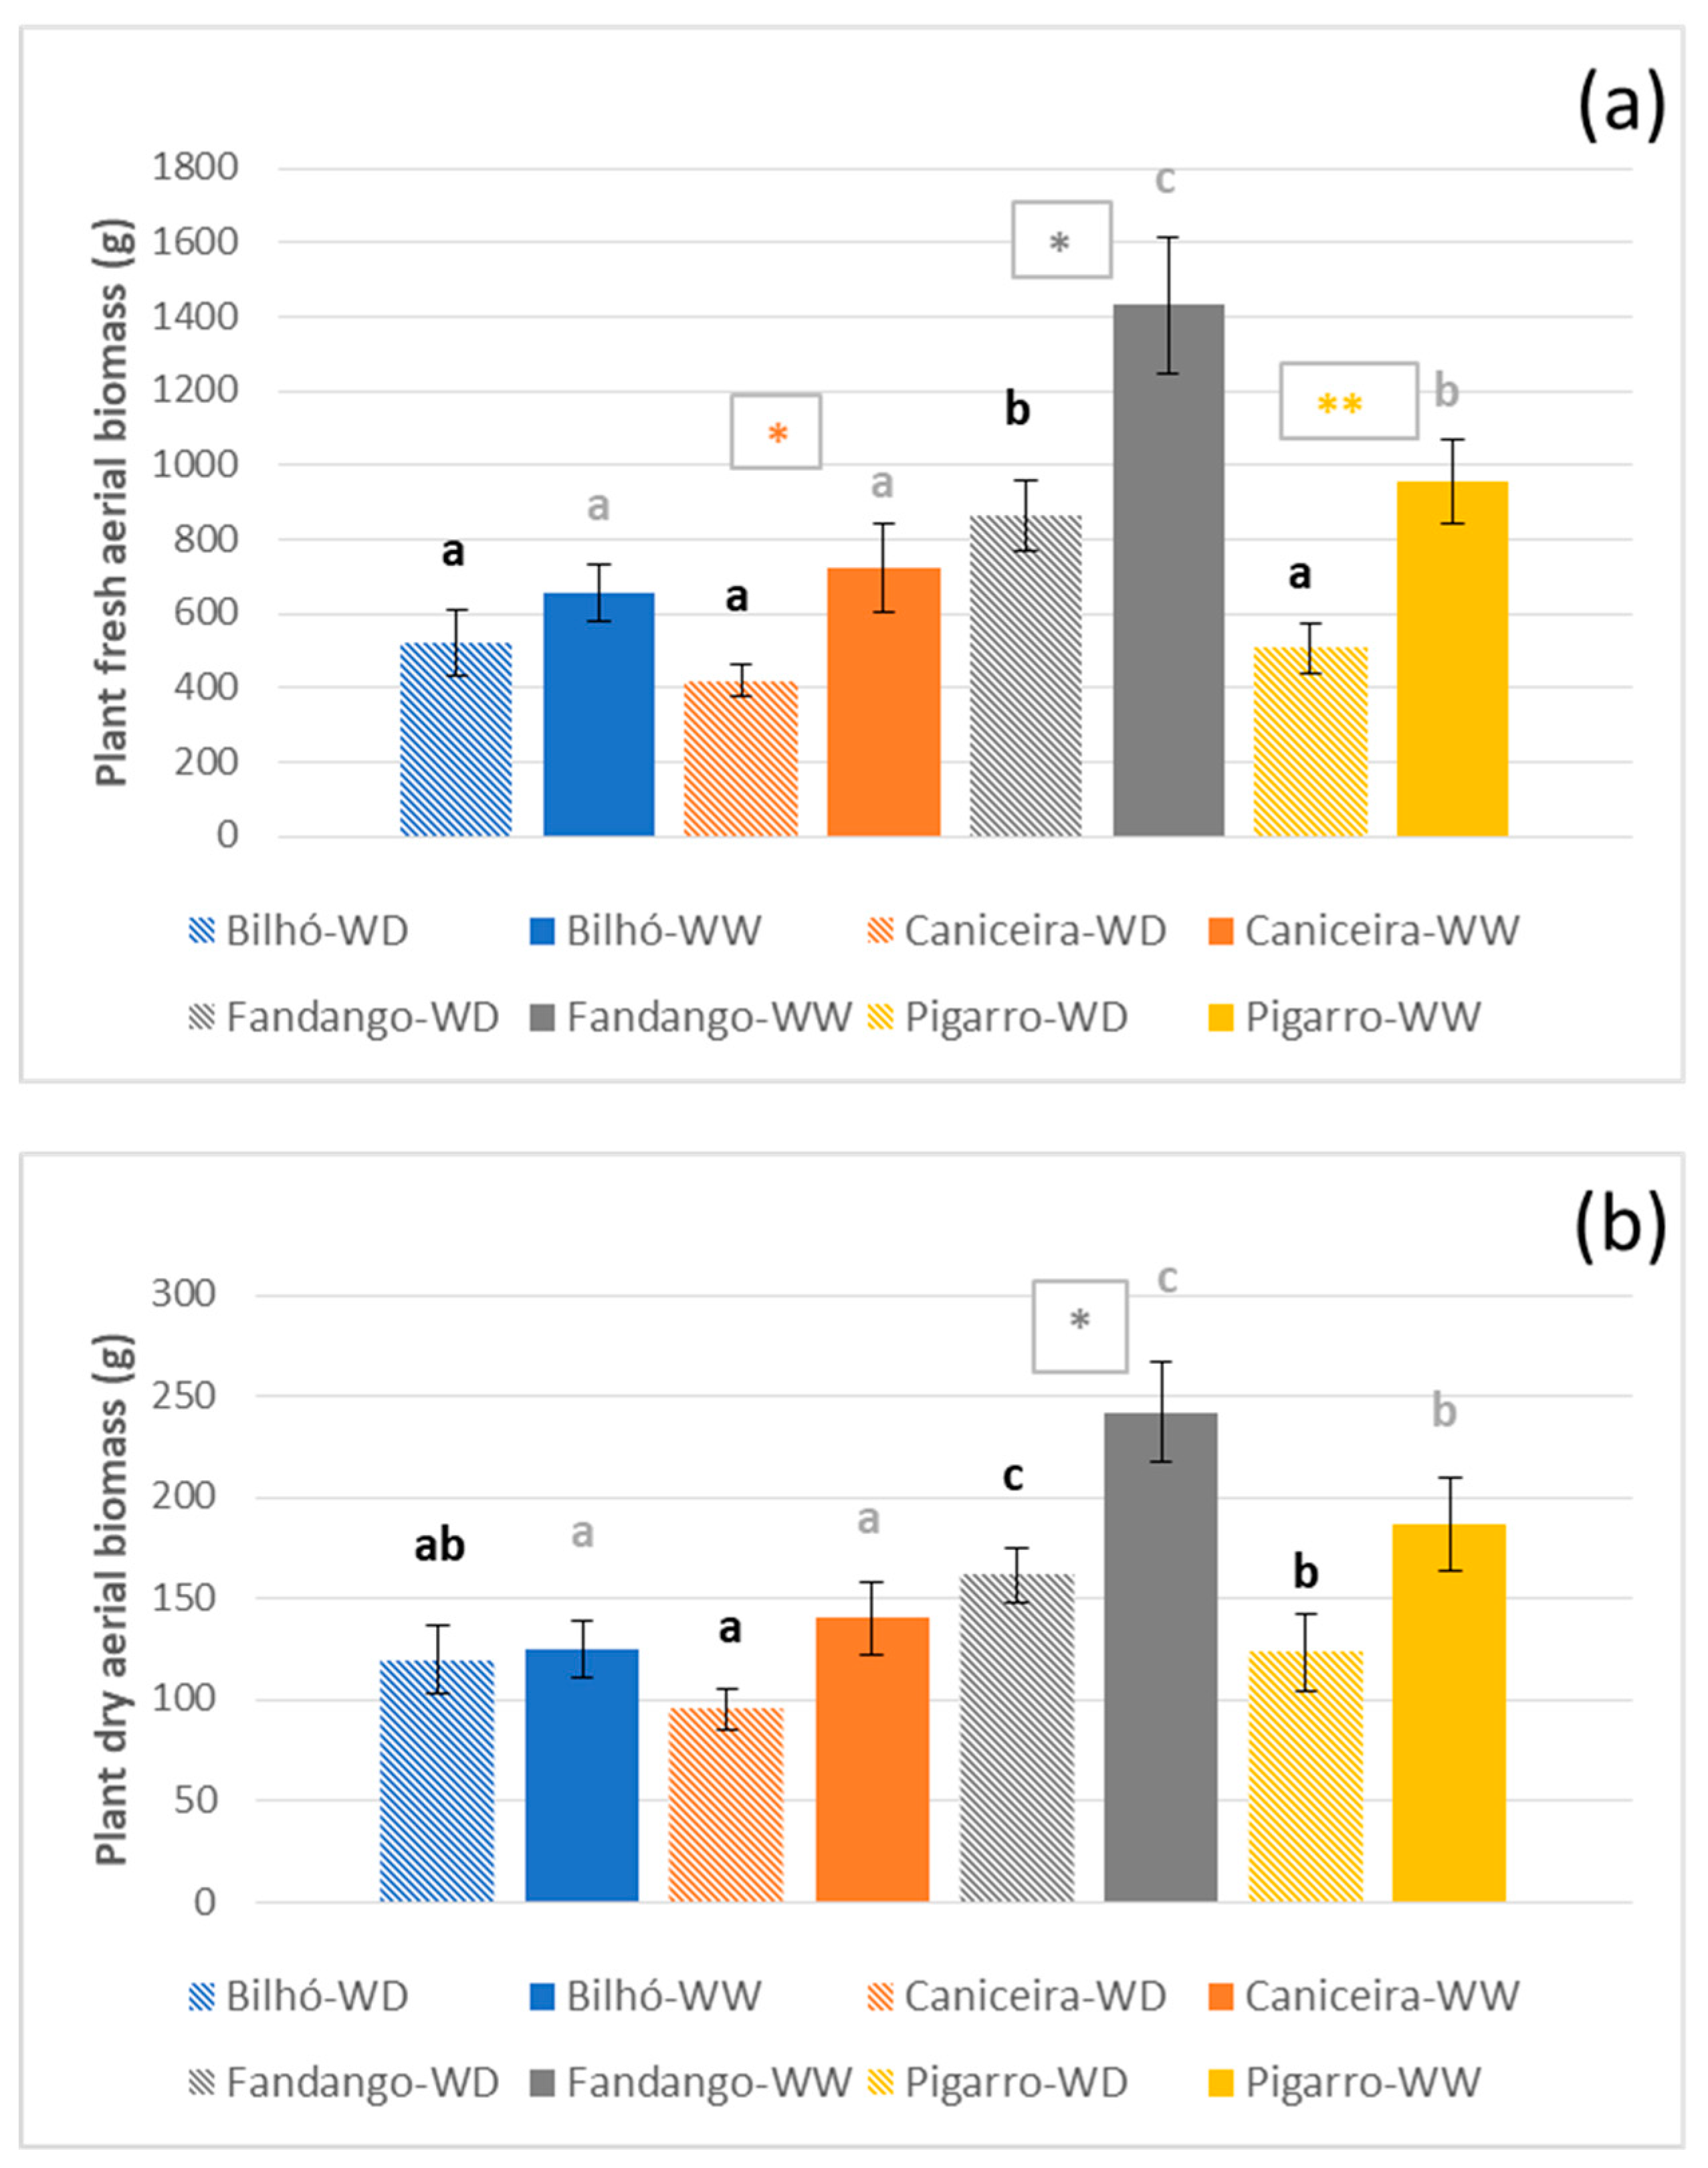
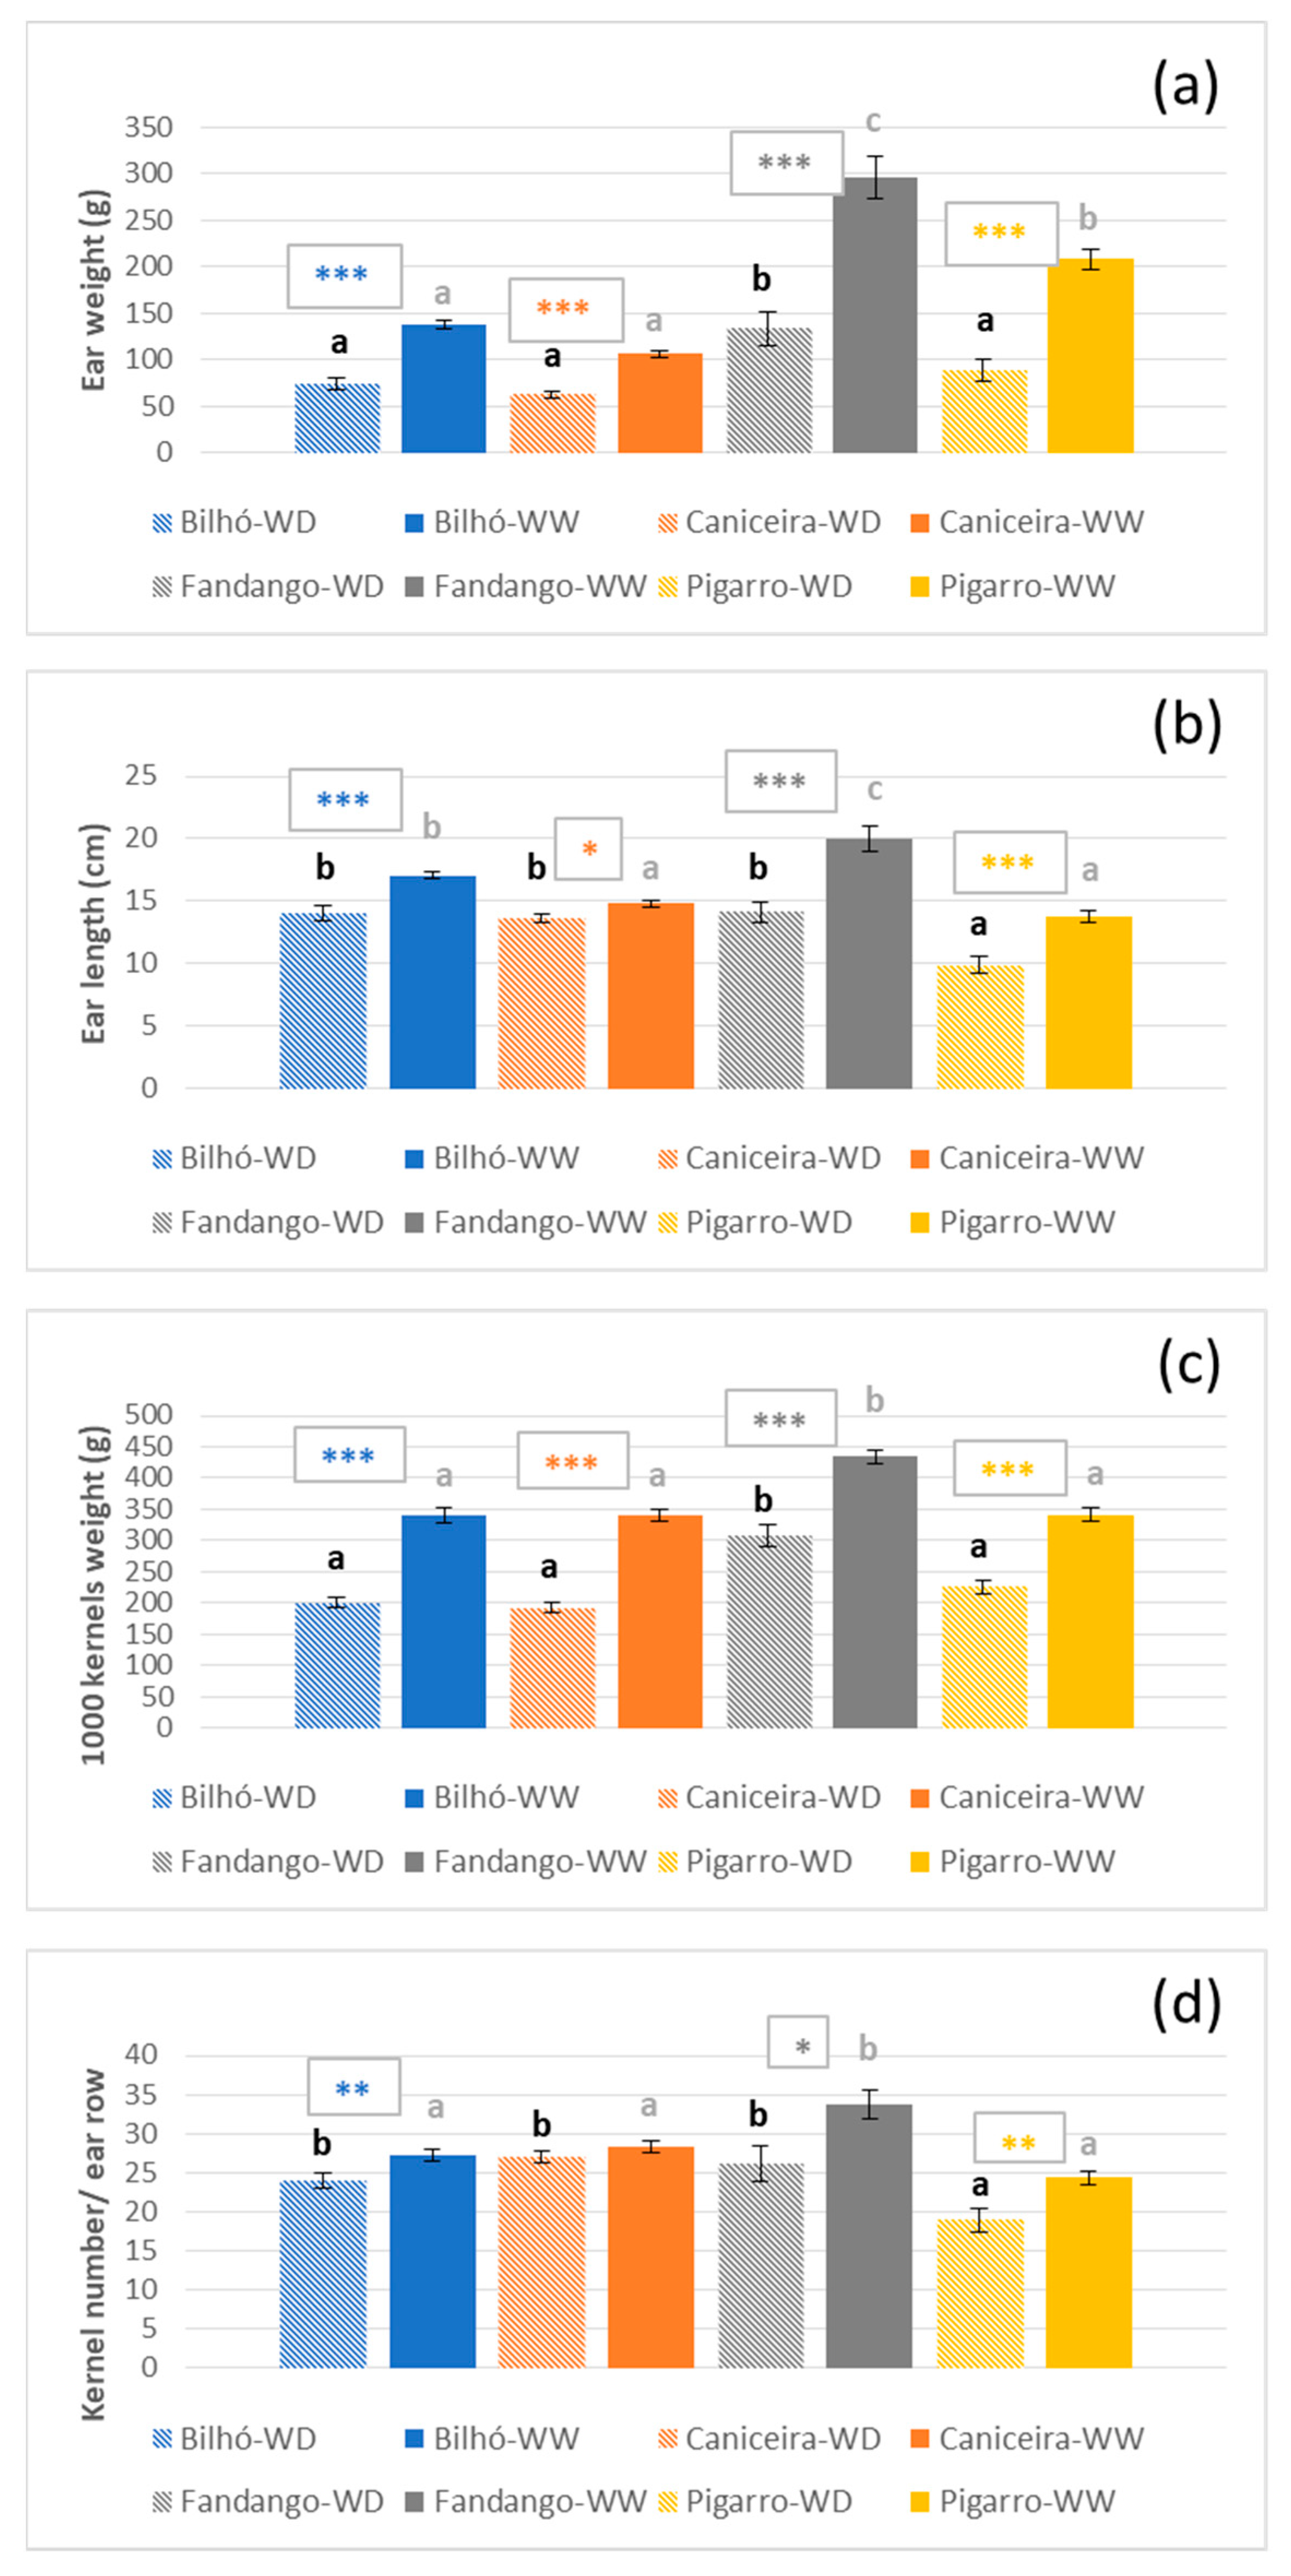
3.1.3. Growth, Morphology and Yield Components

The four maize populations showed significant differences in terms of their plant height and number of leaves in both water regimes and since the beginning of the measuring period (Tables S2–S5). In general, ‘Pigarro’ and ‘Fandango’ had the longest stem, being ‘Fandango’ characterized by a higher number of leaves only under WW conditions and on the last day of measurements. ‘Caniceira’ was the shortest population with the smallest leaf number (9 to 12) in both treatments. The intermediate position of the ‘Bilhó’ population under WW conditions became more similar to ‘Pigarro’ and ‘Fandango’ under WD. Imposed WD conditions reduced plant height from 20% SWC onwards, but the effect was smaller on the leaf number (Figure 7).
With the exception of ‘Bilhó’, all populations presented significant reductions on their aerial fresh biomass under WD conditions (retaining 53% (‘Pigarro’) to 60% (‘Fandango’) of their FB under WW). However, only ‘Fandango’ showed a significant reduction on its aerial dry biomass (to 67% of its DB under WW conditions) at the last day of measurements due to the stress imposition (Tables S2–S5, Figure 8).
Regarding the yield components, ear weight (EW) was significantly reduced in all populations under WD conditions (‘Bilhó’ with 53%, ‘Caniceira’ with 59%, ‘Fandango’ with 45% and ‘Pigarro’ with 43% of the EW recorded under WW conditions) (Tables S2–S5). Additionally, as a consequence of the water deprivation, the significant differences observed in yield under WW conditions (‘Fandango’ (c), ’Pigarro’ (b), ‘Bilhó’ (a), ‘Caniceira’ (a)) level out under WD (Figure 9).
‘Caniceira’ population with the lowest ear weight potential (EW under WW) was, however, the one with the highest EW resilience (EW under WD/EW under WW), followed closely by ‘Bilhó’. ‘Pigarro’ showed the lowest EW resilience (Figure S3). Significant reductions were also observed for 1000 kernel weight (TKW) (varying from 56% (‘Caniceira’) to 71% (‘Fandango’) of their WW conditions TKW values) and ear length (EL) (varying from 71% (‘Fandango’) to 92% (‘Caniceira’) of their WW conditions EL values) in all the populations under WD conditions. The number of kernels per ear row (KNR) did not decrease with WD, except in ‘Caniceira’ population (Figure 9).

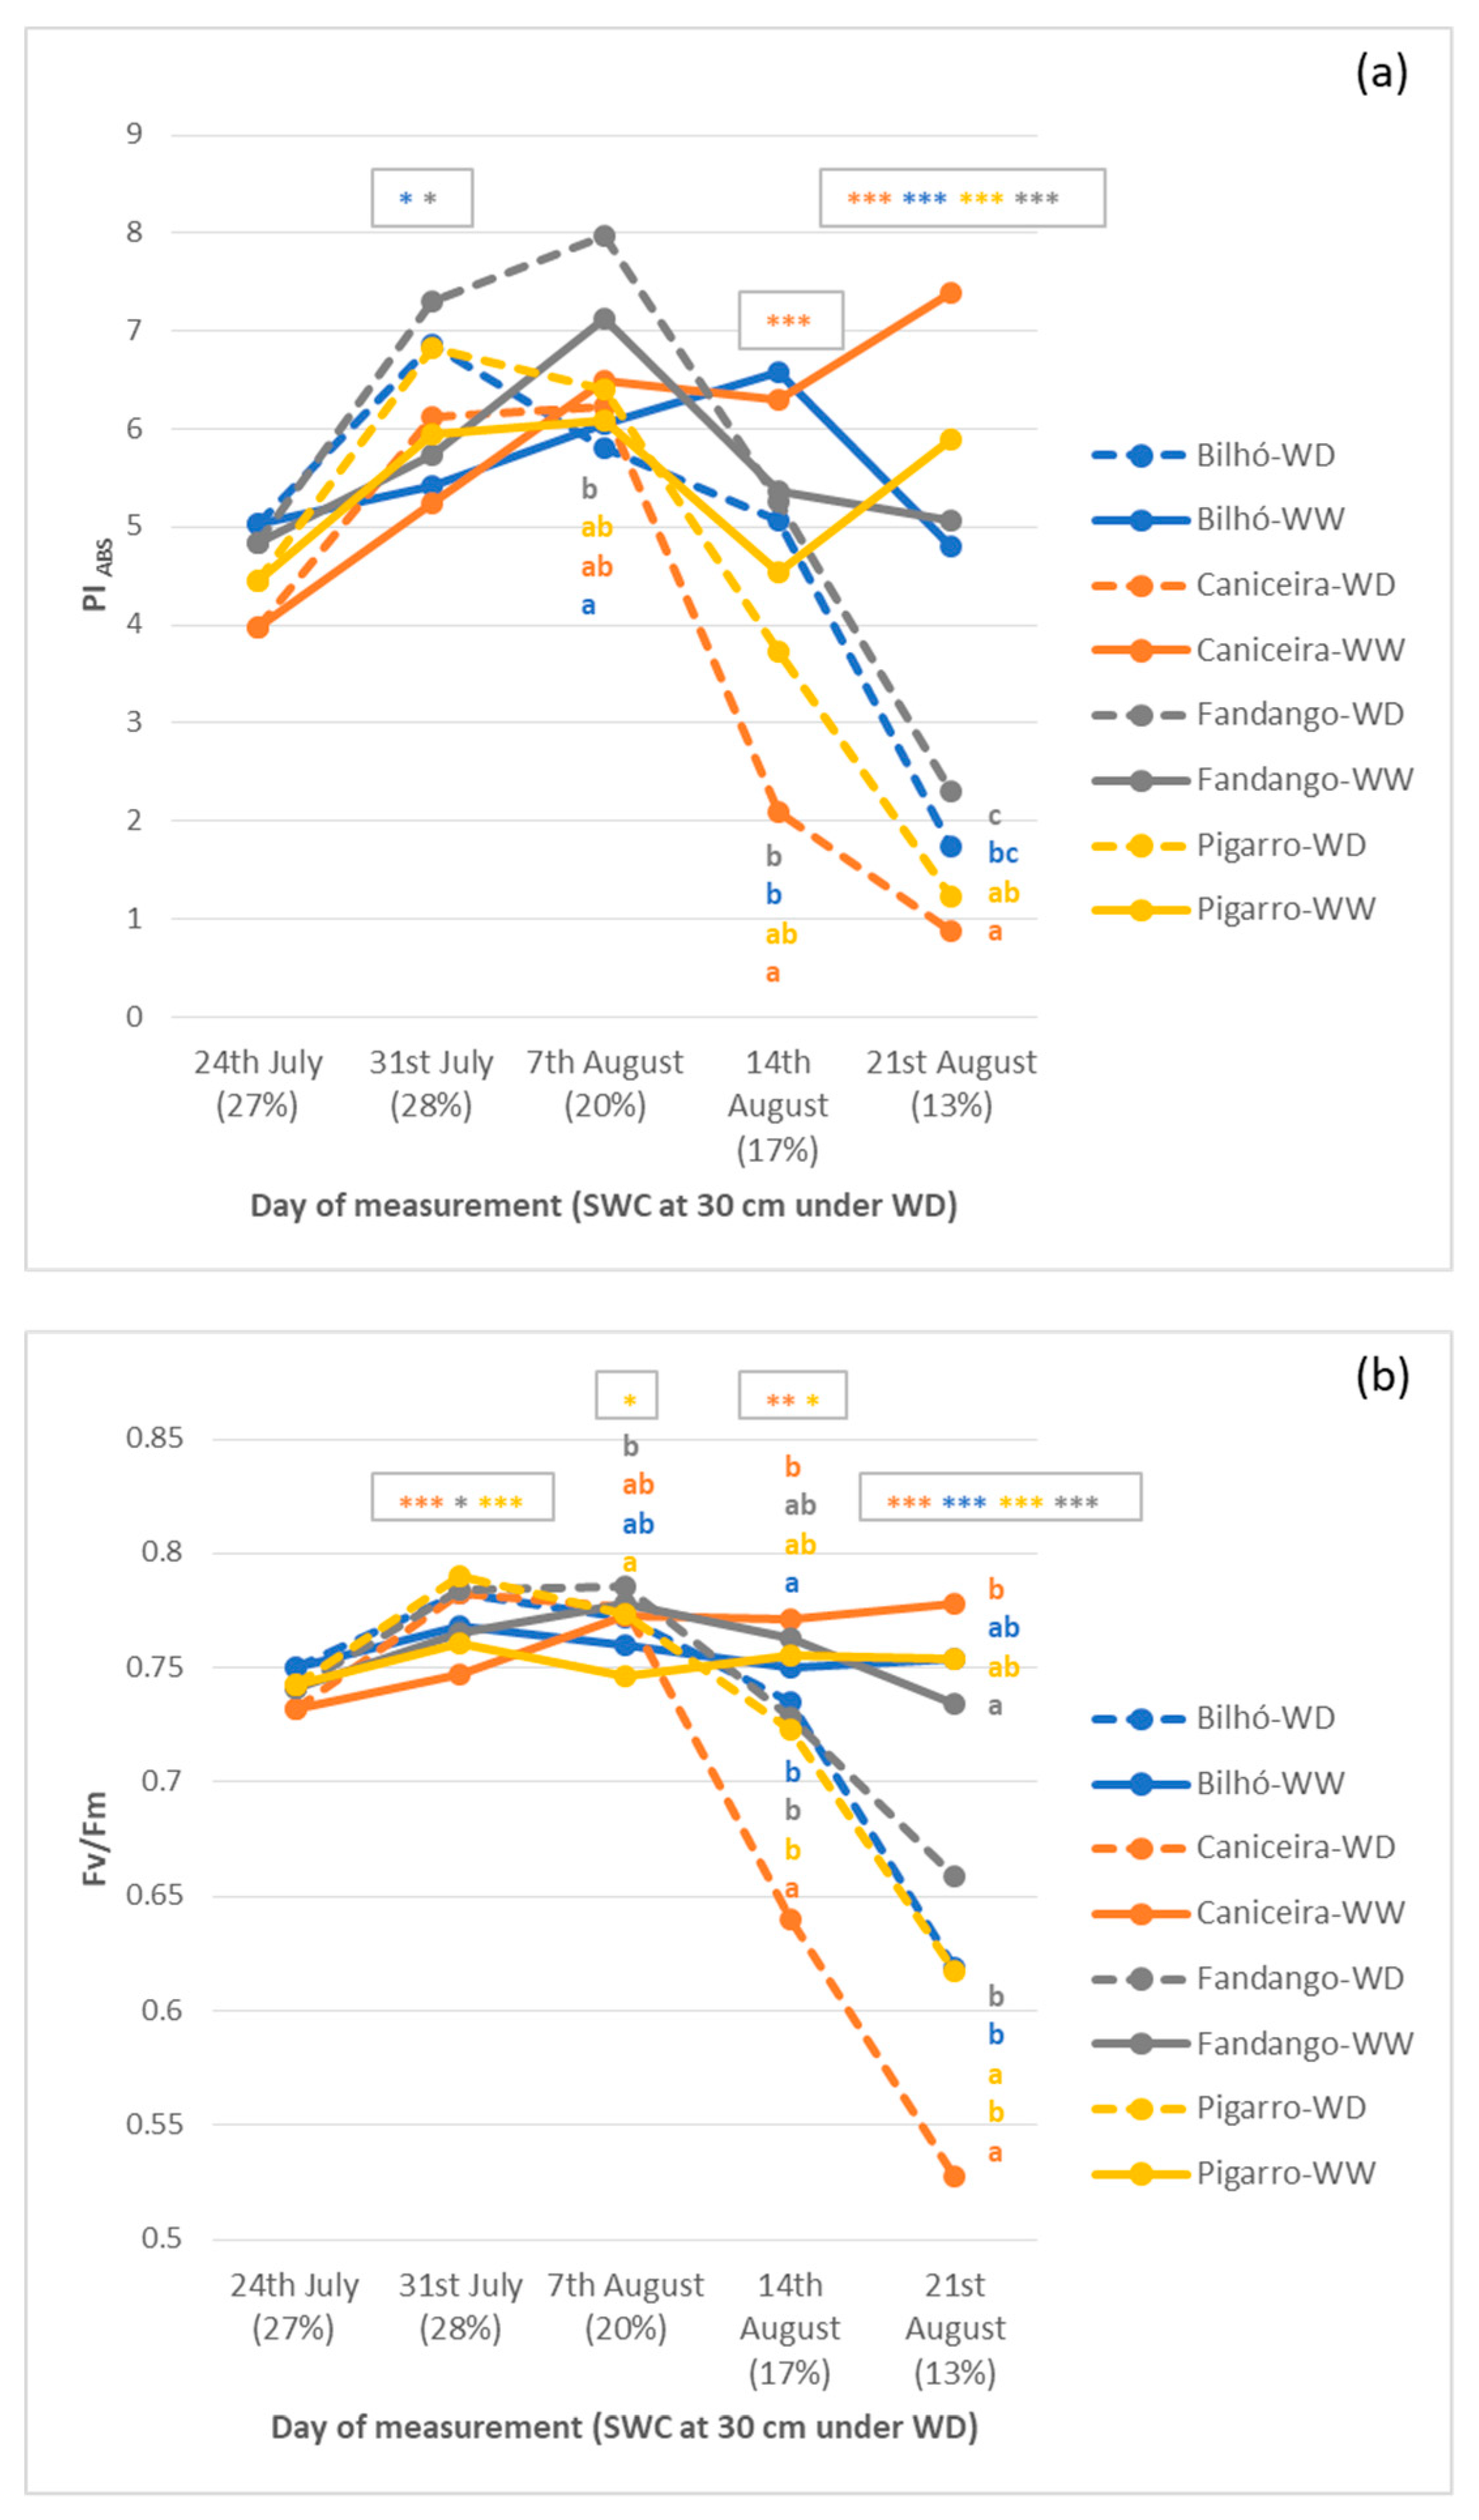
3.1.4. OJIP Parameters and Chl a Fluorescence

OJIP parameters were reduced by water deficit imposition (Tables S2–S5). This was more evident at the higher stress levels (below 17% SWC). ‘Caniceira’ population that was among the populations with the highest values of Fv/Fm under WW conditions, presented the lowest values under WD conditions. ‘Caniceira’ was also among the first to show significant differences of Fv/Fm values between water treatments. The same trend was observed for the PIABS parameter (‘Caniceira’ with 9%, ‘Pigarro’ with 20%, ‘Bilhó’ with 37% and ‘Fandango’ with 48% of their PIABS values under well-watered conditions on the last day of measurements under WD) with ‘Fandango’ and ‘Bilhó’ showing the highest values under WD conditions (Figure 10). The significant differences observed in the OJIP parameters between water treatments on the two first days of measurements were due to a slight water deficit experienced by the WW plants that quickly recovered their parameter values after irrigation (see Figure 1 for irrigation and SWC variation).

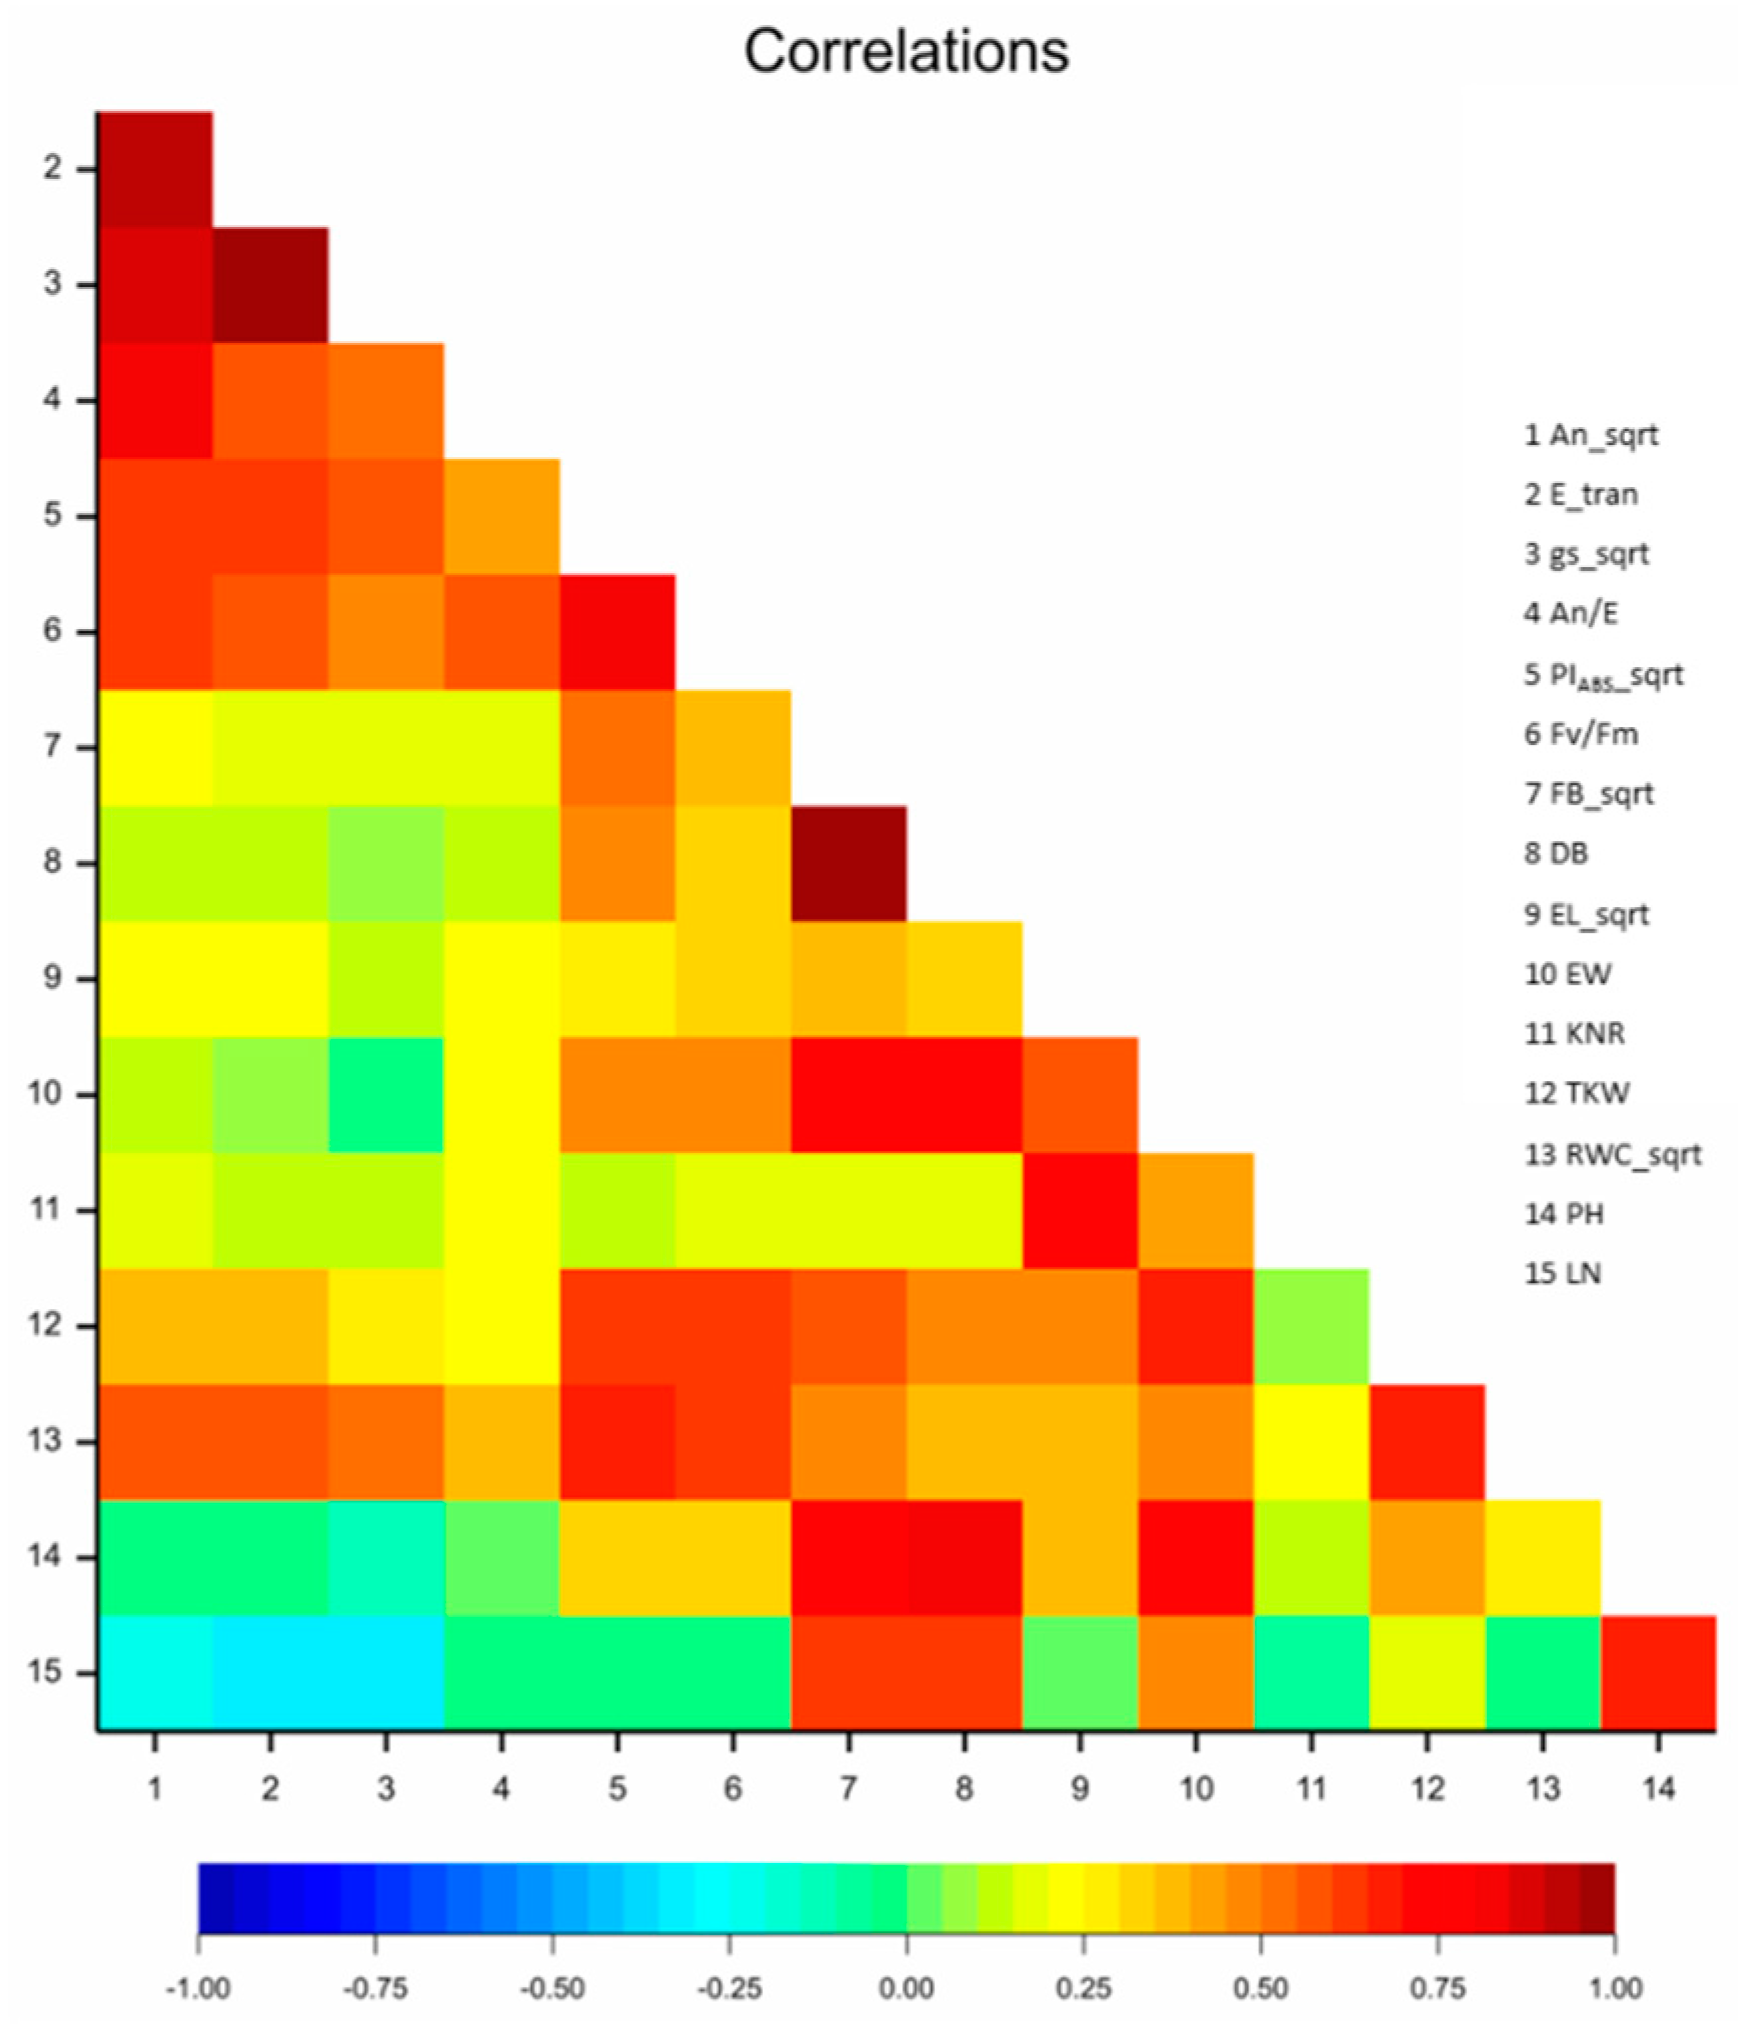
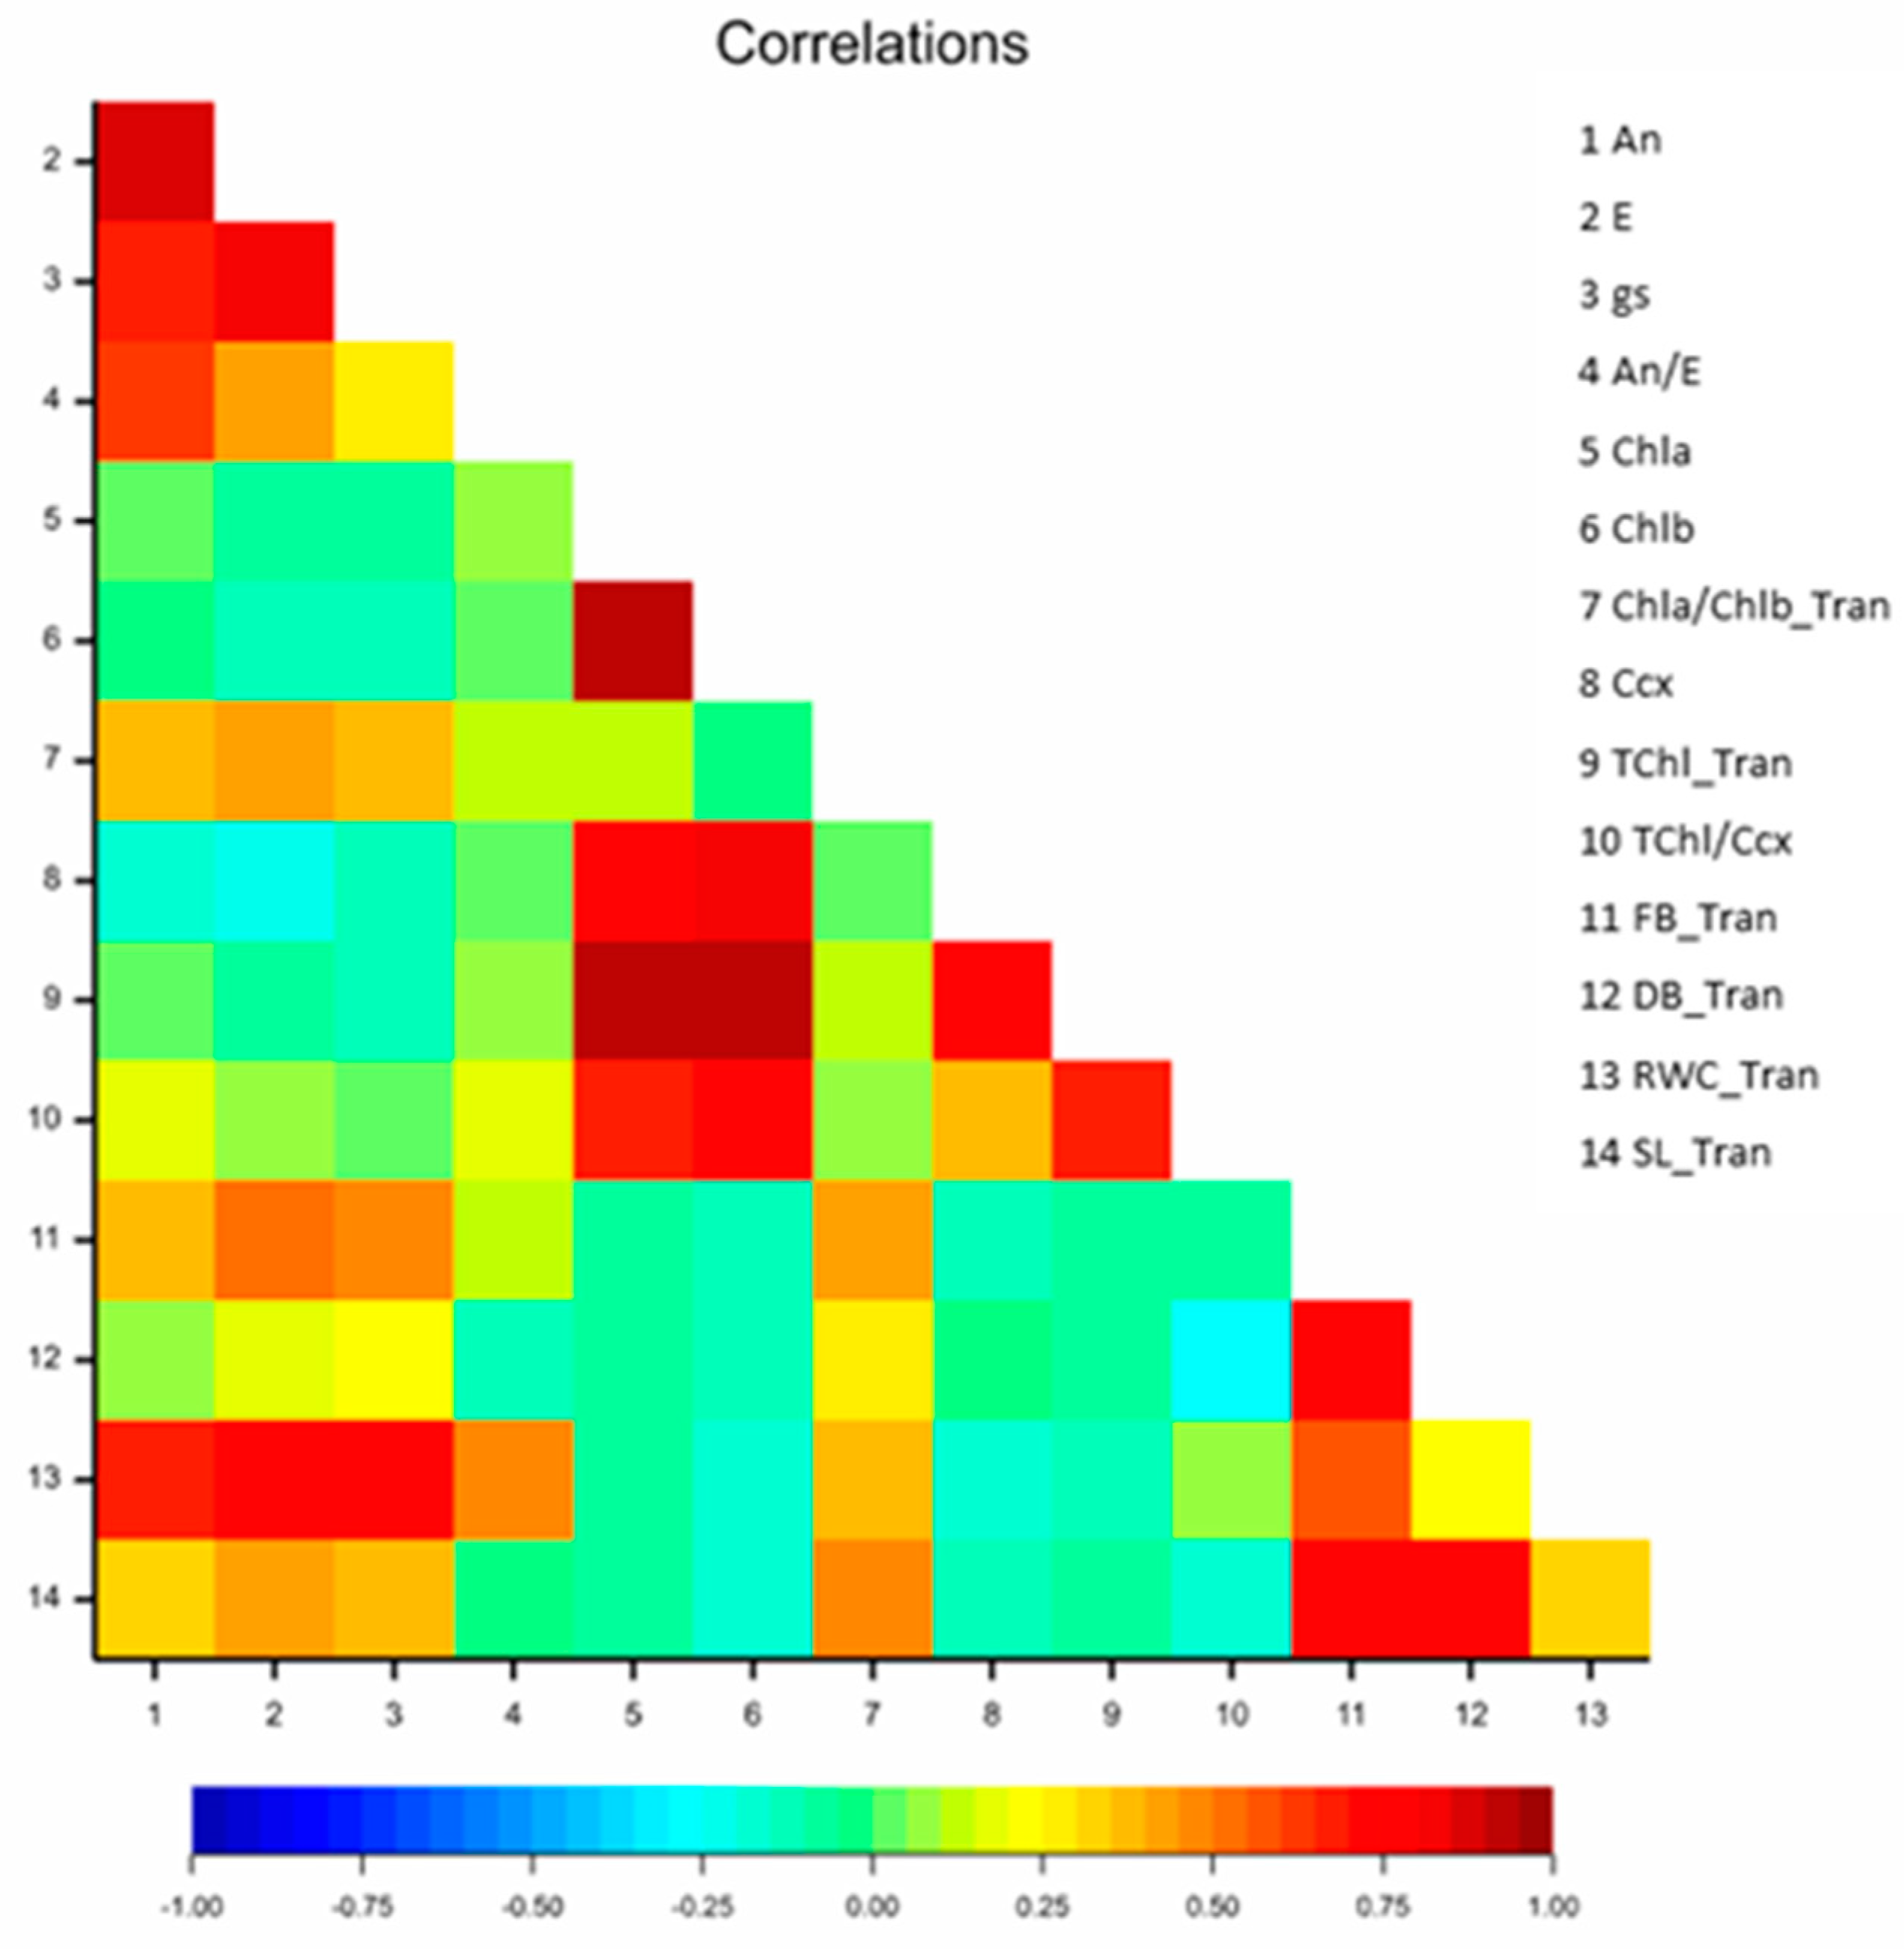
3.1.5. Correlation Analysis

Under field conditions, correlations between traits were calculated on the last day of measurements (highest level of stress), the time point with the highest number of traits measured. Yield components were also included.
Overall the ear weight (EW) was strongly and positively correlated with fresh (FB), dry biomass (DB) and plant height (PH). As expected, a significant and positive correlation was detected with WUE, and the gas exchange parameters (An, E and gs). We also found a strong and positive correlation between net photosynthesis (An), the transpiration rates (E) and stomatal conductance (gs) (Figure 11).

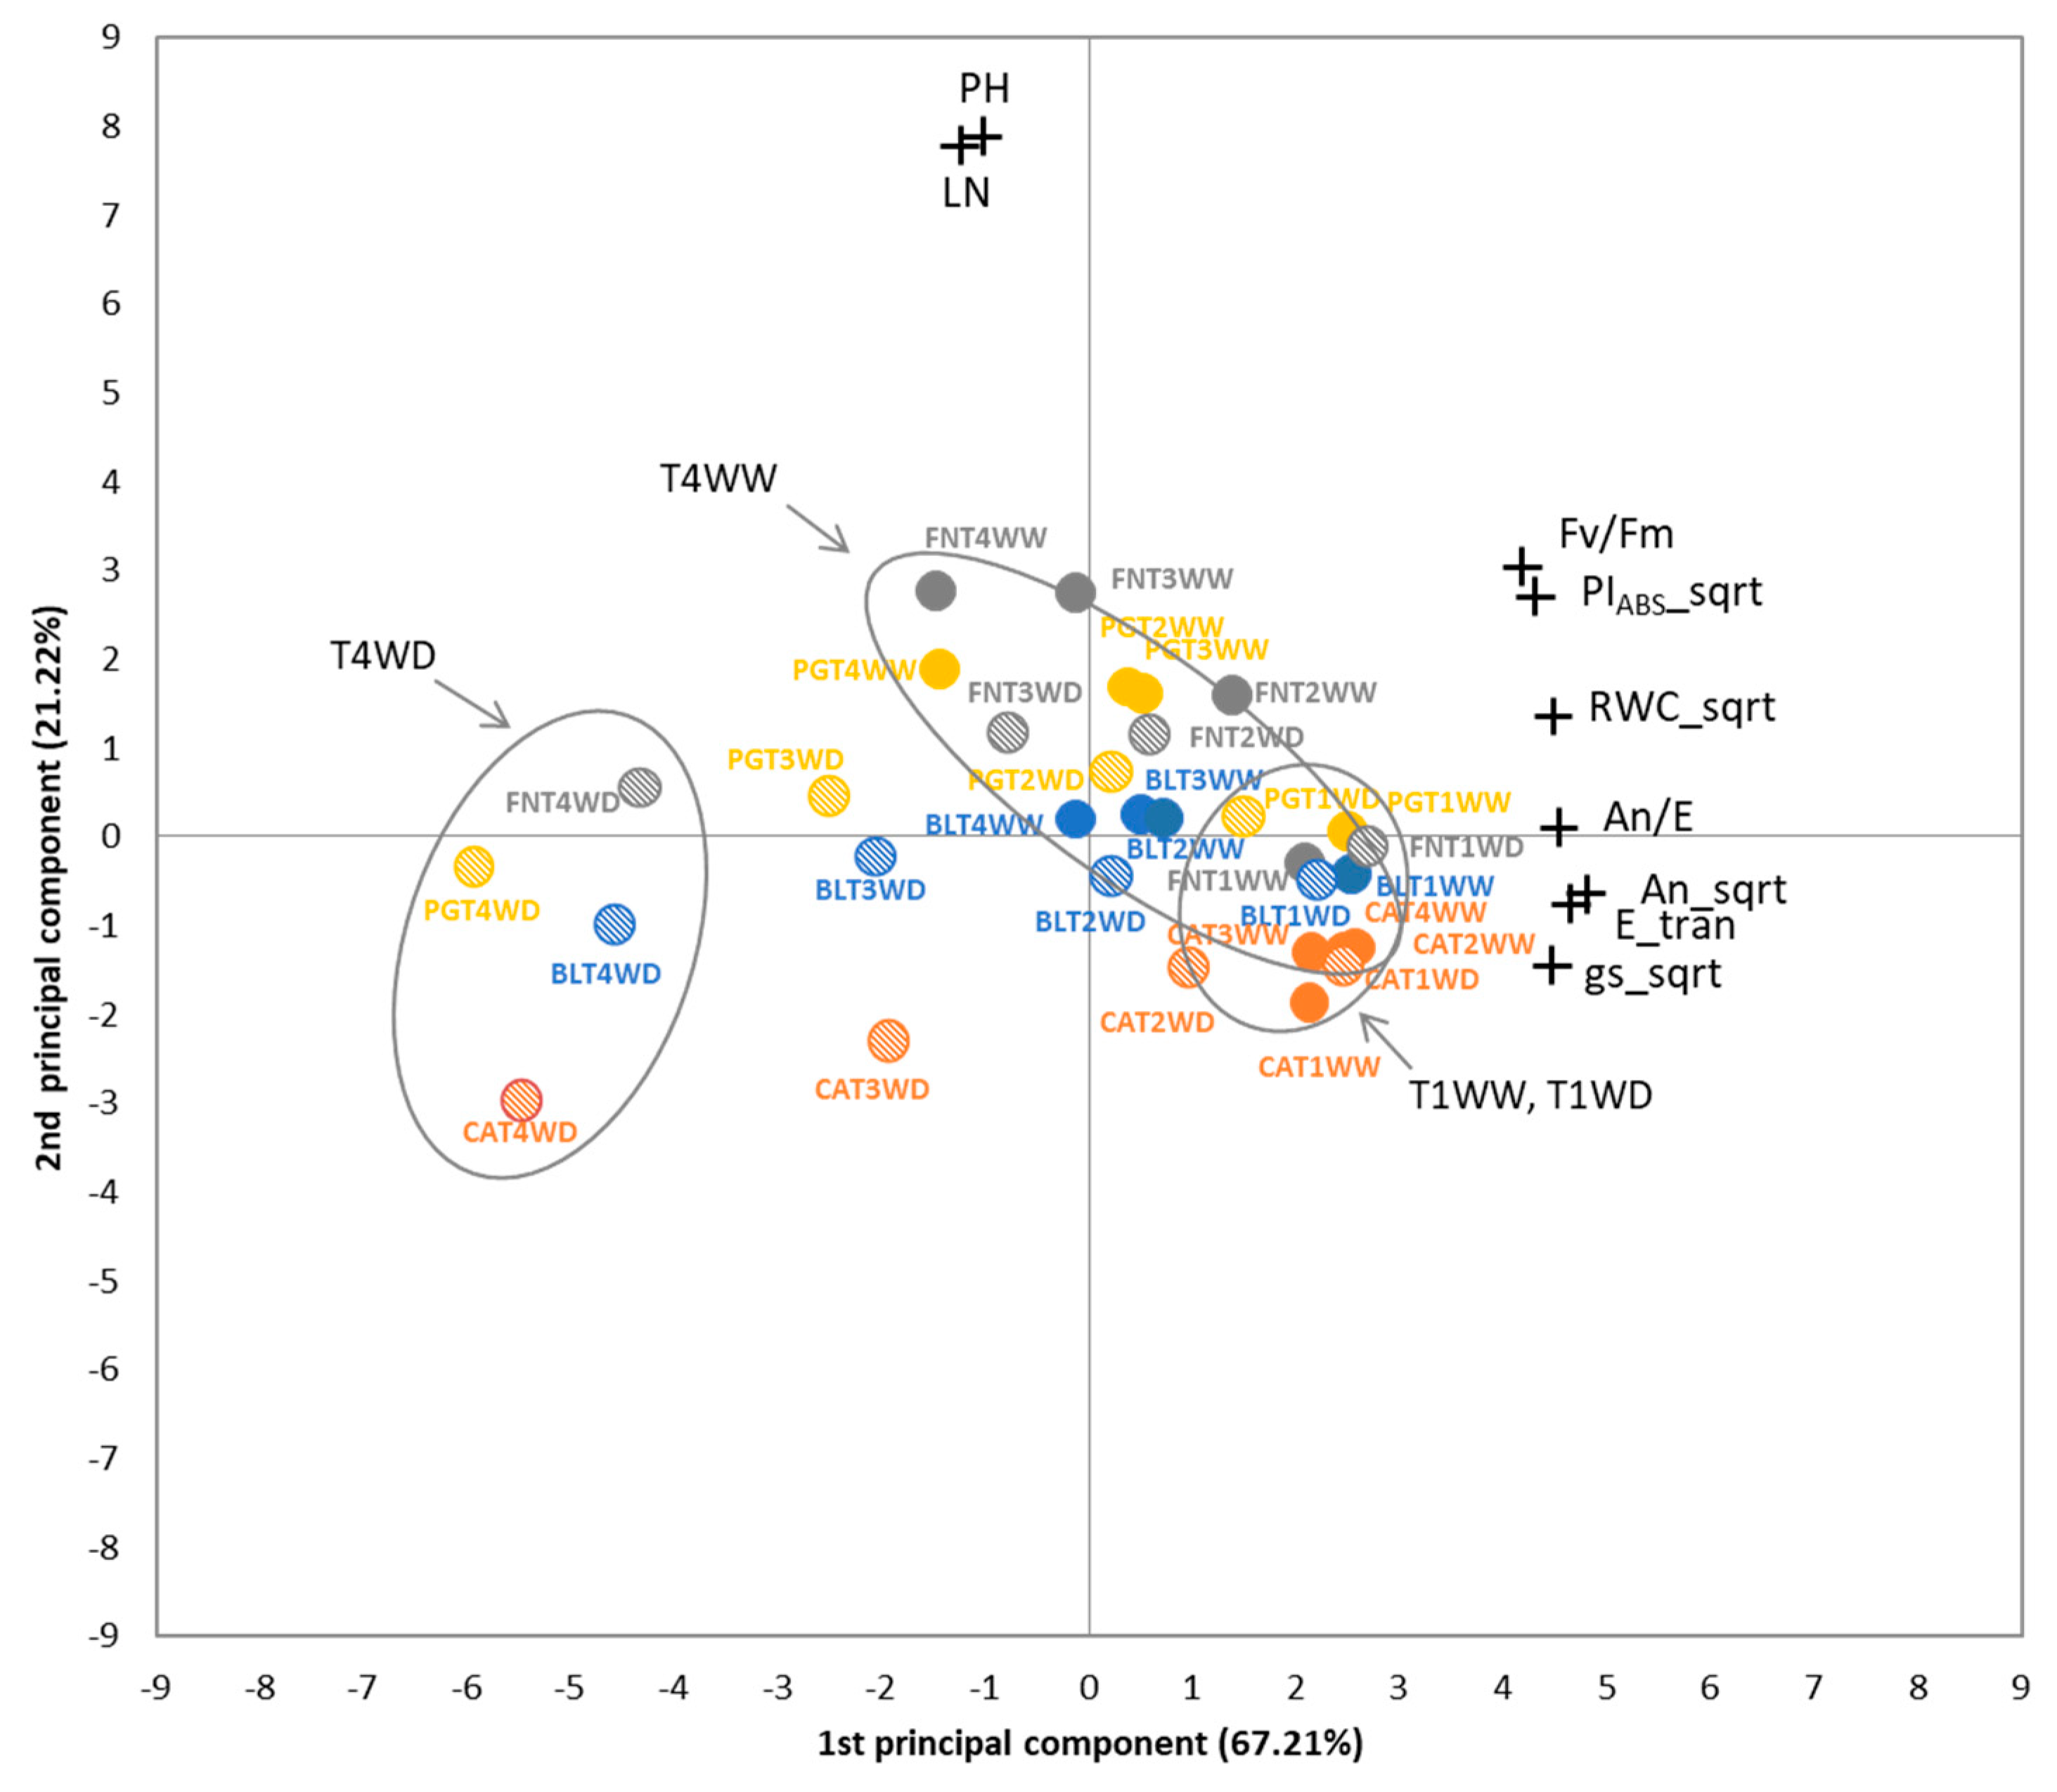
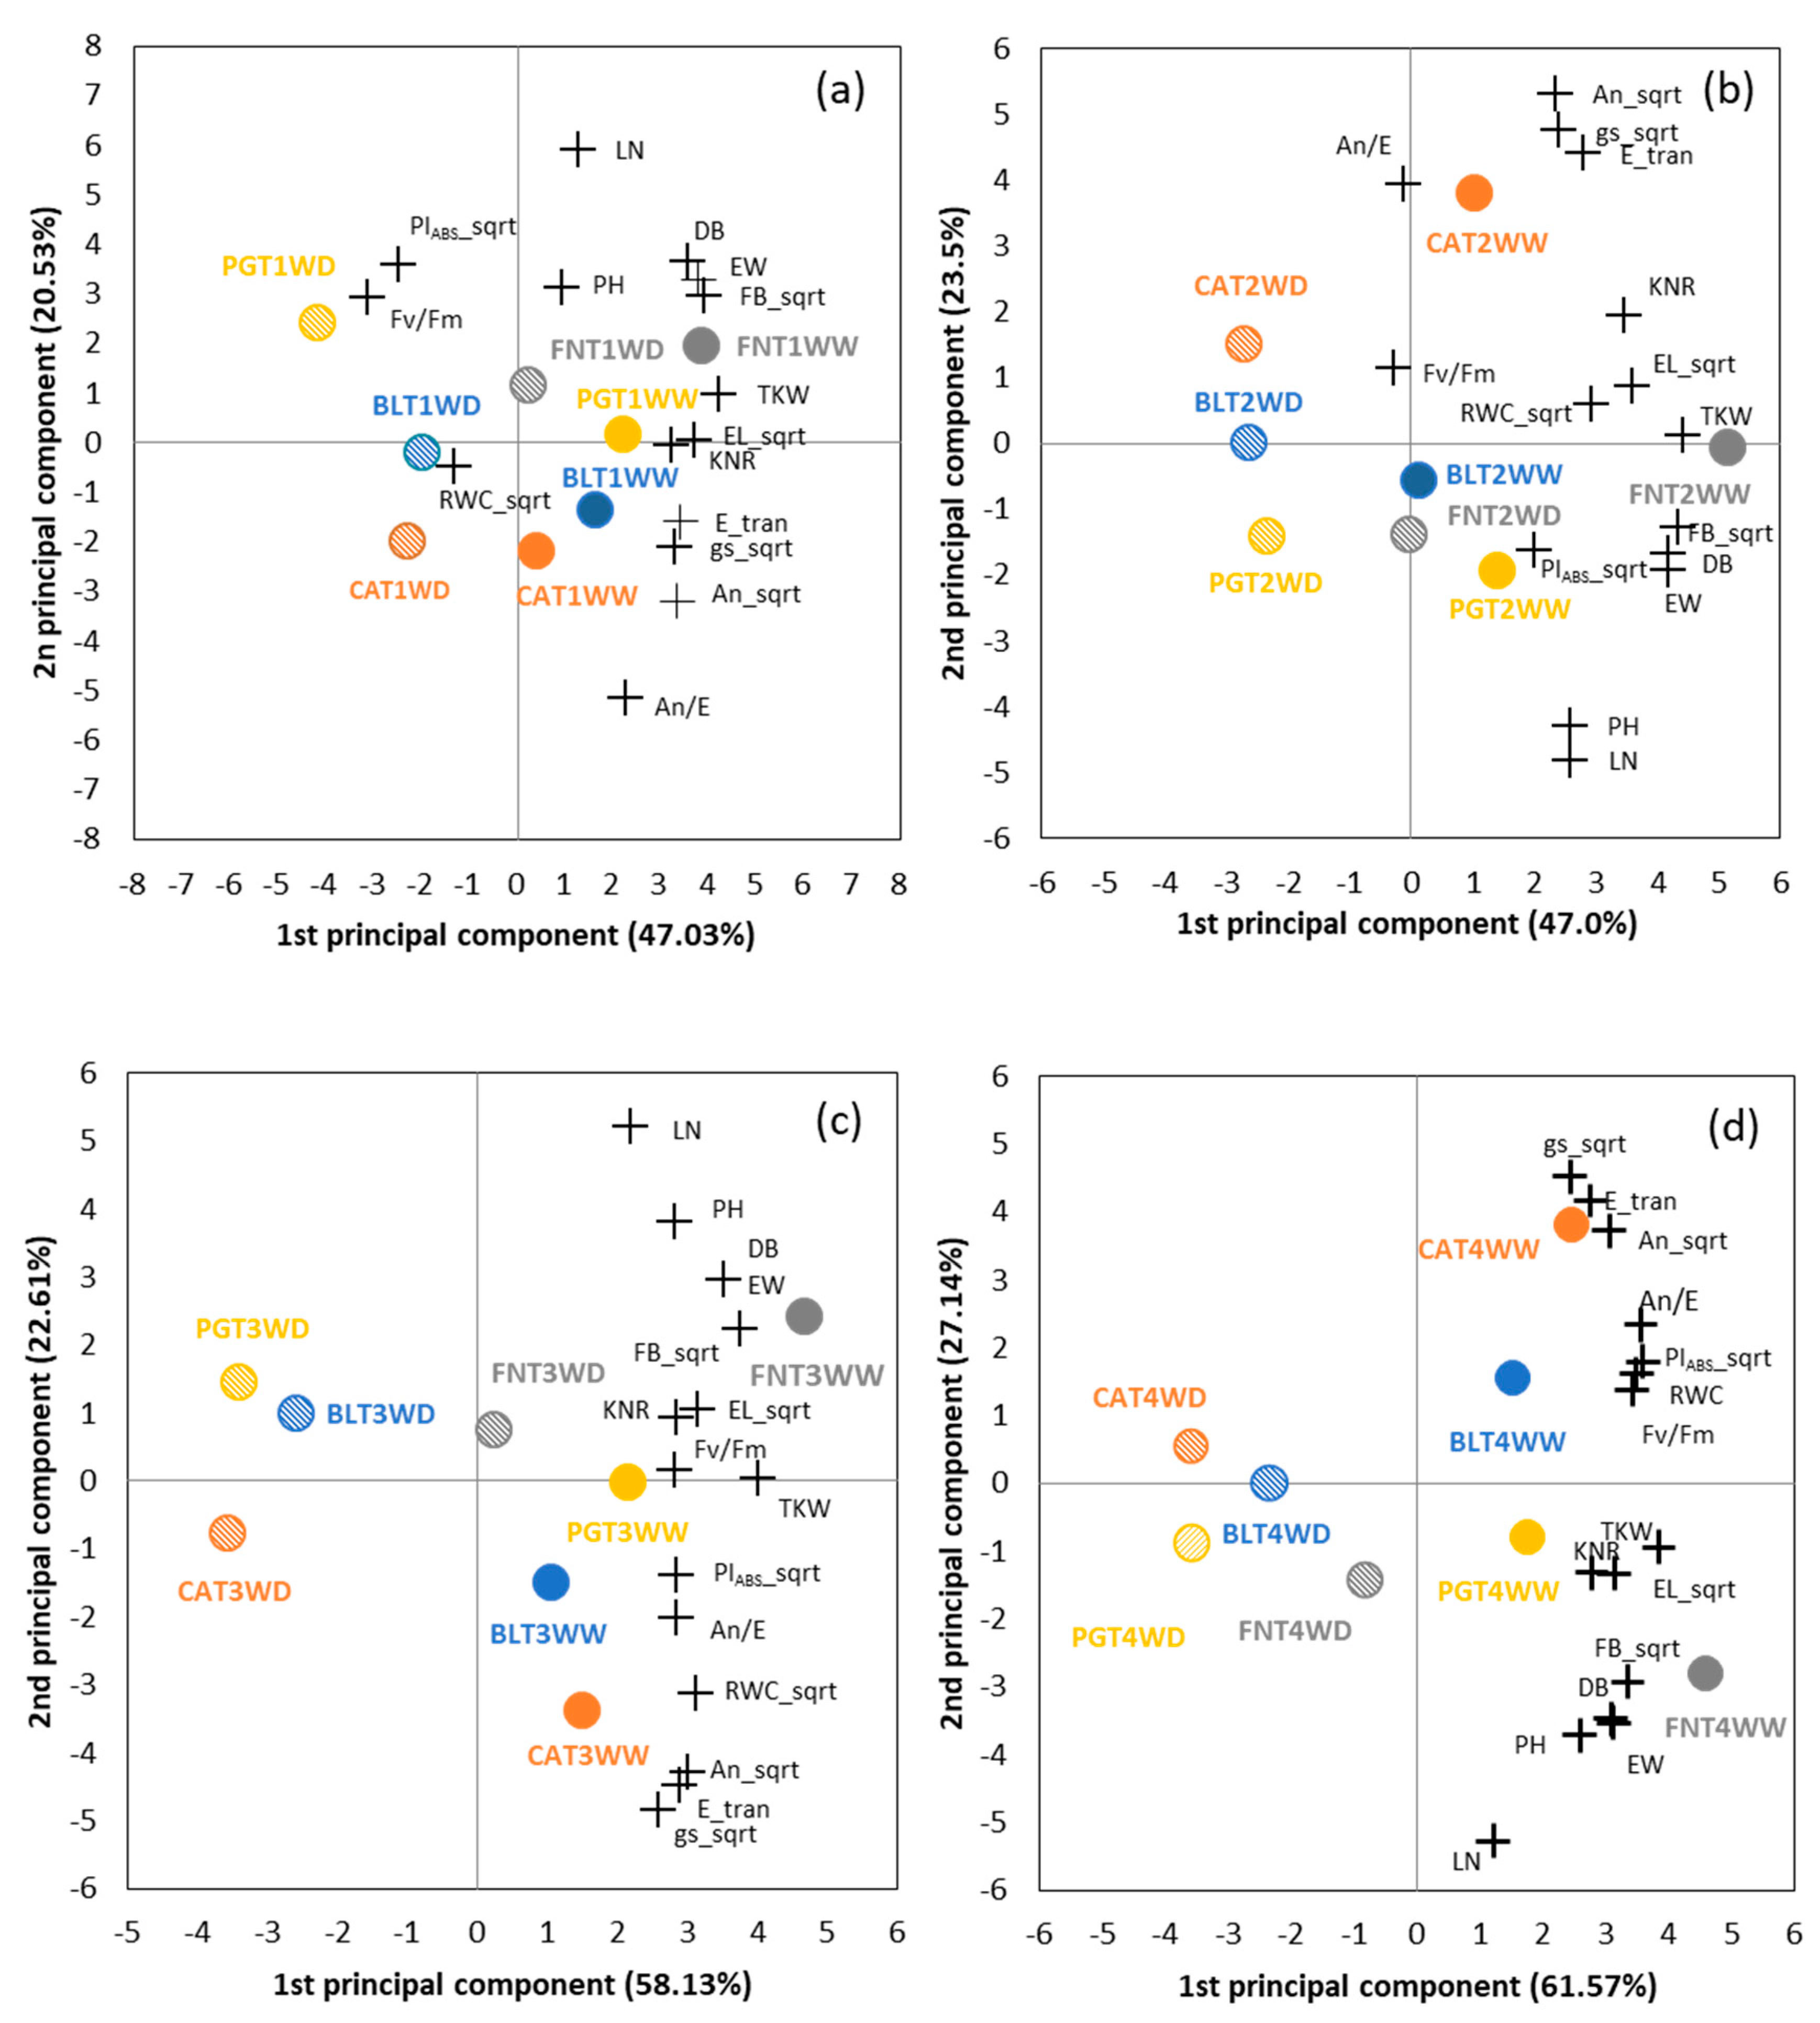
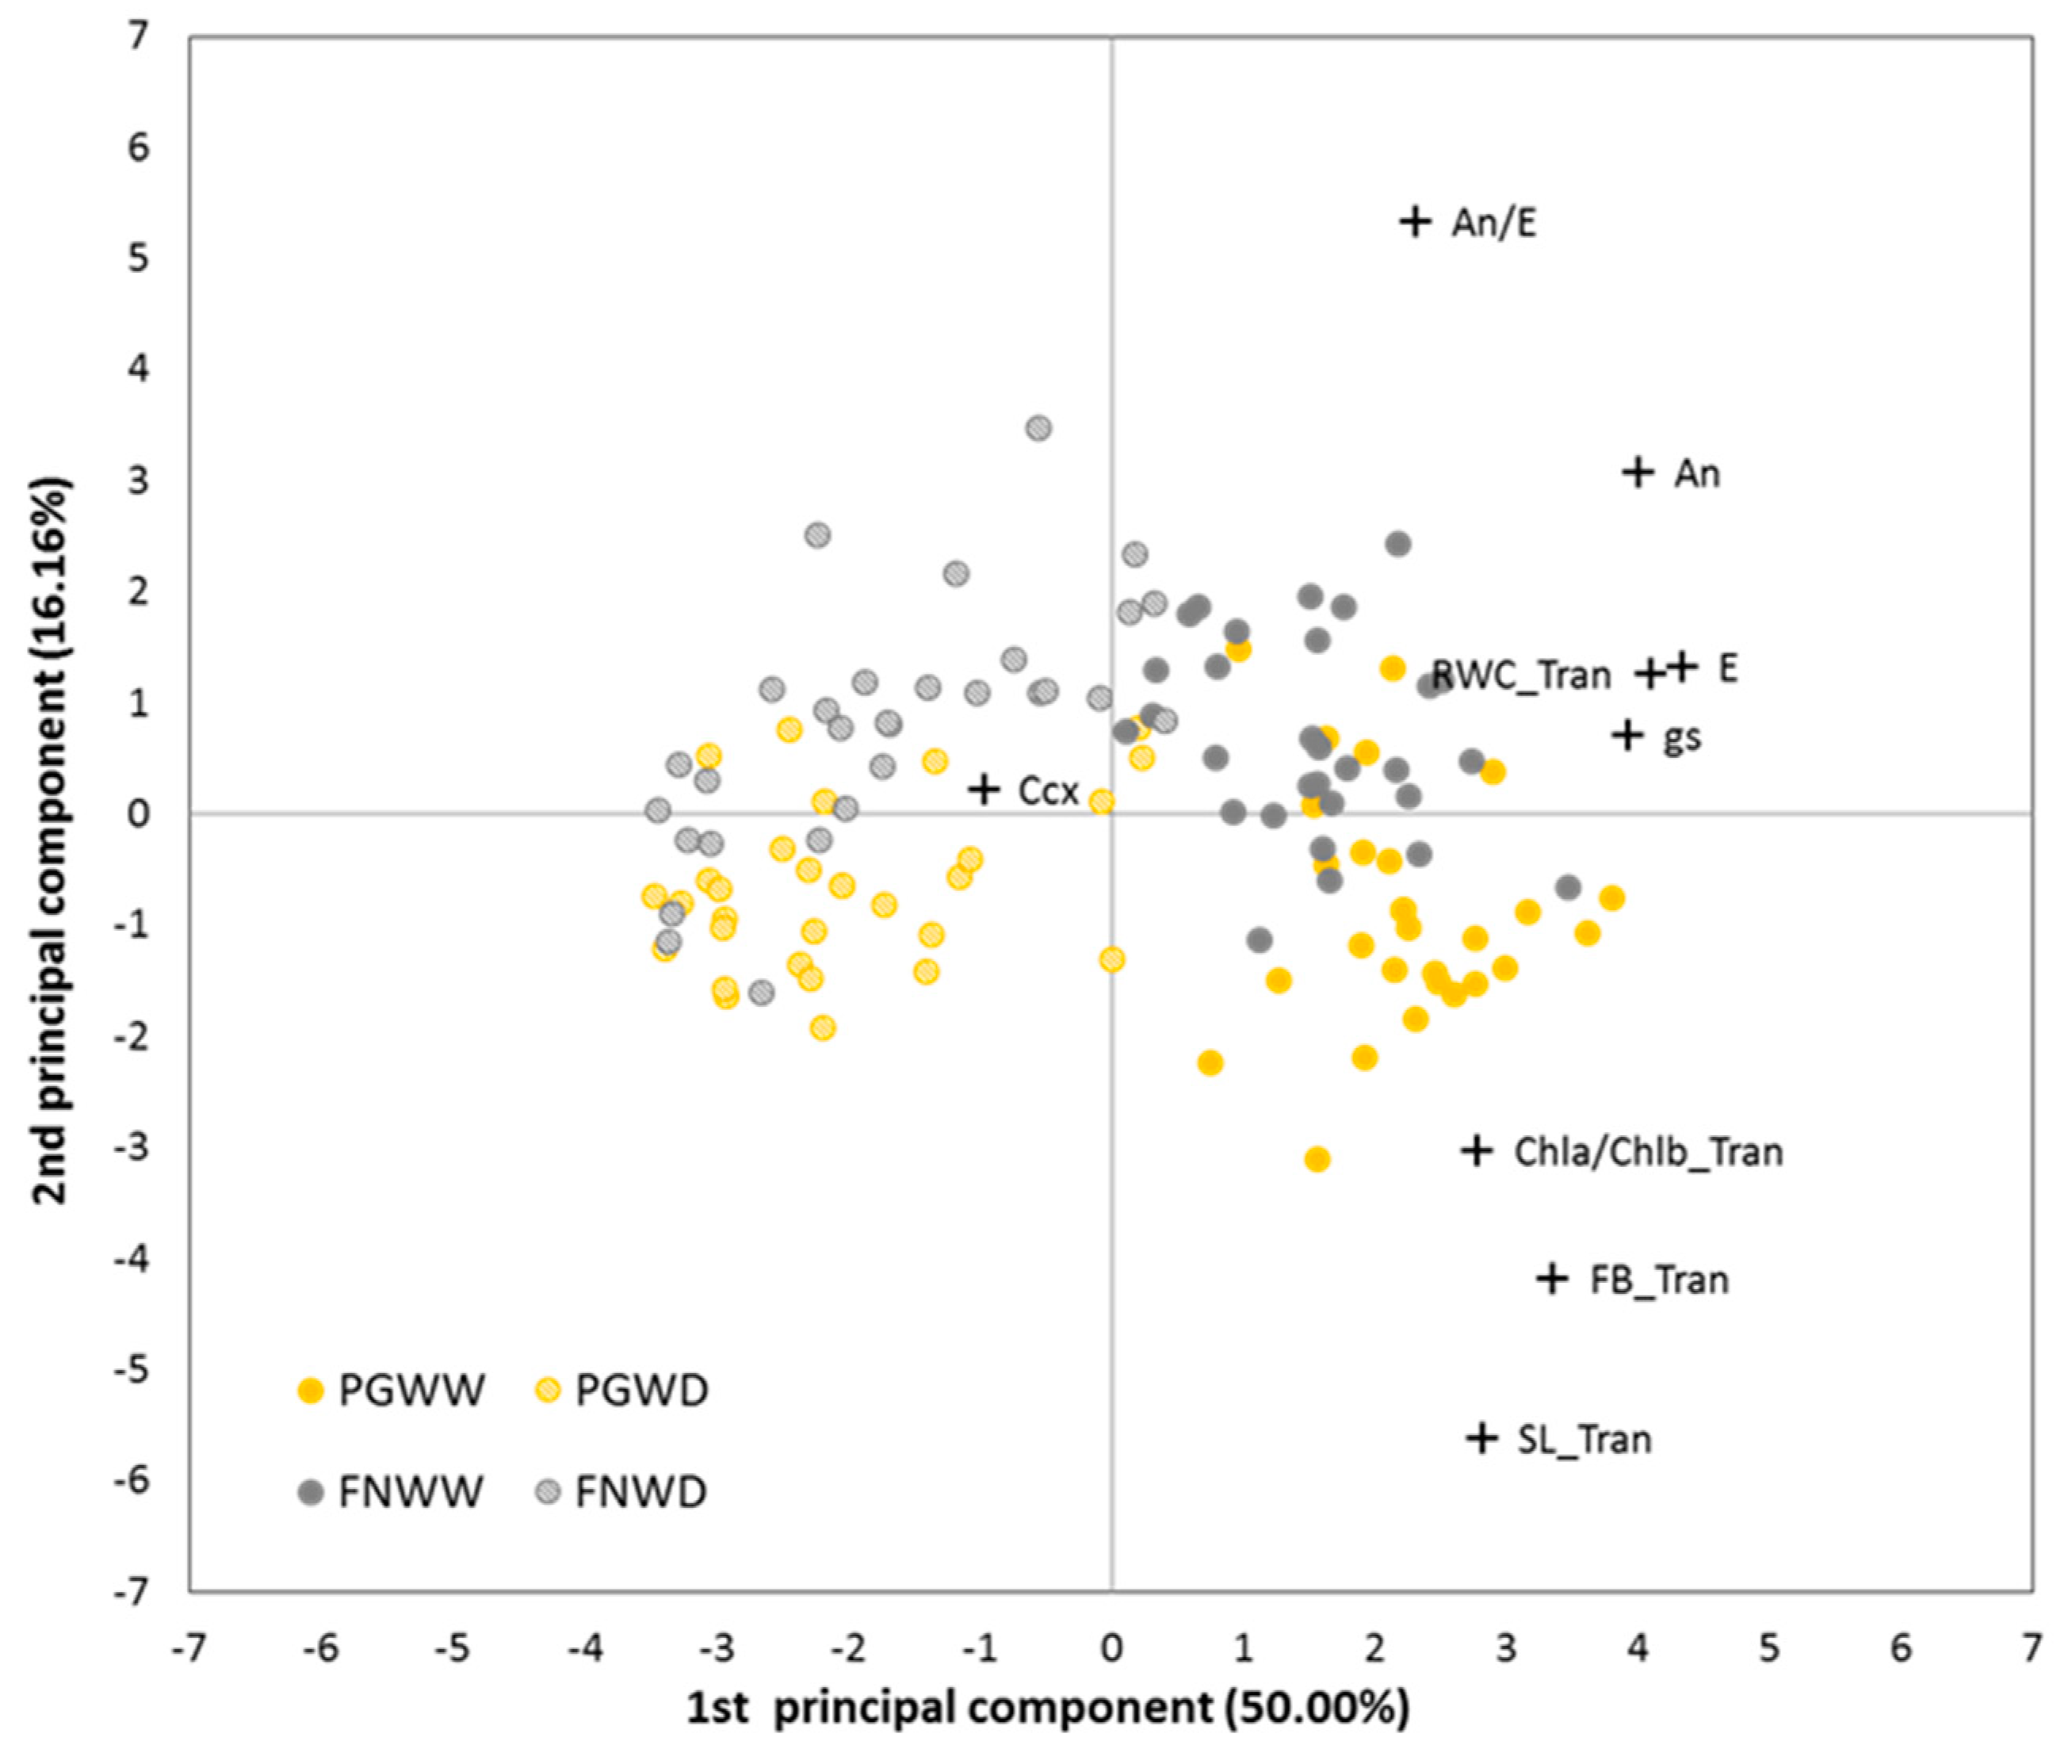
3.1.6. Multivariate Analysis

A principal component analysis was performed using the nine morpho-physiological parameters that showed significant differences between water regimes and/or populations along four measuring times (T1: 21st July, T2: 7th August, T3: 14th August, T4: 21st August). The first two components retained 88.43% of the total cumulative variance, with the first component explaining 67.21% of the observed variance (Figure 12).
From the PCA biplot a clear separation of maize populations’ behavior under WD from WW conditions was observed along the first component. This separation became more obvious with the increasing water deficit, but with a clear decrease on RWC, WUE (An/E), Fv/Fm and PIABS from the beginning of the water deficit imposition. A sharper clustering of the population position with the increase in water deficit imposition was also evident (Figure 12). Overall, the four maize populations tended to behave more similarly under higher WD in what concerned gas exchange parameters, but with ‘Fandango’ and ‘Caniceira’ always on the most contrasting positions. These two populations were also the most contrasting in what concerned morphological traits and yield components. ‘Bilhó’ and ‘Pigarro’ occupied intermediate positions but the four populations were clearly distinct in RWC and Chl a fluorescence parameter values (Figure 13). Under moderate water deficit imposition (20–17% SWC), PIABS differentiated population behavior more similarly to gas exchange parameters and EW (Figure 13b,c). When computing PIABS resilience (PIABS WD/PIABS WW), the maximum differentiation among populations was obtained at 17% SWC (Figure S4). At this stress imposition, a clear and steep decrease was observed on ‘Caniceira’ population PIABS (compared with the previous 20% SWC measurement), presenting ‘Bilhó’ the smoothest decrease. ‘Fandango’ maintained always the highest scores (Figure S4).

3.2. Growth Chamber Trial

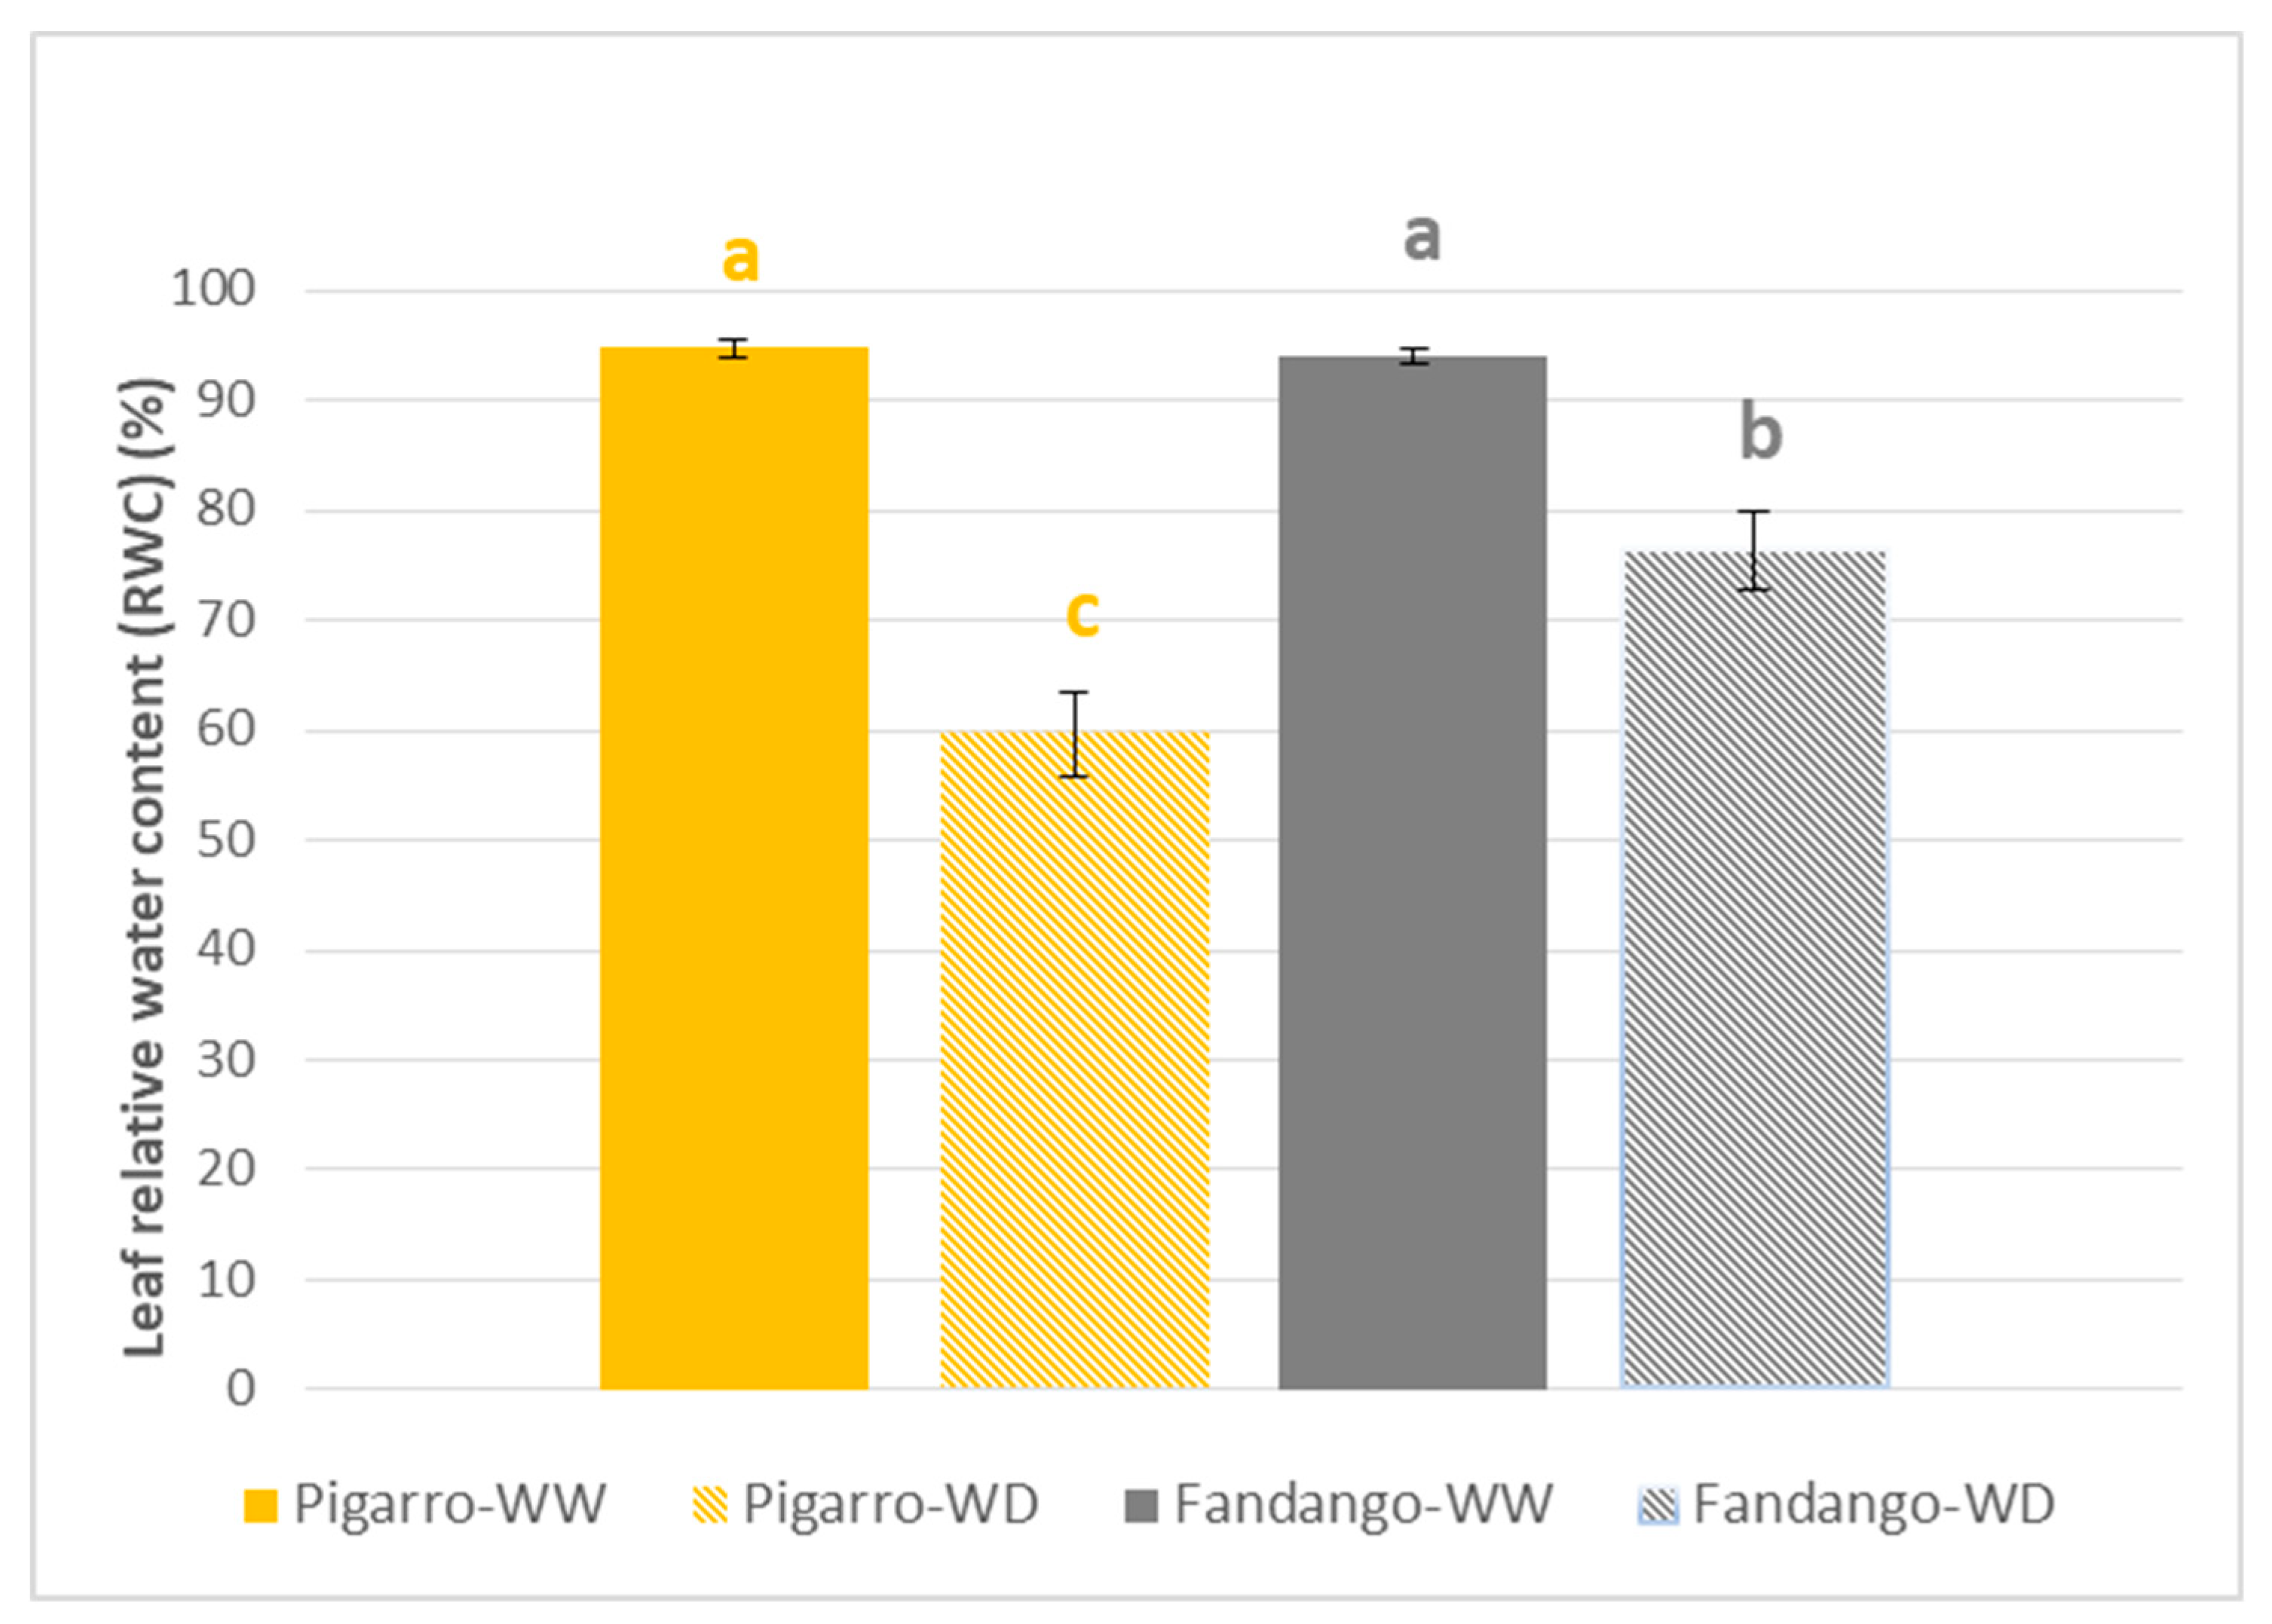
3.2.1. Soil Water Content and Plant Water Status

The gravimetric analysis at 16, 21 and 27 DAG indicated that the SWC in the WD pots reached slightly below 35%, 25–15%, and less than 15% respectively. On the WW treatment, pots were maintained at 35% of SWC along the trial. Regarding RWC, the most severe stress conditions (15% SWC), reduced significantly leaf RWC to 81 and 63% respectively in ‘Fandango’ and ‘Pigarro’ populations as compared to WW plants, but both populations kept around 90% RWC in control conditions. ‘Pigarro’ was more negatively affected by water deprivation as compared to control. ‘Pigarro’ retained only 63% of its control RWC against the 81% retained by ‘Fandango’ when compared to the control (Tables S6 and S7, Figure 14).

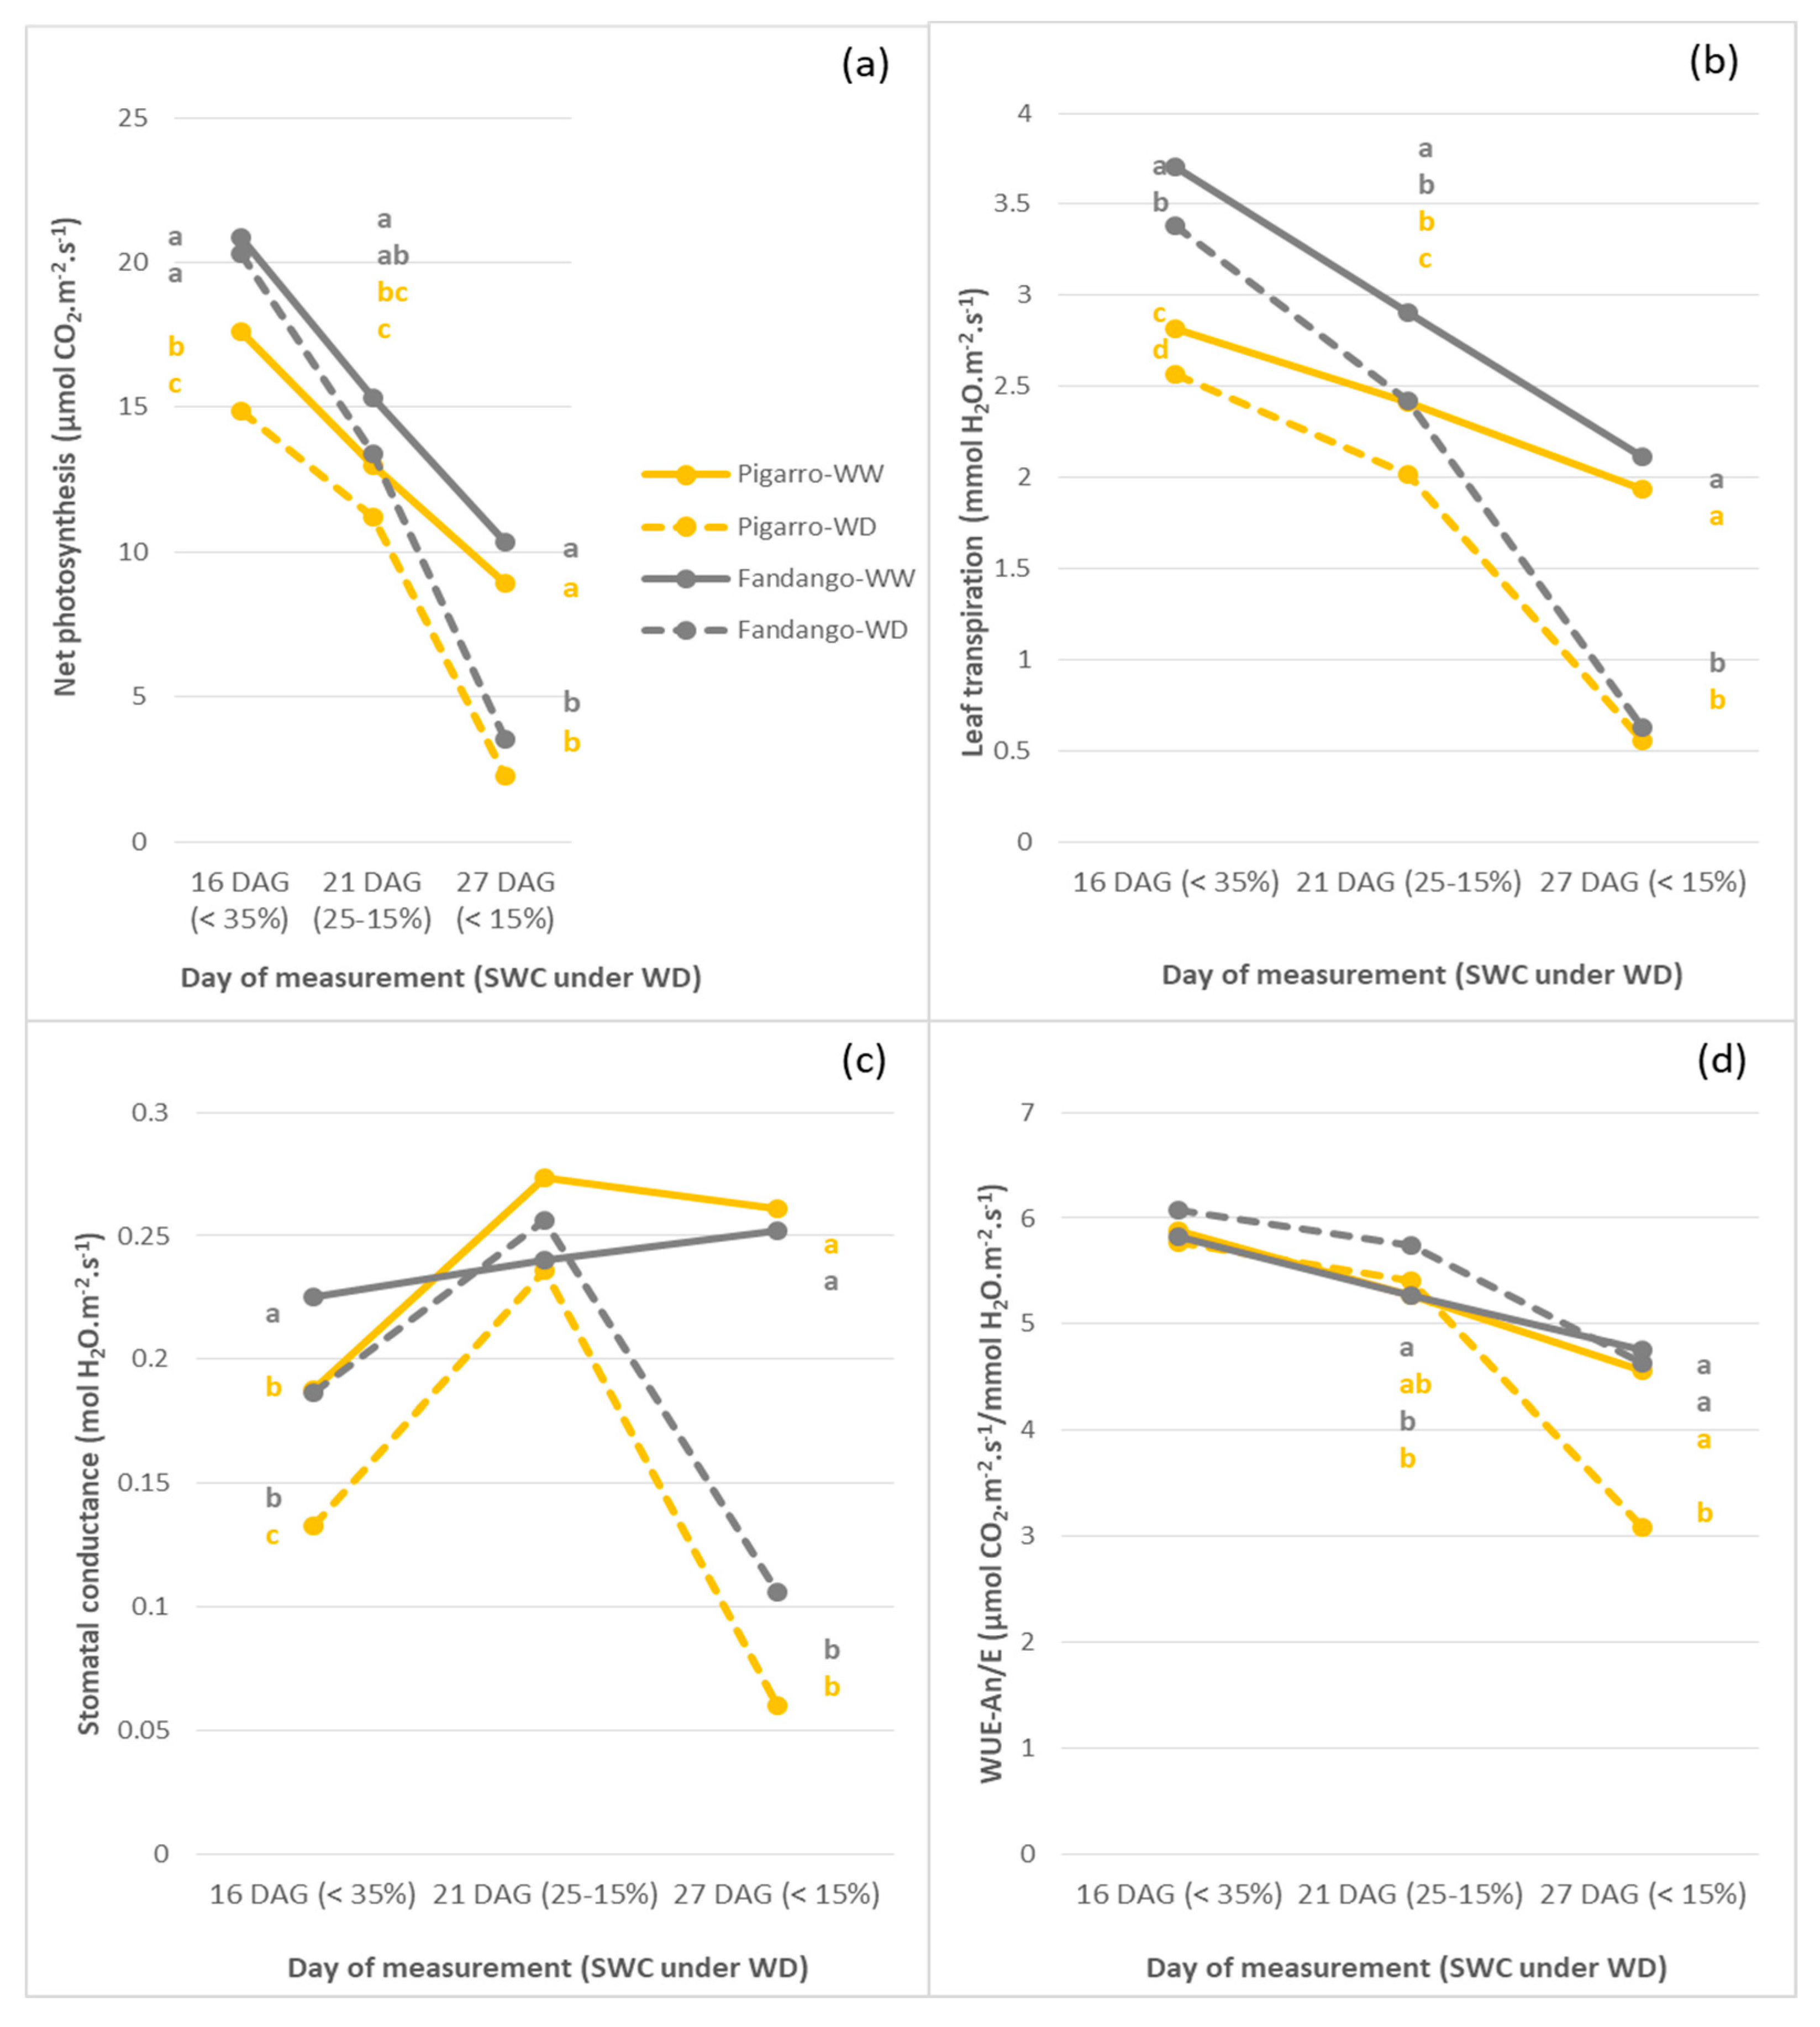
3.2.2. Individual Leaf Gas Exchange and Leaf Temperature

The An/I curves established showed a decreased in An with decreased SWC for all incident irradiances for both populations (Figure S5).
The shape of the An/I curves was similar in both populations or treatments at early water deficit (16 DAG). Nevertheless, a better photosynthetic performance of ‘Fandango’ over ‘Pigarro’ was observed at moderate water-deficit conditions (25–15% SWC).
A decrease in estimated Amax values (50%) and on LSP (30.8%) was noticed for ‘Pigarro’, while for ‘Fandango’ the decrease in Amax and LSP values was less evidenced at moderate water deficit (Table S8). Under severe water deficit (15% SWC), the shape An/I curves did not evidence strong differences between the two populations.
The imposed water deficit by water withholding reduced significantly (P < 0.001) net photosynthesis (An) as compared to control only when SWC was below 15% (Table S5). Nevertheless, under increased water deprivation, the two populations behave more similarly with no differences at An below 15% SWC (Tables S6 and S7, Figure 15). Similar results were found for transpiration rate (E) and stomatal conductance (gs) (Tables S6 and S7, Figure 15).
Under more severe stress (less than 15% SWC), WUE (An/E) did not differ anymore between the two water treatments, but started to be significantly different between populations (Tables S6 and S7). Under these stress conditions ‘Fandango’ maintained a higher WUE (97% of its WUE under WW, against the 68% of WUE under WW maintained by ‘Pigarro’) (Figure 15).
The two populations behaved similarly in what concerned leaf temperature. Both presented an increase in their temperature, already significant at moderate stress (15–25% SWC) (Figure 16, Tables S6 and S7).

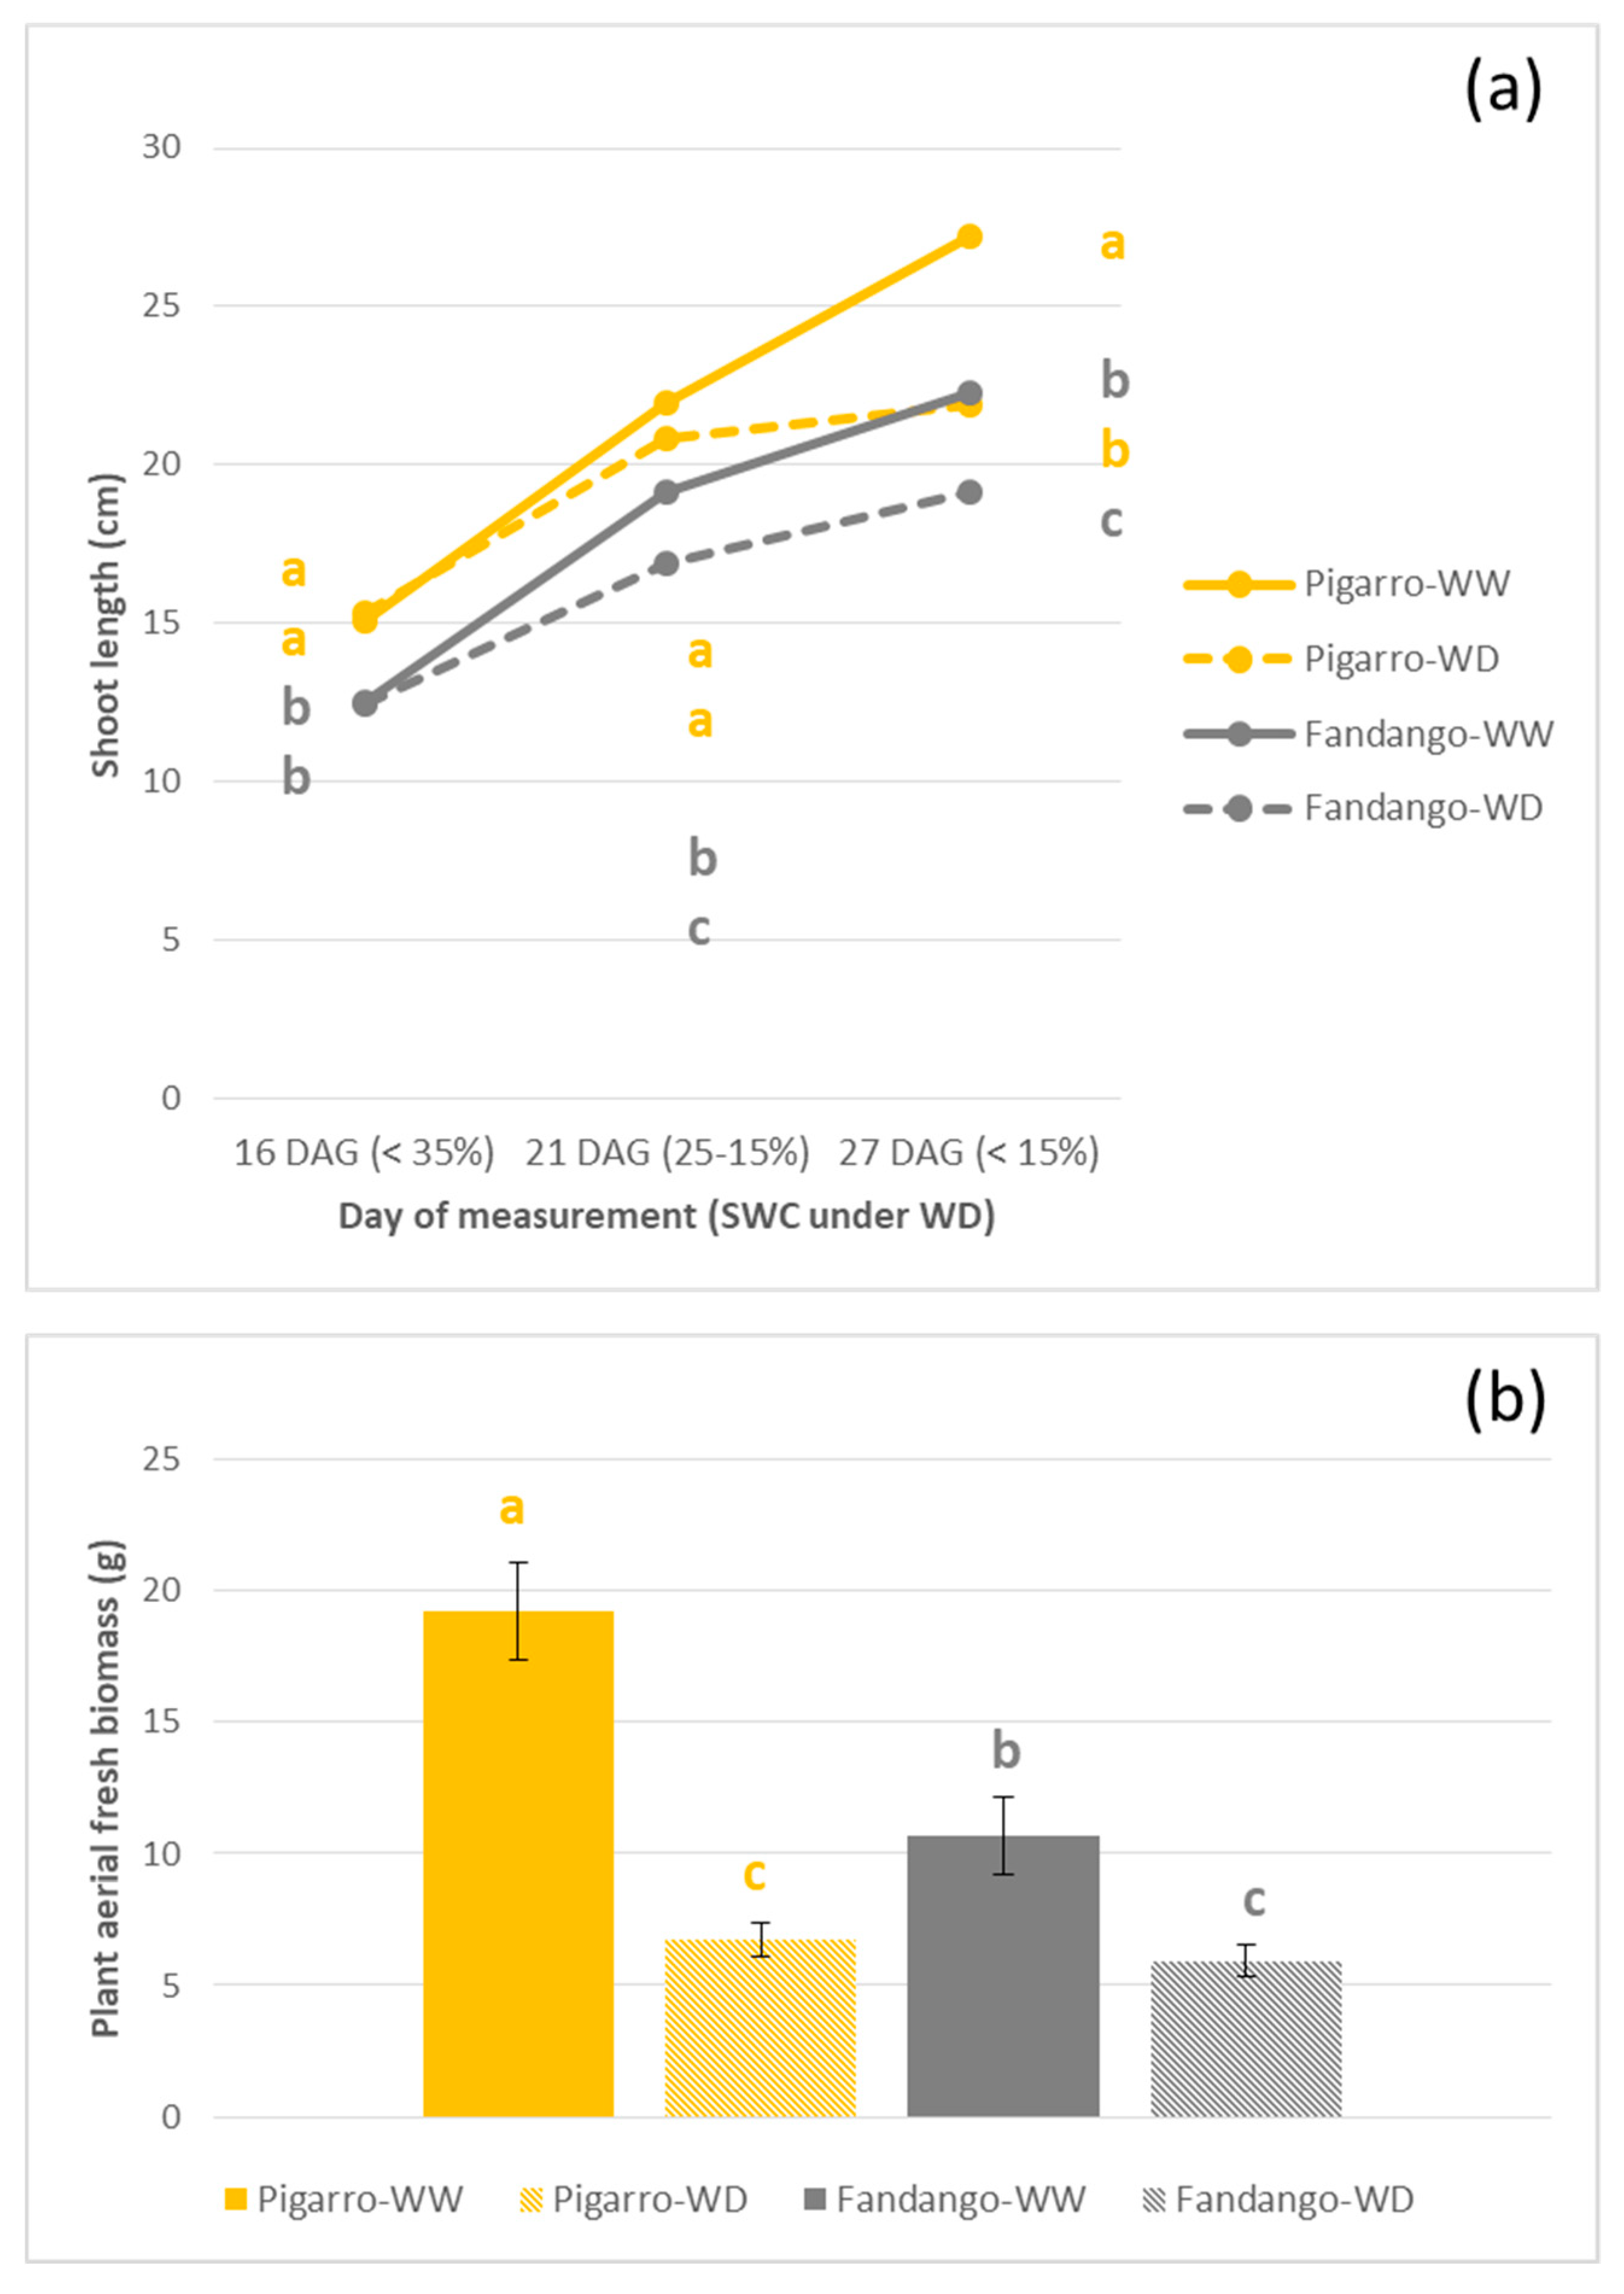
3.2.3. Plant Growth and Morphology

Although there were no differences in fresh or dry biomass at severe stress (less than 15% SWC) between the two populations, they showed differences in shoot length along the trial (Tables S6 and S7). ‘Pigarro’ plants were always significantly taller than ‘Fandango’ (Figure 17). With stress imposition, shoot length and fresh biomass were significantly reduced on both populations. At less than 15% SWC, ‘Pigarro’ maintained 80% of SL values under WW conditions and ’Fandango’ 86%. Additionally, at this extreme stress imposition ‘Fandango’ maintained 56% of its FB under WW and ‘Pigarro’ 35% (Tables S6 and S7 and Figure 17). Nevertheless, and contrary to ‘Pigarro’, ‘Fandango’ was able to maintain the number of leaves under the most extreme stress (Table S9).

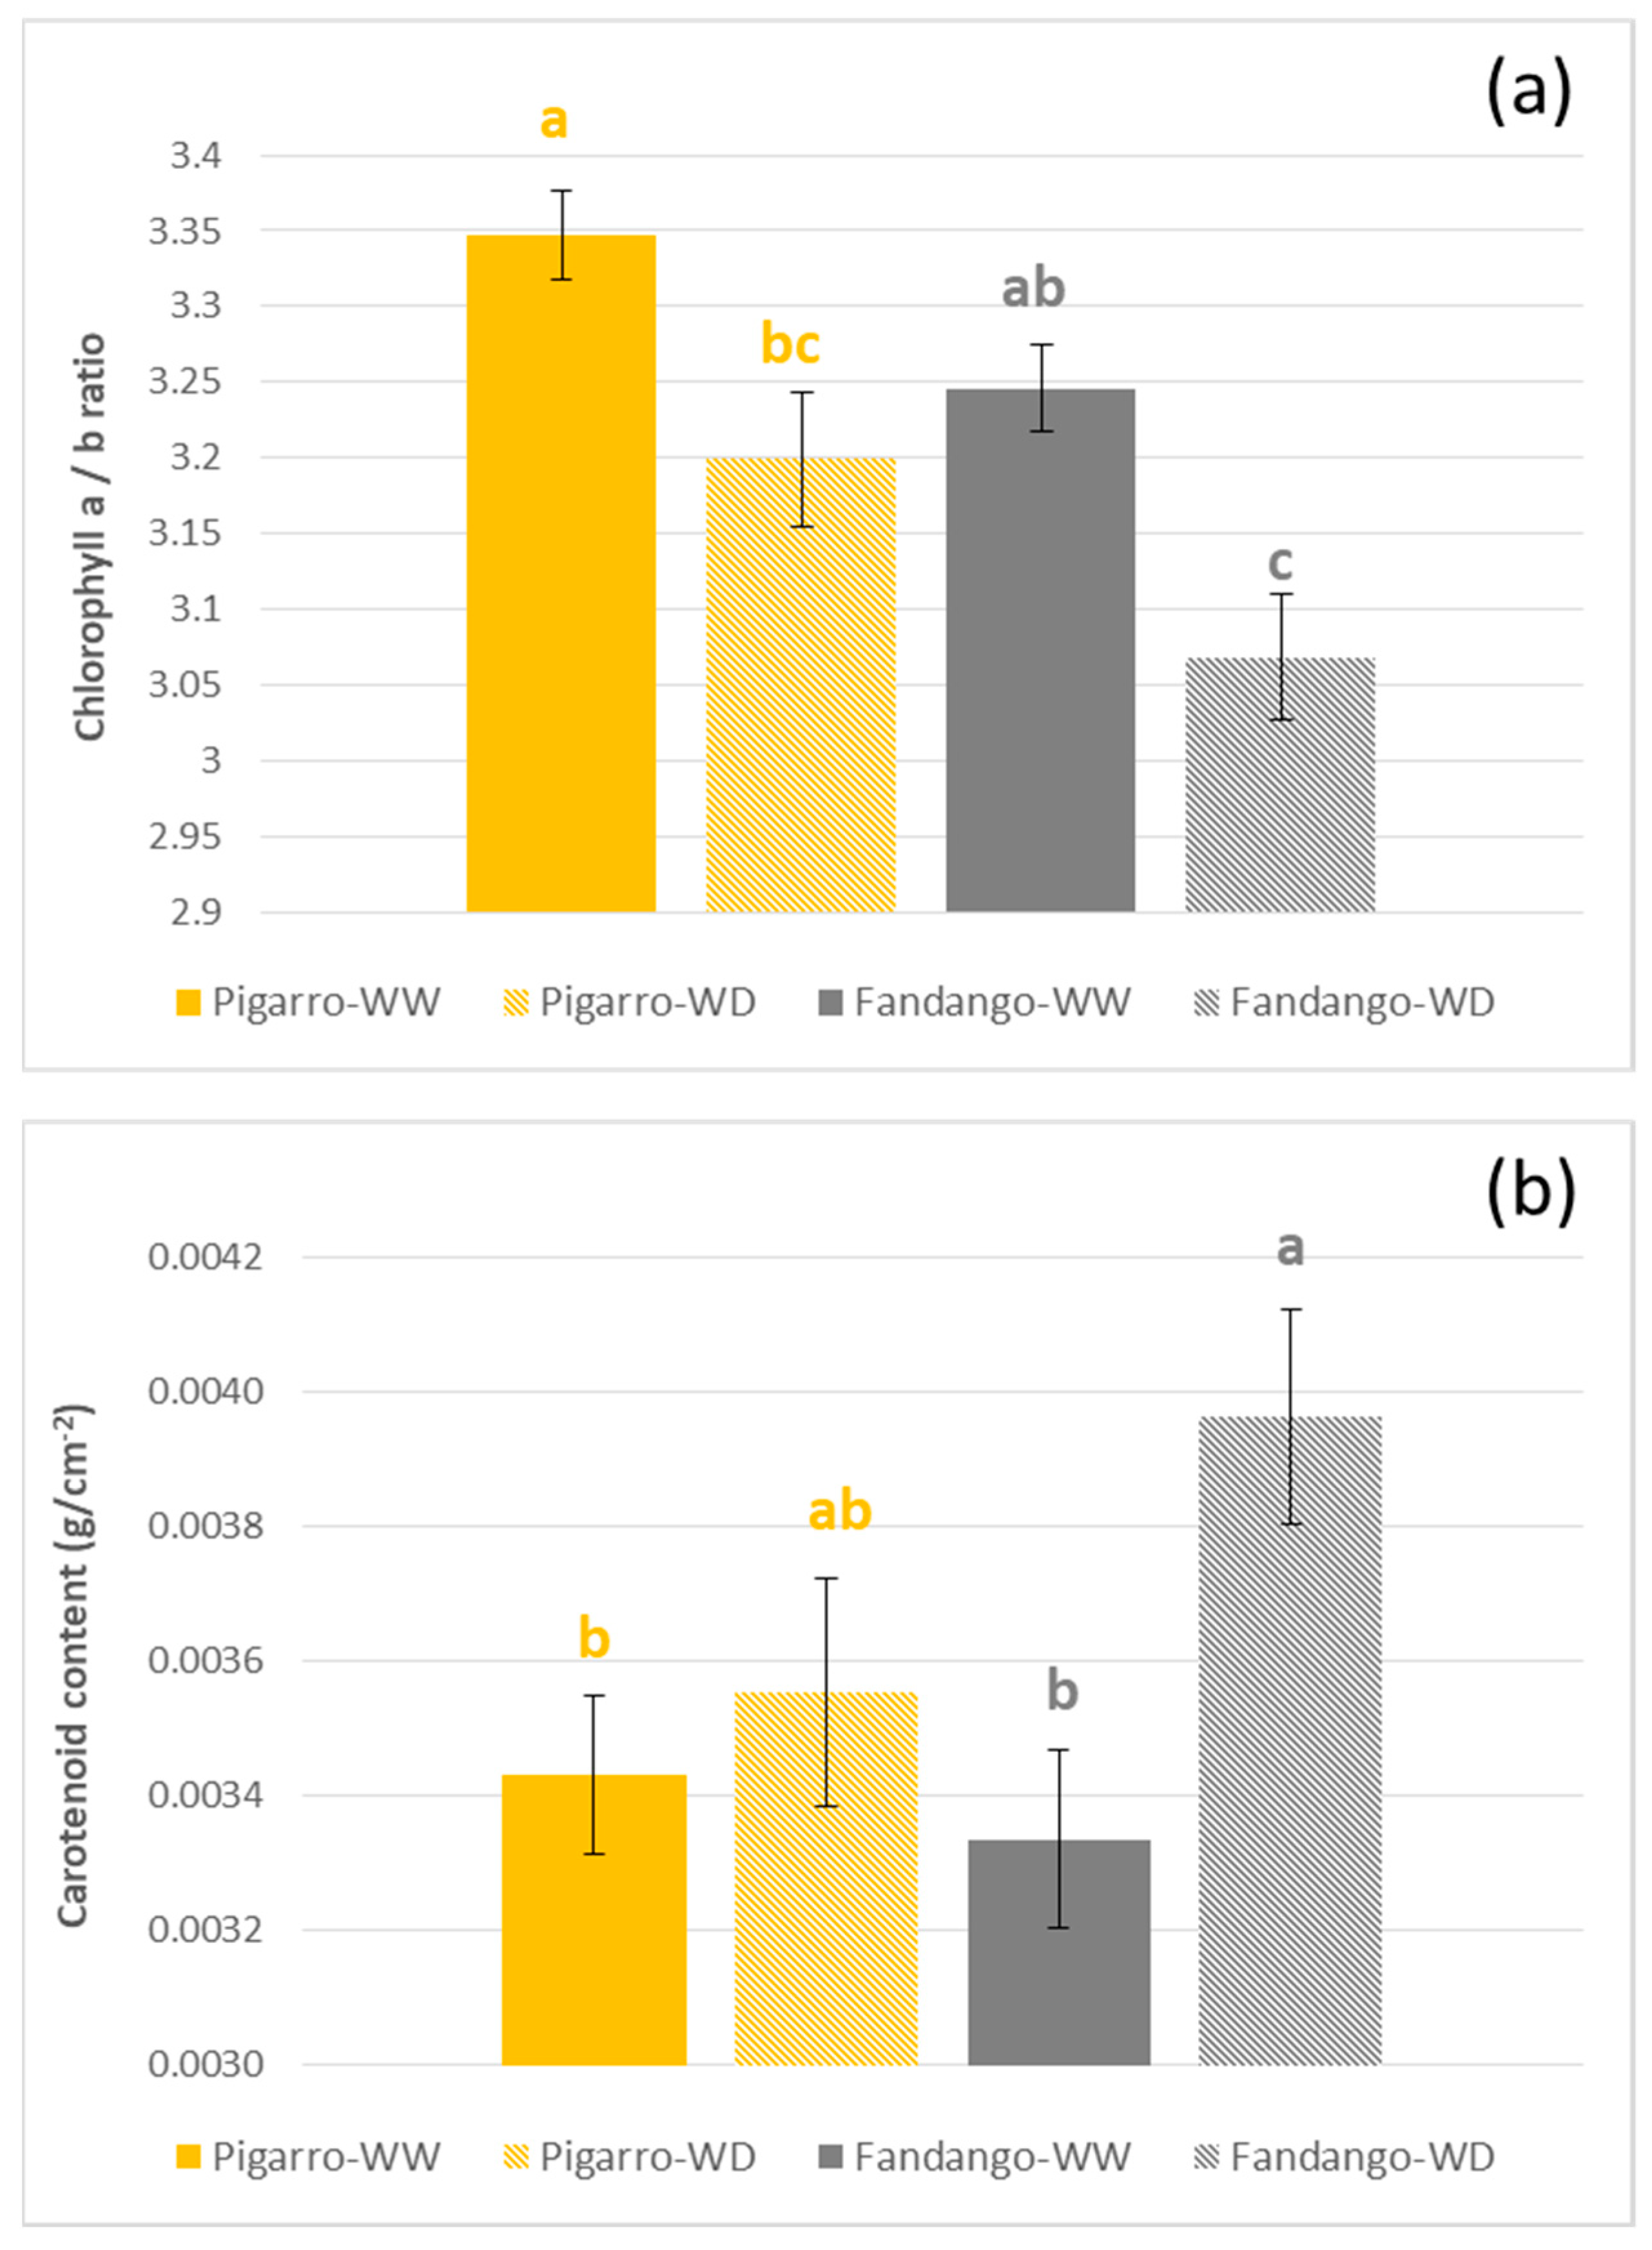
3.2.4. Leaf Photosynthetic Pigments

No significant differences were detected for Chla, Chlb, or total chlorophyll (TChl) content neither for the TChl/Ccx ratio between the two populations or water regimes (Tables S6 and S7).
However the highest imposed water stress (15% SWC) resulted in a significant increase of carotenoids content (Ccx) on the ‘Fandango’ population (119% when compared with well-watered conditions), and a decrease in the Chla/Chlb ratio on both populations (‘Pigarro’ maintaining 96% of WW conditions value, and ‘Fandango’ 94%) (Tables S6 and S7 and Figure 18).

3.2.5. Correlation Analysis

Under growth chamber controlled conditions correlations between traits were calculated at 27 DAG, the time point with the most extreme WD (less than 15% SWC) and the highest number of traits measured.
The leaf relative water content (RWC) was strongly and positively correlated with the gas exchange parameters (net photosynthesis (An), stomatal conductance (gs) and transpiration rate (E)), that in turn were also correlated between them. This occurred especially under WW conditions (Figure 19). The aerial dry biomass (DB) was strongly and positively correlated with the fresh biomass (FB), and both were correlated with shoot length (SL). Correlations between the photosynthetic pigments related parameters were high and positive. TChl strongly correlated with Chla, Chlb and Ccx (Figure 19).

3.2.6. Multivariate Analysis

The principal component analysis was performed using the traits varying significantly among water treatment and/or maize population at 15% SWC (27 DAG, when water deficit imposed significant effects in the photosynthetic performance of the two maize populations analyzed) (Tables S6 and S7). The first two components retained 66.16% of the total cumulative variance, with the first component explaining 50% of the observed variance (Figure 20).
The first principal component clearly separated WD from WW treatments, with carotenoid content increasing and plant growth and photosynthetic performance decreasing under water stress conditions. Nonetheless, there was a strong overlap of individual genotypes from the two maize populations in any of the water treatments. The PCA biplot revealed also that it was still possible to identify individual ‘Pigarro’ or ‘Fandango’ plants (genotypes) which presented a good performance despite WD conditions (higher net photosynthesis and higher biomass or plant height, with values sometimes surpassing the individual plants of the same populations under WW conditions).

4. Discussion

Due to climate change and more adverse growing conditions for crops, selection for drought resistance is becoming a major target in maize breeding, in particular for low-input agriculture. Maize landraces and OPV populations developed under dry conditions are putative sources of adaptation traits to be used in breeding.
Farmer’s participatory selection is more relevant across drought-prone regions, where local variation in soils and landscape results in strong G × E interactions [35]. Site-specific trait selection, adjusted to local climate conditions, is more likely to result in sustainable crop yields in a changing climate context. However, the quantitative nature of drought resistance hampers its selection, especially under participatory plant breeding programs. Effective, simple and low-cost field phenotyping approaches to select more drought-resistant genotypes within these genetic materials are thus required.
By comparing field eco-physiological responses to progressive water deprivation on four different maize OPVs, using different remote and contact sensors validated by gas exchange, we identified the performance index (PIABS) as the best drought response phenotyping trait to use as a refinement criterion for participatory maize breeding. However, the use of this selection tool seems to be efficient only under moderate water limitations (17–20% SWC).
In addition, using individual leaf gas exchange parameters under controlled conditions, we were able to detect variability in the response to water deprivation inside the better yielding OPVs (‘Pigarro’ and ‘Fandango’). This variability may allow the stratified selection of individuals better adapted to drought within populations.

4.1. Portuguese Maize Populations Depict Significant Variation in Response to Water Availability

In all the four analyzed maize populations, yield (using ear weight (EW) as a proxy since no prolific plants were detected) was reduced under dry conditions in agreement with previous literature [67,68,69]. However, the four populations show different yield potentials (measured as EW under WW conditions). Indeed, ‘Pigarro’, but especially ‘Fandango’ had almost the double of the yield of ‘Bilhó’ and ‘Caniceira’ under WW conditions. Interestingly, these higher productive populations (‘Fandango’ and ‘Pigarro’) were the less resilient to stress in what concerned yield (EW WD/EW WW), with the biggest EW percentage decrease under WD compared to the control. ‘Caniceira’ stood out as the most resistant population to water deficit but was, however, the less productive one, which most probably relates to its distinct smaller plant size, and consequently, smaller transpiring leaf area in both treatments. Smaller canopies maintain yield under water stress at levels closer to that of the irrigated plants [70]. Limiting the size of the transpiring leaf area is one of the strategies to control plant water losses but smaller canopy also reduces the capacity of light interception and thus photosynthetic capacity limiting yield [70].
Plant survival, per se, has little economic value to farmers, being much more valuable the performance in terms of the yield parameter under water-limited conditions [70]. Therefore, based on the maize agronomic performance under the tested conditions, we may conclude that the best performing populations under water shortage conditions (and best candidates for breeding for drought tolerance) will be the synthetic ‘Fandango’ and to a certain extent also the improved OPV ‘Pigarro’ that showed high yield potential under optimal watering conditions and were still able to keep high grain yield under dry conditions.
The yield (EW) losses of the evaluated populations varied from 41% until 57% in response to water deficit. Based on this, we can consider that the applied stress was severe [71,72] with extreme effects on population performance. When we look in detail to the effect of the progression of water deficits on morpho or eco-physiological traits that might influence final yield, the ‘Bilhó’ population also stands out at moderate stress level. Under moderate water deficit ‘Bilhó’ is one of the highest resilient populations based on the performance index (PIABS WD/PIABS WW), however with reduced yield potential. This population is originally from a high location (800 m altitude), that in Portugal is normally associated with dry conditions. This is in agreement with the results of others that concluded that maize landraces from dry regions (Southern Europe or Algeria) are generally less sensitive to water stress with medium-to-low yields [68,72]. However, this strategic resilient response under moderate stress, needs further confirmation, with different stress level imposition maintained equal throughout the field experiment.

4.2. Diversity of Responses under Moderate Stress, Similar Strategies under Severe Stress

Plants respond to stress in multiple ways. Common responses to avoid or tolerate abiotic stresses include stomatal closure, reduced photosynthesis, increased reactive oxygen scavenging activity, reduced leaf growth and increased root length [73].
Growth is the trait in plants that is most sensitive to water deficit, with decreases in growth preceding decreases in photosynthesis [74]. Indeed, in our field study, and in agreement with previous results in maize populations [75,76,77] plant stem height (PH) was already affected by water deprivation in all the four populations at a moderate water deficit (20% SWC), while for the majority of the populations, leaf gas exchange parameters of the stress exposed plants were similar to that of the non-stressed plants until 87% of the soil moisture was depleted (13% SWC). A reduction on shoot length (SL) when water deficit was still moderate (25–15% SWC) was also observed for maize seedlings grown under the growth chamber conditions experiment agreeing with previous results from Reference [67].
In our study, An, E and gs were affected by drought. The reduction in An under dry conditions agrees with previous reports for maize [26,77,78,79]. Such reduction in An is mainly ascribed to stomatal limitations (physiological control of the influx of atmospheric CO2 [80]) and to a less extent on non-stomatal limitations (e.g., photoinhibition of PSII center [81]). In our study, the strong relationship between An and gs observed both at field and controlled conditions suggest that the reduction in An is mainly caused by stomatal closure. Our maize populations seem to respond to water deficit by closing stomata to limit water loss and this, in turn, reduces photosynthesis [82]. Keeping stomata open (like by osmotic adjustment) would sustain growth under water-limited conditions but would also sustain water losses and could be detrimental in many situations [70].
Within the four tested populations, ‘Caniceira’, was the population with the highest An, gs and E along the trial under irrigated conditions, but also the first to consistently reduce its An under WD conditions. ‘Fandango’, the tallest and highly productive population (under any of the treatments) was the population that kept leaf gas exchange parameters and leaf RWC similar to control conditions for longer.
The best performing populations under water deficit (‘Fandango’ and ‘Pigarro’) exhibit specific traits or combinations of traits of adaptive value when facing water deficit (conservative regulation of gs vs. water use efficiency strategy). Under water deficit, ‘Fandango’ conserved its RWC similar to control conditions, both in field and growth chamber conditions experiments, and this might have contributed to maintaining its photosynthetic performance as seen by its higher WUE. Under growth chamber conditions, the two populations increased their Tleaf under a moderate water deficit behaving similarly, but with a steeper increase recorded in ‘Fandango’. This might be explained by stomatal closure in WD plants and supported by previous studies [27,43].
Contrary to what was reported by Chiuta and Mutengwa [76] in maize, no significant variation of Chla or b content was observed under water-deficit conditions. However, a significant decrease in the Chla/Chlb ratio was observed in both populations and a significant increase in carotenoids content in ‘Fandango’. This may translate a response to stress in which the synthesis of Chlb or Ccx could be a photoprotective response of the photosynthetic apparatus as previously suggested for other species [83,84].
Under extreme drought, the populations behavior became very similar in what concerned eco-physiology parameters but also morphology and final production in agreement with previous maize reports [26,67].

4.3. High Chances to Identify Individual Maize Genotypes within OPVs Better Performing under WD

There is a growing awareness that climate change will make it increasingly difficult to achieve the needed genetic gains unless new allelic diversity is brought into existing gene pools [85]. Landraces are isolated gene pools with novel allelic diversity of the same crop genome, in particular, landraces originating in condition of relevance to breeding targets [86].
The controlled conditions experiment allowed us to screen in detail for a higher number of individuals per population and this was relevant to confirm the presence of a diversity of responses to water deficit between and especially within two Portuguese maize OPVs, known for their genetic diversity and genetic differentiation [11]. The presence of this within-population diversity is the basis for population improvement.
Better performing individual maize plants under drought were identified within populations, with higher net photosynthesis and high biomass or plant height, with values sometimes surpassing the well-watered individual plants of the same populations, and these are interesting ones to develop new varieties for low water input agriculture.

4.4. Remote Does Not Always Mean Efficient

Under field conditions thermal imaging discriminated WD treatment with higher Tleaf, but not varieties due to adult plant complex architecture. However, under controlled conditions and using leaflets (smaller plants) it was possible to accurately measure Tleaf differences in each of the maize populations and treatments.
Considering the above limitations, the tested thermal imaging equipment arises as not suitable for field selection. Nevertheless, it is possible that improvements could be achieved by modifying plant spacing to avoid excessive leaf overlapping.

4.5. Performance Index (PIABS), an Expedite, Low-Cost, and Efficient Field Phenotyping Approach for Drought Responses in Maize under Moderate Stress

Vadez et al. [70] postulated that future breeding is likely to become environment-specific, with the subsequent development of cultivars with a trait makeup that fits specific conditions, and tuned by probability scenarios linked to climate/weather conditions. Under this scenario, there are great opportunities for optimized local adaptation through participatory decentralized breeding as the Portuguese maize program.
The lowest cost sensors are the breeder’s eyes when ranking through visual scorings of key traits but are depending on the human subjective perception. The use of modern sensors produces large amount of standardized data that besides being independent on personal perception is important for successful plant phenotyping in field or controlled conditions [87], and in particular for participatory plant breeding, in which several actors are normally involved in plant selection.
Maize populations behaved contrastingly between WW and severe WD for leaf gas exchange parameters. Leaf gas exchange distinguished WD treatment and varieties but is highly laborious to use under field conditions. Chlorophyll a fluorescence parameters collected using contact sensors, and in particular PIABS also differentiated populations’ behavior under WD, but especially under moderate water deficit imposition. In this situation, the correlation of PIABS and the gas exchange parameters or yield and morphology traits was higher. In our study, and at moderate stress (17% SWC) ‘Caniceira’ already showed a significantly smaller PIABS score from ‘Bilhó’ or ‘Fandango’. This may anticipate marked differences concerning plant vitality, PSII function and susceptibility to photoinhibition as already proposed in maize by Chiuta and Mutengwa [76].
The potential of Chl a fluorescence to access photosynthetic performance was already confirmed by the consistency of Chl a fluorescence results with gas exchange parameters to distinguish resilient from sensitive maize accessions under WD by Reference [26].
One of the limitations of our work was to compare under the same field study four population with different flowering times (different FAO cycles). However, our stress imposition started before any of the population entered flowering (no possibility of an escape mechanism), and records were taken and stress imposed until the end of flowering time for all the populations. This is a drought situation that currently exists in Mediterranean rain-fed systems.

5. Conclusions

Based on the easiness to score and population discriminatory power, the performance index PIABS emerges in our conditions as an integrative and nondestructive phenotyping method for participatory maize selection under field conditions. Considering the correlation variation of PIABS and gas exchange parameters or yield and morphology, and that the studied maize populations behaved on the same way under severe water deprivation, maize selection with this tool under moderate stress should be more discriminative and could be complemented with the use addition the morphological trait (plant stem height) to the ongoing participatory breeding program.
Independently of the water regime, the two participatory breeding OPVs had the highest yields. Additionally, under WD, “Fandango” had the highest performance index (PIABS).
As already stated by others [3], implementing such breeding tools into participatory selection brings up another issue. To make these tools easily available, a network or platform of participatory research connecting enthusiastic, open-minded and better-educated farmers, breeders, and scientists must be built to make its application a reality. This should be also accompanied by the development of extension activities promoted by the local government or local associations. An increased investment in phenotyping tools and network [88], as well as on agricultural extension services, is needed. This is especially true in countries such as Portugal, where crop phenotyping is not organized and the national authorities have substantially reduced their extension activities. The idea of peer-to-peer learning should be developed in order to promote the transfer of novel technologies and or field procedures among growers.

Supplementary Materials

The following are available online at https://www.mdpi.com/2071-1050/11/21/6081/s1. Figure S1. False-colored infrared thermal images (ThermaCAM B20, 7.5–13 µm, 320 × 240 pixels Flir), showing a group of four plants growing in well-watered conditions (left side image) and water–deficit conditions (WD) (right-side images), in controlled conditions, one week after water stress was imposed. Plants were grown under LED light, Tair = 26 °C and RH = 47%. Images were analyzed by using the ThermaCAM Researcher software (FLIR Systems, USA). Figure S2. RGB (a) and false-colored infrared thermal (b) image (FLIR E50bx, 7.5–13 µm, 240 × 180 pixels), showing the control well-watered (WW) and the water-deficit plants (WD) in field conditions, 67 days after sowing (21st August 2018). Measurements were done at around 15:30, with Tair = 36 °C; RH=70%) and the temperature difference between WW and WD plants (ΔTWW-WD) was equal to −2.8 °C. Figure S3. Potential ear weight (EW under well-watered conditions (WW)) vs. ear weight resilience (EW under water deficit (WD)/EW under WW) measured after harvest on four maize populations (‘Bilhó’ in blue, ‘Caniceira’ in orange, ‘Fandango’ in grey and ‘Pigarro’ in yellow). Figure S4. PIABS resilience (PIABS under water deficit (WD)/PIABS under WW) variation in field conditions along the trial (24th July (38 days after sowing) until 21st August (66 days after sowing)) for the four maize populations (‘Bilhó’ in blue, ‘Caniceira’ in orange, ‘Fandango’ in grey and ‘Pigarro’ in yellow). Figure S5. Photosynthetic light response curves (An/I) established under controlled conditions by IRGA (LCpro+, ADC BioScientific Ltd., Hertfordshire, UK) at 16 (a, b), 21 (c, d) and 27 (e, f) days after germination (DAG) for two maize populations ‘Fandango’(FN) and ‘Pigarro’ (PG) and two irrigation treatments (Well-Watered—WW (solid line) and Water Deficit—WD (dashed line)). Values are means ± standard error (n = 3–5). Table S1. Summary of the Box-cox transformation procedures’ results (field and growth chamber conditions). Table S2. Generalized linear model (GLM) for 15 morpho-physiological parameters measured under field conditions and after harvest. The statistical model included as factors the four maize populations, the treatment (WW vs. WD), the time point (when applicable) and the interaction between population and treatment and population and time point. Table S3. Regression analysis, per population and time point, fitting the treatment term (WW vs. WD) for variables measured in the field experiment from T1 to T4 (T1: 21st July, T2: 7th August, T3: 14th August, T4: 21st August), and after harvest. Table S4. Relevant plant and leaf traits measured for four maize populations grown under field conditions, from time point T1 to T4 (T1: 21st July, T2: 7th August, T3: 14th August, T4: 21st August), under well-watered (WW) and water deficit (WD) conditions. For each time point and treatment, mean values in each column followed by the same letter are not significantly different at P<0.05 (Tukey’s multiple comparisons test). Legend: BL—‘Bilhó’; CA—‘Caniceira’; FN—‘Fandango’; PG—‘Pigarro’. Table S5. Relevant plant and ear traits measured for four maize populations grown under field conditions at 21st August and after harvest, under well-watered (WW) water deficit (WD) conditions. For each treatment, mean values in each column followed by the same letter are not significantly different at P<0.05 (Tukey’s multiple comparisons test). Legend: BL—‘Bilhó’; CA—‘Caniceira’; FN—‘Fandango’; PG—‘Pigarro’. Table S6. Generalized linear model (GLM) results for variables measured under growth chamber conditions at 16 DAG (35% soil water content), 21 DAG (25% soil water content), and 27 DAG (15% soil water content). The statistical model included a constant, the populations, the treatment and their interaction (Y = Constant + TREATMENT + POPULATION + (TREATMENT × POPULATION). Y corresponds to the response variable (Trait), TREATMENT refers to ‘Well-Watered’ or ‘Water Deficit’, and POPULATION refers to ‘Fandango’ or ‘Pigarro’. Table S7. Analysis of variance and comparison of mean values for Fandango (FN) and Pigarro (PG) maize populations subjected to well-watered (WW) and water deficit (WD) regimens under growth chamber conditions. Legend: POP-Population; TREAT-Treatment. Table S8. Leaf photosynthetic parameters derived from the plotted An/I curves for the two maize populations ‘Fandango’ and ‘Pigarro’ subjected to well-watered (WW, control) and water deficit (WD) conditions under growth chamber conditions. Curves were done at 16 DAG (<35% SWC), 21 DAG (25–15% SWC) and 27 DAG (<15% SWC) Values are means ± SE (n = 3–5). Legend: Amax—maximum A; LSP—light saturation point; ɸ—photosynthetic apparent quantum yield; Rd—dark respiration; LCP—apparent light compensation point. Table S9. Number of leaves (LN) for ‘Fandango’ and ‘Pigarro’ maize populations subjected to well-watered (WW) and water deficit (WD) regimes under growth chamber conditions. Means comparison using the non-parametric Mann–Whitney U (Wilcoxon rank-sum) test. Values are means ± SD. Table S10. Glossary of most common acronyms and abbreviations.

Author Contributions

Conceptualization, P.M.-M., S.S.A., J.M.C. and M.C.V.P.; Data curation, S.T.L. and M.L.A.; Formal analysis, S.T.L., M.C.B., M.L.A., D.S., S.S.A. and J.M.C.; Funding acquisition, P.M.-M. and M.C.V.P.; Investigation, S.T.L., E.F., M.C.B., D.P., D.S., P.M.-M., S.S.A., J.M.C. and M.C.V.P.; Project administration, P.M.-M. and M.C.V.P.; Resources, D.S., P.M.-M., S.S.A., J.M.C. and M.C.V.P.; Supervision, P.M.-M., S.S.A., J.M.C. and M.C.V.P.; Validation, P.M.-M., S.S.A., J.M.C. and M.C.V.P.; Visualization, S.T.L., M.C.B. and M.L.A.; Writing—original draft, M.C.V.P.; Writing—review & editing, S.T.L., M.C.B., M.L.A., P.M.-M., S.S.A. and J.M.C.

Funding

This research was funded by European Union, H2020 project DIVERSIFOOD—Embedding crop diversity and networking for local high quality food systems” grant number 633571 and by Fundação para a Ciência e Tecnologia, research unit GREEN-it “Bioresources for Sustainability” (UID/Multi/04551/2019), M.C.V.P. by FCT Investigator Programme 2014 (IF/01337/2014), S.S.A by PhD Holder (DL57) contract and J.M.C. by SFRH/BPD/93334/2013.

Acknowledgments

We acknowledge the support with thermography measurements of the Ph.D. student Miqueias Permanhani (CAPES Foundation, Brazil) and of Ph.D. Ana Fortunato (LEM, ITQB NOVA).

Conflicts of Interest

The authors declare no conflicts of interest. The funders had no role in the design of the study; in the collection, analyses, or interpretation of data; in the writing of the manuscript, or in the decision to publish the results.

References

  1. Prohens, J. Plant Breeding: A success story to be continued thanks to the advances in genomics. Front. Plant Sci. 2011, 2, 51. [Google Scholar] [CrossRef] [PubMed]
  2. Hallauer, A.R.; Carena, M.J. Maize breeding. In Handbook of Plant Breeding: Cereals; Carena, M.J., Ed.; Springer: New York, NY, USA, 2009; pp. 3–98. [Google Scholar]
  3. Vaz Patto, M.C.; Mendes-Moreira, P.M.; Alves, M.L.; Mecha, E.; Brites, C.; Bronze, R.; Pego, S. Participatory plant quality breeding: An ancient art revisited by knowledge sharing. The Portuguese experience. In Plant Breeding from Laboratories to Fields; Andersen, S.B., Ed.; InTech: London, UK, 2013; Chapter 10; pp. 255–288. [Google Scholar] [CrossRef]
  4. Ceccarelli, S.; Grando, S. Participatory plant breeding: Who did it, who does it and where? Exp. Agric. 2019, 33, 335–344. [Google Scholar] [CrossRef]
  5. Weltzien, E.; Christinck, A. Participatory breeding: Developing improved and relevant crop varieties with farmers. In Agricultural Systems, 2nd ed.; Agroecology and Rural Innovation Development. Agricultural Systems; Academic Press: Cambridge, MA, USA, 2017; pp. 259–301. [Google Scholar]
  6. Vaz Patto, M.C.; Moreira, P.M.; Carvalho, V.; Pêgo, S. Collecting maize with technological ability for bread production in Portugal. Genet. Res. Crop Evol. 2007, 54, 1555–1563. [Google Scholar] [CrossRef]
  7. Alves, M.L.; Carbas, B.; Gaspar, D.; Paulo, M.; Brites, C.; Mendes-Moreira, P.; Brites, C.M.; Malosetti, M.; van Eeuwijk, F.; Vaz Patto, M.C. Genome-wide association study for kernel composition and flour pasting behavior in wholemeal maize flour. BMC Plant Biol. 2019, 19, 123. [Google Scholar] [CrossRef]
  8. Pêgo, S.; Martins, R. Resistance or tolerance? Philosophy may be the answer. In Proceedings of the XIX Conference of the International Working Group on Ostrinia Nubilabis and Other Maize Pests, Guimarães, Portugal, 30 August–5 September 1997; IOBC, IWGO: Guimarães, Portugal, 1997; pp. 303–341. [Google Scholar]
  9. Mendes-Moreira, P.M.M.; Vaz Patto, M.C.; Mota, M.; Mendes-Moreira, J.; Santos, J.P.N.; Santos, J.P.P.; Andrade, E.; Hallauer, A.R.; Pego, S.E. Fandango: Long term adaptation of exotic germplasm to a Portuguese on-Farm-conservation and breeding project. Maydica 2009, 54, 269–285. [Google Scholar]
  10. Mendes-Moreira, P.; Satovic, Z.; Mendes-Moreira, J.; Santos, J.P.; Nina Santos, J.P.; Pêgo, S.E.; Vaz Patto, M.C. Maize participatory breeding in Portugal. Comparison of farmer’s and breeder’s on-farm selection. Plant Breed. 2017, 136, 861–871. [Google Scholar] [CrossRef]
  11. Alves, M.L.; Belo, M.; Carbas, B.; Brites, C.; Paulo, M.; Mendes-Moreira, P.; Brites, C.; Bronze, M.R.; Šatović, Z.; Vaz Patto, M.C. Long term on-farm participatory maize breeding by stratified mass selection retains molecular diversity while improving agronomic performance. Evol. Applic. 2018, 11, 254–270. [Google Scholar] [CrossRef]
  12. Moreira, P.M. Participatory maize breeding in Portugal. A case study. Acta Agron. Hung. 2006, 54, 431–439. [Google Scholar] [CrossRef]
  13. Mitter, H.; Larcher, M.; Schönhart, M.; Stöttinger, M.; Schmid, E. Exploring farmers’ climate change perceptions and adaptation intentions: Empirical evidence from Austria. Environ. Manag. 2019, 63, 804–821. [Google Scholar] [CrossRef]
  14. Resenzweig, C.; Elliott, J.; Deryng, D.; Ruane, A.C.; Müller, C.; Arneth, A.; Boote, K.J.; Folberth, C.; Glotter, M.; Khabarov, N. Assessing agricultural risks of climate change in the 21st century in a global gridded crop model intercomparison. Proc. Natl. Acad. Sci. USA 2014, 111, 3268–3273. [Google Scholar] [CrossRef]
  15. Guo, H.; Zhang, X.; Lian, F.; Gao, Y.; Lin, D.; Wang, J. Drought risk assessment based on vulnerability surfaces: A case study of maize. Sustainability 2016, 8, 813–835. [Google Scholar] [CrossRef]
  16. Bänziger, M.; Araus, J.L. Recent advances in breeding maize for drought and salinity stress tolerance. In Advances in Molecular Breeding Toward Drought and Salt Tolerant Crops; Jenks, M.A., Hasegawa, P.M., Jain, S.M., Eds.; Springer: Dordrecht, The Netherlands, 2007; pp. 587–601. [Google Scholar]
  17. Witt, S.; Galicia, L.; Lisec, J.; Cairns, J.; Tiessen, A.; Araus, J.L.; Palacios-Rojas, N.; Fernie, A.R. Metabolic and phenotypic responses of greenhouse-grown maize hybrids to experimentally controlled drought stress. Mol. Plant 2012, 5, 401–417. [Google Scholar] [CrossRef] [PubMed]
  18. European Environment Agency (EEA). Water Resources in Europe in the Context of Vulnerability. In EEA 2012 State of Water Assessment. EEA Report No 11/2012ISSN 1725-9177. Available online: https://www.eea.europa.eu/publications/water-resources-and-vulnerability (accessed on 21 August 2019).
  19. Costa, J.M.; Egipto, R.; Sánchez-Virosta, A.; Lopes, C.M.; Chaves, M.M. Canopy and soil thermal patterns to support water and heat stress management in vineyards. Agric. Water Manag. 2019, 216, 484–496. [Google Scholar] [CrossRef]
  20. Fita, A.; Rodríguez-Burruezo, A.; Boscaiu, M.; Prohens, J.; Vicente, O. Breeding and domesticating crops adapted to drought and salinity: A new paradigm for increasing food production. Front. Plant Sci. 2015, 6, 978. [Google Scholar] [CrossRef]
  21. Araus, J.L.; Serret, M.D.; Edmeades, G.O. Phenotyping maize for adaptation to drought. Front. Physiol. 2012, 3, 305–325. [Google Scholar] [CrossRef] [PubMed]
  22. Wolfe, M.S.; Baresel, J.P.; Desclaux, D.; Goldringer, I.; Hoad, S.; Kovacs, G.; Löschenberger, F.; Miedaner, T.; Østergård, H.; Lammerts van Bueren, E.T. Developments in breeding cereals for organic agriculture. Euphytica 2008, 163, 323–346. [Google Scholar] [CrossRef] [Green Version]
  23. Jarvis, D.I.; Hodgkin, T.; Sthapit, B.R.; Fadda, C.; Lopez-Noriega, I. An heuristic framework for identifying multiple ways of supporting the conservation and use of traditional crop varieties within the agricultural production system. Crit. Rev. Plant Sci. 2011, 30, 125–176. [Google Scholar] [CrossRef]
  24. Vaz Patto, M.C.; Alves, M.L.; Almeida, N.F.; Santos, C.; Mendes-Moreira, P.; Satovic, Z.; Brites, C. Is the bread making technological ability of Portuguese traditional maize landraces associated with their genetic diversity? Maydica 2009, 54, 297–311. [Google Scholar]
  25. Alves, M.L.; Brites, C.; Paulo, M.; Carbas, B.; Belo, M.; Mendes-Moreira, P.; Brites, C.; Bronze, M.R.; Gunjaca, J.; Satovic, Z.; et al. Setting up decision-making tools towards a quality-oriented participatory maize breeding program. Front. Plant Sci. 2017, 8, 2203. [Google Scholar] [CrossRef]
  26. Cruz de Carvalho, R.; Cunha, A.; Marques da Silva, J. Photosynthesis by six Portuguese maize cultivars during drought stress and recovery. Acta Physiol. Plant 2011, 33, 359–374. [Google Scholar] [CrossRef]
  27. Garcia-Tejero, I.V.; Costa, J.M.; Nunes da Lima, R.S.; Duran-Zuago, V.H.; Chaves, M.M.; Vaz Patto, M.C. Thermal imaging to phenotype traditional maize landraces for drought tolerance. Com. Sci. 2015, 6, 334–343. [Google Scholar] [CrossRef] [Green Version]
  28. Moreira, P.M.R.M.; Pêgo, S.E.; Vaz Patto, M.C.; Hallauer, A.R. Comparison of selection methods on Pigarro, a Portuguese improved maize population with fasciation expression. Euphytica 2008, 163, 481–499. [Google Scholar] [CrossRef]
  29. Mendes-Moreira, P.; Mendes-Moreira, J.; Fernandes, A.; Andrade, E.; Hallauer, A.R.; Pêgo, S.E.; Vaz Patto, M.C. Is ear value an effective indicator for maize yield evaluation? Field Crop Res. 2014, 161, 75–86. [Google Scholar] [CrossRef]
  30. Araus, J.L.; Slafer, G.A.; Reynolds, M.P.; Royo, C. Plant breeding and drought in C3 cereals: What should we breed for? Ann. Bot. 2002, 89, 925–940. [Google Scholar] [CrossRef]
  31. Araus, J.L.; Slafer, G.A.; Royo, C.; Serret, M.D. Breeding for yield potential and stress adaptation in cereals. Crit. Rev. Plant Sci. 2008, 27, 1–36. [Google Scholar] [CrossRef]
  32. Monneveux, P.; Ribaut, J.M. Secondary traits for drought tolerance improvements in cereals. In Drought Adaptation in Cereals; Ribaut, J.M., Ed.; Haworth Press: Binhampton, UK, 2006; pp. 97–143. [Google Scholar]
  33. Lopes, M.S.; Araus, J.L.; van Heerden, P.D.R.; Foyer, C.H. Enhancing drought tolerance in C4 crops. J. Exp. Bot. 2011, 62, 3135–3153. [Google Scholar] [CrossRef]
  34. Prasanna, B.M.; Araus, J.L.; Crossa, J.; Cairns, J.E.; Palacios, N.; Mahuku, G.; Das, B.; Magorokosho, C. High-throughput and precision phenotyping in cereal breeding programs. In Cereal Genomics II, 3rd ed.; Kluwer Academic Publishers: New York, NY, USA, 2012; pp. 341–374. [Google Scholar]
  35. Fischer, K.S.; Fukai, S.; Kumar, A.; Leung, H.; Jongdee, B. Field phenotyping strategies and breeding for adaptation of rice to drought. Front. Physiol. 2012, 3, 282. [Google Scholar] [CrossRef]
  36. Chaves, M.M.; Maroco, J.P.; Pereira, J.S. Understanding plant responses to drought—From genes to the whole plant. Funct. Plant Biol. 2003, 30, 239–264. [Google Scholar] [CrossRef]
  37. Long, S.P.; Bernacchi, C.J. Gas exchange measurements, what can they tell us about the underlying limitations to photosynthesis? Procedures and sources of error. J. Exp. Bot. 2003, 54, 2393–2401. [Google Scholar] [CrossRef] [Green Version]
  38. Jones, H.G. Plants and Microclimate, 2nd ed.; Cambridge University Press: Cambridge, UK, 1992; 423p. [Google Scholar]
  39. Chaves, M.M.; Flexas, J.; Pinheiro, C. Photosynthesis under drought and salt stress: Regulation mechanisms from whole plant to cell. Ann. Bot. 2009, 103, 551–560. [Google Scholar] [CrossRef]
  40. Kummerlen, B.; Dauwe, S.; Schmundt, D.; Schurr, U. Thermography to measure water relations of plant leaves. In Handbook of Computer Vision and Applications: Systems and Applications; Jähne, B., Hauecker, H., Geiler, P., Eds.; Academic Press: Heidelberg, Germany, 1999; pp. 763–781. [Google Scholar]
  41. Jones, H.G.; Vaughan, R.A. Remote Sensing of Vegetation: Principles, Techniques and Applications; Oxford University Press: Oxford, UK, 2010; 284p. [Google Scholar]
  42. Costa, J.M.; Grant, O.; Chaves, M.M. Thermography to explore plant-environment interactions. J. Exp. Bot. 2013, 64, 3937–3949. [Google Scholar] [CrossRef] [PubMed]
  43. García-Tejero, I.F.; Hernández-Cotán, A.; Apolo, O.E.; Durán-Zuazo, V.H.; Aguilar Portero, M.; Rubio-Casal, A.E. Infrared thermography to select commercial varieties of maize in relation to drought adaptation. Quant. InfraRed Thermog. J. 2017, 14, 54–67. [Google Scholar] [CrossRef]
  44. Carrol, D.A., 2nd; Hansen, N.C.; Hopkins, B.G.; DeJonge, K.C. Leaf temperature of maize and Crop Water Stress Index with variable irrigation and nitrogen supply. Irrig. Sci. 2017, 35, 549–560. [Google Scholar] [CrossRef]
  45. Jones, H.G.; Serraj, R.; Loveys, B.R.; Xiong, L.; Wheaton, A.; Price, A.H. Thermal infrared image of crop canopies for the remote diagnosis and quantification of plant responses to water stress in the field. Funct. Plant Biol. 2009, 36, 978–989. [Google Scholar] [CrossRef]
  46. Thomas, H.; Ougham, H. The stay-green trait. J. Exp. Bot. 2014, 65, 3889–3900. [Google Scholar] [CrossRef] [PubMed]
  47. Bekavac, G.; Stojaković, M.; Ivanović, M.; Jocković, Đ.; Vasić, N.; Purar, B.; Boćanski, J.; Nastasić, A. Relationships of stay green trait in maize. Genetika 2002, 34, 33–40. [Google Scholar] [CrossRef]
  48. Baker, N.R. Chlorophyll fluorescence: A probe of photosynthesis in vivo. Ann. Rev. Plant Biol. 2008, 59, 89–113. [Google Scholar] [CrossRef]
  49. Cendrero-Mateo, M.P.; Muller, O.; Albrecht, H.; Burkart, A.; Gatzke, S.; Janssen, B.; Keller, B.; Körber, N.; Kraska, T.; Matsubara, S.; et al. Field phenotyping: Concepts and examples to quantify dynamic plant traits across scales in the field. In Terrestrial Ecosystem Research Infrastructures; Chabbi, A., Loescher, H.W., Eds.; Taylor & Francis: London, UK, 2017; pp. 54–80. [Google Scholar]
  50. Araújo, S.S.; Duque, A.S.; Marques da Silva, J.; Santos, D.; Bernardes da Silva, A.; Fevereiro, P. Water deficit and recovery response of Medicago truncatula plants expressing the ELIP-like DSP22. Biol. Plant 2013, 57, 159–163. [Google Scholar] [CrossRef]
  51. Silvestre, S.; Araújo, S.S.; Vaz Patto, M.C.; Marques da Silva, J. Performance index: An expeditious tool to screen for improved drought resistance in the Lathyrus genus. J. Integ. Plant Biol. 2014, 56, 610–621. [Google Scholar] [CrossRef]
  52. Mendes-Moreira, P.; Alves, M.L.; Satovic, Z.; Santos, J.P.; Santos, J.N.; Souza, J.C.; Pego, S.E.; Hallauer, A.R.; Vaz Patto, M.C. Genetic architecture of ear fasciation in maize (Zea mays) under QTL scrutiny. PLoS ONE 2015, 10, e0124543. [Google Scholar] [CrossRef]
  53. Ritchie, S.W.; Hanway, J.J.; Benson, G.O. How a Corn Plant Develops; Special Report 48; Iowa State University of Science and Technology, Cooperative Extension Service: Ames, IA, USA, 1993; 21p. [Google Scholar]
  54. Topp, G.C.; Davis, J.L.; Annan, A.P. Electromagnetic determination of soil water content. Water Resour. Res. 1980, 16, 574–582. [Google Scholar] [CrossRef]
  55. Campbell, J.E. Dielectric properties and influence of conductivity in soils at one to fifty megahertz. Soil Sci. Soc. Am. J. 1990, 54, 332–341. [Google Scholar] [CrossRef]
  56. Whalley, W.R. Considerations on the use of time-domain reflectometry (TDR) for measuring soil moisture content. J. Soil Sci. 1993, 44, 1–9. [Google Scholar] [CrossRef]
  57. Whalley, W.R.; Cope, R.E.; Nicholl, C.J.; Whitmore, A.P. In-field calibration of a dielectric soil moisture meter designed for use in an access tube. Soil Use Manag. 2004, 20, 203–206. [Google Scholar] [CrossRef]
  58. Greco, R.; Guida, A. Field measurements of topsoil moisture profiles by vertical TDR probes. J. Hydrol. 2008, 348, 442–451. [Google Scholar] [CrossRef]
  59. Lambers, H.; Chapin, F.S., 3rd; Pons, T.L. 2A-Photosynthesis, Respiration, and Long-Distance Transport. In Plant Physiological Ecology; Springer: New York, NY, USA, 2009; pp. 11–99. [Google Scholar] [CrossRef]
  60. Čatský, J. Determination of water deficit in disks cut out from leaf blades. Biol. Plant 1960, 2, 76. [Google Scholar] [CrossRef]
  61. Jones, H.G.; Stoll, M.; Santos, T.; de Souza, C.; Chaves, M.M.; Grant, O. Use of infrared thermography for monitoring stomatal closure in the field: Applications to grapevine. J. Exp. Bot. 2002, 53, 1–12. [Google Scholar] [CrossRef]
  62. Strasser, R.J.; Srivastava, A.; Tsimilli-Michael, M. The fluorescence transient as a tool to characterize and screen photosynthetic samples. In Probing Photosynthesis: Mechanisms, Regulations and Adaptation; Yunus, M., Pathre, U., Mohanty, P., Eds.; Taylor & Francis: London, UK, 2000; pp. 445–483. [Google Scholar]
  63. Strasser, R.J.; Tsimilli-Michael, M. Activity and heterogeneity of PSII probed in vivo by the chlorophyll a fluorescence rise O-(K)-J-I-P. In Photosynthesis: Mechanisms and Effects; Garab, G., Ed.; Kluwer Academic Publishers: Alphen aan den Rijn, The Netherlands, 1998; Volume V, pp. 4321–4324. [Google Scholar] [CrossRef]
  64. Maxwell, K.; Johnson, G.N. Chlorophyll fluorescence—A practical guide. J. Exp. Bot. 2000, 51, 659–668. [Google Scholar] [CrossRef]
  65. Lichtenthaler, H.K.; Buschmann, C. Chlorophylls and carotenoids: Measurement and characterization by UV-VIS spectroscopy. In Current Protocols in Food Analytical Chemistry; John Wiley & Sons, Inc.: Hoboken, NJ, USA, 2001. [Google Scholar] [CrossRef]
  66. VSN. GenStat for Windows; VSN International: Hemel Hempstead, UK, 2017. [Google Scholar]
  67. Djemel, A.; Alvarez-Iglesias, L.; Pedrol, N.; Lopez-Malvar, A.; Ordás, A.; Revilla, P. Identification of drought tolerant populations at multi-stage growth phases in temperate maize germplasm. Euphytica 2018, 214, 138. [Google Scholar] [CrossRef]
  68. Djemel, A.; Cherchali, F.Z.; Benchikh-Le-Hocine, M.; Malvar, R.A.; Revilla, P. Assessment of drought tolerance among Algerian maize populations from oases of the Saharan. Euphytica 2018, 214, 149. [Google Scholar] [CrossRef]
  69. Ziygomo, C.; Bernardo, R. Drought tolerance in maize: Indirect selection through secondary traits versus genome-wide selection. Crop Sci. 2013, 52, 1269–1275. [Google Scholar] [CrossRef]
  70. Vadez, V.; Kholova, J.; Zaman-Allah, M.; Belko, N. Water: The most important ‘molecular’ component of water stress tolerance research. Funct. Plant Biol. 2013, 40. [Google Scholar] [CrossRef]
  71. Araus, J.L.; Sanchez, C.; Edmeades, G.O. Phenotyping maize for adaptation to drought. In Drought Phenotyping in Crops: From Theory to Practice; Monneveux, P., Ribaut, J.M., Eds.; CGIAR Generation Challenge Programme: Texcoco, Mexico, 2011; pp. 263–283. [Google Scholar]
  72. Gouesnard, B.; Zanetto, A.; Welcker, C. Identification of adaptation traits to drought in collections of maize landraces from southern Europe and temperate regions. Euphytica 2016, 209, 565–584. [Google Scholar] [CrossRef]
  73. Maiti, R.K.; Satya, P. Research advances in major cereal crops for adaptation to abiotic stresses. GM Crops Food 2014, 5, 259–279. [Google Scholar] [CrossRef] [Green Version]
  74. Tardieu, F.; Granier, C.; Muller, B. Water deficit and growth. Co-ordinating processes without an orchestrator? Curr. Opin. Plant Biol. 2011, 14, 283–289. [Google Scholar] [CrossRef]
  75. Aslam, M.; Muhammad, A.M.; Cengiz, R. Effects of drought on maize. In Drought Stress in Maize (Zea mays L.); Springer: Berlin, Germany, 2016; pp. 5–17. [Google Scholar]
  76. Chiuta, N.E.; Mutengwa, C.S. Response of yellow quality protein maize inbred lines to drought stress at seedling stage. Agronomy 2018, 8, 278. [Google Scholar] [CrossRef]
  77. Mangani, R.; Tesfamariam, E.H.; Bellocchi, G.; Hassen, A. Growth, development, leaf gaseous exchange, and grain yield response of maize cultivars to drought and flooding stress. Sustainability 2018, 10, 3492–3510. [Google Scholar] [CrossRef]
  78. Pelleschi, S.; Rocher, J.P.; Prioul, J.L. Effect of water restriction on carbohydrate metabolism and photosynthesis in mature maize leaves. Plant Cell Environ. 1997, 20, 493–503. [Google Scholar] [CrossRef]
  79. Voronin, P.Y.; Rakhmankulova, Z.F.; Maevskaya, S.N.; Nikolaeva, M.K.; Shuiskaya, E.V. Changes in photosynthesis caused by adaptation of maize seedlings to short-term drought. Russ. J. Plant Physiol. 2014, 61, 131–135. [Google Scholar] [CrossRef]
  80. Chaves, M.M. Effects of water deficits on carbon assimilation. J. Exp. Bot. 1991, 42, 1–16. [Google Scholar] [CrossRef]
  81. Farqujar, G.D.; Hubick, K.T.; Condon, A.G.; Richards, R.A. Carbon isotope fractionation and plant water-use efficiency. In Stable Isotopes in Ecological Research; Springer: Berlin, Germany, 2017; pp. 21–40. [Google Scholar]
  82. Tardieu, F. Plant response to environmental conditions: Assessing potential production, water demand, and negative effects of water deficit. Front. Phys. 2013, 18, 4–17. [Google Scholar] [CrossRef] [PubMed]
  83. Lichtenthaler, H.K.; Ač, A.; Marek, M.V.; Kalina, J.; Urban, O. Differences in pigment composition, photosynthetic rates and chlorophyll fluorescence images of sun and shade leaves of four tree species. Plant Physiol. Biochem. 2007, 45, 577–588. [Google Scholar] [CrossRef] [PubMed]
  84. Sapeta, H.; Lourenço, T.; Lorenz, S.; Grumaz, C.; Kirstahler, P.; Barros, P.M.; Costa, J.M.; Sohn, K.; Oliveira, M.M. Transcriptomics and physiological analyses reveal co-ordinated alteration of metabolic pathways in Jatropha curcas drought tolerance. J. Exp. Bot. 2016, 67, 845–860. [Google Scholar] [CrossRef] [PubMed]
  85. Reynolds, M.; Langridge, P. Physiological breeding. Curr. Opin. Plant Biol. 2016, 31, 162–171. [Google Scholar] [CrossRef] [Green Version]
  86. Reynolds, M.; Tattaris, M.; Cossani, C.M.; Ellis, M.; Yamaguchi-Shinozaki, K.; Pierre, C.S. Exploring genetic resources to increase adaptation of wheat to climate change. In Advances in Wheat Genetics: From Genome to Field; Ogihara, Y., Takumi, S., Handa, H., Eds.; Springer: Tokyo, Japan, 2015; pp. 355–368. [Google Scholar] [CrossRef]
  87. Araus, J.L.; Kefauver, S.C. Breeding to adapt agriculture to climate change: Affordable phenotyping solutions. Curr. Opin. Plant Biol. 2018, 45, 237–247. [Google Scholar] [CrossRef]
  88. Costa, J.M.; Marques da Silva, J.; Pinheiro, C.; Barón, M.; Mylona, P.; Centritto, M.; Haworth, M.; Loreto, F.; Uzilday, B.; Turkan, I.; et al. Opportunities and limitations of crop phenotyping in southern European countries. Front. Plant Sci. 2019, 10, 1125. [Google Scholar] [CrossRef]
Figure 1. Growing conditions (maximum (cream line) and minimum (light blue line) daily air temperature, relative humidity (grey line)) and water relations ((total rainfall (light blue columns) and irrigation dosage common to well-watered (WW) and water deficit (WD) conditions (dark blue column) and specific to WW conditions (green columns), and soil water content measured at 30 cm deep (SWC30) red dots: WD conditions; green dots: WW conditions)) variation during the field trial.
Sustainability 11 06081 g001
Figure 2. Field experimental setup. Abbreviations: RCBD—randomized complete block design, SWC—soil water content, RWC—relative water content, IRGA—Infra-red gas analyzer, rep—repetition, Chl. Flour. (OJIP)—OJIP Chlorophyll a fluorescence, Leaf temp.—leaf temperature.
Sustainability 11 06081 g002
Figure 3. Controlled growth chamber experimental setup. Abbreviations: OPV—open-pollinated variety, DAG—days after germination, SWC—soil water content, RWC—relative water content, IRGA—Infra-red gas analyzer, treat—treatment, Leaf temp.—leaf temperature.
Sustainability 11 06081 g003
Figure 4. RGB (a) and infrared thermal images (ThermaCAM B20, 7.5–13 µm, 320 × 240 pixels Flir) in grey scale (b) showing a group of four plants growing in well-watered conditions (left side image) and water-deficit conditions (WD) (right-side images), in controlled conditions, one week after water withholding. Plants were grown under LED light, Tair = 26 °C and RH = 47%. Images were analyzed by using the ThermaCAM Researcher software (FLIR Systems Inc., Wilsonville, OR, USA). ΔT = WW − WD.
Sustainability 11 06081 g004
Figure 5. Leaf relative water content (RWC) variation in field conditions, from the 24th July (38 days after sowing) until the 21st of August (66 days after sowing) for four maize populations (‘Bilhó’ in blue, ‘Caniceira’ in orange, ‘Fandango’ in grey and ‘Pigarro’ in yellow) and two irrigation treatments (Water Deficit—WD (dashed line) and Well-Watered—WW (solid line)). Asterisks represent WW vs. WD treatment comparison significance per population and measurement time (** p ≤ 0.01; *** p ≤ 0.001). Different letters within each time point represent significant differences within maize populations (color coded) per treatment. Abbreviation: SWC—soil water content.
Sustainability 11 06081 g005
Figure 6. Leaf gas exchange parameters ((a) net photosynthesis—An, (b) leaf transpiration—E, (c) stomatal conductance—gs) and (d) instantaneous water use efficiency (WUE: An/E) variation in field conditions, measured using a portable IRGA system (LCpro+, ADC BioScientific Ltd., Hertfordshire, UK), from the 24th July (38 days after sowing) until the 21st of August (66 days after sowing) for four maize populations (‘Bilhó’ in blue, ‘Caniceira’ in orange, ‘Fandango’ in grey and ‘Pigarro’ in yellow) and two irrigation treatments (Water Deficit—WD (dashed line) and Well-Watered—WW (solid line)). Asterisks represent the significance of the WW vs. WD treatment comparison per population and measurement time (* p ≤ 0.05; ** p ≤ 0.01; *** p ≤ 0.001). Different letters within each time point represent significant differences within maize populations (color coded) per treatment. Abbreviations: IRGA—Infra-Red Gas Analyzer, SWC—soil water content.
Sustainability 11 06081 g006
Figure 7. (a) Plant stem height and (b) leaf number variation in field conditions along the trial (24th July (38 days after sowing) until 21st August (66 days after sowing)) for the four maize populations (‘Bilhó’ in blue, ‘Caniceira’ in orange, ‘Fandango’ in grey and ‘Pigarro’ in yellow) and two irrigation treatments (Water Deficit—WD (dashed line) and Well-Watered—WW (solid line)). Asterisks represent the significance of the WW vs. WD treatment comparison per population and measurement time (* p ≤ 0.05; ** p ≤ 0.01; *** p ≤ 0.001). Different letters within each time point represent significant differences within maize populations (color coded) per treatment. Abbreviation: SWC—soil water content.
Sustainability 11 06081 g007
Figure 8. Fresh (a) and dry (b) plant biomass measured on the 21st of August (66 days after sowing) for four maize populations (‘Bilhó’ in blue, ‘Caniceira’ in orange, ‘Fandango’ in grey and ‘Pigarro’ in yellow) and two irrigation treatments (Water Deficit—WD (dashed columns) and Well-Watered—WW (solid columns)). Asterisks represent the significance of the WW vs. WD treatment comparison per population (* p ≤ 0.05; ** p ≤ 0.01). Different letters represent significant differences within maize populations per treatment (black letter for WD conditions, grey letter for WW conditions).
Sustainability 11 06081 g008
Figure 9. Yield components ((a) ear weight, (b) ear length, (c) 1000 kernel weight and (d) kernel number /ear row) measured after harvest on four maize populations (‘Bilhó’ in blue, ‘Caniceira’ in orange, ‘Fandango’ in grey and ‘Pigarro’ in yellow) and two irrigation treatments (Water Deficit—WD (dashed columns) and Well-Watered—WW (solid columns)). Asterisks represent the significance of the WW vs. WD treatment comparison per population (color coded) (* p ≤ 0.05; ** p ≤ 0.01; *** p ≤ 0.001). Different letters represent significant differences within maize populations per treatment (black letter for WD conditions, grey letter for WW conditions).
Sustainability 11 06081 g009
Figure 10. Chlorophyll a fluorescence parameters ((a) performance index expressed on absorption basis—PIABS) and (b) maximum quantum yield of PSII—Fv/Fm variation in field conditions, using a chlorophyll a fluorometer (OS30p+, Opti-Sciences Inc., Hudson, NH, USA), from the 24th July (38 days after sowing) until the 21st of August (66 days after sowing) for four maize populations (‘Bilhó’ in blue, ‘Caniceira’ in orange, ‘Fandango’ in grey and ‘Pigarro’ in yellow) and two irrigation treatments (Water Deficit—WD (dashed line) and Well-Watered—WW (solid line)). Asterisks represent the significance of the WW vs. WD treatment comparison per population and measurement time (* p ≤ 0.05; ** p ≤ 0.01; *** p ≤ 0.001). Different letters within each time point represent significant differences within maize populations (color coded) per treatment. Abbreviations: PSII—photosystem II, SWC—soil water content.
Sustainability 11 06081 g010
Figure 11. Heatmap of Pearson’s pairwise correlations between 15 morpho-physiological traits measured under field conditions on four maize populations (‘Bilhó’, ‘Caniceira’, ‘Fandango’ and ‘Pigarro’) at 21st August and after harvesting, without considering the water treatments. Abbreviations: An_sqrt—net photosynthesis squared-root, E_tran—leaf transpiration rate transformed, gs_sqrt—stomatal conductance squared-root, An/E—water use efficiency, PIABS_sqrt—performance index squared-root, Fv/Fm—maximum quantum efficiency of photosystem II, FB_sqrt—fresh biomass squared-root, DB–dry biomass, EL_sqrt—ear length squared-root, EW—ear weight, KNR—n° of kernels/ear row, TKW—1000 kernel weight, RWC_sqrt—relative water content squared-root, PH—plant height, LN—leaf number.
Sustainability 11 06081 g011
Figure 12. Scores from the two first principal components for four maize populations field trialed under contrasting water regimes (WW vs. WD) using nine morpho-physiological parameters measured in four time points (T1: 21st July, T2: 7th August, T3: 14th August, T4: 21st August). Each dot corresponds to a population. FN: ‘Fandango’; PG: ‘Pigarro’; CA: ‘Caniceira’; BL: ‘Bilhó’. Abbreviations: An_sqrt—net photosynthesis squared-root, E_tran—leaf transpiration rate transformed, gs_sqrt—stomatal conductance squared-root, An/E—water use efficiency, PIABS_sqrt—performance index squared-root, Fv/Fm—maximum quantum efficiency of photosystem II, RWC_sqrt—relative water content squared-root, PH—plant height, LN—leaf number.
Sustainability 11 06081 g012
Figure 13. Scores from the two first principal components for four maize populations field trialed under contrasting water regimes (WW vs. WD) using 15 morpho-physiological parameters measured at (a) T1: 31st July; (b) T2: 7th August; (c) T3: 14th August; (d) T4: 21st August and after harvest. Each dot corresponds to a population. FN: ‘Fandango’; PG: ‘Pigarro’; CA: ‘Caniceira’; BL: ‘Bilhó’. Abbreviations: An_sqrt—net photosynthesis squared-root, E_tran—leaf transpiration rate transformed, gs_sqrt—stomatal conductance squared-root, An/E—water use efficiency, PIABS_sqrt—performance index squared-root, Fv/Fm—maximum quantum efficiency of photosystem II, FB_sqrt—fresh biomass squared-root, DB—dry biomass, EL_sqrt—ear length squared-root, EW—ear weight, KNR—n° of kernels/ear row, TKW—1000 kernel weight, RWC_sqrt—relative water content squared-root, PH—plant height, LN—leaf number.
Sustainability 11 06081 g013
Figure 14. Leaf relative water content (RWC) under growth chamber conditions, measured 27 days after germination for two maize populations (‘Pigarro’ in yellow and ‘Fandango’ in grey) and two irrigation treatments (Well-Watered—WW (solid columns) and Water Deficit—WD (dashed columns)). Different letters represent significant differences within maize populations and treatments (p ≤ 0.05).
Sustainability 11 06081 g014
Figure 15. (a) Net photosynthesis—An, (b) leaf transpiration—E, (c) stomatal conductance—gs and (d) instantaneous water use efficiency (An/E) measured under growth chamber conditions by IRGA (LCpro+, ADC BioScientific Ltd., Hertfordshire, UK), from the 16 days after germination (DAG) until 27 DAG for two maize populations (‘Pigarro’ in yellow and ‘Fandango’ in grey) and two irrigation treatments (Well-Watered—WW (solid line) and Water Deficit—WD (dashed line)). Different letters within a time point represent significant differences within maize populations and treatments (color coded). Only significant differences are shown (p ≤ 0.05). Abbreviation: SWC—soil water content.
Sustainability 11 06081 g015
Figure 16. Leaf temperature variation by infrared thermal imaging (ThermaCAM B20, 7.5–13 µm, 320 × 240 pixels FLIR) under growth chamber conditions from the 16 days after germination (DAG) until 27 DAG for two maize populations (‘Pigarro’ in yellow and ‘Fandango’ in grey) and two irrigation treatments (Well-Watered—WW (solid line) and Water Deficit—WD (dashed line)). Different letters within a time point represent significant differences within maize populations and treatments (color coded). Only significant differences are shown (p ≤ 0.05). Abbreviation: SWC—soil water content.
Sustainability 11 06081 g016
Figure 17. (a) Shoot length variation under growth chamber conditions from the 16 days after germination (DAG) until 27 DAG and (b) plant aerial fresh biomass measured at 27 DAG, for two maize populations (‘Pigarro’ in yellow and ‘Fandango’ in grey) and two irrigation treatments (Well-Watered—WW (solid line) and Water Deficit—WD (dashed line)). Different letters within a time point represent significant differences within maize populations and treatments (color coded). Only significant differences are shown (p ≤ 0.05). Abbreviation: SWC—soil water content.
Sustainability 11 06081 g017
Figure 18. Plant photosynthetic pigments related parameters ((a) chlorophyll a/b and (b) carotenoids content—Ccx) under growth chamber conditions, measured 27 days after germination (DAG) for two maize populations (‘Pigarro’ in yellow and ‘Fandango’ in grey) and two irrigation treatments (Well-Watered—WW (solid columns) and Water Deficit—WD (dashed columns)). Different letters represent significant differences within maize populations and treatments (p ≤ 0.05).
Sustainability 11 06081 g018
Figure 19. Heatmap of Pearson’s pairwise correlations between 14 morpho-physiological traits measured on two maize populations (‘Fandango’ and ‘Pigarro’) at 27 DAG at growth chamber conditions, without considering the water treatments. Abbreviations: An—net photosynthesis, E—leaf transpiration rate, gs—stomatal conductance, An/E—water use efficiency, Chla—chlorophyll a, Chlb—chlorophyll b, Chla/Chlb_Tran—chlorophyll a by chlorophyll b ratio transformed, Ccx—total carotenoids, TChl_Tran—total chlorophylls transformed, TChl/Ccx—total chlorophylls by carotenoids ratio, FB_Tran—fresh biomass transformed, DB_Tran—dry biomass transformed, RWC_Tran—relative water content transformed, SL_Tran—shoot length transformed.
Sustainability 11 06081 g019
Figure 20. Principal component analysis biplot based on the information of nine traits measured under growth chamber conditions at 27 DAG—Chla, Chlb, TChl_Tran, TChl/Ccx, and DB_Tran were removed since, as shown in the univariate analysis, no significant differences between varieties and/or water regimes were observed for those traits. Missing data values were imputed using the trait mean values. Each dot corresponds to an individual plant from ‘Fandango’ (FN) and ‘Pigarro’ (PG) subjected to two water regimes (well-watered—WW, and water deficit—WD). Abbreviations: An—net photosynthesis, E—leaf transpiration rate, gs—stomatal conductance, An/E—water use efficiency, Chla—chlorophyll a, Chlb—chlorophyll b, Chla/Chlb_Tran—chlorophyll a by chlorophyll b ratio transformed, Ccx—total carotenoids, TChl_Tran—total chlorophylls transformed, TChl/Ccx—total chlorophylls by carotenoids ratio, FB_Tran—fresh biomass transformed, DB_Tran—dry biomass transformed, RWC_Tran—relative water content transformed, SL_Tran—shoot length transformed.
Sustainability 11 06081 g020
Table 1. Maize open-pollinated populations name, kernel color, endosperm type, place of origin and improvement level. Abbreviations: OPV—open-pollinated variety; PPB—participatory plant breeding.
NameKernel ColorEndosperm TypePlace of Origin (Altitude)Improvement Level
BilhówhiteflintTravassos, Portugal (800 m)Farmer’s OPV
CaniceirawhiteflintTocha, Portugal (65 m)Farmer’s OPV
FandangoyellowdentMixed Portugal-USASynthetic OPV PPB
PigarrowhiteflintParedes, Portugal (189 m)Farmer’s OPV PPB

