A Comparative Study on the Influence of DC/DC-Converter Induced High Frequency Current Ripple on Lithium-Ion Batteries


Abstract
1. Introduction
2. Experimental
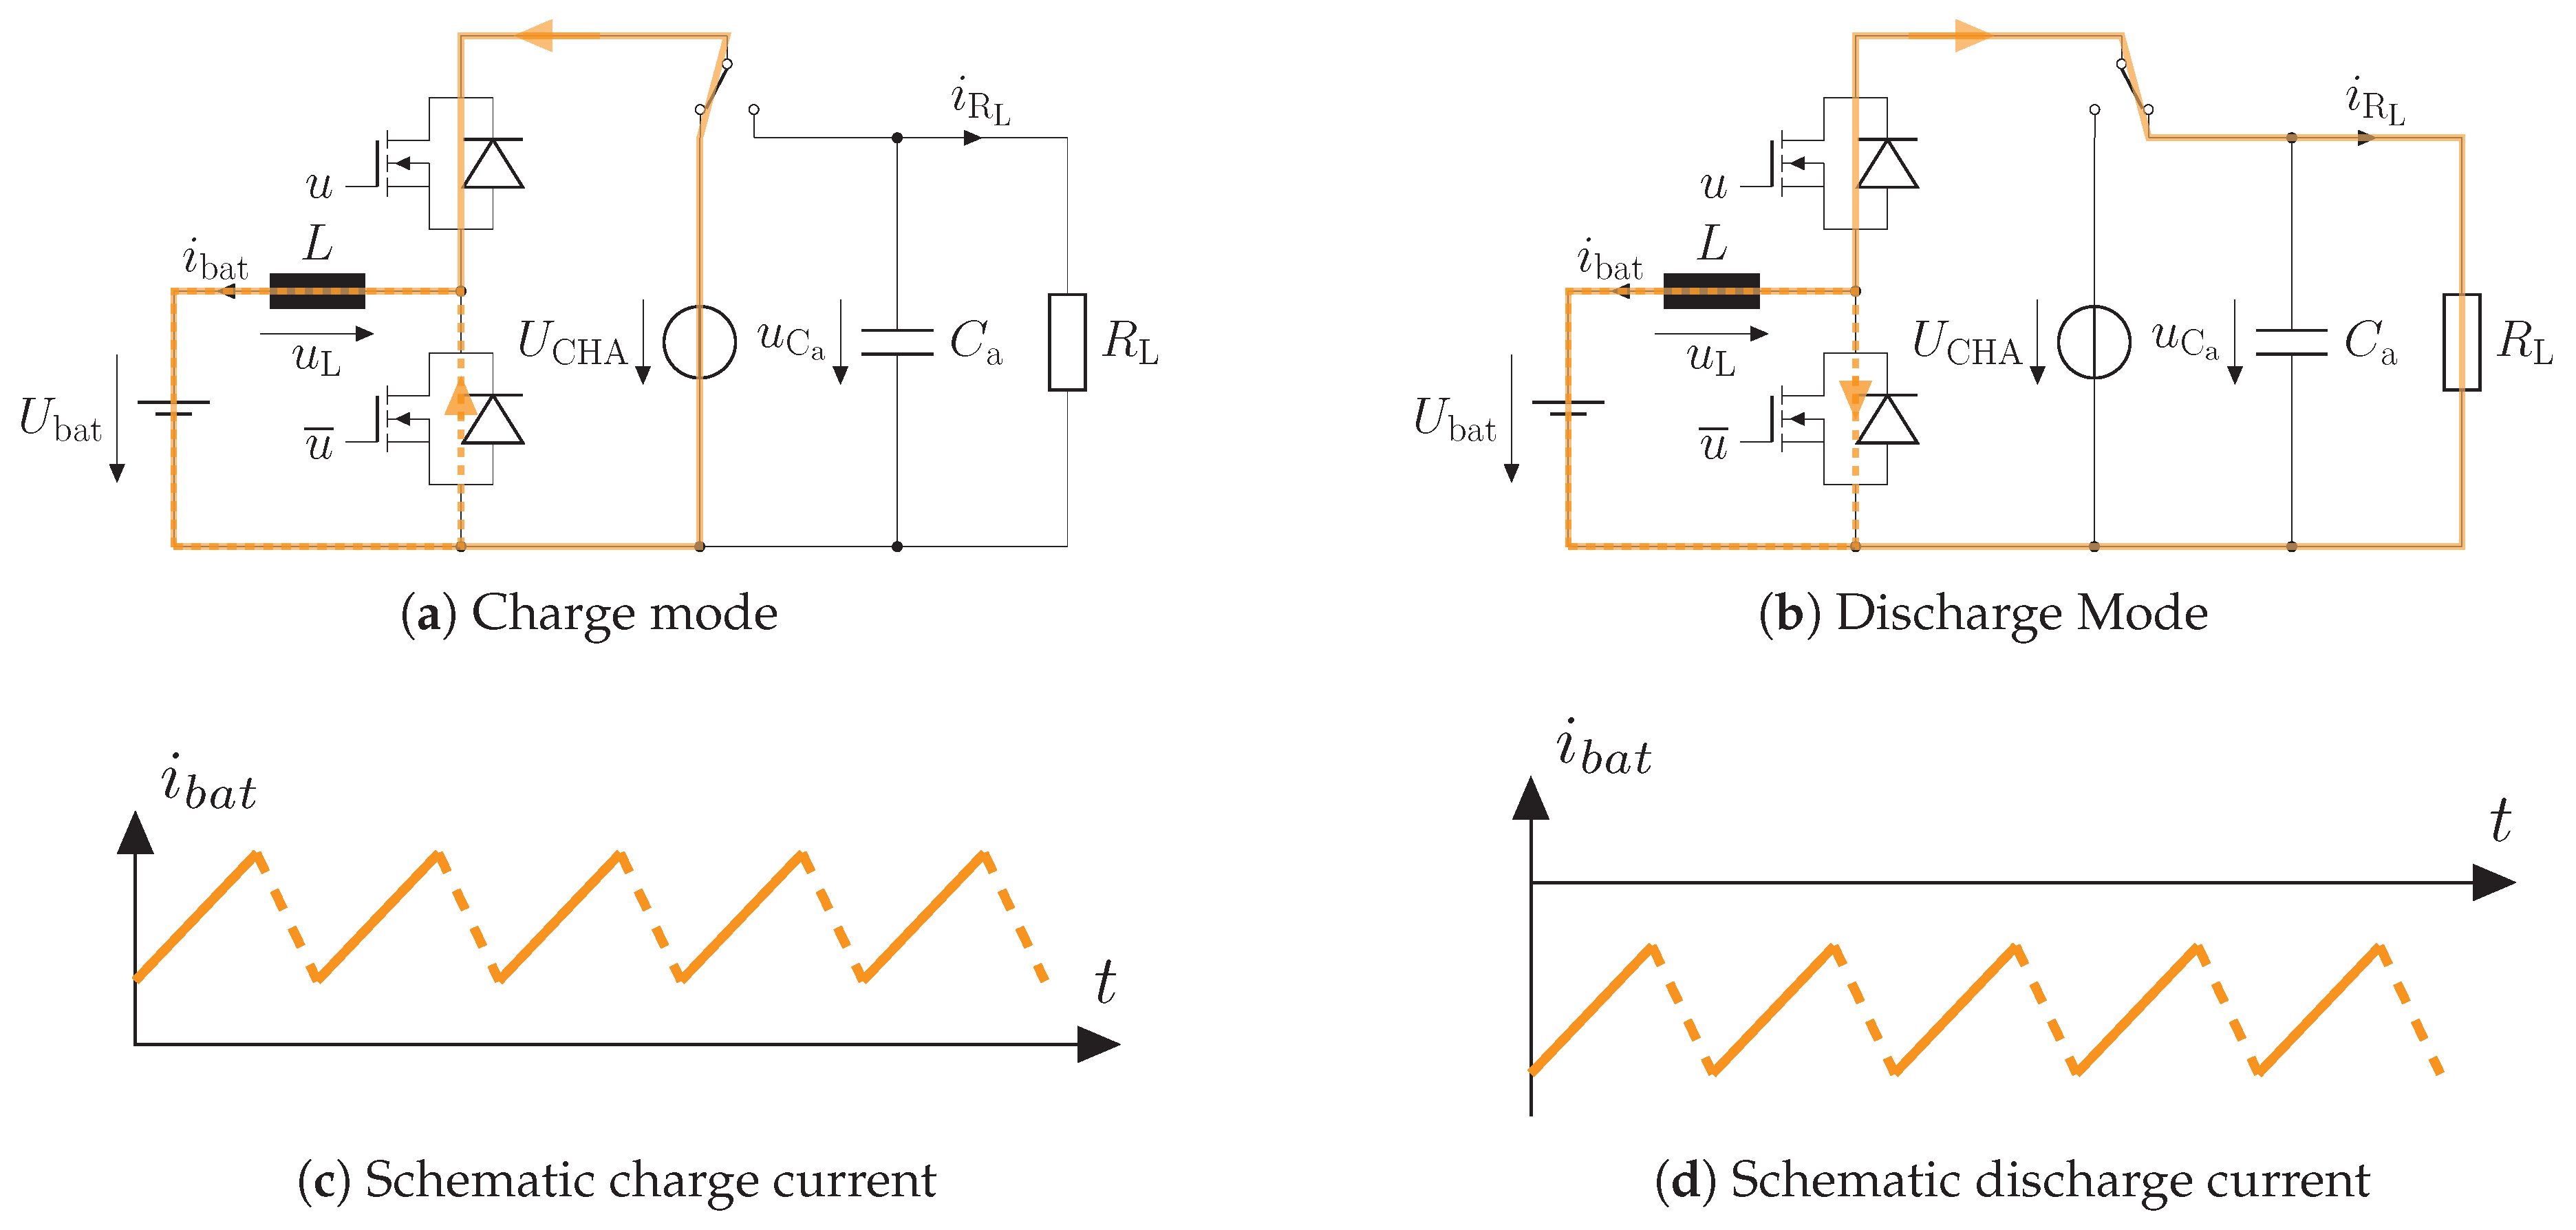
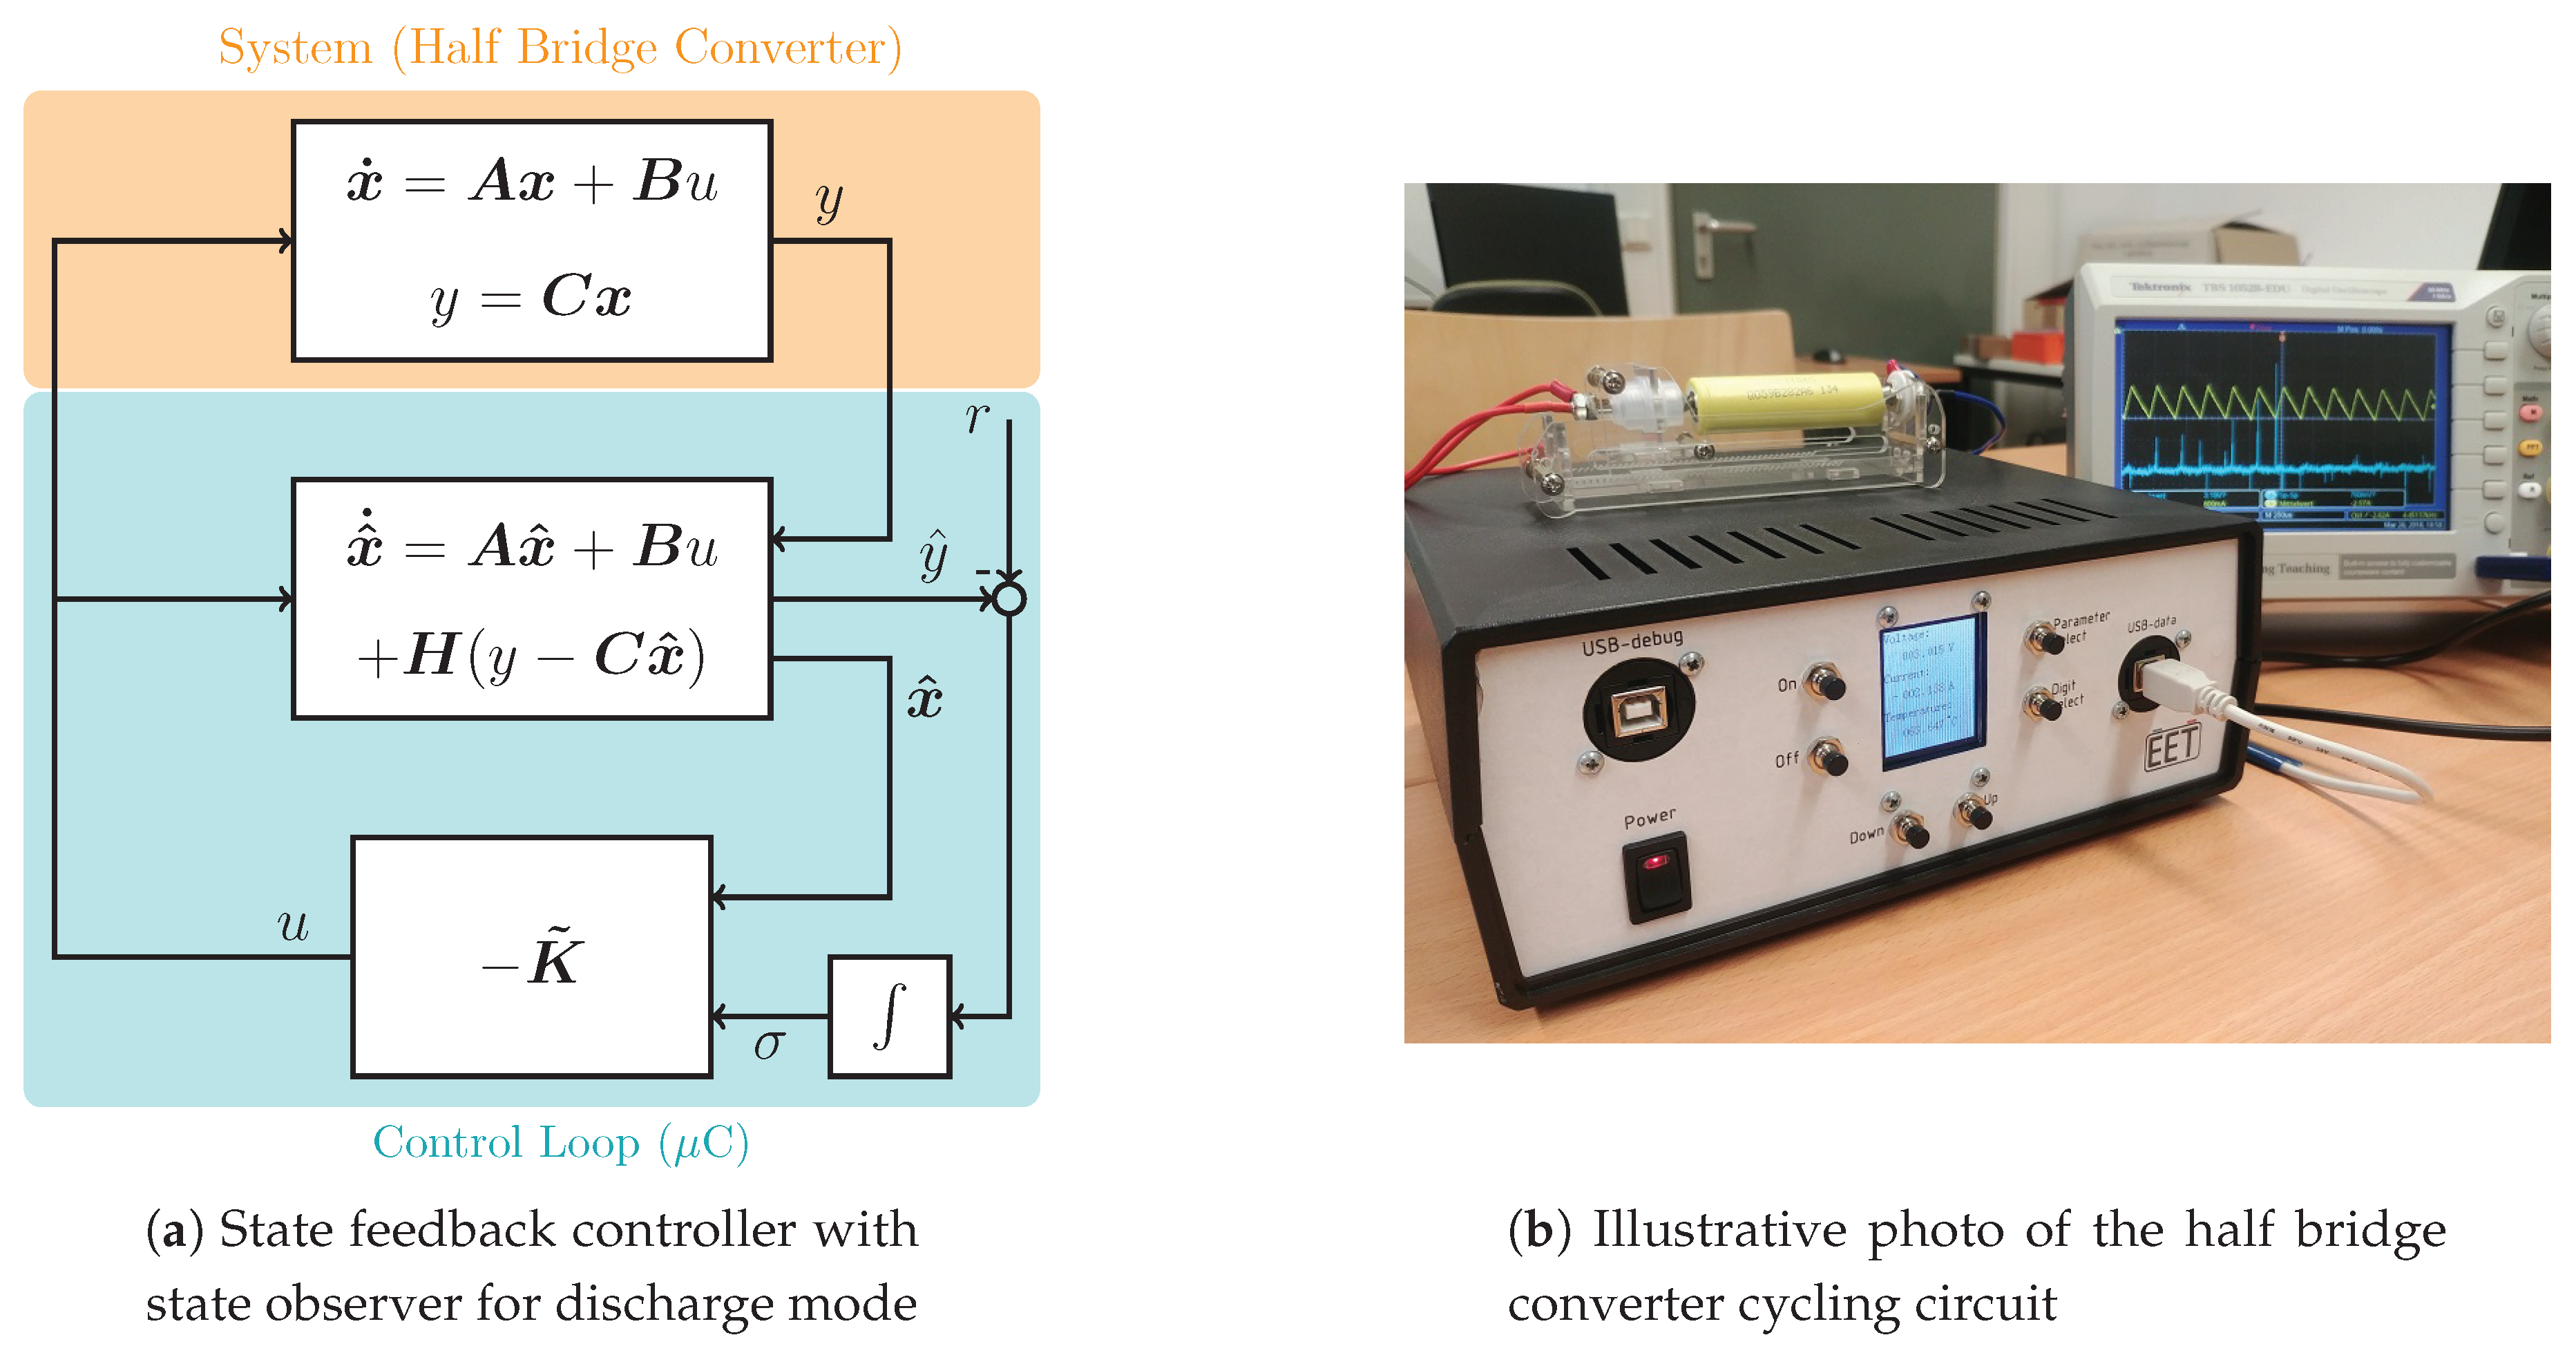
2.1. Ripple Current Test Circuit
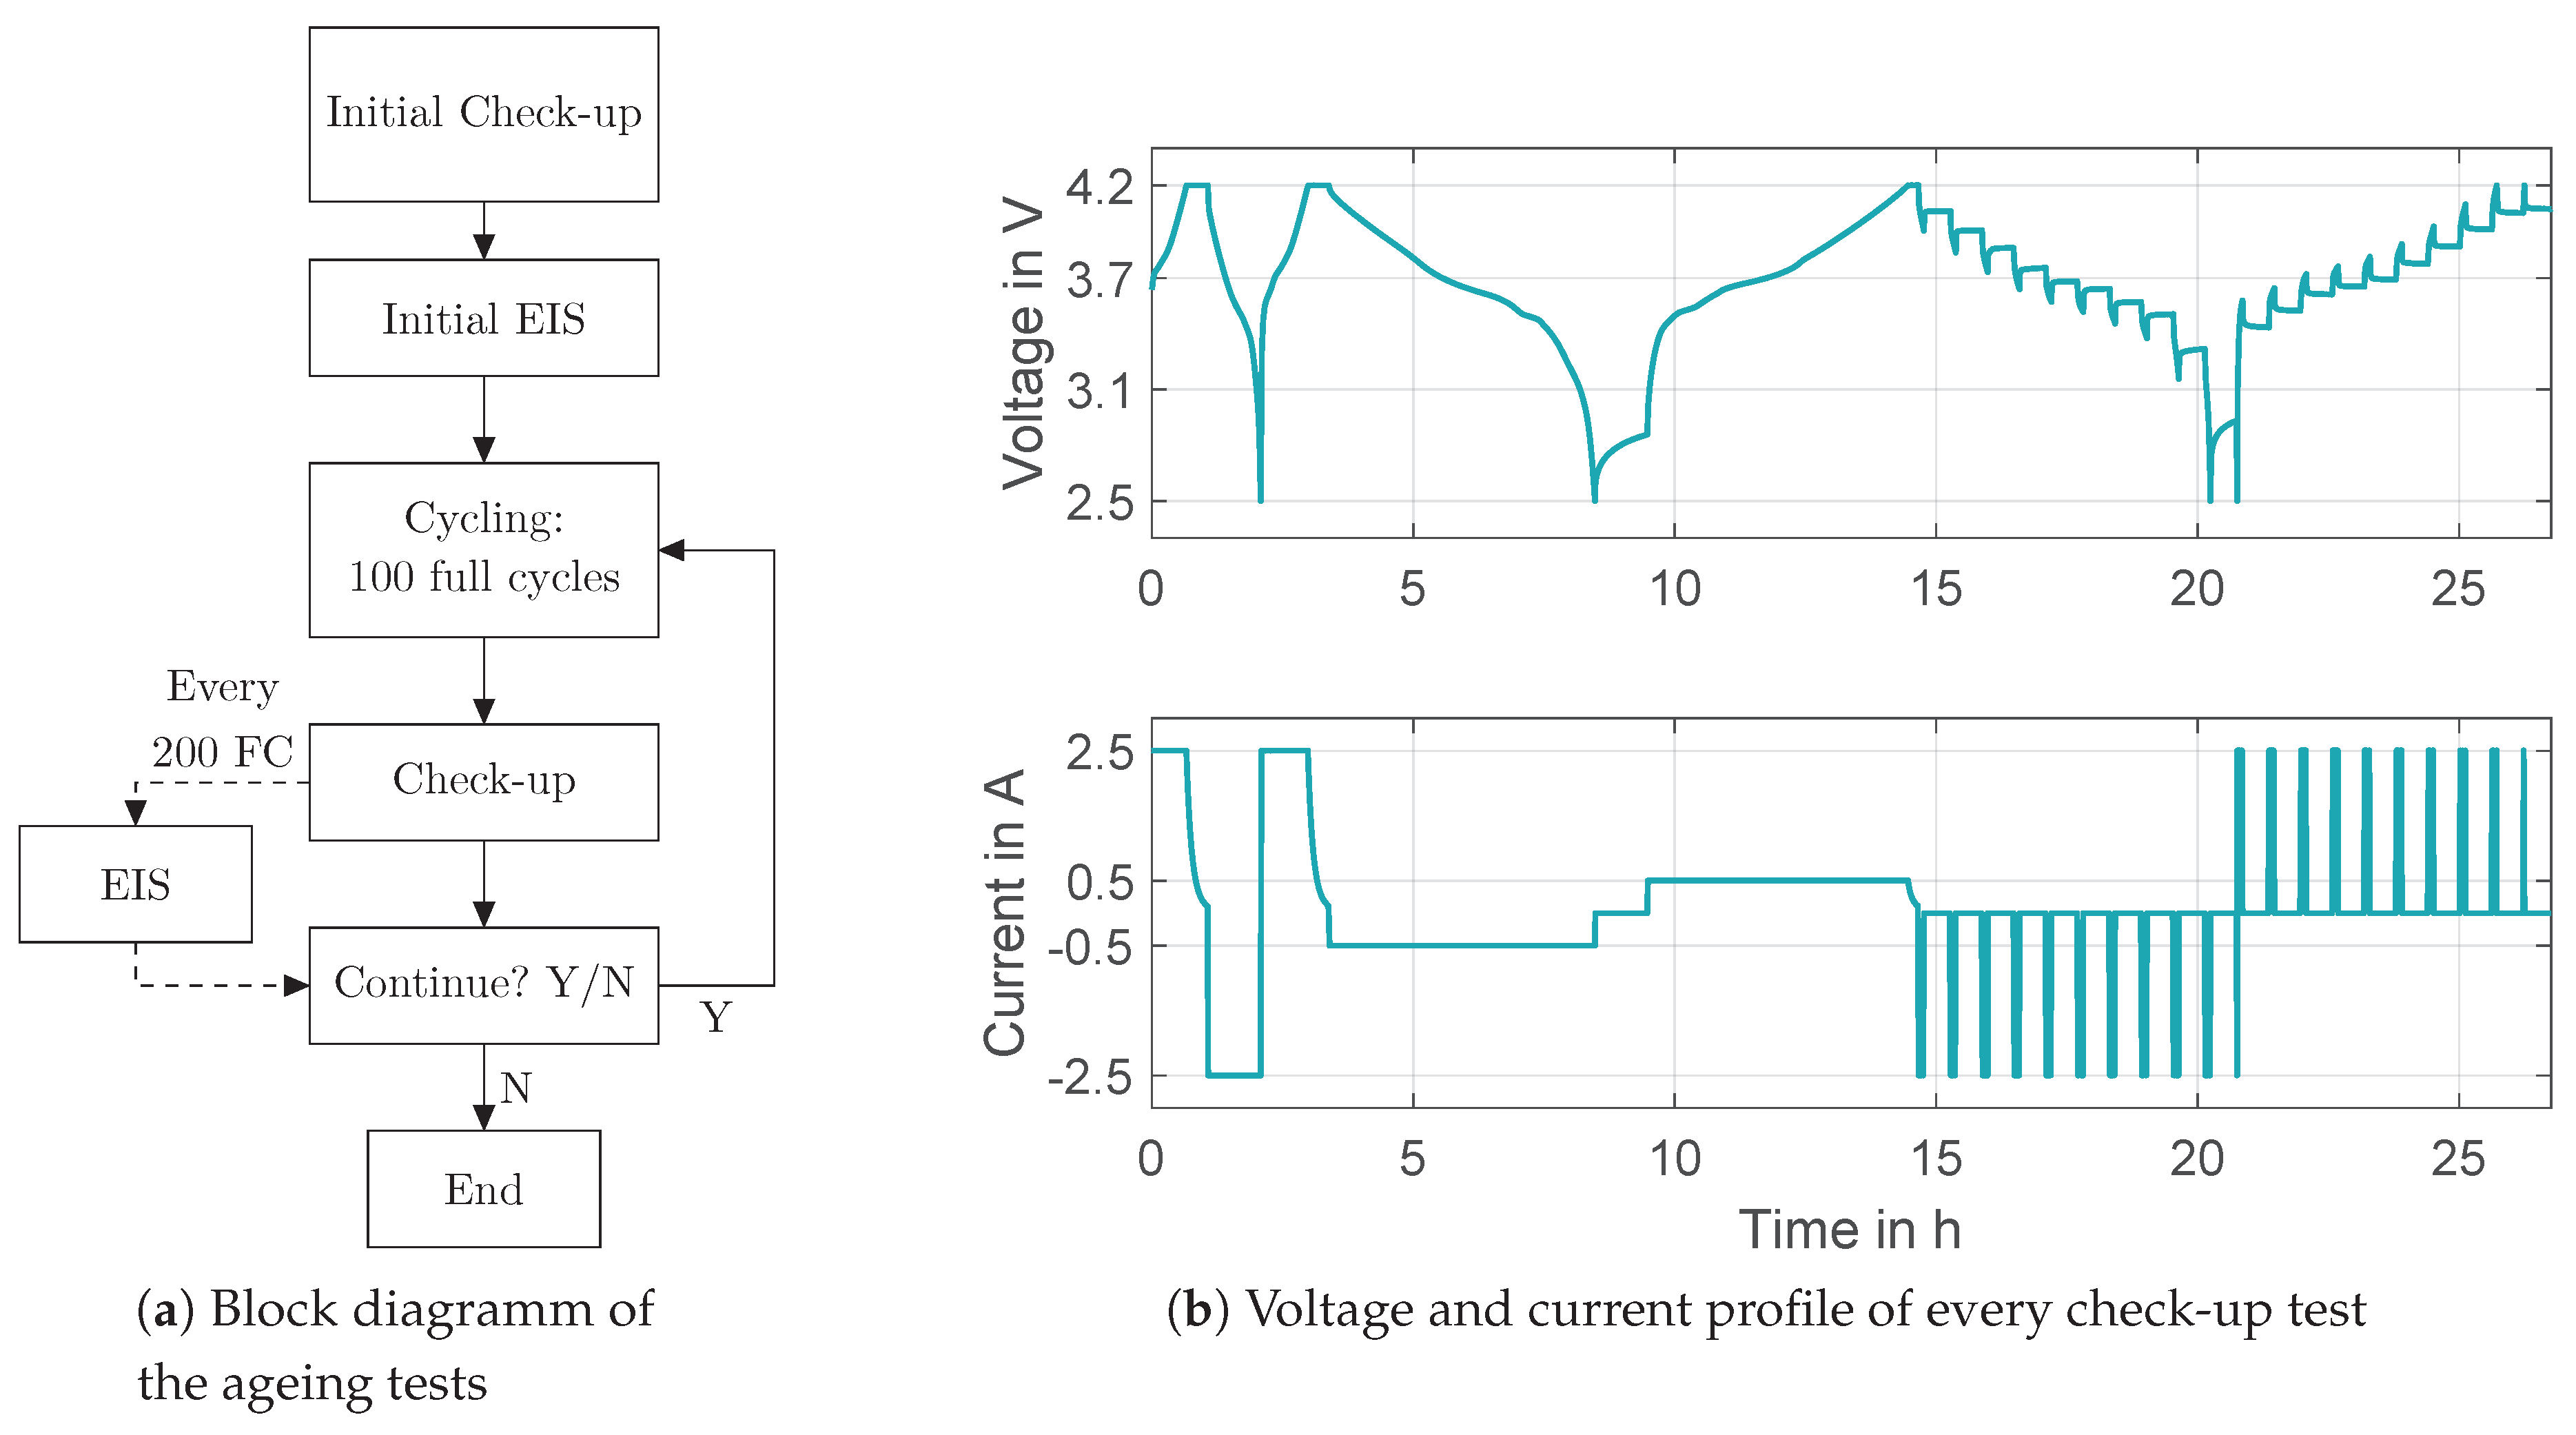
2.2. Ageing Test Structure
3. Results and Discussion
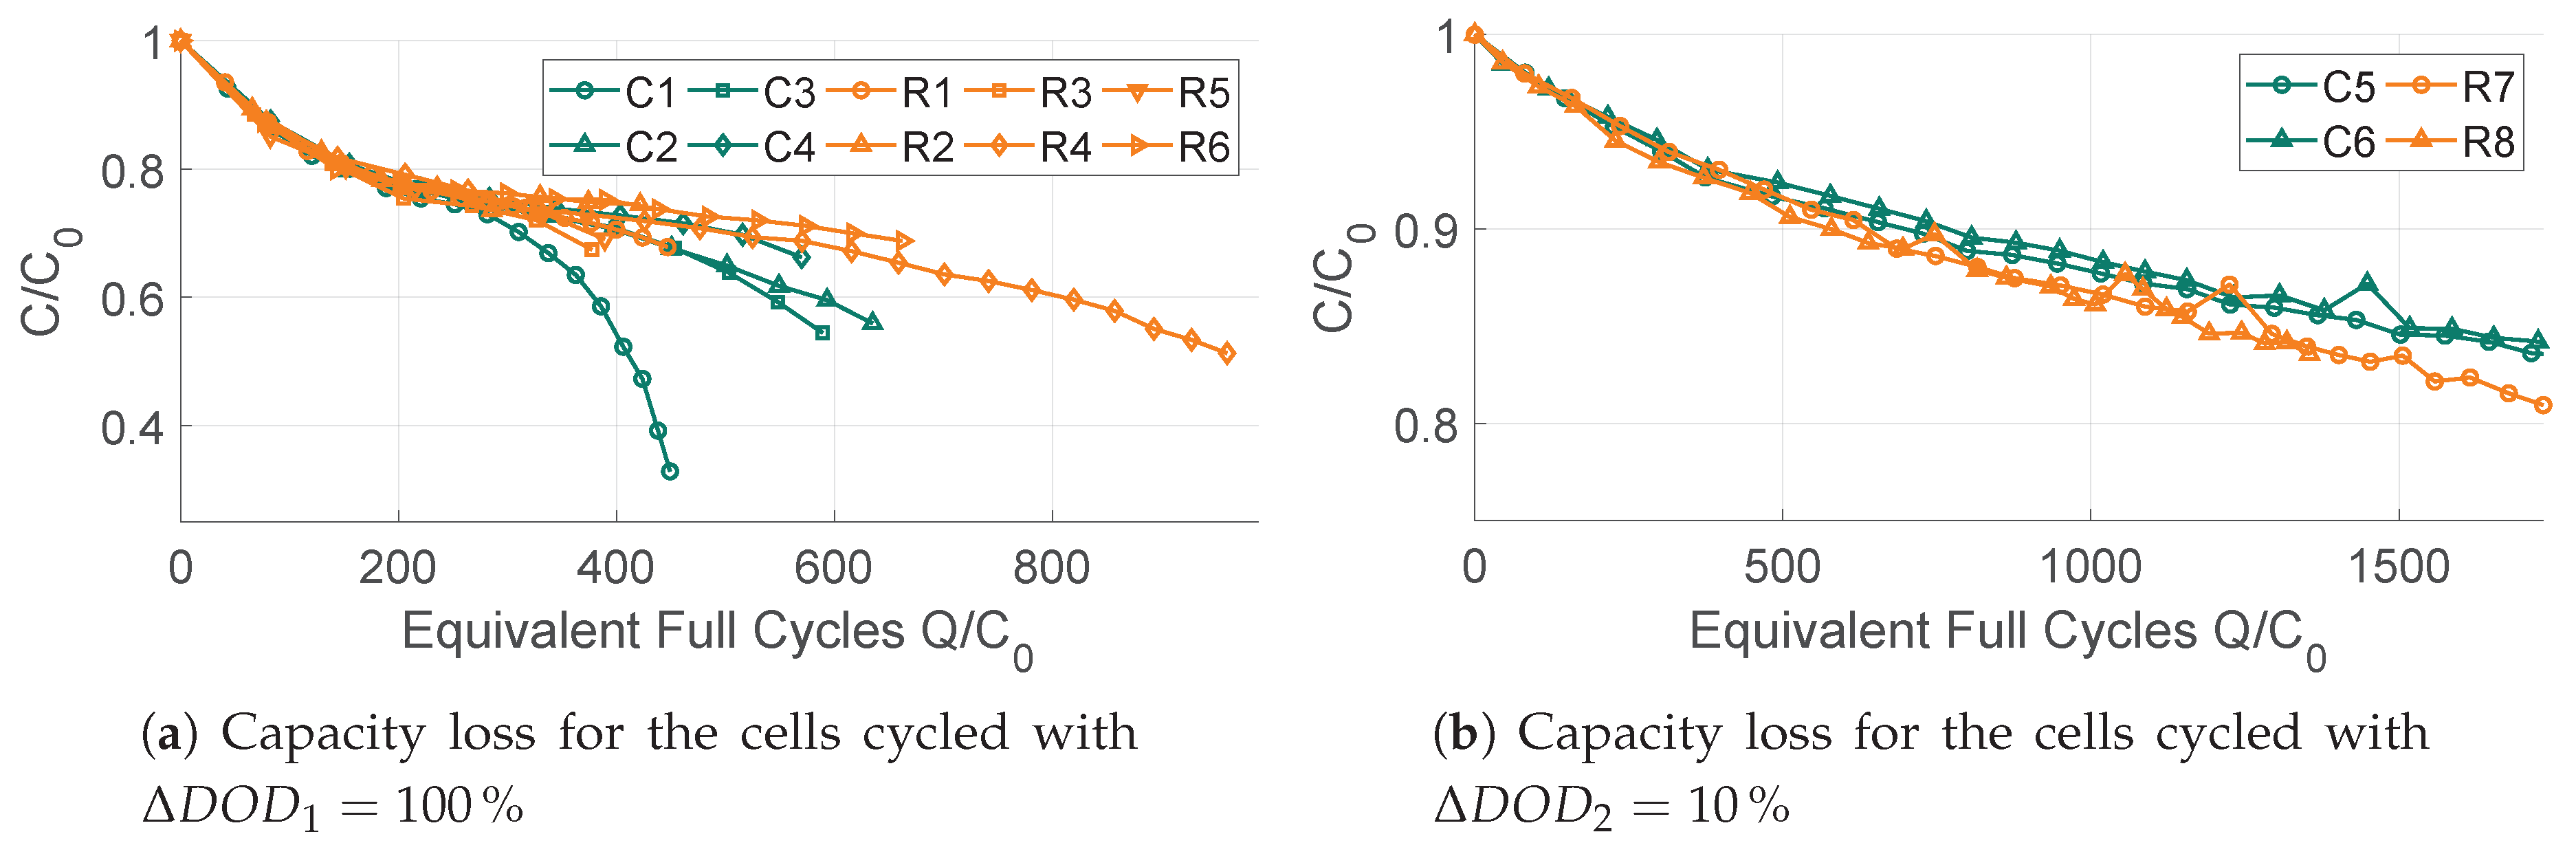
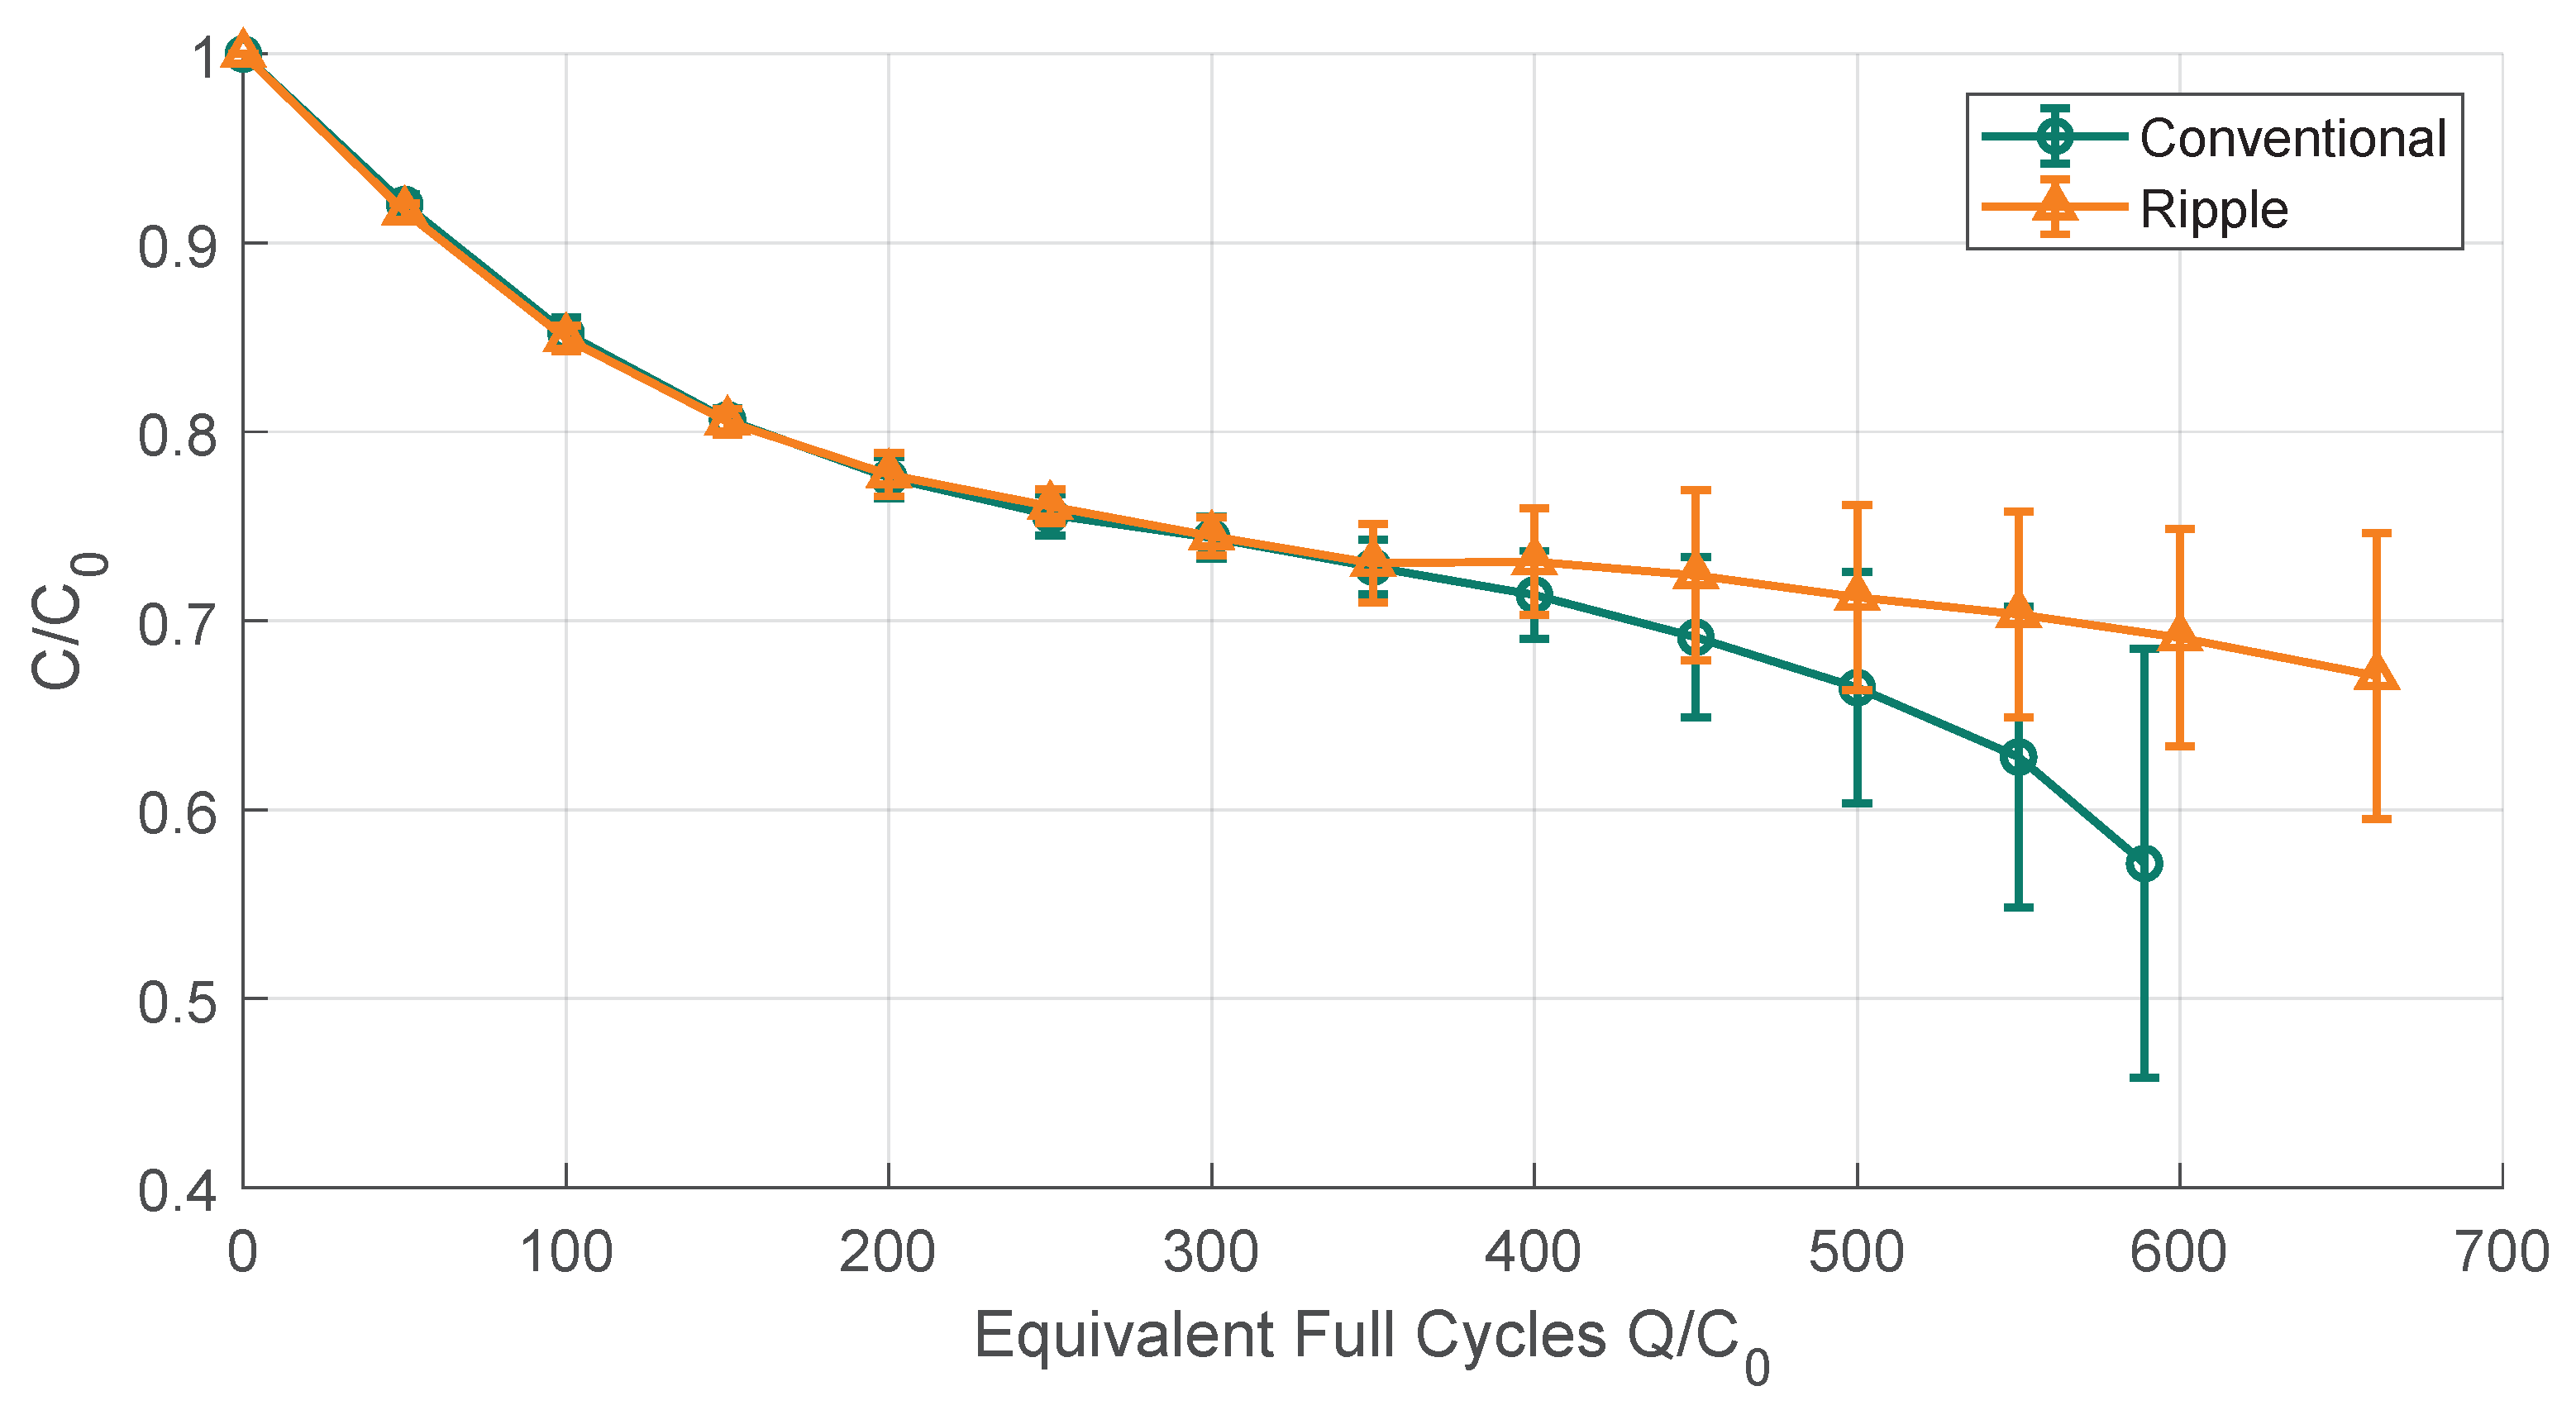
3.1. Capacity Loss
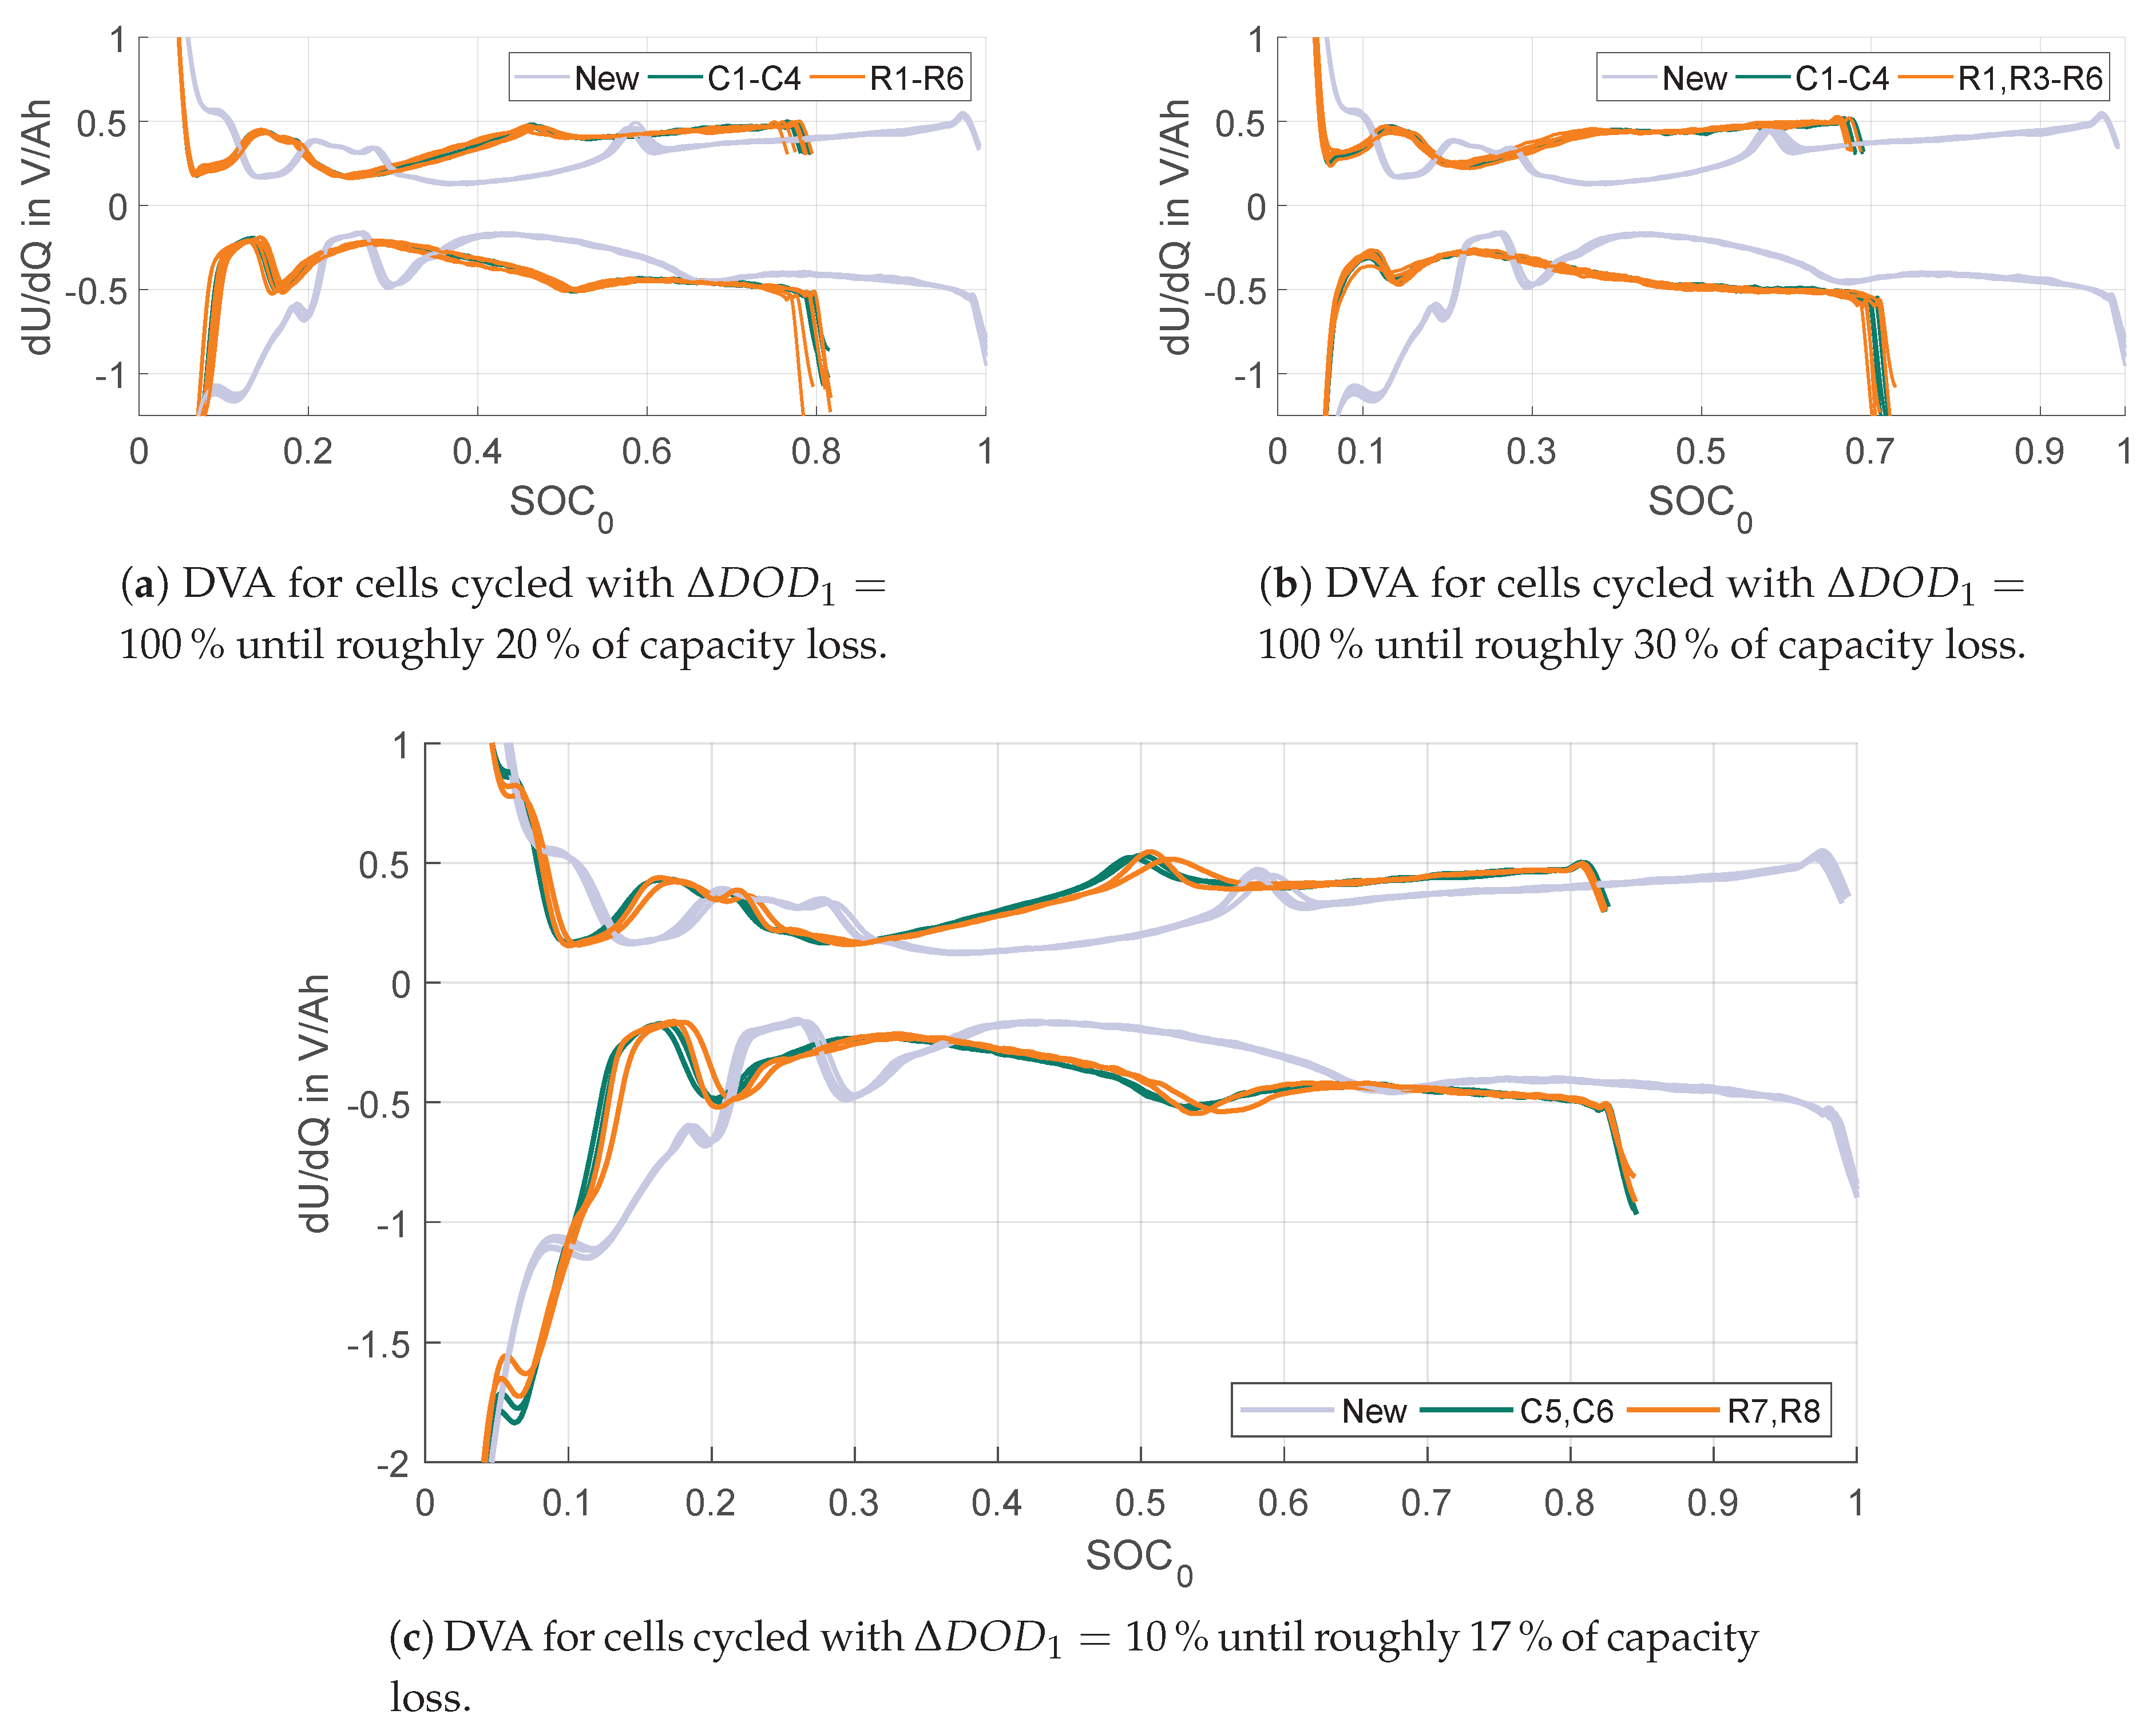
3.2. Differential Voltage Analysis (DVA)
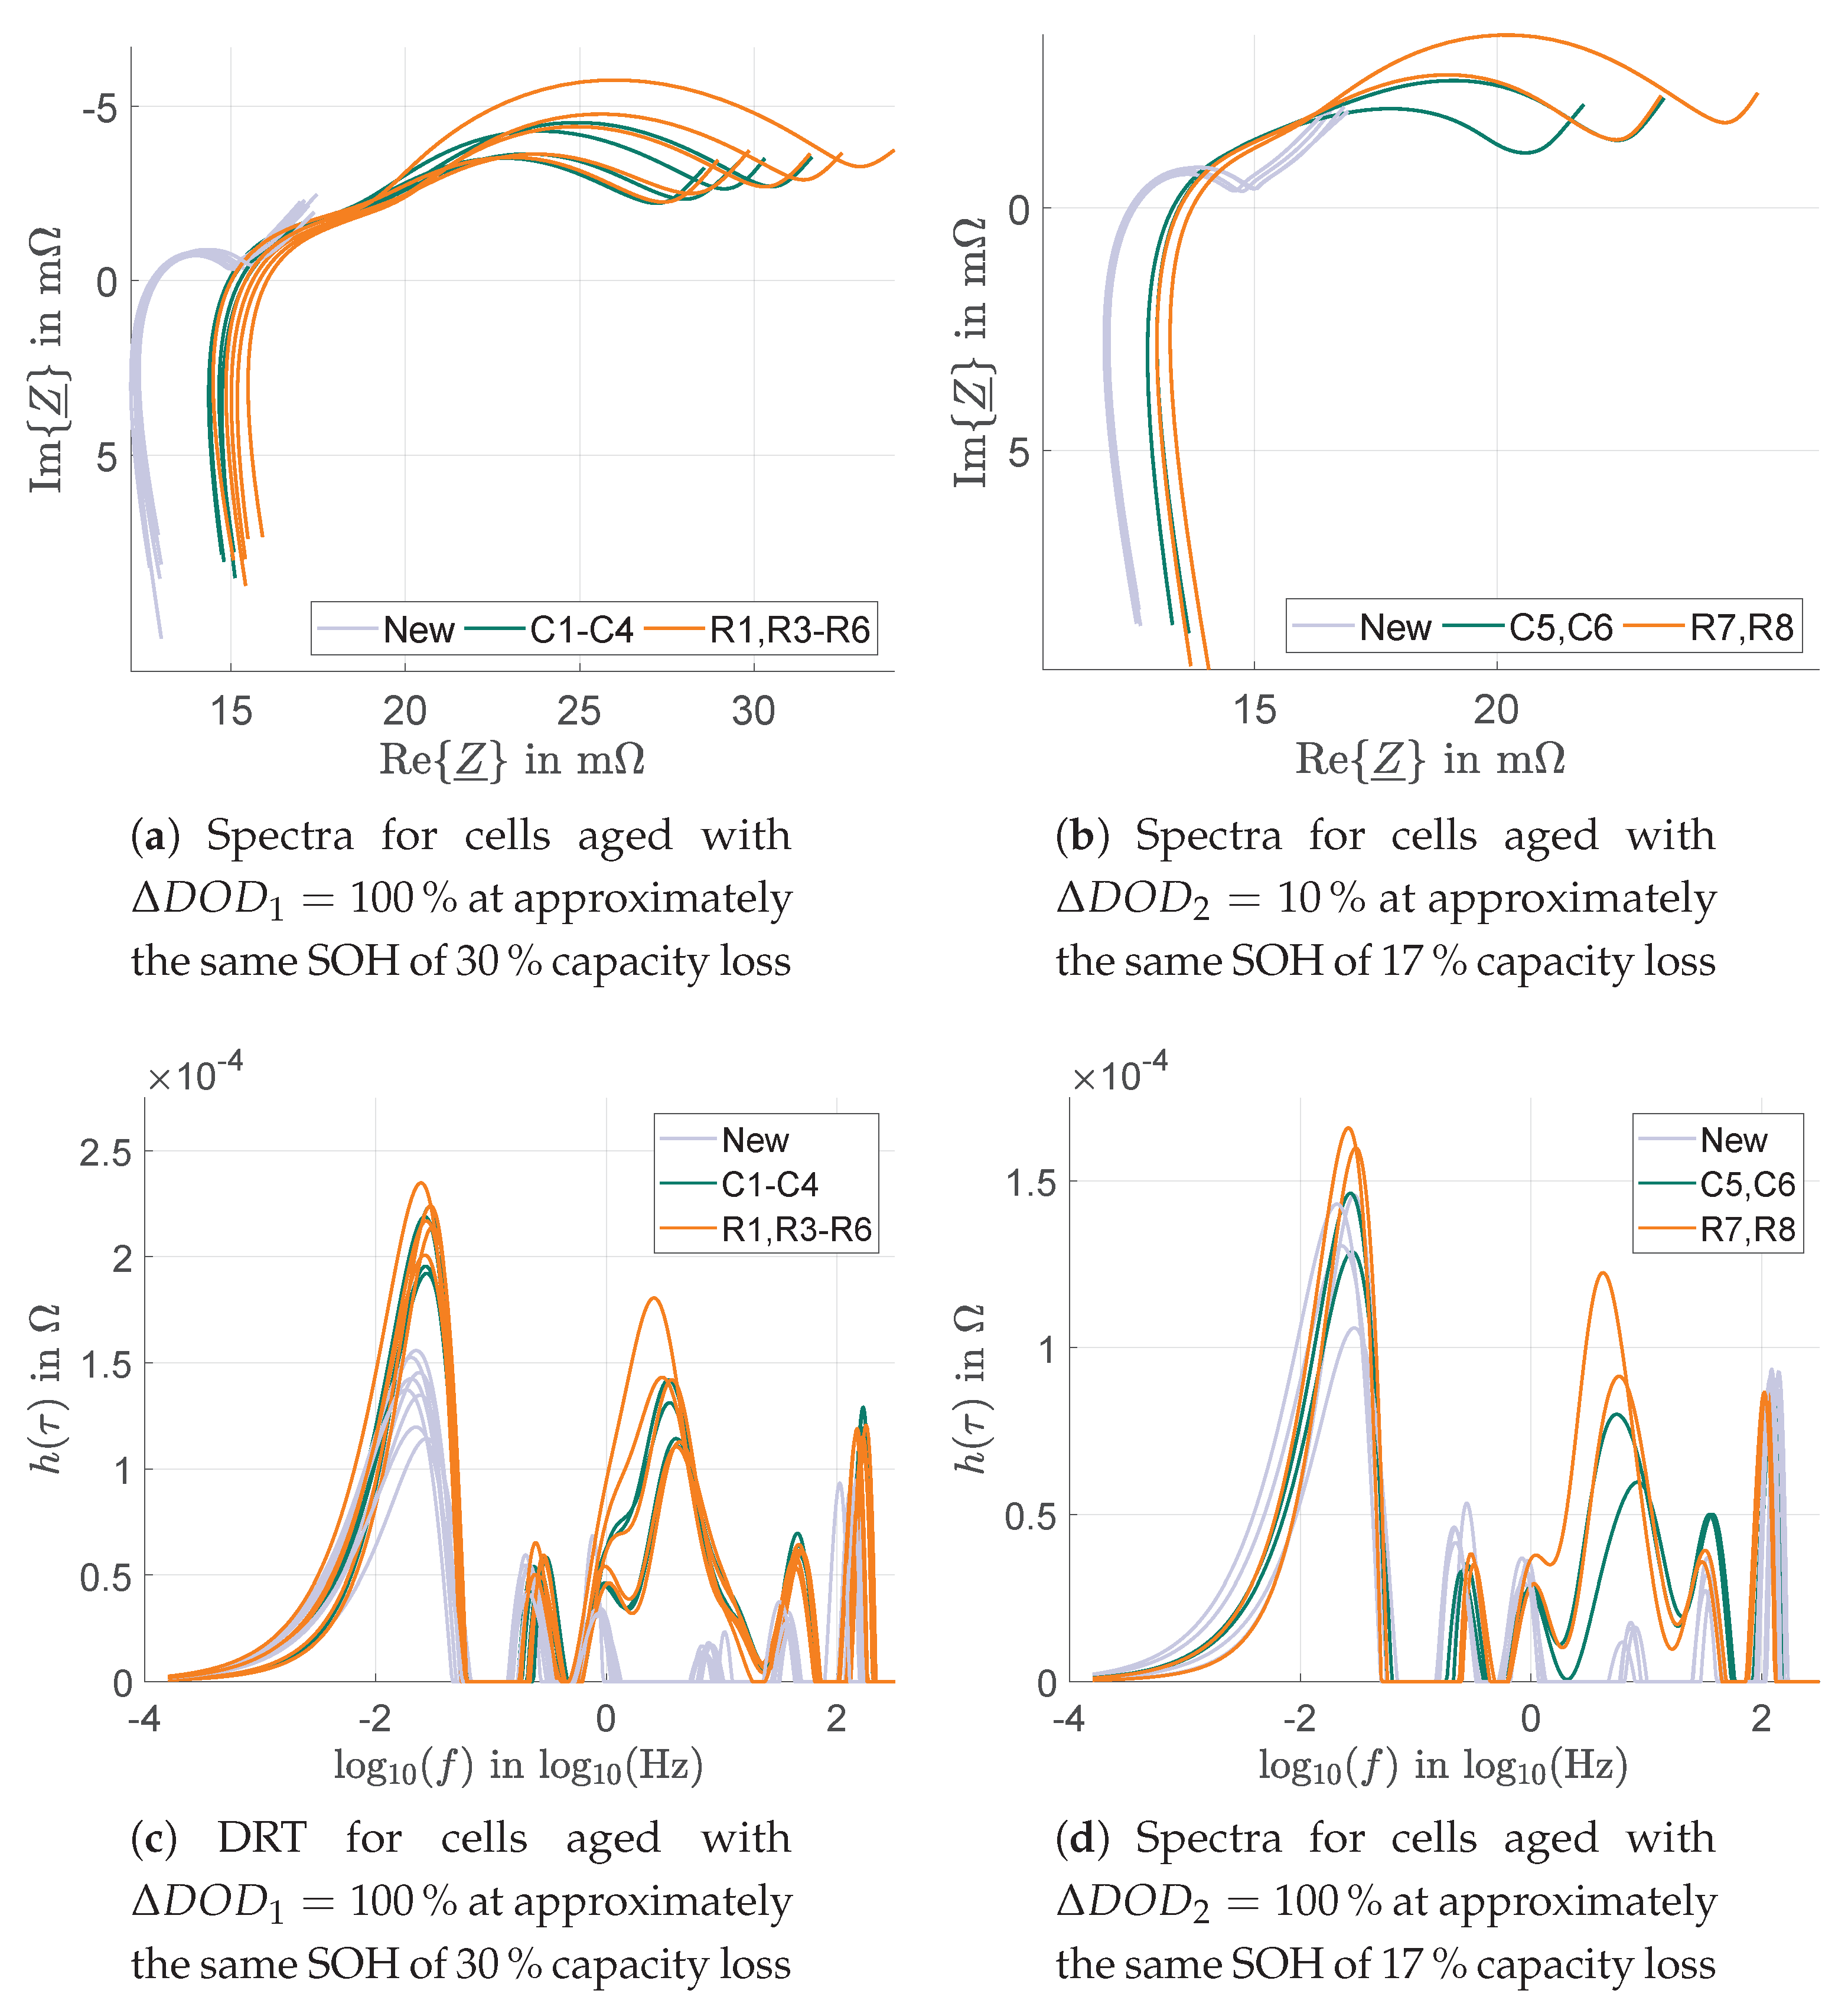
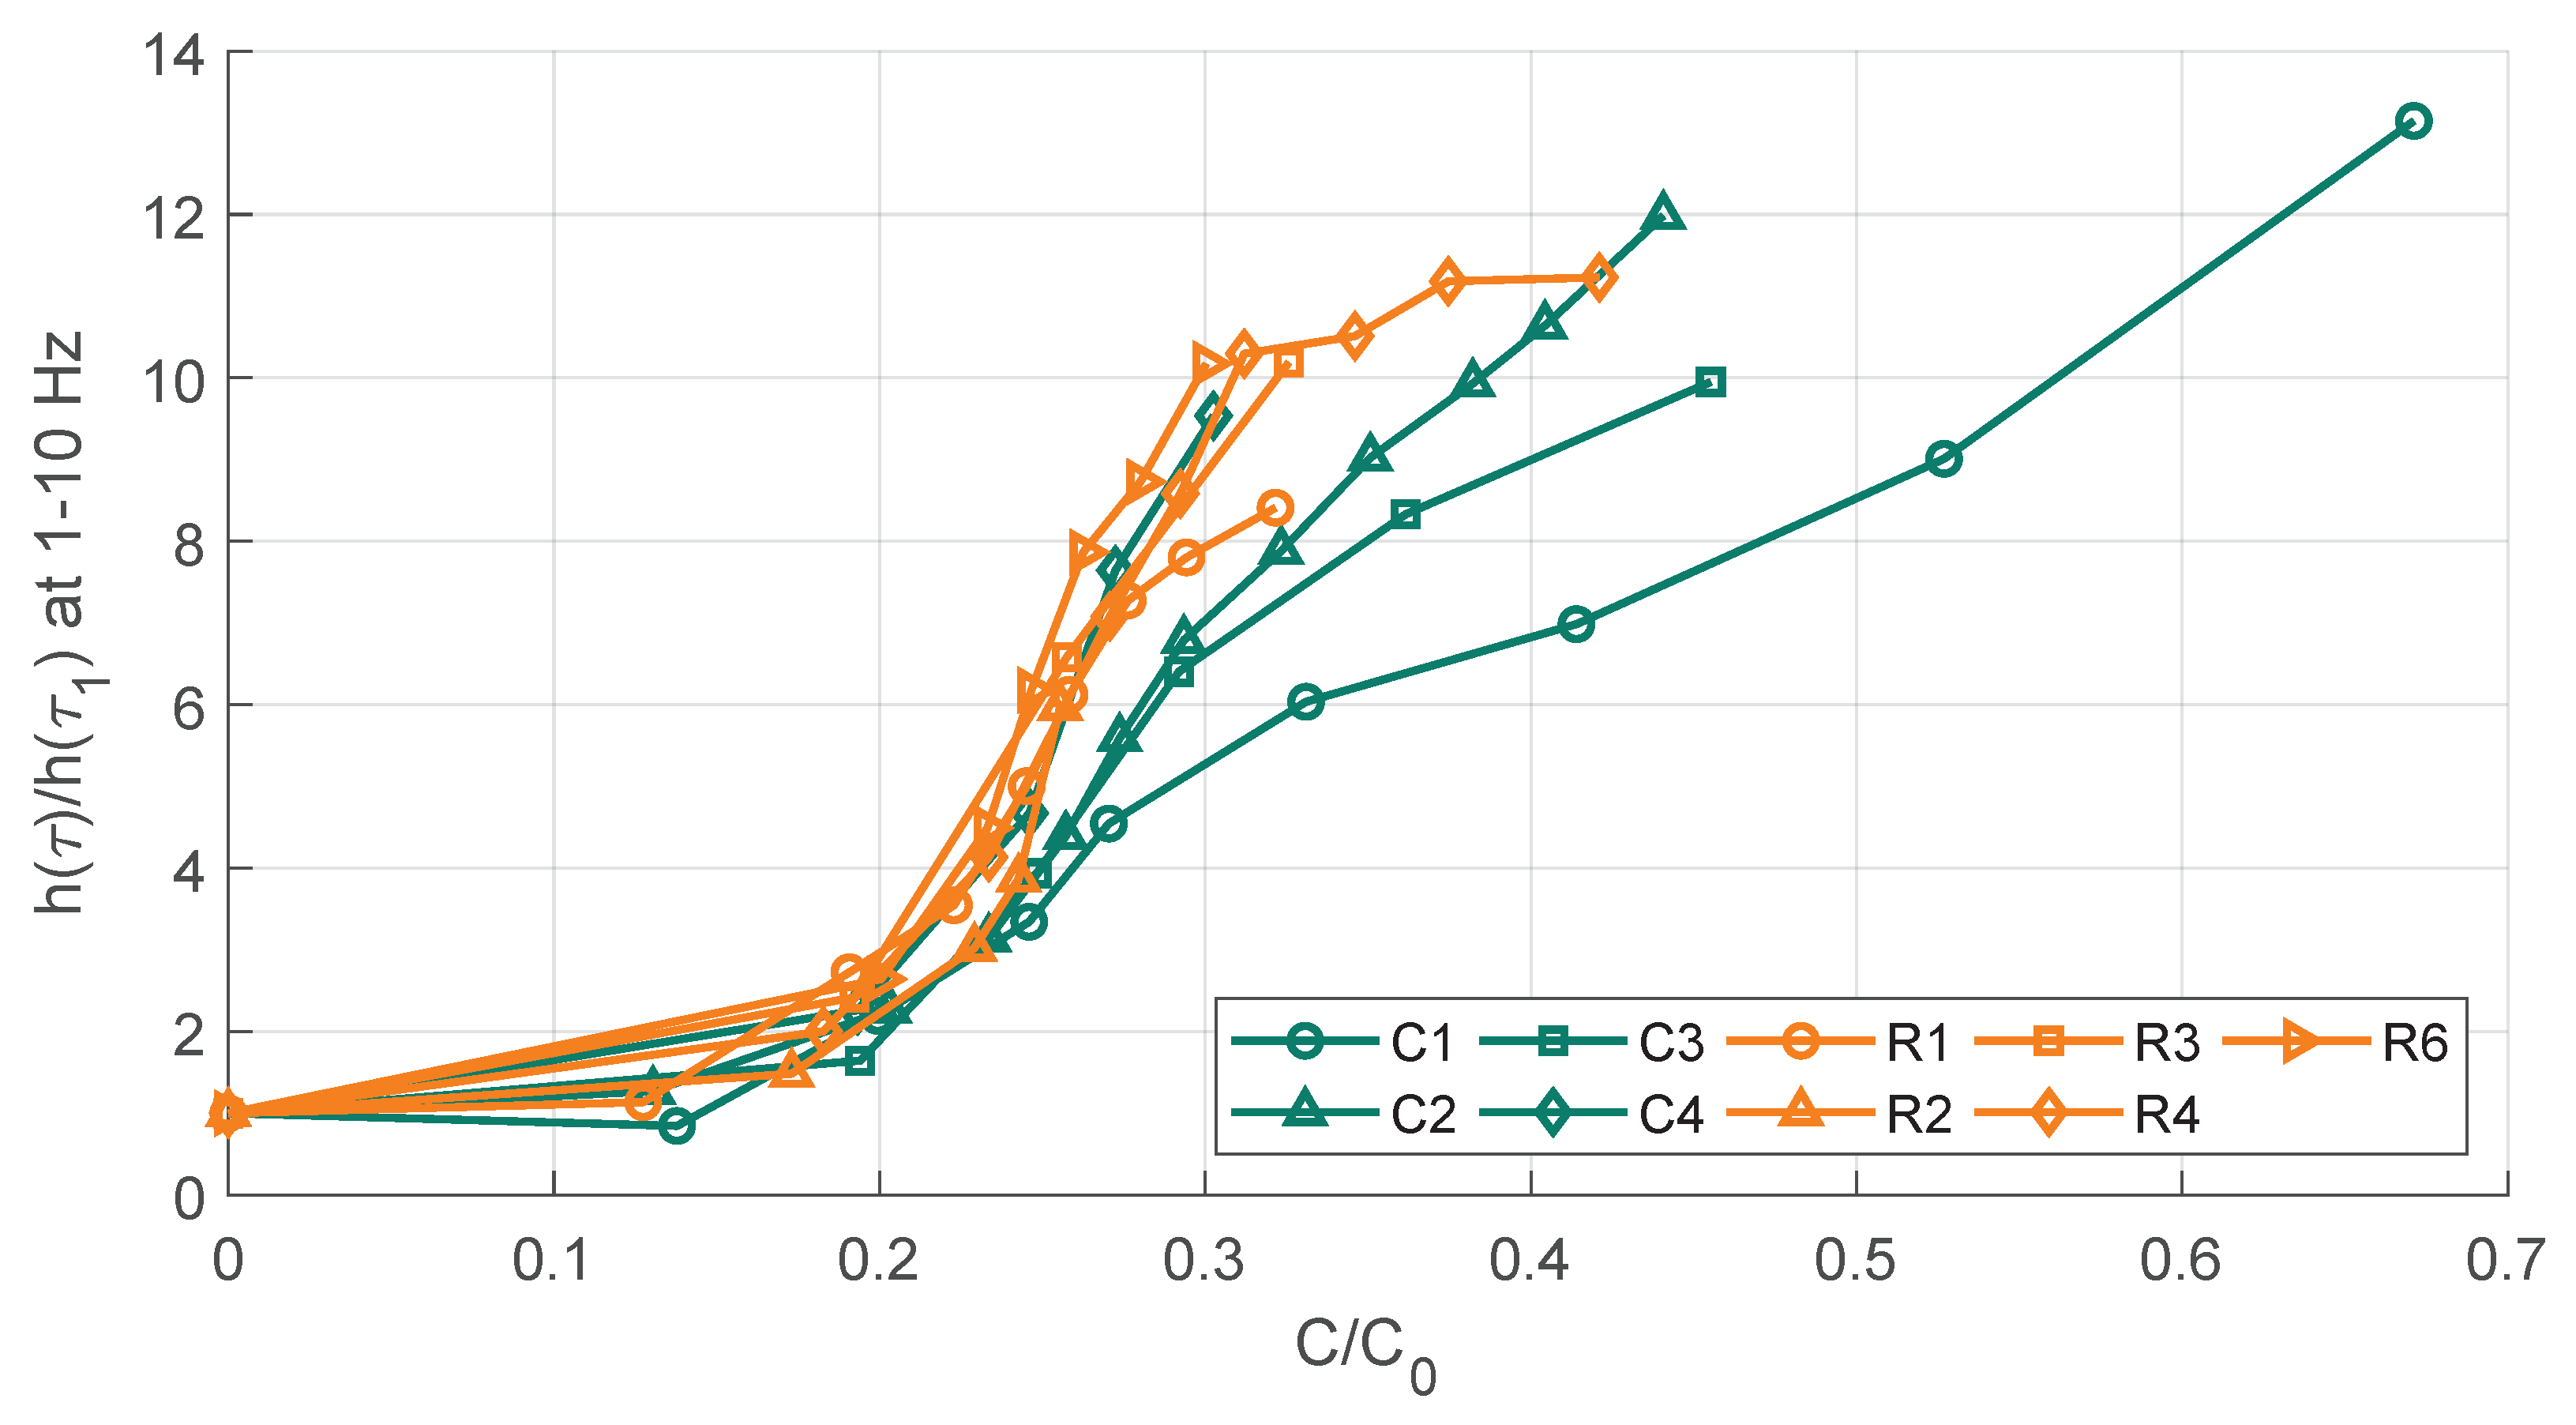
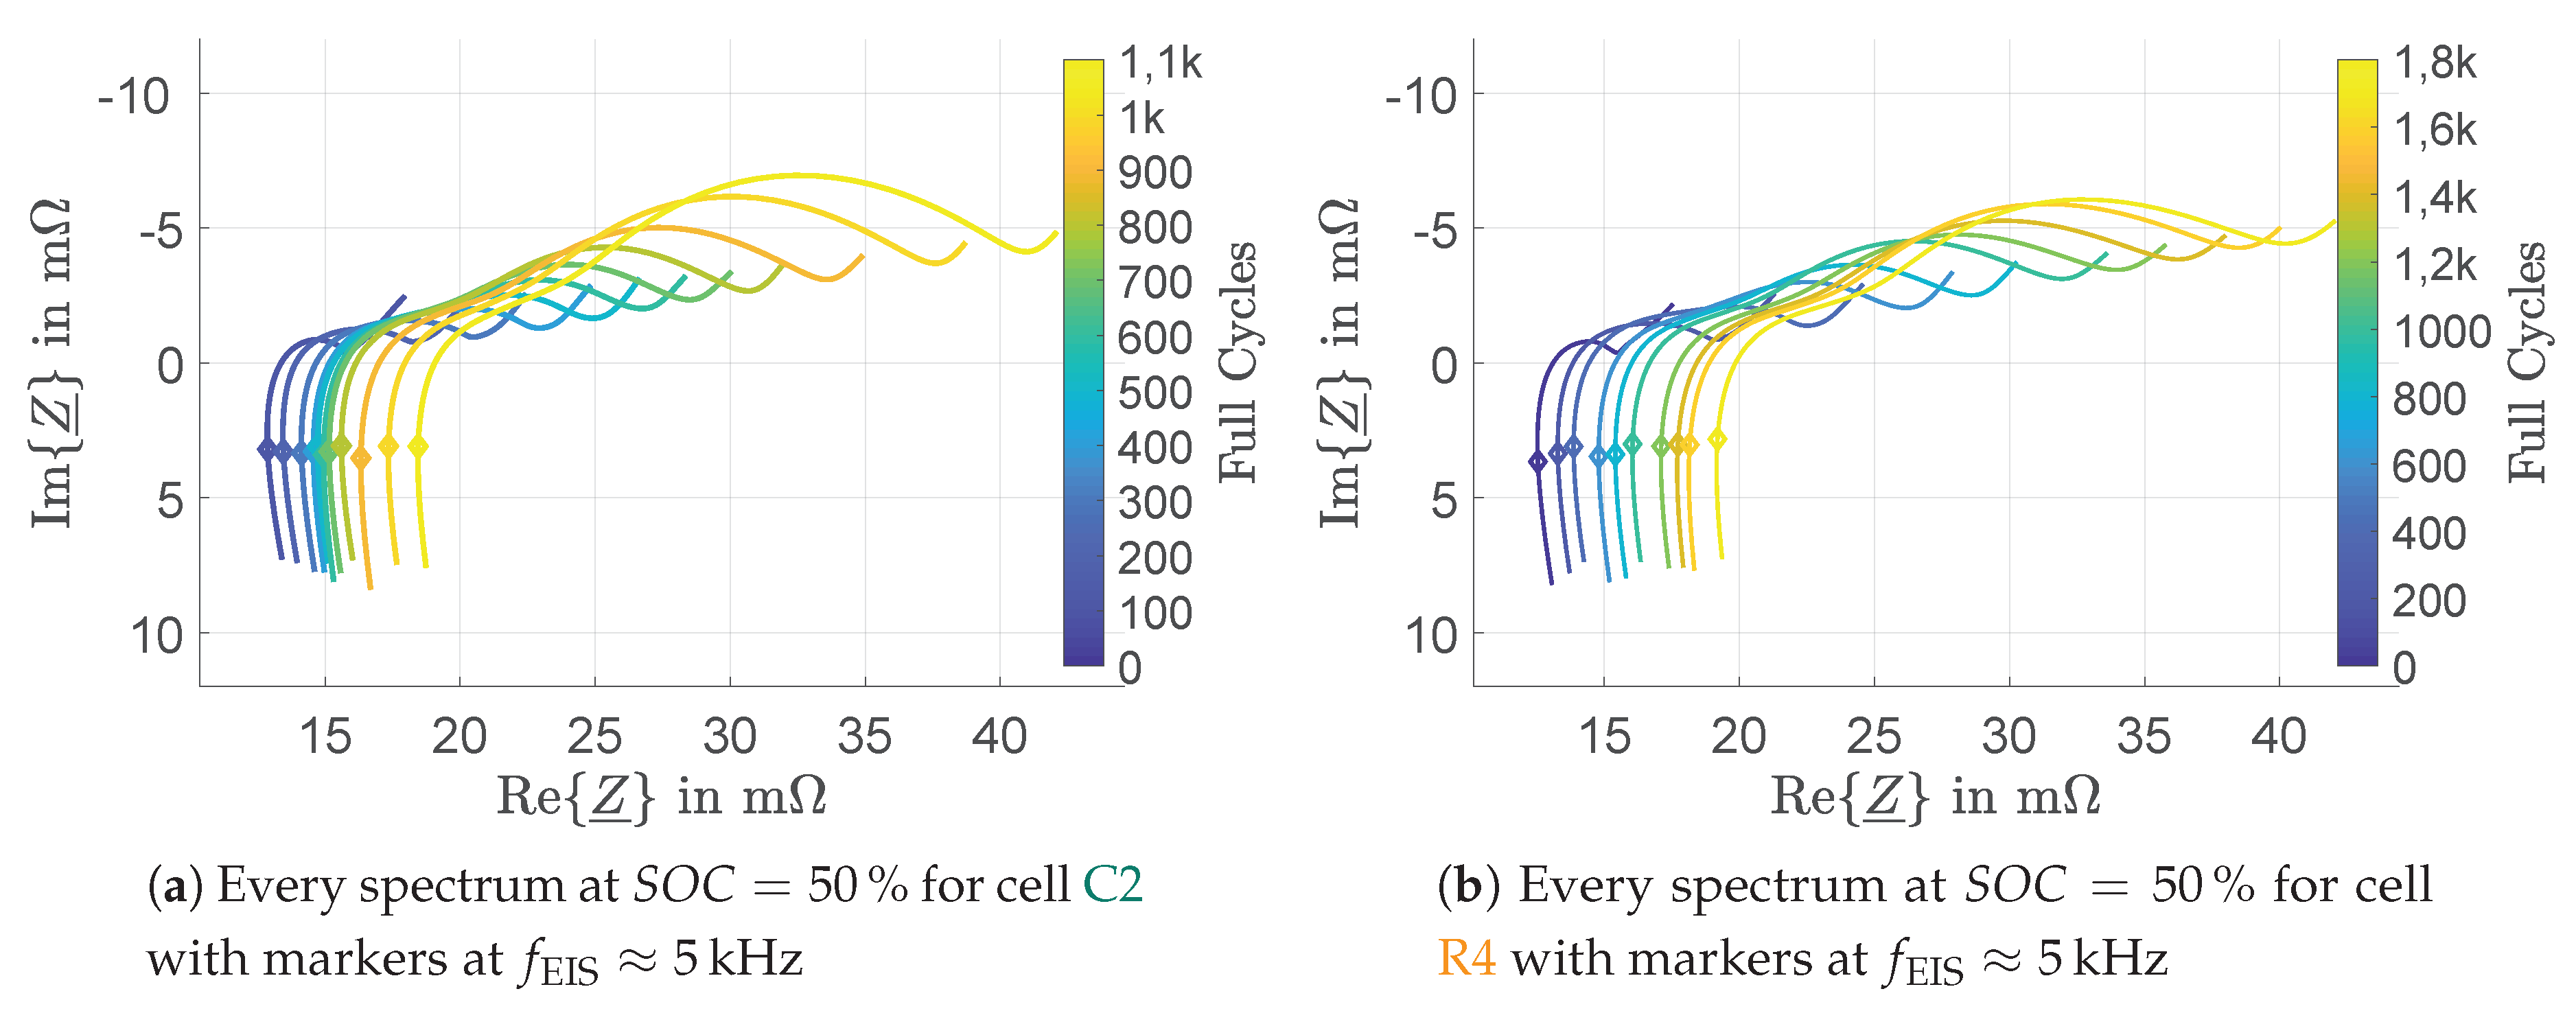
3.3. Impedance Measurements
4. Conclusions
Further Work
Author Contributions
Funding
Conflicts of Interest
Abbreviations
| DC | direct current |
| NCA | Nickel cobalt aluminium oxide |
| NMC | Nickel cobalt manganese oxide |
| GUI | Graphical user interface |
| SOC | State of charge |
| DOD | Depth of discharge |
| SOH | Sate of health |
| SEI | Solid electrolyte interphase |
| EIS | Electrochemical impedance spectroscopy |
| DVA | Differential voltage analysis |
| DRT | Distribution of relaxation times |
| LTI | Linear and time-invariant |
| NNLS | Non-negative least squares |
References
- Kittner, N.; Lill, F.; Kammen, D.M. Energy storage deployment and innovation for the clean energy transition. Nat. Energy 2017, 2, 1–6. [Google Scholar] [CrossRef]
- Gür, T.M. Review of electrical energy storage technologies, materials and systems: Challenges and prospects for large-scale grid storage. Energy Environ. Sci. 2018, 11, 2696–2767. [Google Scholar] [CrossRef]
- Lasseter, R.H. MicroGrids. In Proceedings of the 2002 IEEE Power Engineering Society Winter Meeting. Conference Proceedings (Cat. No. 02CH37309), New York, NY, USA, 27–31 January 2002; Voume 1, pp. 305–308. [Google Scholar] [CrossRef]
- Gkountaras, A.; Dieckerhoff, S.; Sezi, T. Real Time Simulation and Stability Evaluation of a Medium Voltage Hybrid Microgrid. In Proceedings of the 7th IET International Conference on Power Electronics, Machines and Drives (PEMD 2014), Manchester, UK, 8–10 April 2014; pp. 1–6. [Google Scholar] [CrossRef]
- Fang, J.; Tang, Y.; Li, H.; Li, X. A Battery/Ultracapacitor Hybrid Energy Storage System for Implementing the Power Management of Virtual Synchronous Generators. IEEE Trans. Power Electron. 2018, 33, 2820–2824. [Google Scholar] [CrossRef]
- Yoldas, Y.; Önen, A.; Muyeen, S.M.; Vasilakos, A.V.; Alan, I. Enhancing smart grid with microgrids: Challenges and opportunities. Renew. Sustain. Energy Rev. 2017, 72, 205–214. [Google Scholar] [CrossRef]
- Gao, F.; Gu, X.; Ma, Z.; Zhang, C. Redistributed Pulse Width Modulation of MMC Battery Energy Storage System under Submodule Fault Condition. IEEE Trans. Power Electron. 2019. [Google Scholar] [CrossRef]
- Rivera, S.; Wu, B. Electric Vehicle Charging Station With an Energy Storage Stage for Split-DC Bus Voltage Balancing. IEEE Trans. Power Electron. 2017, 32, 2376–2386. [Google Scholar] [CrossRef]
- Tran, D.H.; Vu, V.B.; Choi, W. Design of a High-Efficiency Wireless Power Transfer System With Intermediate Coils for the On-Board Chargers of Electric Vehicles. IEEE Trans. Power Electron. 2018, 33, 175–187. [Google Scholar] [CrossRef]
- Bala, S.; Tengnér, T.; Rosenfeld, P.; Delince, F. The effect of low frequency current ripple on the performance of a Lithium Iron Phosphate (LFP) battery energy storage system. In Proceedings of the 2012 IEEE Energy Conversion Congress and Exposition (ECCE), Raleigh, NC, USA, 15–20 September 2012; pp. 3485–3492. [Google Scholar] [CrossRef]
- Soares, R.; Djekanovic, N.; Wallmark, O.; Loh, P.C. Integration of Magnified Alternating Current in Battery Fast Chargers based on DC-DC Converters using Transformerless Resonant Filter Design. IEEE Trans. Transp. Electrif. 2019. [Google Scholar] [CrossRef]
- Bertelshofer, T.; Horff, R.; Maerz, A.; Bakran, M. A performance comparison of a 650 V Si IGBT and SiC MOSFET inverter under automotive conditions. In Proceedings of the PCIM Europe 2016, International Exhibition and Conference for Power Electronics, Intelligent Motion, Renewable Energy and Energy Management, Nuremberg, Germany, 10–12 May 2016; pp. 1–8. [Google Scholar]
- De Breucker, S.; Engelen, K.; D’hulst, R.; Driesen, J. Impact of current ripple on Li-ion battery ageing. In Proceedings of the 2013 World Electric Vehicle Symposium and Exhibition (EVS27), Barcelona, Spain, 17–20 November 2013; pp. 1–9. [Google Scholar] [CrossRef]
- Uddin, K.; Moore, A.D.; Barai, A.; Marco, J. The effects of high frequency current ripple on electric vehicle battery performance. Appl. Energy 2016, 178, 142–154. [Google Scholar] [CrossRef]
- Brand, M.J.; Hofmann, M.H.; Schuster, S.S.; Keil, P.; Jossen, A. The Influence of Current Ripples on the Lifetime of Lithium-Ion Batteries. IEEE Trans. Veh. Technol. 2018, 67, 10438–10445. [Google Scholar] [CrossRef]
- Bessman, A.; Soares, R.; Wallmark, O.; Svens, P.; Lindbergh, G. Aging effects of AC harmonics on lithium-ion cells. J. Energy Storage 2019, 21, 741–749. [Google Scholar] [CrossRef]
- Harting, N.; Wolff, N.; Röder, F.; Krewer, U. Nonlinear Frequency Response Analysis (NFRA) of Lithium-Ion Batteries. Electrochim. Acta 2017, 248, 133–139. [Google Scholar] [CrossRef]
- Erickson, R.W.; Maksimovic, D. Fundamentals of Power Electronics; Kluwer Academic Publishers: Norwell, MA, USA, 2001; Volume 2. [Google Scholar]
- Khalil, H.K. Nonlinear Systems; Prentice Hall: Upper Saddle River, NJ, USA, 2002; Volume 3. [Google Scholar]
- Vetter, J.; Novák, P.; Wagner, M.R.; Veit, C.; Möller, K.C.; Besenhard, J.O.; Winter, M.; Wohlfahrt-Mehrens, M.; Vogler, C.; Hammouche, A. Ageing mechanisms in lithium-ion batteries. J. Power Sources 2005, 147, 269–281. [Google Scholar] [CrossRef]
- Schmalstieg, J.; Käbitz, S.; Ecker, M.; Sauer, D.W. A holistic aging model for Li(NiMnCo)O2 based 18650 lithium-ion batteries. J. Power Sources 2014, 257, 325–334. [Google Scholar] [CrossRef]
- Ecker, M.; Nieto, N.; Käbitz, S.; Schmalstieg, J.; Blanke, H.; Warnecke, A.; Sauer, D.U. Calendar and cycle life study of Li(NiMnCo)O2-based 18,650 lithium-ion batteries. J. Power Sources 2014, 248, 839–851. [Google Scholar] [CrossRef]
- Bloom, I.; Jansen, A.N.; Abraham, D.P.; Knuth, J.; Jones, S.A.; Battaglia, V.S.; Henriksen, G.L. Differential voltage analyses of high-power, lithium-ion cells: 1. Technique and application. J. Power Sources 2005, 139, 295–303. [Google Scholar] [CrossRef]
- Schuster, S.F.; Bach, T.; Fleder, E.; Müller, J.; Brand, M.; Sextl, G.; Jossen, A. Nonlinear aging characteristics of lithium-ion cells under different operational conditions. J. Energy Storage 2015, 1, 44–53. [Google Scholar] [CrossRef]
- Zou, Y.; Hu, X.; Ma, H.; Li, S.E. Combined State of Charge and State of Health estimation over lithium-ion battery cell cycle lifespan for electric vehicles. J. Power Sources 2015, 273, 793–803. [Google Scholar] [CrossRef]
- Rohr, S.; Müller, S.; Baumann, M.; Kerler, M.; Ebert, F.; Kaden, D.; Lienkamp, M. Quantifying Uncertainties in Reusing Lithium-Ion Batteries from Electric Vehicles. Procedia Manuf. 2017, 8, 603–610. [Google Scholar] [CrossRef]
- Baumhöfer, T.; Brühl, M.; Rothgang, S.; Sauer, D.U. Production caused variation in capacity aging trend and correlation to initial cell performance. J. Power Sources 2014, 247, 332–338. [Google Scholar] [CrossRef]
- Petzl, M.; Kasper, M.; Danzer, M.A. Lithium plating in a commercial lithium-ion battery—A low-temperature aging study. J. Power Sources 2015, 275, 799–807. [Google Scholar] [CrossRef]
- Keil, P.; Jossen, A. Calendar Aging of NCA Lithium-Ion Batteries Investigated by Differential Voltage Analysis and Coulomb Tracking. J. Electrochem. Soc. 2017, A6066–A6074. [Google Scholar] [CrossRef]
- Barsoukov, E.; Macdonald, J.R. Impedance Spectroscopy; Wiley-Interscience: Hoboken, NJ, USA, 2005; Volume 2. [Google Scholar]
- Hahn, M.; Schindler, S.; Triebs, L.C.; Danzer, M.A. Optimized Process Parameters for a Reproducible Distribution of Relaxation Times Analysis of Electrochemical Systems. Batteries 2019, 5, 43. [Google Scholar] [CrossRef]
- Danzer, M.A. Generalized Distribution of Relaxation Times Analysis for the Characterization of Impedance Spectra. Batteries 2019, 5, 53. [Google Scholar] [CrossRef]
- Schmidt, J.P.; Chrobak, T.; Ender, M.; Illig, J.; Klotz, D. Ivers-Tiffée, E. Studies on LiFePO4 as cathode material using impedance spectroscopy. J. Power Sources 2011, 196, 5342–5348. [Google Scholar] [CrossRef]
- Ivers-Tiffée, E.; Weber, A. Evaluation of electrochemical impedance spectra by the distribution of relaxation times. J. Ceram. Soc. Jpn. 2017, 125, 193–201. [Google Scholar] [CrossRef]
- Korth Pereira Ferraz, P.; Schmidt, R.; Kober, D.; Kowal, J. A high frequency model for predicting the behavior of lithium-ion batteries connected to fast switching power electronics. J. Energy Storage 2018, 18, 40–49. [Google Scholar] [CrossRef]
- Osswald, P.; Erhard, S.; Noel, A.; Keil, P.; Kindermann, F.; Hoster, H.; Jossen, A. Current density distribution in cylindrical Li-Ion cells during impedance measurements. J. Power Sources 2016, 314, 93–101. [Google Scholar] [CrossRef]
- Burkart, R.; Kolar, J.W. Component cost models for multi-objective optimizations of switched-mode power converters. In Proceedings of the 2013 IEEE Energy Conversion Congress and Exposition, Denver, CO, USA, 15–19 September 2013; pp. 2139–2146. [Google Scholar] [CrossRef]
- Wang, H.; Wang, H.; Zhu, G.; Blaabjerg, F. Cost assessment of three power decoupling methods in a single-phase power converter with a reliability-oriented design procedure. In Proceedings of the 2016 IEEE 8th International Power Electronics and Motion Control Conference (IPEMC-ECCE Asia), Hefei, China, 22–26 May 2016; pp. 3818–3825. [Google Scholar] [CrossRef]


| Test Systems | ||
|---|---|---|
| Conventional | Ripple Current | |
| 100% | , , , | , , , , , |
| 10% | , | , |
© 2019 by the authors. Licensee MDPI, Basel, Switzerland. This article is an open access article distributed under the terms and conditions of the Creative Commons Attribution (CC BY) license (http://creativecommons.org/licenses/by/4.0/).
Share and Cite
Korth Pereira Ferraz, P.; Kowal, J. A Comparative Study on the Influence of DC/DC-Converter Induced High Frequency Current Ripple on Lithium-Ion Batteries. Sustainability 2019, 11, 6050. https://doi.org/10.3390/su11216050
Korth Pereira Ferraz P, Kowal J. A Comparative Study on the Influence of DC/DC-Converter Induced High Frequency Current Ripple on Lithium-Ion Batteries. Sustainability. 2019; 11(21):6050. https://doi.org/10.3390/su11216050
Chicago/Turabian StyleKorth Pereira Ferraz, Pablo, and Julia Kowal. 2019. "A Comparative Study on the Influence of DC/DC-Converter Induced High Frequency Current Ripple on Lithium-Ion Batteries" Sustainability 11, no. 21: 6050. https://doi.org/10.3390/su11216050
APA StyleKorth Pereira Ferraz, P., & Kowal, J. (2019). A Comparative Study on the Influence of DC/DC-Converter Induced High Frequency Current Ripple on Lithium-Ion Batteries. Sustainability, 11(21), 6050. https://doi.org/10.3390/su11216050