The Evolution of Industrial Agglomerations and Specialization in the Yangtze River Delta from 1990–2018: An Analysis Based on Firm-Level Big Data


Abstract
:1. Introduction
2. Theoretical and Empirical Controversies
3. Study Area, Data Sources and Research Methods
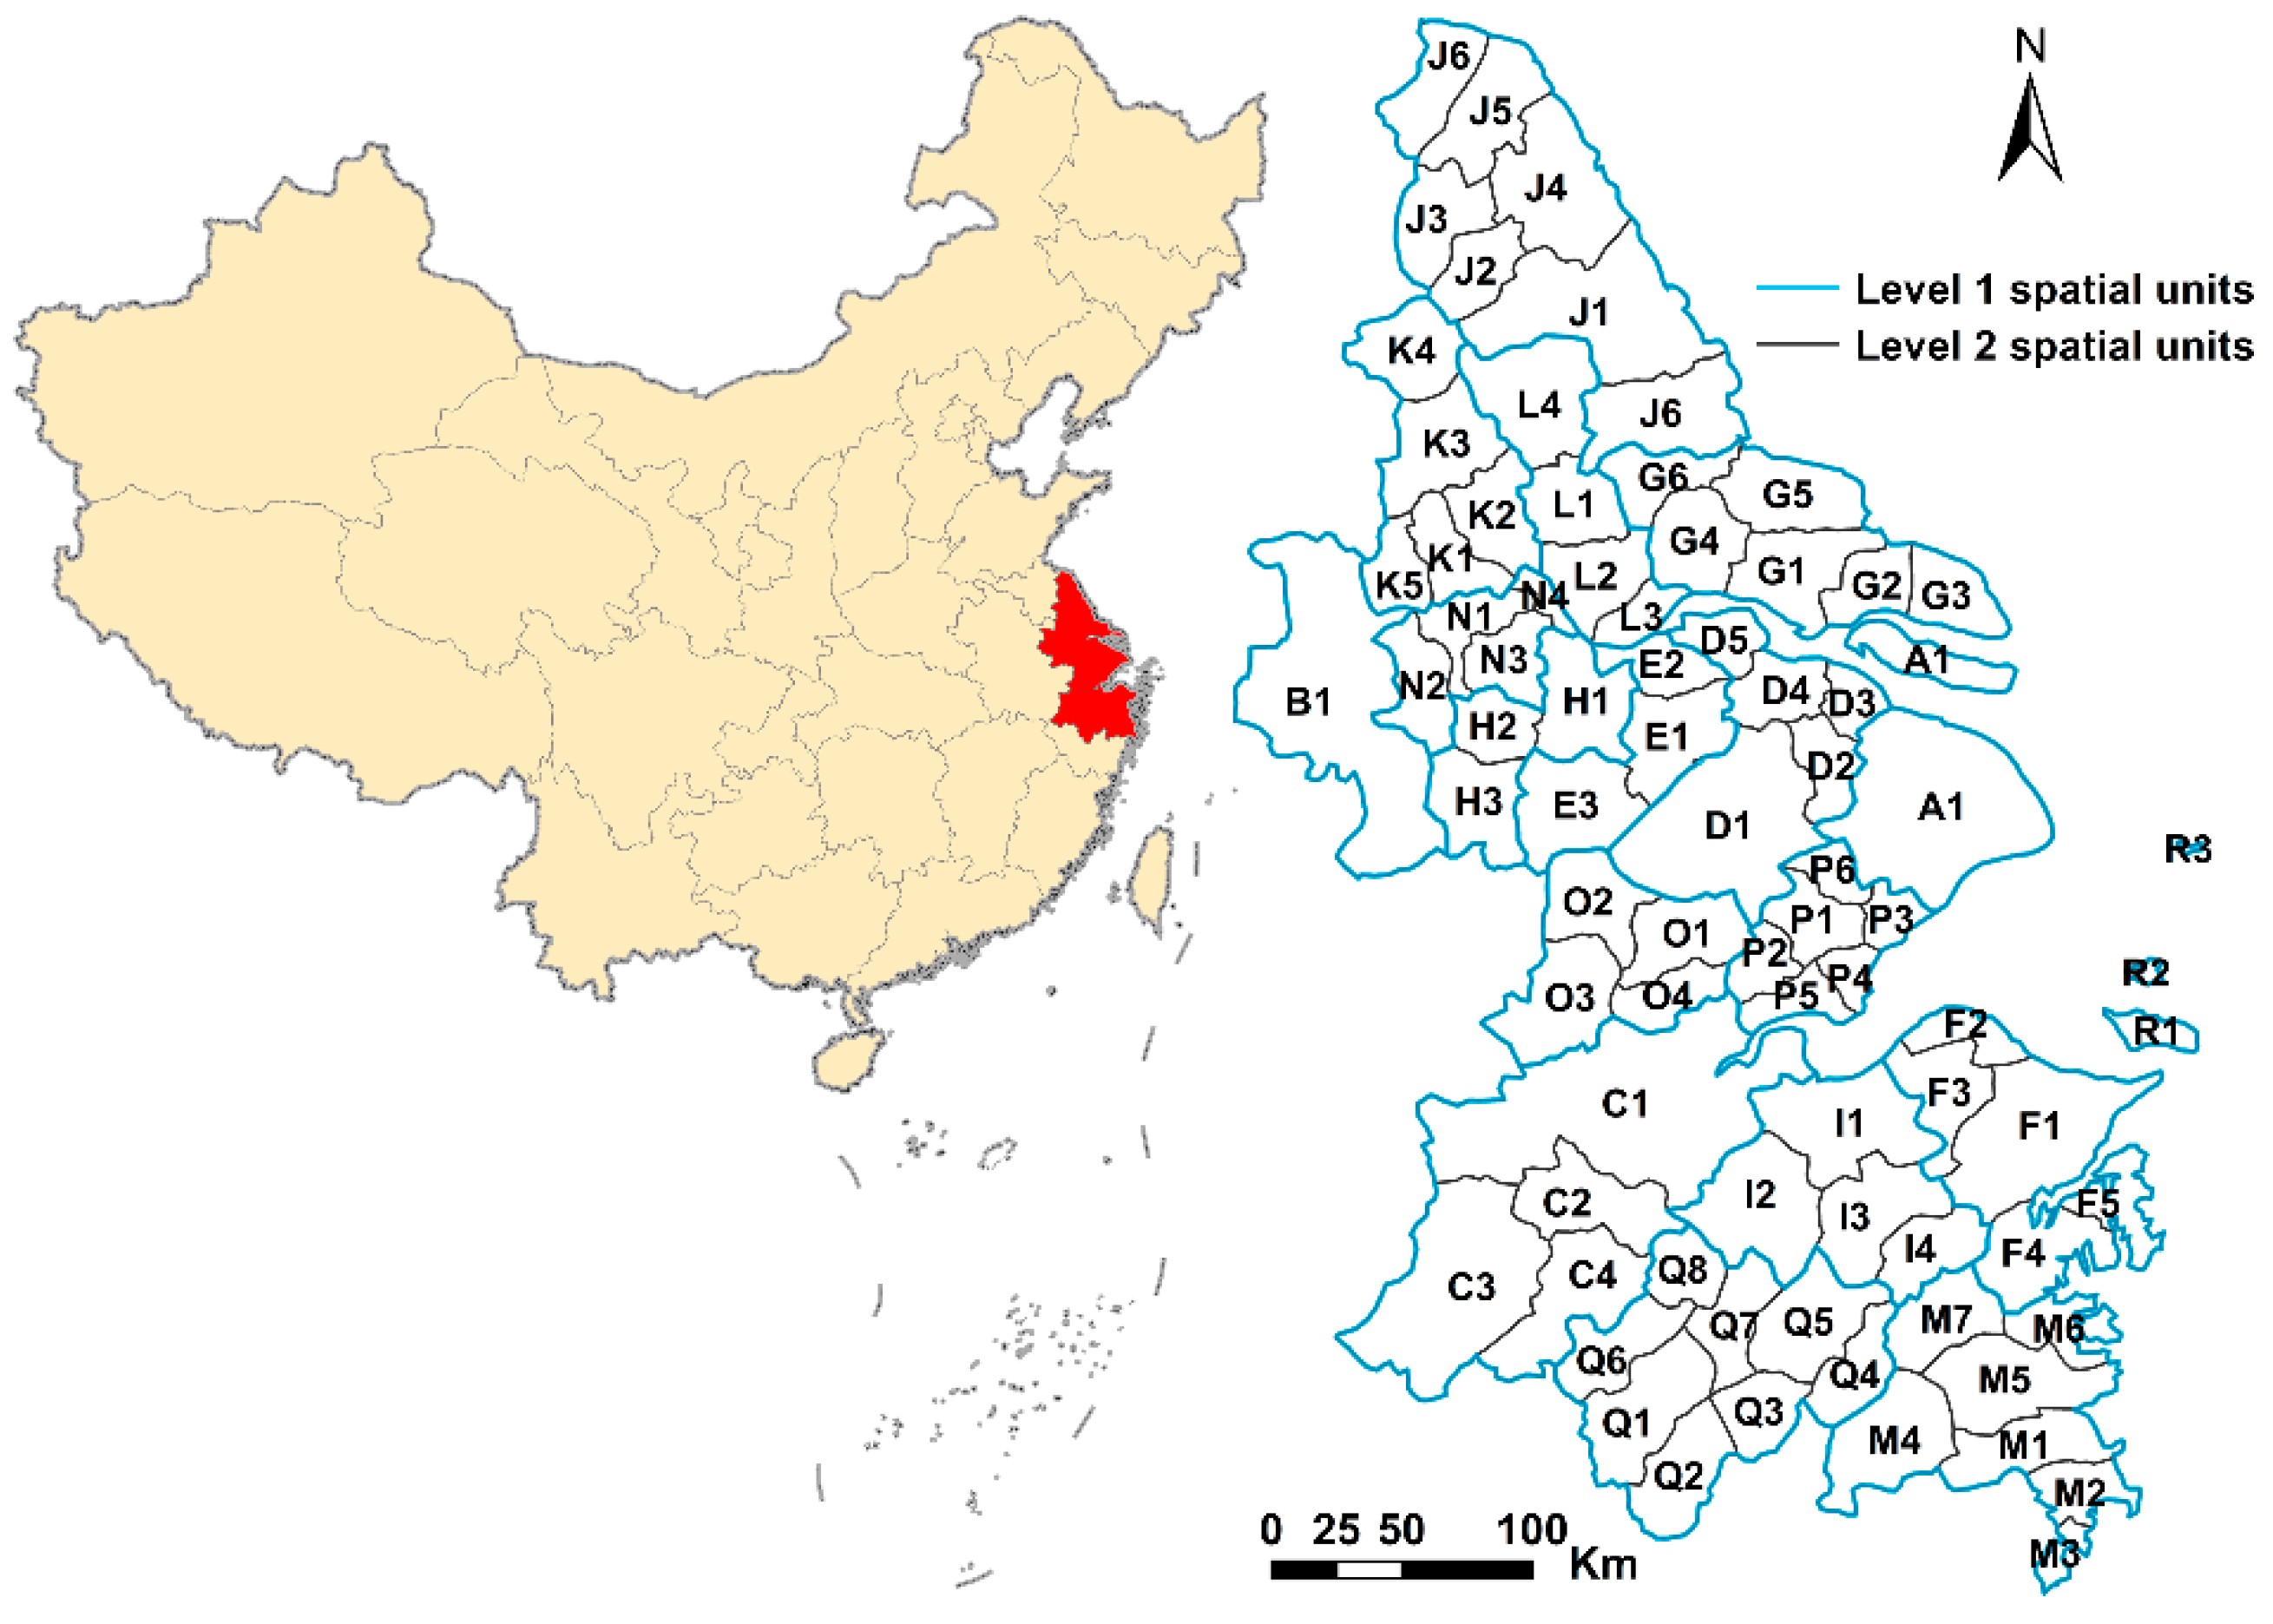
3.1. Study Area
3.2. Data Sources
3.3. Research Methods
3.3.1. EG Index
3.3.2. Location Quotient (LQ)
3.3.3. Moran’s I and Getis-Ord Gi*
4. Results
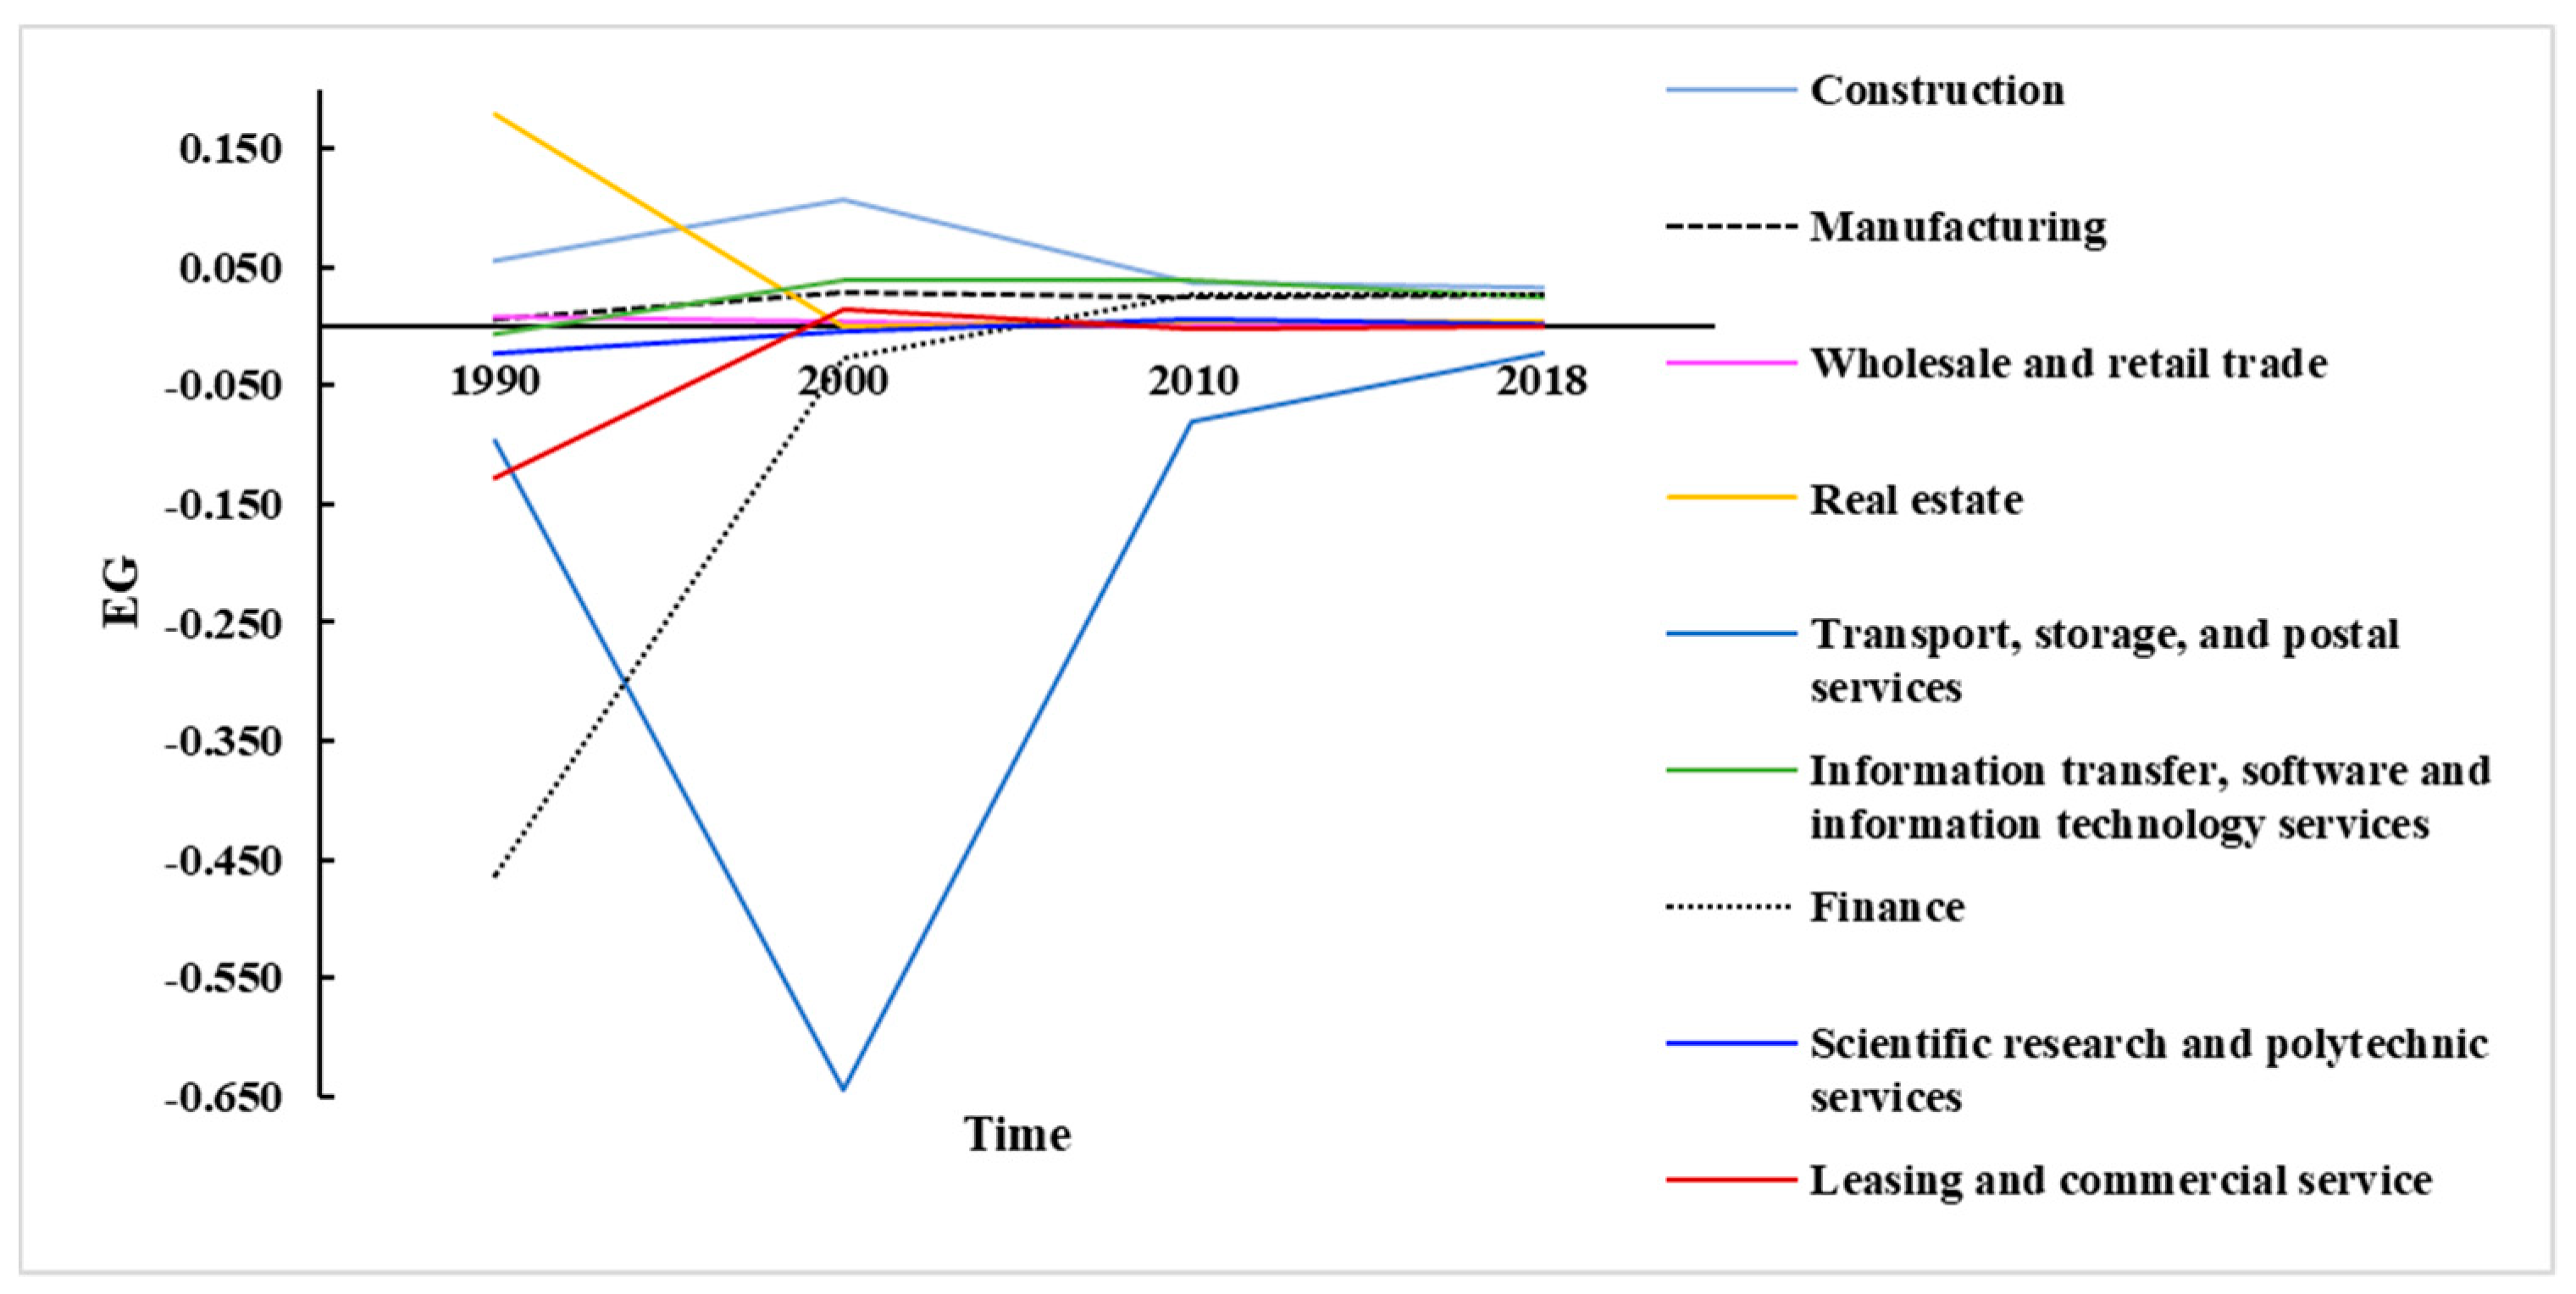
4.1. Industrial Agglomeration Characteristics and Evolutionary Trajectories of Different Industries
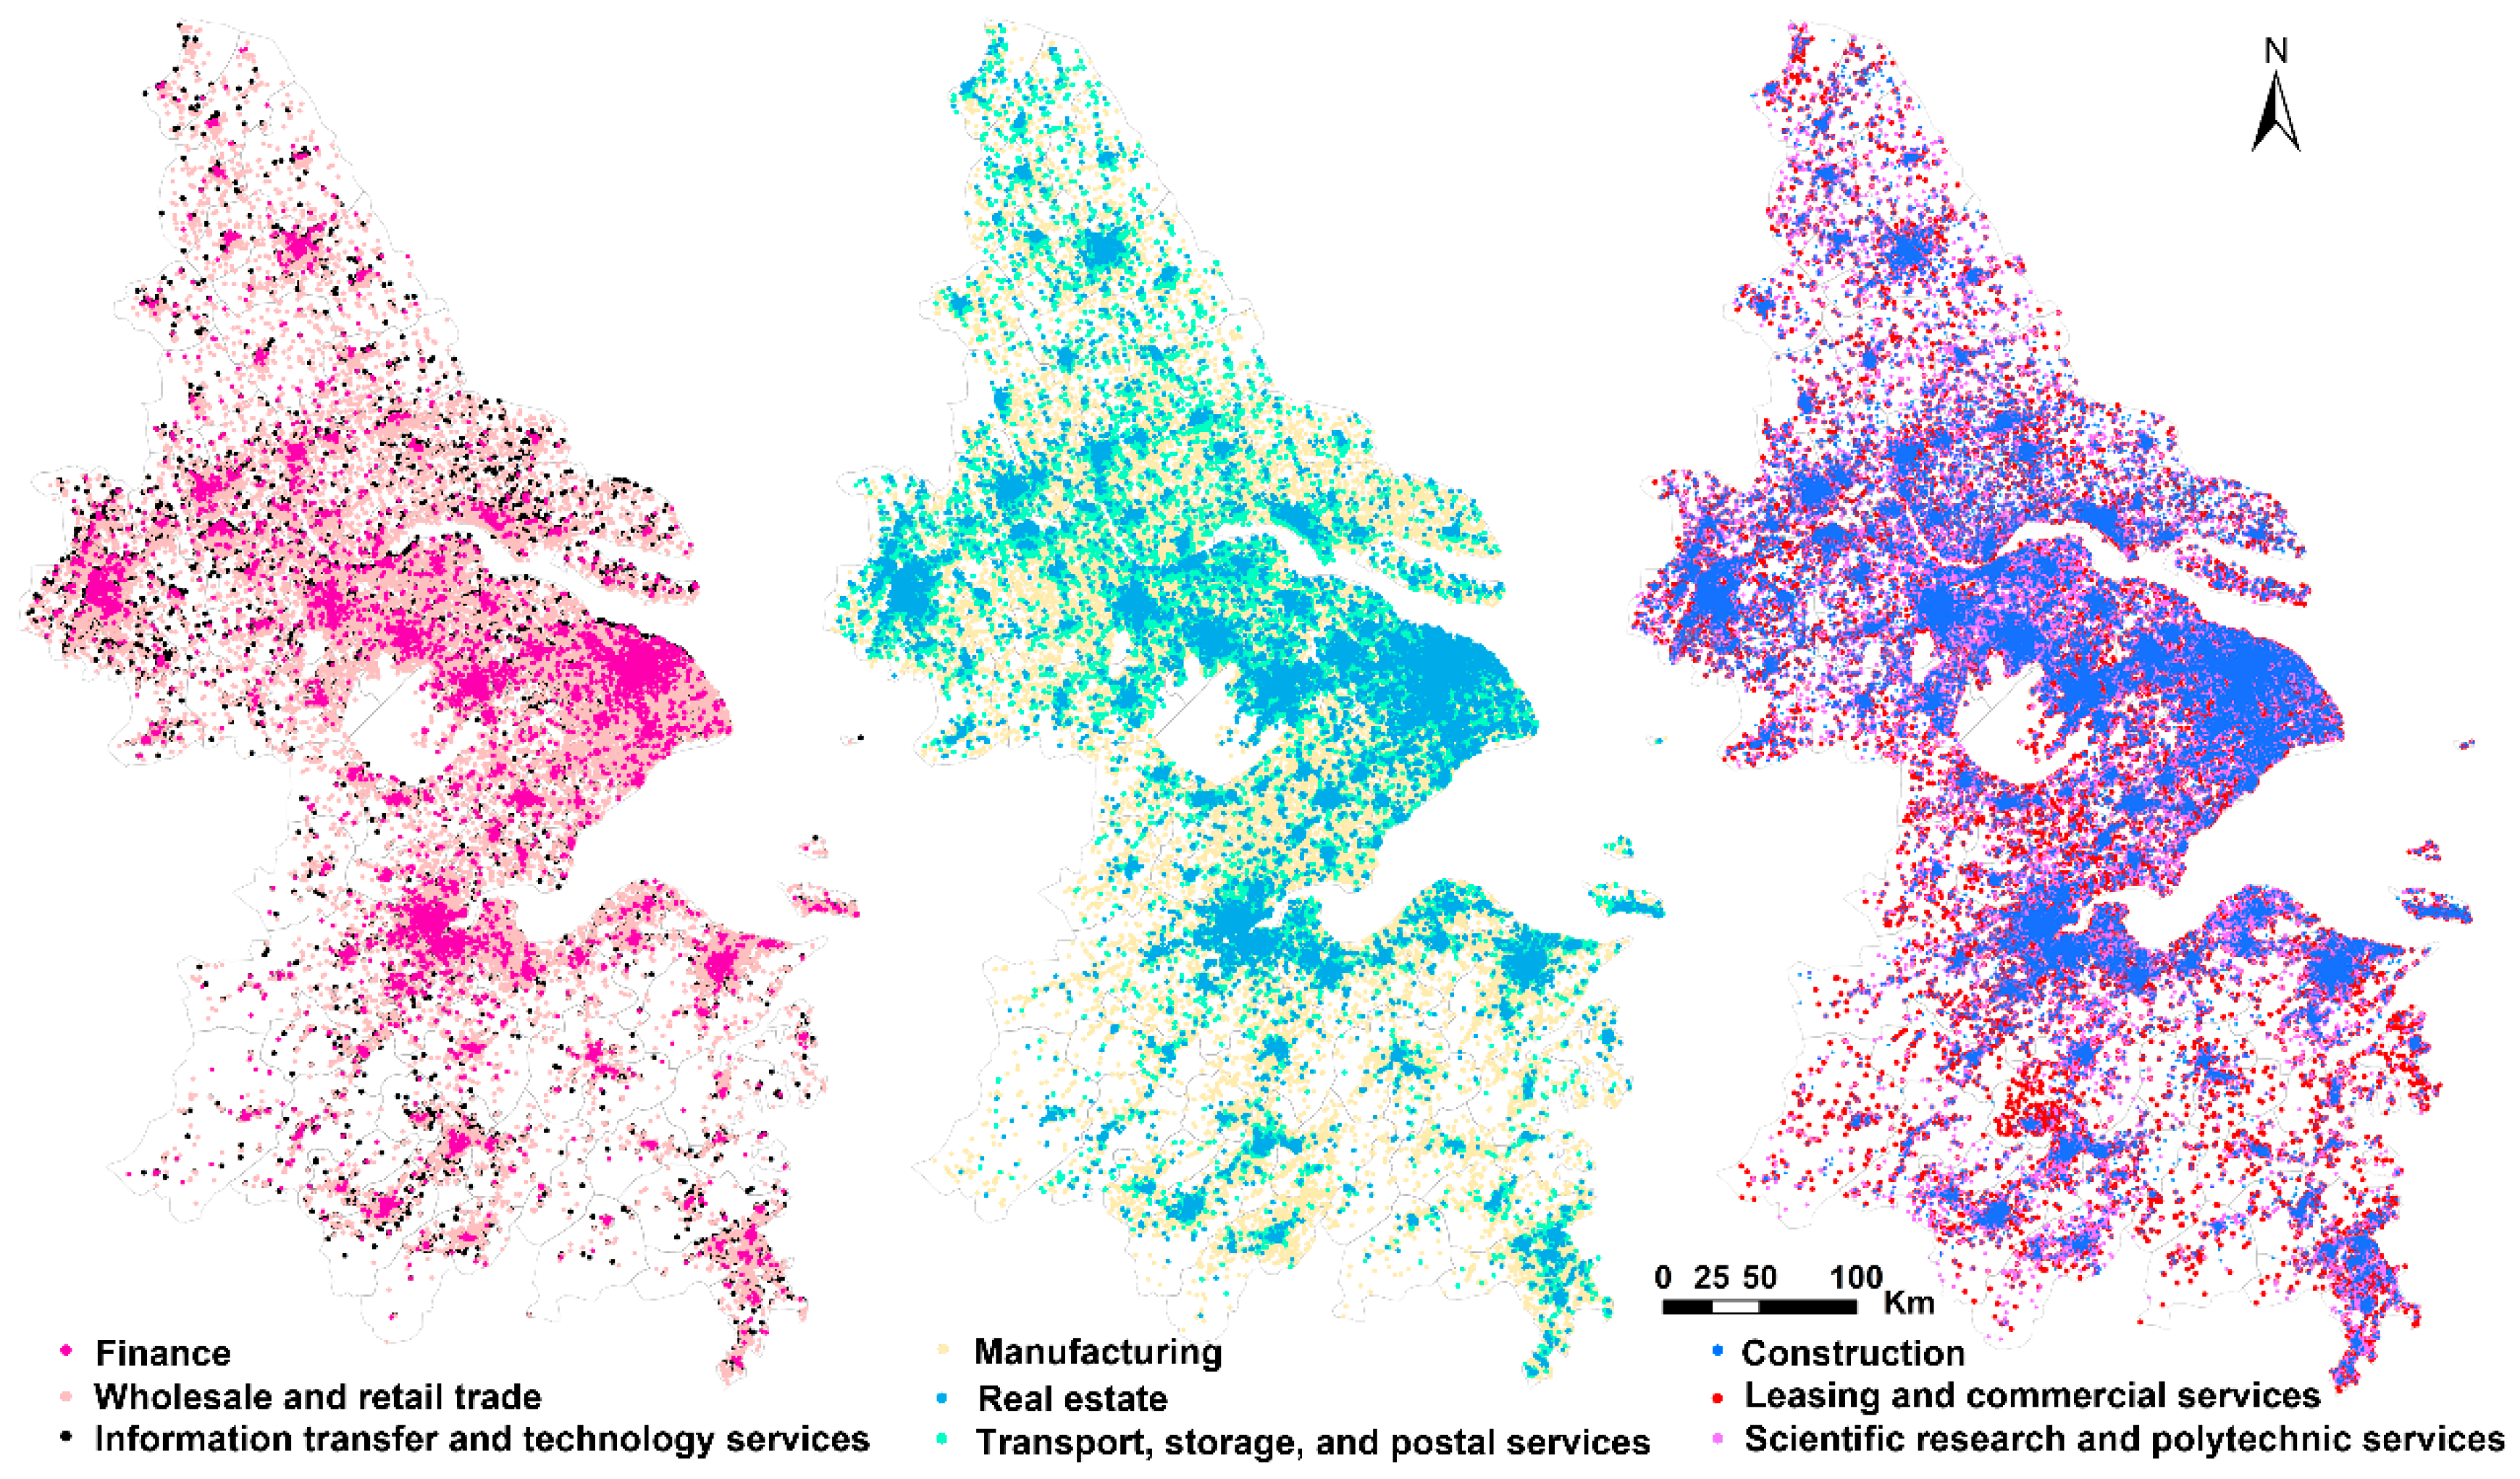
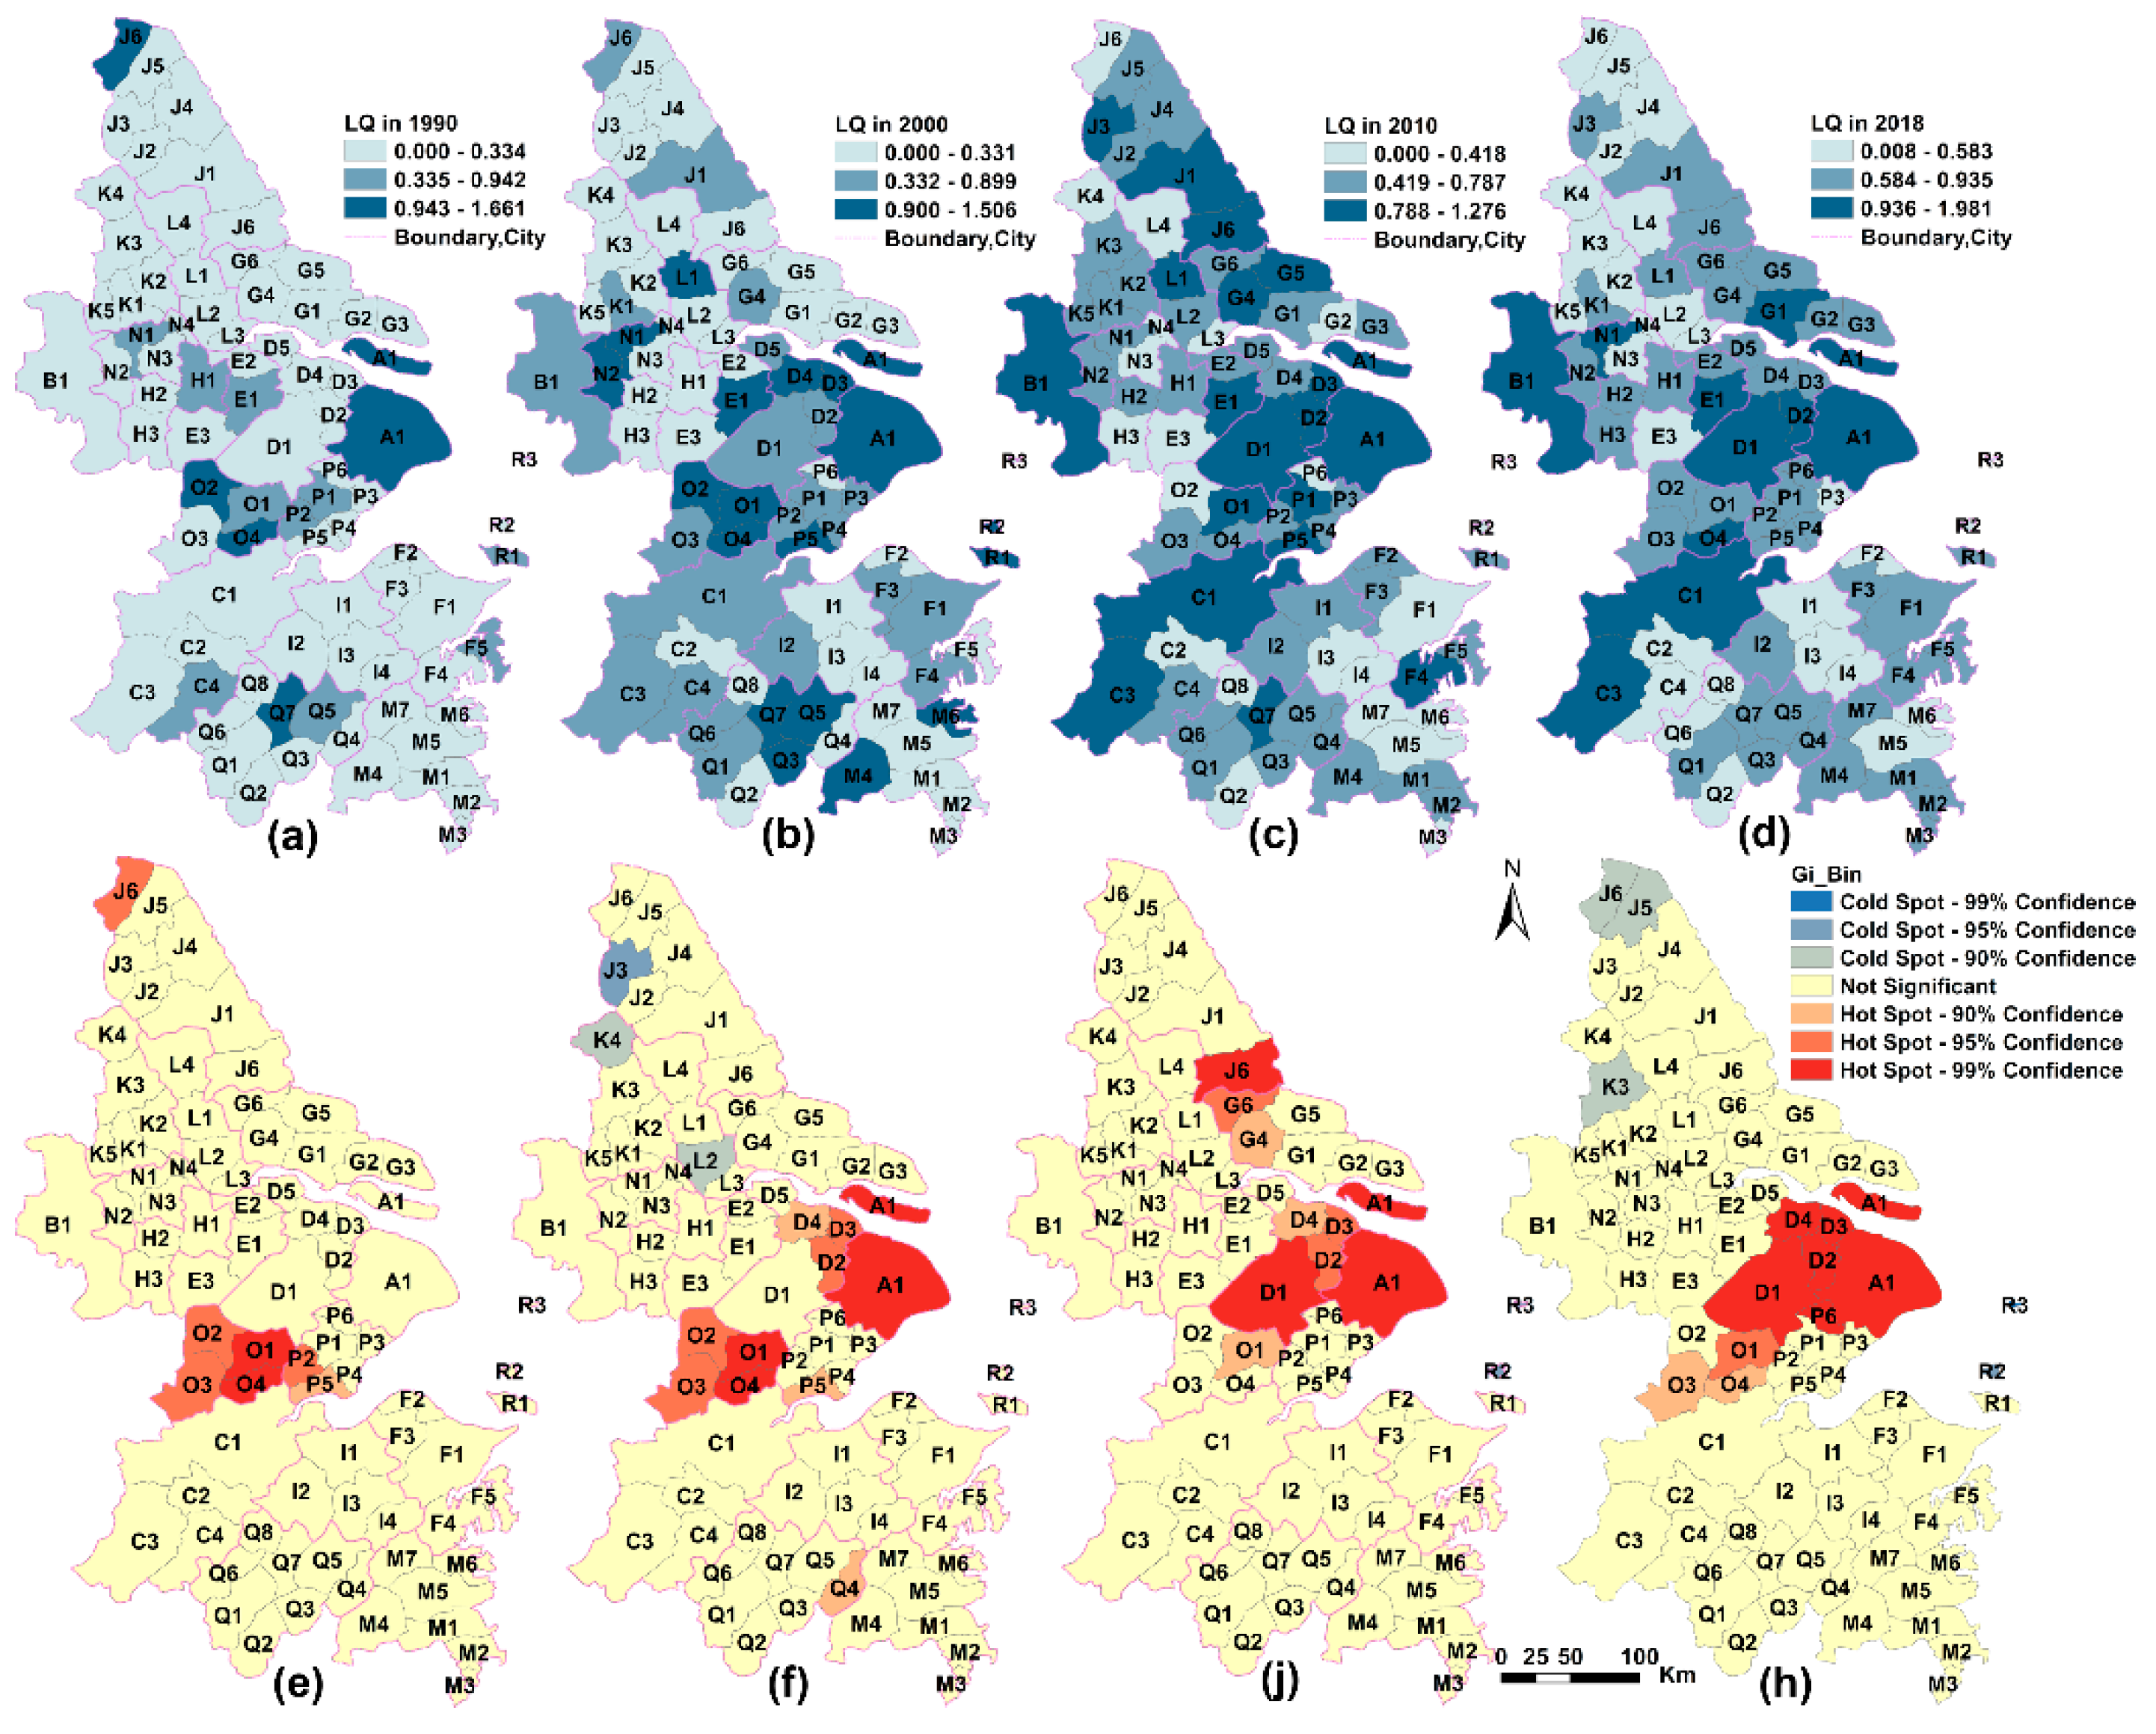
4.2. Spatial Evolution and Spatial Pattern of Specialization in YRD
4.2.1. The Characteristics of Regional Specialization of Different Industries
4.2.2. Spatial Evolution and Spatial Patterns of Specialization for Different Industries
5. Discussions
6. Conclusions
Author Contributions
Funding
Conflicts of Interest
References
- Henderson, V. Externalities and Industrial Development. J. Urban Econ. 1997, 42, 449–470. [Google Scholar] [CrossRef] [Green Version]
- Solvell, O.; Ketels, C.; Lindqvist, G. Industrial specialization and regional clusters in the ten new EU member states. Compet. Rev. 2008, 18, 104–130. [Google Scholar] [CrossRef]
- Behrens, K.; Bougna, T. An anatomy of the geographical concentration of Canadian manufacturing industries. Reg. Sci. Urban Econ. 2015, 51, 47–69. [Google Scholar] [CrossRef] [Green Version]
- Arbia, G.; Espa, G.; Giuliani, D.; Dickson, M.M. Spatio-temporal clustering in the pharmaceutical and medical device manufacturing industry: A geographical micro-level analysis. Reg. Sci. Urban Econ. 2014, 49, 298–304. [Google Scholar] [CrossRef]
- Arbia, G. The role of spatial effects in the empirical analysis of regional concentration. J. Geogr. Syst. 2001, 3, 271–281. [Google Scholar] [CrossRef]
- He, C.; Wei, Y.H.D.; Pan, F. Geographical Concentration of Manufacturing Industries in China: The Importance of Spatial and Industrial Scales. Eurasian Geogr. Econ. 2007, 48, 603–625. [Google Scholar] [CrossRef]
- Falcioğlu, P.; Akgüngör, S. Regional Specialization and Industrial Concentration Patterns in the Turkish Manufacturing Industry: An Assessment for the 1980–2000 Period. Eur. Plan. Stud. 2008, 16, 303–323. [Google Scholar] [CrossRef]
- Marshall, A. Principles of Economics: Unabridged Eighth Edition; Cosimo, Inc.: New York, NY, USA, 2009. [Google Scholar]
- Krugman, P. What’s new about the new economic geography? Oxf. Rev. Econ. Policy 1998, 14, 7–17. [Google Scholar] [CrossRef]
- Long, C.; Zhang, X. Cluster-based industrialization in China: Financing and performance. J. Int. Econ. 2011, 84, 112–123. [Google Scholar] [CrossRef] [Green Version]
- Pilipenko, I. Clusters and Territorial-Industrial Complexes—Similar Approaches or Different Concepts?—first Evidence from Analysis of Development of Russian Regions. In Proceedings of the European Regional Science Association’Land Use and Water Management in a Sustainable Network Society, Amsterdam, The Netherlands, 23–27 August 2005. [Google Scholar]
- Chapman, S.A. Specialization and agglomeration patterns in Eastern Europe. Eur. J. Comp. Econ. 2013, 1, 49–79. [Google Scholar]
- Aiginger, K.; Rossi-Hansberg, E. Specialization and concentration: A note on theory and evidence. Empirica 2006, 33, 255–266. [Google Scholar] [CrossRef]
- Goschin, Z.; Constantin, D.; Roman, M.; Ileanu, B. Regional specialization and geographic concentration of industries in Romania. South-East. Eur. J. Econ. 2009, 1, 99–113. [Google Scholar]
- Long, C.; Zhang, X. Patterns of China’s industrialization: Concentration, specialization, and clustering. China Econ. Rev. 2012, 23, 593–612. [Google Scholar] [CrossRef]
- Kim, S. Expansion of Markets and the Geographic Distribution of Economic Activities: The Trends in U. S. Regional Manufacturing Structure, 1860–1987. Q. J. Econ. 1995, 110, 881–908. [Google Scholar] [CrossRef]
- Lu, J.; Tao, Z. Trends and determinants of China’s industrial agglomeration. J. Urban Econ. 2009, 65, 167–180. [Google Scholar] [CrossRef]
- Midelfart-Knarvik, K.H.; Overman, H.G.; Redding, S.J.; Venables, A.J. The Location of European Industry; SNF: Berne, Switzerland, 2000. [Google Scholar]
- Aiginger, K.; Pfaffermayr, M. The Single Market and Geographic Concentration in Europe. Rev. Int. Econ. 2004, 12, 1–11. [Google Scholar] [CrossRef]
- Bertinelli, L.; Decrop, J. Geographical agglomeration: Ellison and Glaeser’s index applied to the case of Belgian manufacturing industry. Reg. Stud. 2005, 39, 567–583. [Google Scholar] [CrossRef]
- Rossi-Hansberg, E. A Spatial Theory of Trade. Am. Econ. Rev. 2005, 95, 1464–1491. [Google Scholar] [CrossRef]
- Wen, M. Relocation and agglomeration of Chinese industry. J. Dev. Econ. 2004, 73, 329–347. [Google Scholar] [CrossRef] [Green Version]
- Koh, H.-J.; Riedel, N. Assessing the Localization Pattern of German Manufacturing and Service Industries: A Distance-based Approach. Reg. Stud. 2014, 48, 823–843. [Google Scholar] [CrossRef]
- Sassen, S. Cities in a World Economy, 5th ed.; SAGE Publications, Inc.: Thousand Oaks, CA, USA, 2019. [Google Scholar]
- Castells, M. The Rise of the Network Society, 2nd ed.; Blackwell Publishers: Oxford, UK, 2000. [Google Scholar]
- Kowalski, A.M.; Marcinkowski, A. Clusters versus Cluster Initiatives, with Focus on the ICT Sector in Poland. Eur. Plan. Stud. 2014, 22, 20–45. [Google Scholar] [CrossRef]
- Dumais, G.; Ellison, G.; Glaeser, E.L. Geographic Concentration as a Dynamic Process. Rev. Econ. Stat. 2002, 84, 193–204. [Google Scholar] [CrossRef]
- Arbia, G.; Espa, G.; Giuliani, D.; Mazzitelli, A. Clusters of firms in an inhomogeneous space: The high-tech industries in Milan. Econ. Model. 2012, 29, 3–11. [Google Scholar] [CrossRef]
- Zheng, D.; Kuroda, T. The impact of economic policy on industrial specialization and regional concentration of China’s high-tech industries. Ann. Reg. Sci. Int. J. UrbanReg. Environ. Res. Policy 2013, 50, 771–790. [Google Scholar] [CrossRef]
- Arbia, G.; Espa, G.; Giuliani, D.; Mazzitelli, A. Detecting the existence of space-time clustering of firms. Reg. Sci. Urban Econ. 2010, 40, 311–323. [Google Scholar] [CrossRef]
- Jaffe, A.B.; Trajtenberg, M.; Henderson, R. Geographic Localization of Knowledge Spillovers as Evidenced by Patent Citations. Q. J. Econ. 1993, 108, 577–598. [Google Scholar] [CrossRef]
- Audretsch, D.B.; Feldman, M.P. R&D Spillovers and the Geography of Innovation and Production. Am. Econ. Rev. 1996, 86, 630–640. [Google Scholar]
- Maurel, F.O.; Béatrice, S.D. A measure of the geographic concentration in French manufacturing industries. Reg. Sci. Urban Econ. 1999, 29, 575–604. [Google Scholar] [CrossRef]
- Dauth, W.; Fuchs, M.; Otto, A. Long-run processes of geographical concentration and dispersion: Evidence from Germany. Pap. Reg. Sci. 2018, 97, 569–593. [Google Scholar] [CrossRef]
- Brülhart, M.; Traeger, R. An account of geographic concentration patterns in Europe. Reg. Sci. Urban Econ. 2005, 35, 597–624. [Google Scholar] [CrossRef] [Green Version]
- Fan, C.C.; Scott, A.J. Industrial Agglomeration and Development: A Survey of Spatial Economic Issues in East Asia and a Statistical Analysis of Chinese Regions. Econ. Geogr. 2003, 79, 295–319. [Google Scholar] [CrossRef]
- Coll-Martínez, E.; Moreno-Monroy, A.-I.; Arauzo-Carod, J.-M. Agglomeration of creative industries: An intra-metropolitan analysis for Barcelona. Pap. Reg. Sci. 2019, 98, 409–431. [Google Scholar] [CrossRef]
- Arbia, G.; Espa, G.; Quah, D. A class of spatial econometric methods in the empirical analysis of clusters of firms in the space. Empir. Econ. 2008, 34, 81–103. [Google Scholar] [CrossRef]
- Cao, W.; Li, Y.; Cheng, J.; Millington, S. Location patterns of urban industry in Shanghai and implications for sustainability. J. Geogr. Sci. 2017, 27, 857–878. [Google Scholar] [CrossRef] [Green Version]
- Liu, Z. Global and Local: Measuring Geographical Concentration of China’s Manufacturing Industries. Prof. Geogr. 2014, 66, 284–297. [Google Scholar] [CrossRef]
- Nakajima, K.; Saito, Y.U.; Uesugi, I. Measuring economic localization: Evidence from Japanese firm-level data. J. Jpn. Int. Econ. 2012, 26, 201–220. [Google Scholar] [CrossRef] [Green Version]
- Koech, J.; Wynne, M.A. Diversification and specialization of U.S. states. Rev. Reg. Stud. 2017, 47, 63–91. [Google Scholar] [CrossRef]
- Ellison, G.; Glaeser, E.L. Geographic Concentration in U.S. Manufacturing Industries: A Dartboard Approach. J. Political Econ. 1997, 105, 889–927. [Google Scholar] [CrossRef] [Green Version]
- Ripley, B.D. The Second-Order Analysis of Stationary Point Processes. J. Appl. Probab. 1976, 13, 255–266. [Google Scholar] [CrossRef]
- Marcon, E.; Puech, F. A typology of distance-based measures of spatial concentration. Reg. Sci. Urban Econ. 2017, 62, 56–67. [Google Scholar] [CrossRef]
- Marcon, E.; Puech, F. Measures of the geographic concentration of industries: Improving distance-based methods. J. Econ. Geogr. 2010, 10, 745–762. [Google Scholar] [CrossRef]
- Arbia, G.; Piras, G. A new class of spatial concentration measures. Comput. Stat. Data Anal. 2009, 53, 4471–4481. [Google Scholar] [CrossRef]
- Guimarães, P.; Figueiredo, O.; Woodward, D. Accounting for neighboring effects in measures of spatial concentration. J. Reg. Sci. 2011, 51, 678–693. [Google Scholar] [CrossRef]
- Sternberg, R.; Litzenberger, T. Regional clusters in Germany—Their geography and their relevance for entrepreneurial activities. Eur. Plan. Stud. 2004, 12, 767–791. [Google Scholar] [CrossRef]
- Sohn, J. Industry classification considering spatial distribution of manufacturing activities. Area 2014, 46, 101–110. [Google Scholar] [CrossRef]
- Carroll, M.; Reid, N.; Smith, B. Location quotients versus spatial autocorrelation in identifying potential cluster regions. Ann. Reg. Sci. 2008, 42, 449–463. [Google Scholar] [CrossRef]
- Feser, E.J.; Sweeney, S.H.; Renski, H.C. A Descriptive Analysis of Discrete U.S. Industrial Complexes. J. Reg. Sci. 2010, 45, 395–419. [Google Scholar] [CrossRef]
- Lafourcade, M.; Mion, G. Concentration, agglomeration and the size of plants. Reg. Sci. Urban Econ. 2007, 37, 46–68. [Google Scholar] [CrossRef]
- Sohn, J. Do birds of a feather flock together?: Economic linkage and geographic proximity. Ann. Reg. Sci. 2004, 38, 47–73. [Google Scholar] [CrossRef]
- Holz, C.A. Chinese statistics: Classification systems and data sources. Eurasian Geogr. Econ. 2013, 54, 532–571. [Google Scholar] [CrossRef]
- Mitchell, A. The Esri Guide to Gis Analysis: Geographic Patterns & Relationships: Vol 1; Esri Inc.: Redlands, CA, USA, 1999. [Google Scholar]
- Krugman, P.R. Geography and Trade; Leuven University Press: Leuven, Belgium; MIT Press: Cambridge, MA, USA, 1991. [Google Scholar]
- Tabuchi, T. Urban Agglomeration and Dispersion: A Synthesis of Alonso and Krugman. J. Urban Econ. 1998, 44, 333–351. [Google Scholar] [CrossRef] [Green Version]
- Barlet, M.; Briant, A.; Crusson, L. Location patterns of service industries in France: A distance-based approach. Reg. Sci. Urban Econ. 2013, 43, 338–351. [Google Scholar] [CrossRef]
- Iammarino, S.; McCann, P. The structure and evolution of industrial clusters: Transactions, technology and knowledge spillovers. Res. Policy 2006, 35, 1018–1036. [Google Scholar] [CrossRef]
- Wu, J.; Wei, Y.D.; Li, Q.; Yuan, F. Economic transition and changing location of manufacturing industry in China: A study of the Yangtze River Delta. Sustainability 2018, 10. [Google Scholar] [CrossRef]
- Dray, S.; Legendre, P.; Peres-Neto, P.R. Spatial modelling: A comprehensive framework for principal coordinate analysis of neighbour matrices (PCNM). Ecol. Model. 2006, 196, 483–493. [Google Scholar] [CrossRef]
- Arbia, G. Modelling the geography of economic activities on a continuous space*. Pap. Reg. Sci. 2005, 80, 411–424. [Google Scholar] [CrossRef]


| Level 1 Spatial Units | Level 2 Spatial Units | Number |
|---|---|---|
| A | Shanghai (A1) | 1 |
| B | Nanjing (B1) | 1 |
| C | Hangzhou (C1), Tonglu (C2), Chunan (C3), Dejian (C4) | 4 |
| D | Suzhou (D1), Kunshan (D2), Taicang (D3), Changshu (D4), Zhangjiagang (D5) | 5 |
| E | Wuxi (E1), Jiangyin (E2), Yixing(E3) | 3 |
| F | Ningbo (F1), Cixi (F2), Yuyao (F3), Ninghai (F4), Xiangshan (F5) | 5 |
| G | Nantong (G1), Haimen (G2), Qidong (G3), Rugao (G4), Rudong (G5), Haian (G6) | 6 |
| H | Changzhou (H1), Jintan (H2), Liyang (H3) | 3 |
| I | Shaoxing (I1), Zhuji (I2), Shengzhou (I3), Xinchang (I4) | 4 |
| J | Yancheng (J1), Jianhu (J2), Funing (J3), Sheyang (J4), Binhai (J5), Xiangshui (J6), Dongtai (J7) | 7 |
| K | Yangzhou (K1), Jiangdu (K2), Gaoyou (K3), Baoying (K4), Yizheng (K5) | 5 |
| L | Taizhou (L1), Taixing (L2), Jingjiang (L3), Xinghua (L4) | 4 |
| M | Taizhou (M1), Wenling (M2), Yuhuan (M3), Xianju (M4), Linhai (M5), Sanmen (M6), Tiantai (M7) | 7 |
| N | Zhenjiang (N1), Jurong (N2), Danyang (N3), Yangzhou (N4) | 4 |
| O | Huzhou (O1), Changxing (O2), Anji (O3), Deqing (O4) | 4 |
| P | Jiaxing (P1), Tongxiang (P2), Pinghu (P3), Haiyan (P4), Haining (P5), Jiashan (P6) | 6 |
| Q | Jinhua (Q1), Wuyi (Q2), Yongkang (Q3), Panan (Q4), Dongyang (Q5), Lanxi (Q6), Yiwu (Q7), Pujiang (Q8) | 8 |
| R | Zhoushan (R1), Daishan (R2), Shengsi (R3). | 3 |
| Industries | Number of Firms | Minimum Firm Size | Maximum Firm Size | Mean | SD |
|---|---|---|---|---|---|
| Manufacturing | 609,506 | 50 | 5,279,110 | 1215 | 15,272 |
| Construction | 189,629 | 50 | 7,268,710 | 1702 | 27,338 |
| Wholesale and retail trade | 1,136,800 | 50 | 37,696,905 | 501 | 64,473 |
| Transport, storage, and postal services | 94,244 | 50 | 39,883,439 | 1657 | 132,170 |
| Information transfer, software, and information technology services | 133,210 | 50 | 2,960,000 | 900 | 12,245 |
| Finance | 16,175 | 50 | 7,426,273 | 14154 | 110,251 |
| Real estate | 43,819 | 50 | 2,264,901 | 5150 | 29,552 |
| Leasing and commercial services | 442,706 | 50 | 57,942,000 | 2773 | 99,342 |
| Scientific research and polytechnic services | 386,935 | 50 | 5,000,200 | 986 | 14,445 |
| Industries | HHI (Herfindahl Index) | G (Spatial Gini Coefficient) | EG | |||||||||
|---|---|---|---|---|---|---|---|---|---|---|---|---|
| 1990 | 2000 | 2010 | 2018 | 1990 | 2000 | 2010 | 2018 | 1990 | 2000 | 2010 | 2018 | |
| Construction | 0.014 | 0.017 | 0.004 | 0.001 | 0.048 | 0.090 | 0.035 | 0.029 | 0.056 | 0.108 | 0.037 | 0.033 |
| Manufacturing | 0.010 | 0.002 | 0.000 | 0.000 | 0.011 | 0.023 | 0.020 | 0.024 | 0.006 | 0.030 | 0.024 | 0.027 |
| Wholesale and retail trade | 0.022 | 0.003 | 0.026 | 0.005 | 0.020 | 0.004 | 0.022 | 0.007 | 0.008 | 0.003 | 0.001 | 0.003 |
| Real estate | 0.112 | 0.006 | 0.001 | 0.001 | 0.190 | 0.004 | 0.003 | 0.004 | 0.179 | 0.000 | 0.003 | 0.004 |
| Transport, storage, and postal services | 0.114 | 0.464 | 0.166 | 0.068 | 0.020 | 0.088 | 0.083 | 0.041 | −0.097 | −0.644 | −0.080 | −0.022 |
| Information transfer, software, and information technology services | 0.327 | 0.043 | 0.005 | 0.001 | 0.227 | 0.059 | 0.037 | 0.023 | −0.005 | 0.039 | 0.039 | 0.026 |
| Finance | 0.407 | 0.044 | 0.011 | 0.004 | 0.093 | 0.014 | 0.031 | 0.026 | −0.464 | −0.026 | 0.027 | 0.027 |
| Scientific research and polytechnic services | 0.029 | 0.010 | 0.001 | 0.001 | 0.005 | 0.005 | 0.006 | 0.002 | −0.023 | −0.003 | 0.006 | 0.002 |
| Leasing and commercial services | 0.290 | 0.031 | 0.018 | 0.003 | 0.140 | 0.034 | 0.013 | 0.003 | −0.128 | 0.015 | −0.003 | 0.001 |
| Industries | 1990 | 2000 | 2010 | 2018 | ||||
|---|---|---|---|---|---|---|---|---|
| Mean | SD | Mean | SD | Mean | SD | Mean | SD | |
| Construction | 1.142 | 0.767 | 1.41 | 0.726 | 1.308 | 0.599 | 1.391 | 0.682 |
| Manufacturing | 1.33 | 0.745 | 1.538 | 0.602 | 1.547 | 0.49 | 1.629 | 0.556 |
| Real estate | 0.437 | 0.579 | 0.623 | 0.427 | 0.882 | 0.359 | 0.836 | 0.354 |
| Finance | 0.155 | 0.352 | 0.469 | 0.408 | 0.614 | 0.343 | 0.59 | 0.285 |
| Information transfer, software, and information technology services | 0.084 | 0.334 | 0.252 | 0.405 | 0.422 | 0.455 | 0.614 | 0.508 |
| Scientific research and polytechnic services | 0.304 | 0.43 | 0.501 | 0.484 | 0.735 | 0.502 | 1.003 | 0.462 |
| Transport, storage, and postal services | 0.277 | 0.304 | 0.26 | 0.338 | 0.445 | 0.38 | 0.606 | 0.358 |
| Wholesale and retail trade | 0.735 | 0.483 | 0.887 | 0.468 | 0.72 | 0.36 | 0.9 | 0.361 |
| Leasing and commercial services | 0.214 | 0.391 | 0.521 | 0.437 | 0.601 | 0.299 | 0.688 | 0.274 |
| Industries | 1990 | 2000 | 2010 | 2018 | ||||
|---|---|---|---|---|---|---|---|---|
| Moran’s I | p | Moran’s I | p | Moran’s I | p | Moran’s I | p | |
| Wholesale and retail trade | 0.000 | 0.865 | −0.032 | 0.785 | −0.025 | 0.858 | 0.044 | 0.401 |
| Transport, storage, and postal services | 0.075 | 0.210 | 0.016 | 0.675 | 0.050 | 0.368 | 0.088 | 0.159 |
| Real estate | 0.050 | 0.382 | −0.100 | 0.224 | −0.046 | 0.641 | 0.008 | 0.770 |
| Construction | 0.131 | 0.045 | 0.252 | 0.000 | 0.214 | 0.002 | 0.201 | 0.003 |
| Manufacturing | 0.128 | 0.050 | 0.083 | 0.184 | −0.091 | 0.272 | −0.074 | 0.389 |
| Leasing and commercial services | 0.052 | 0.352 | 0.143 | 0.030 | 0.138 | 0.036 | 0.175 | 0.007 |
| Finance | 0.043 | 0.418 | 0.069 | 0.252 | 0.142 | 0.029 | 0.072 | 0.235 |
| Information transfer, software, and information technology services | −0.047 | 0.585 | 0.055 | 0.317 | 0.110 | 0.065 | 0.189 | 0.004 |
| Scientific research and polytechnic services | 0.077 | 0.206 | 0.197 | 0.003 | 0.142 | 0.027 | 0.227 | 0.001 |
© 2019 by the authors. Licensee MDPI, Basel, Switzerland. This article is an open access article distributed under the terms and conditions of the Creative Commons Attribution (CC BY) license (http://creativecommons.org/licenses/by/4.0/).
Share and Cite
Hu, S.; Song, W.; Li, C.; Zhang, C.H. The Evolution of Industrial Agglomerations and Specialization in the Yangtze River Delta from 1990–2018: An Analysis Based on Firm-Level Big Data. Sustainability 2019, 11, 5811. https://doi.org/10.3390/su11205811
Hu S, Song W, Li C, Zhang CH. The Evolution of Industrial Agglomerations and Specialization in the Yangtze River Delta from 1990–2018: An Analysis Based on Firm-Level Big Data. Sustainability. 2019; 11(20):5811. https://doi.org/10.3390/su11205811
Chicago/Turabian StyleHu, Shuju, Wei Song, Chenggu Li, and Charlie H. Zhang. 2019. "The Evolution of Industrial Agglomerations and Specialization in the Yangtze River Delta from 1990–2018: An Analysis Based on Firm-Level Big Data" Sustainability 11, no. 20: 5811. https://doi.org/10.3390/su11205811
APA StyleHu, S., Song, W., Li, C., & Zhang, C. H. (2019). The Evolution of Industrial Agglomerations and Specialization in the Yangtze River Delta from 1990–2018: An Analysis Based on Firm-Level Big Data. Sustainability, 11(20), 5811. https://doi.org/10.3390/su11205811