The Influencing Factors of a Polycentric Employment System on Jobs-Housing Matching—A Case Study of Hangzhou, China


Abstract
1. Introduction
2. Research Data, Approach and Methodology
2.1. Research Site
2.2. Research Data
2.2.1. Cellphone Signaling Data
2.2.2. Economic Census Data
2.2.3. Urban Land-Use Datasets
2.3. Research Methodology
2.3.1. Identifying Commuting Population
2.3.2. Identifying Employment Centers
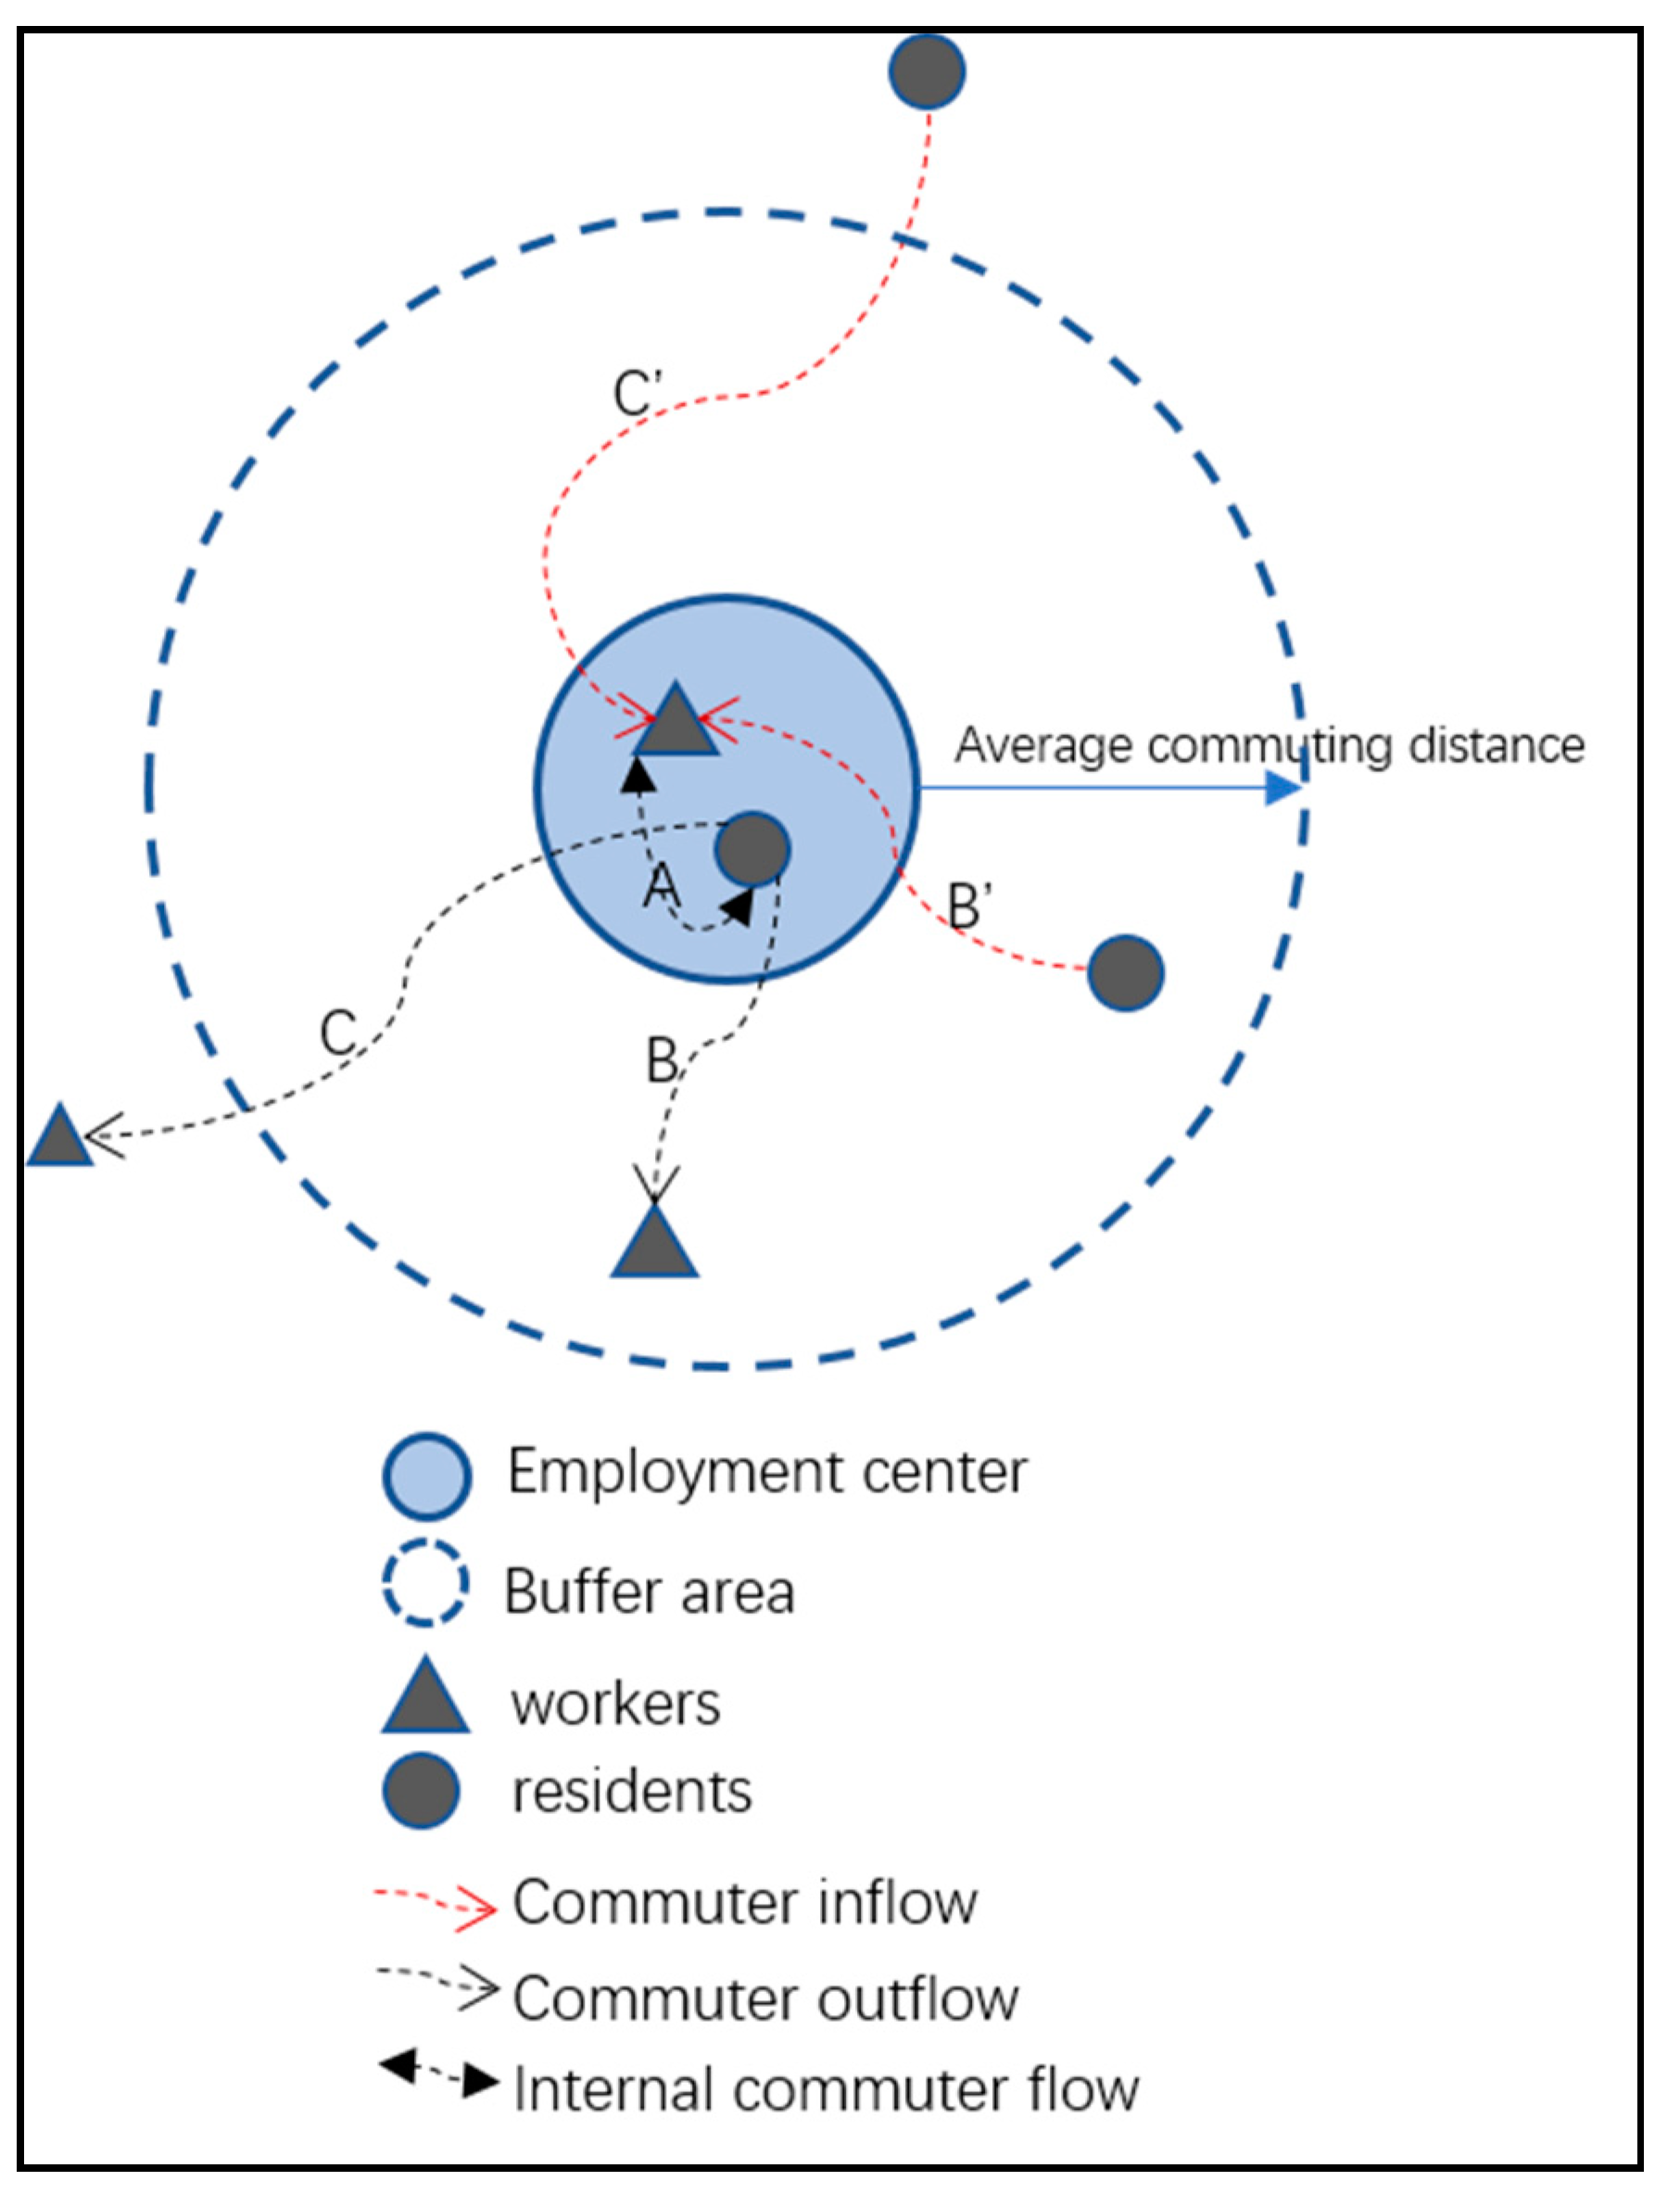
2.3.3. Methodology to Measure Jobs-Housing Matching
3. Results
3.1. Employment Center and Jobs-Housing Matching Characteristics
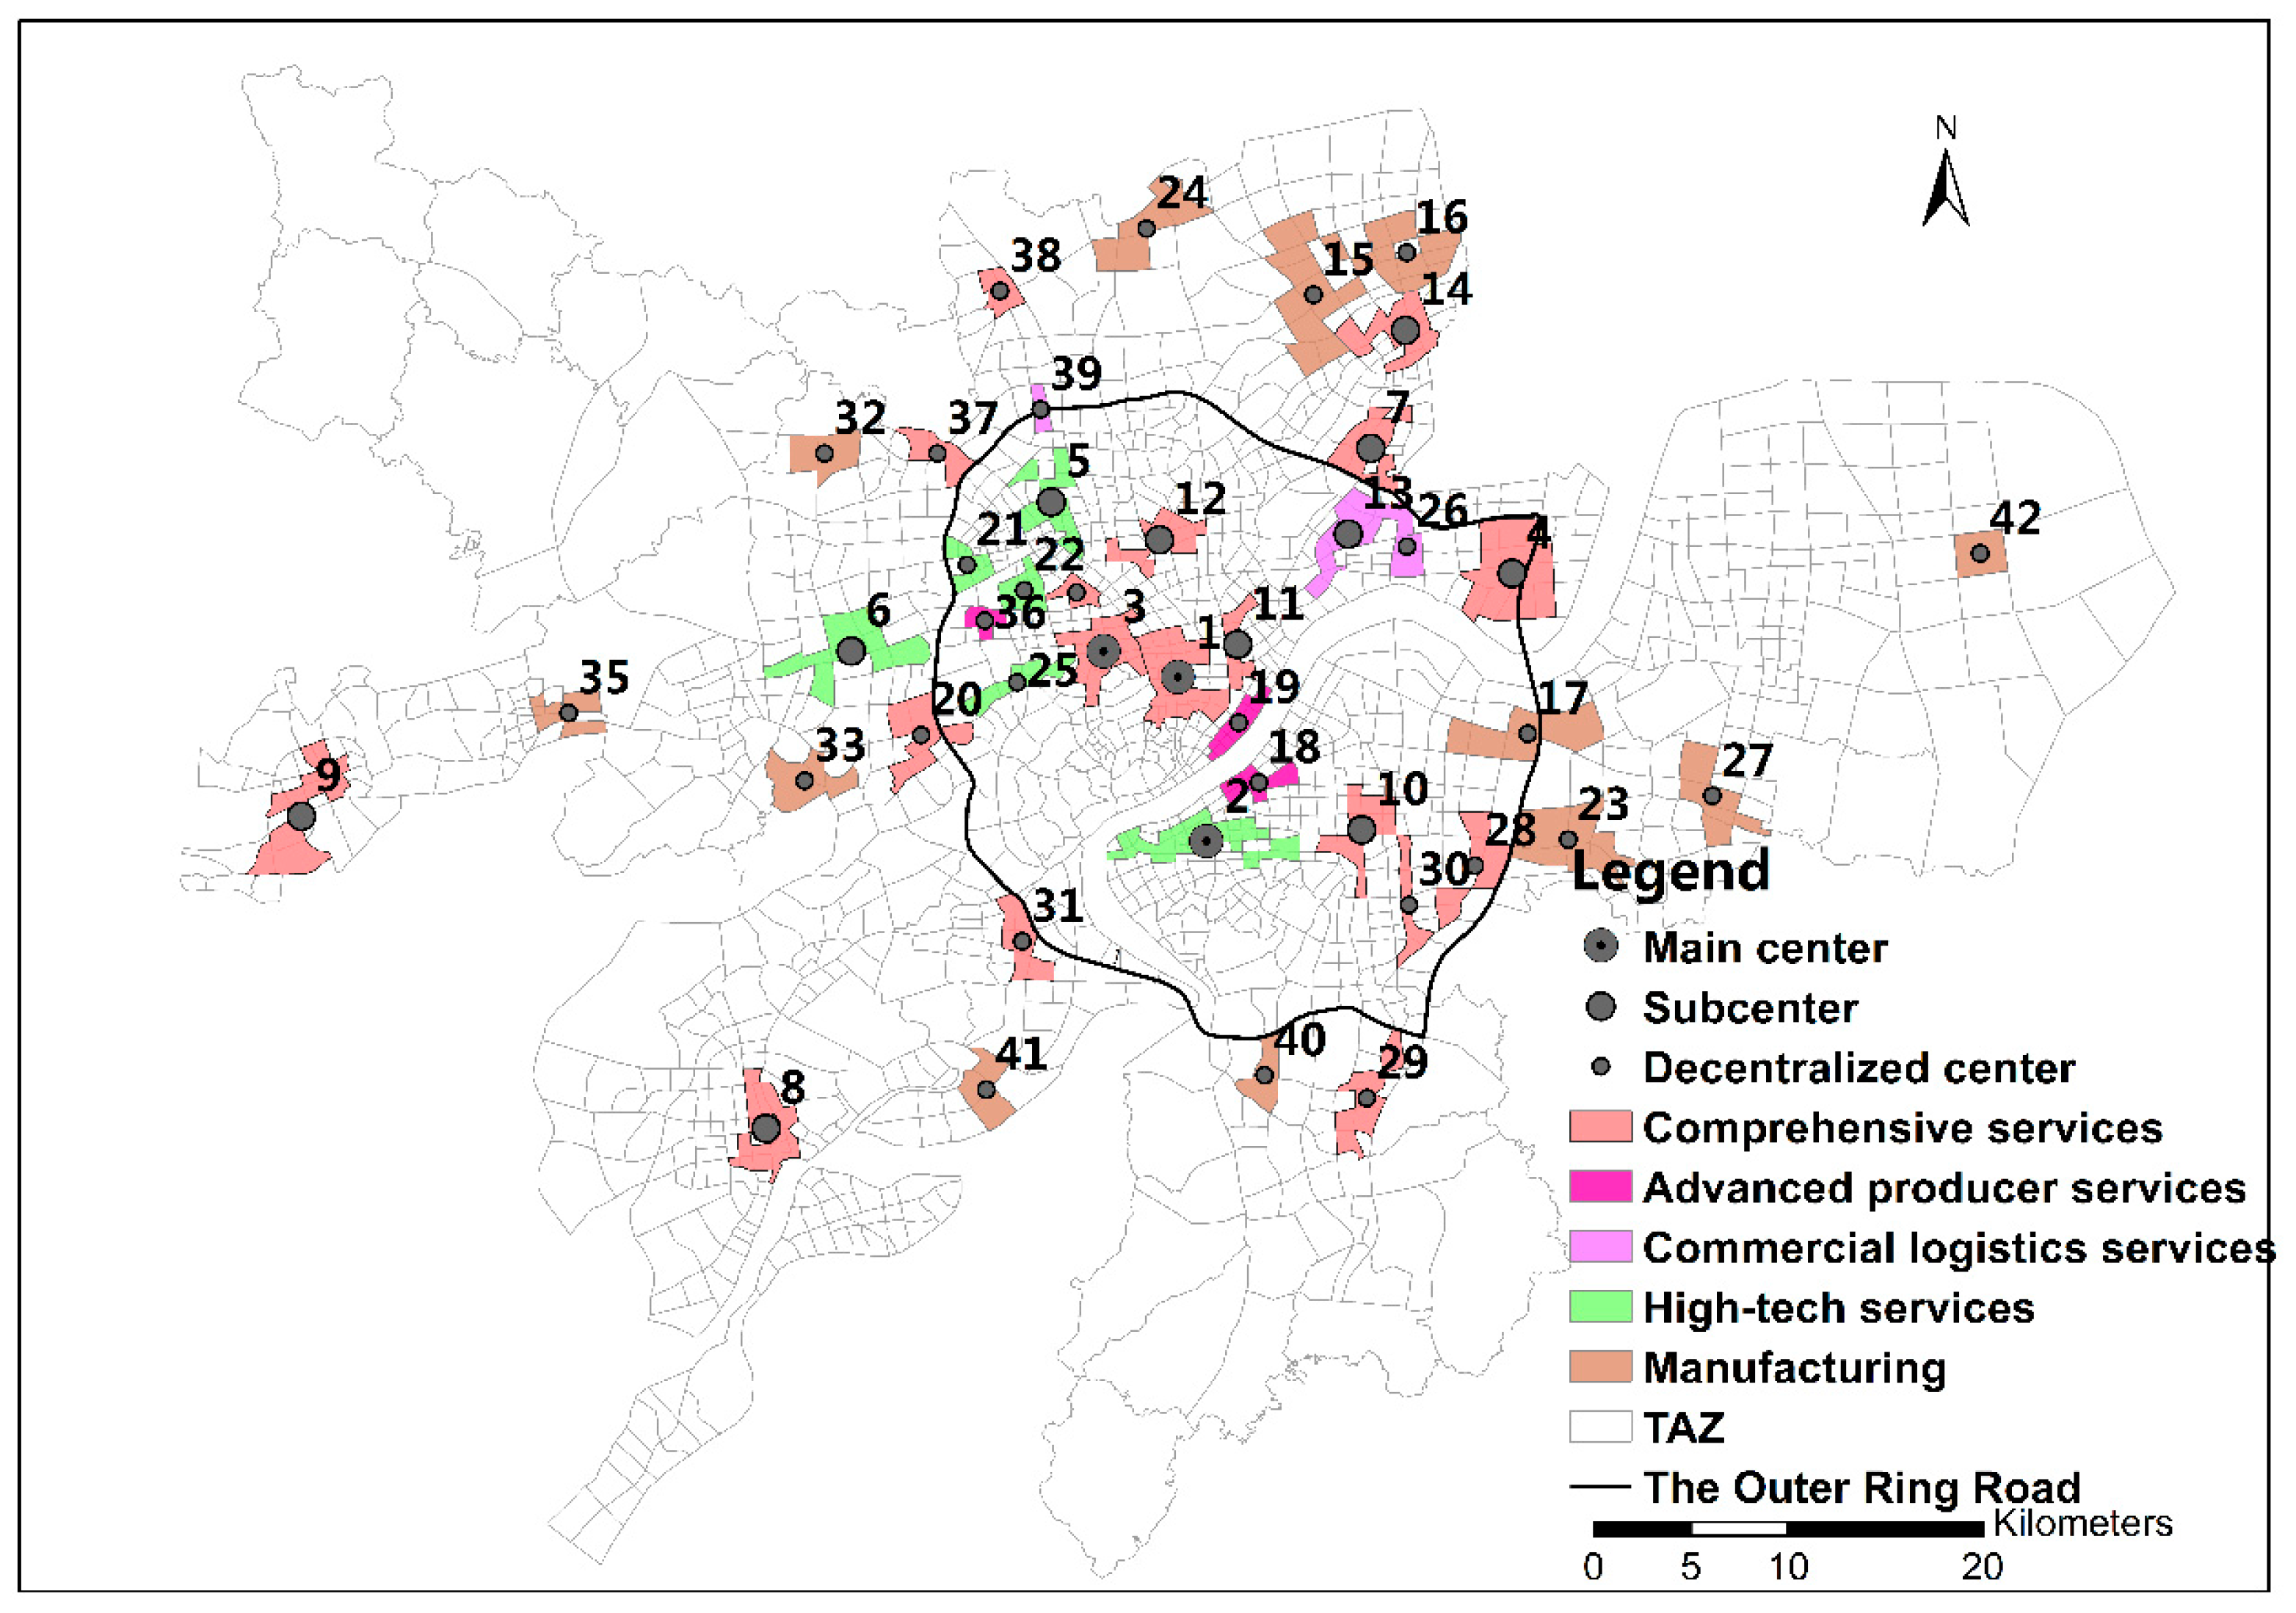
3.1.1. Employment Center Identification and Characteristics
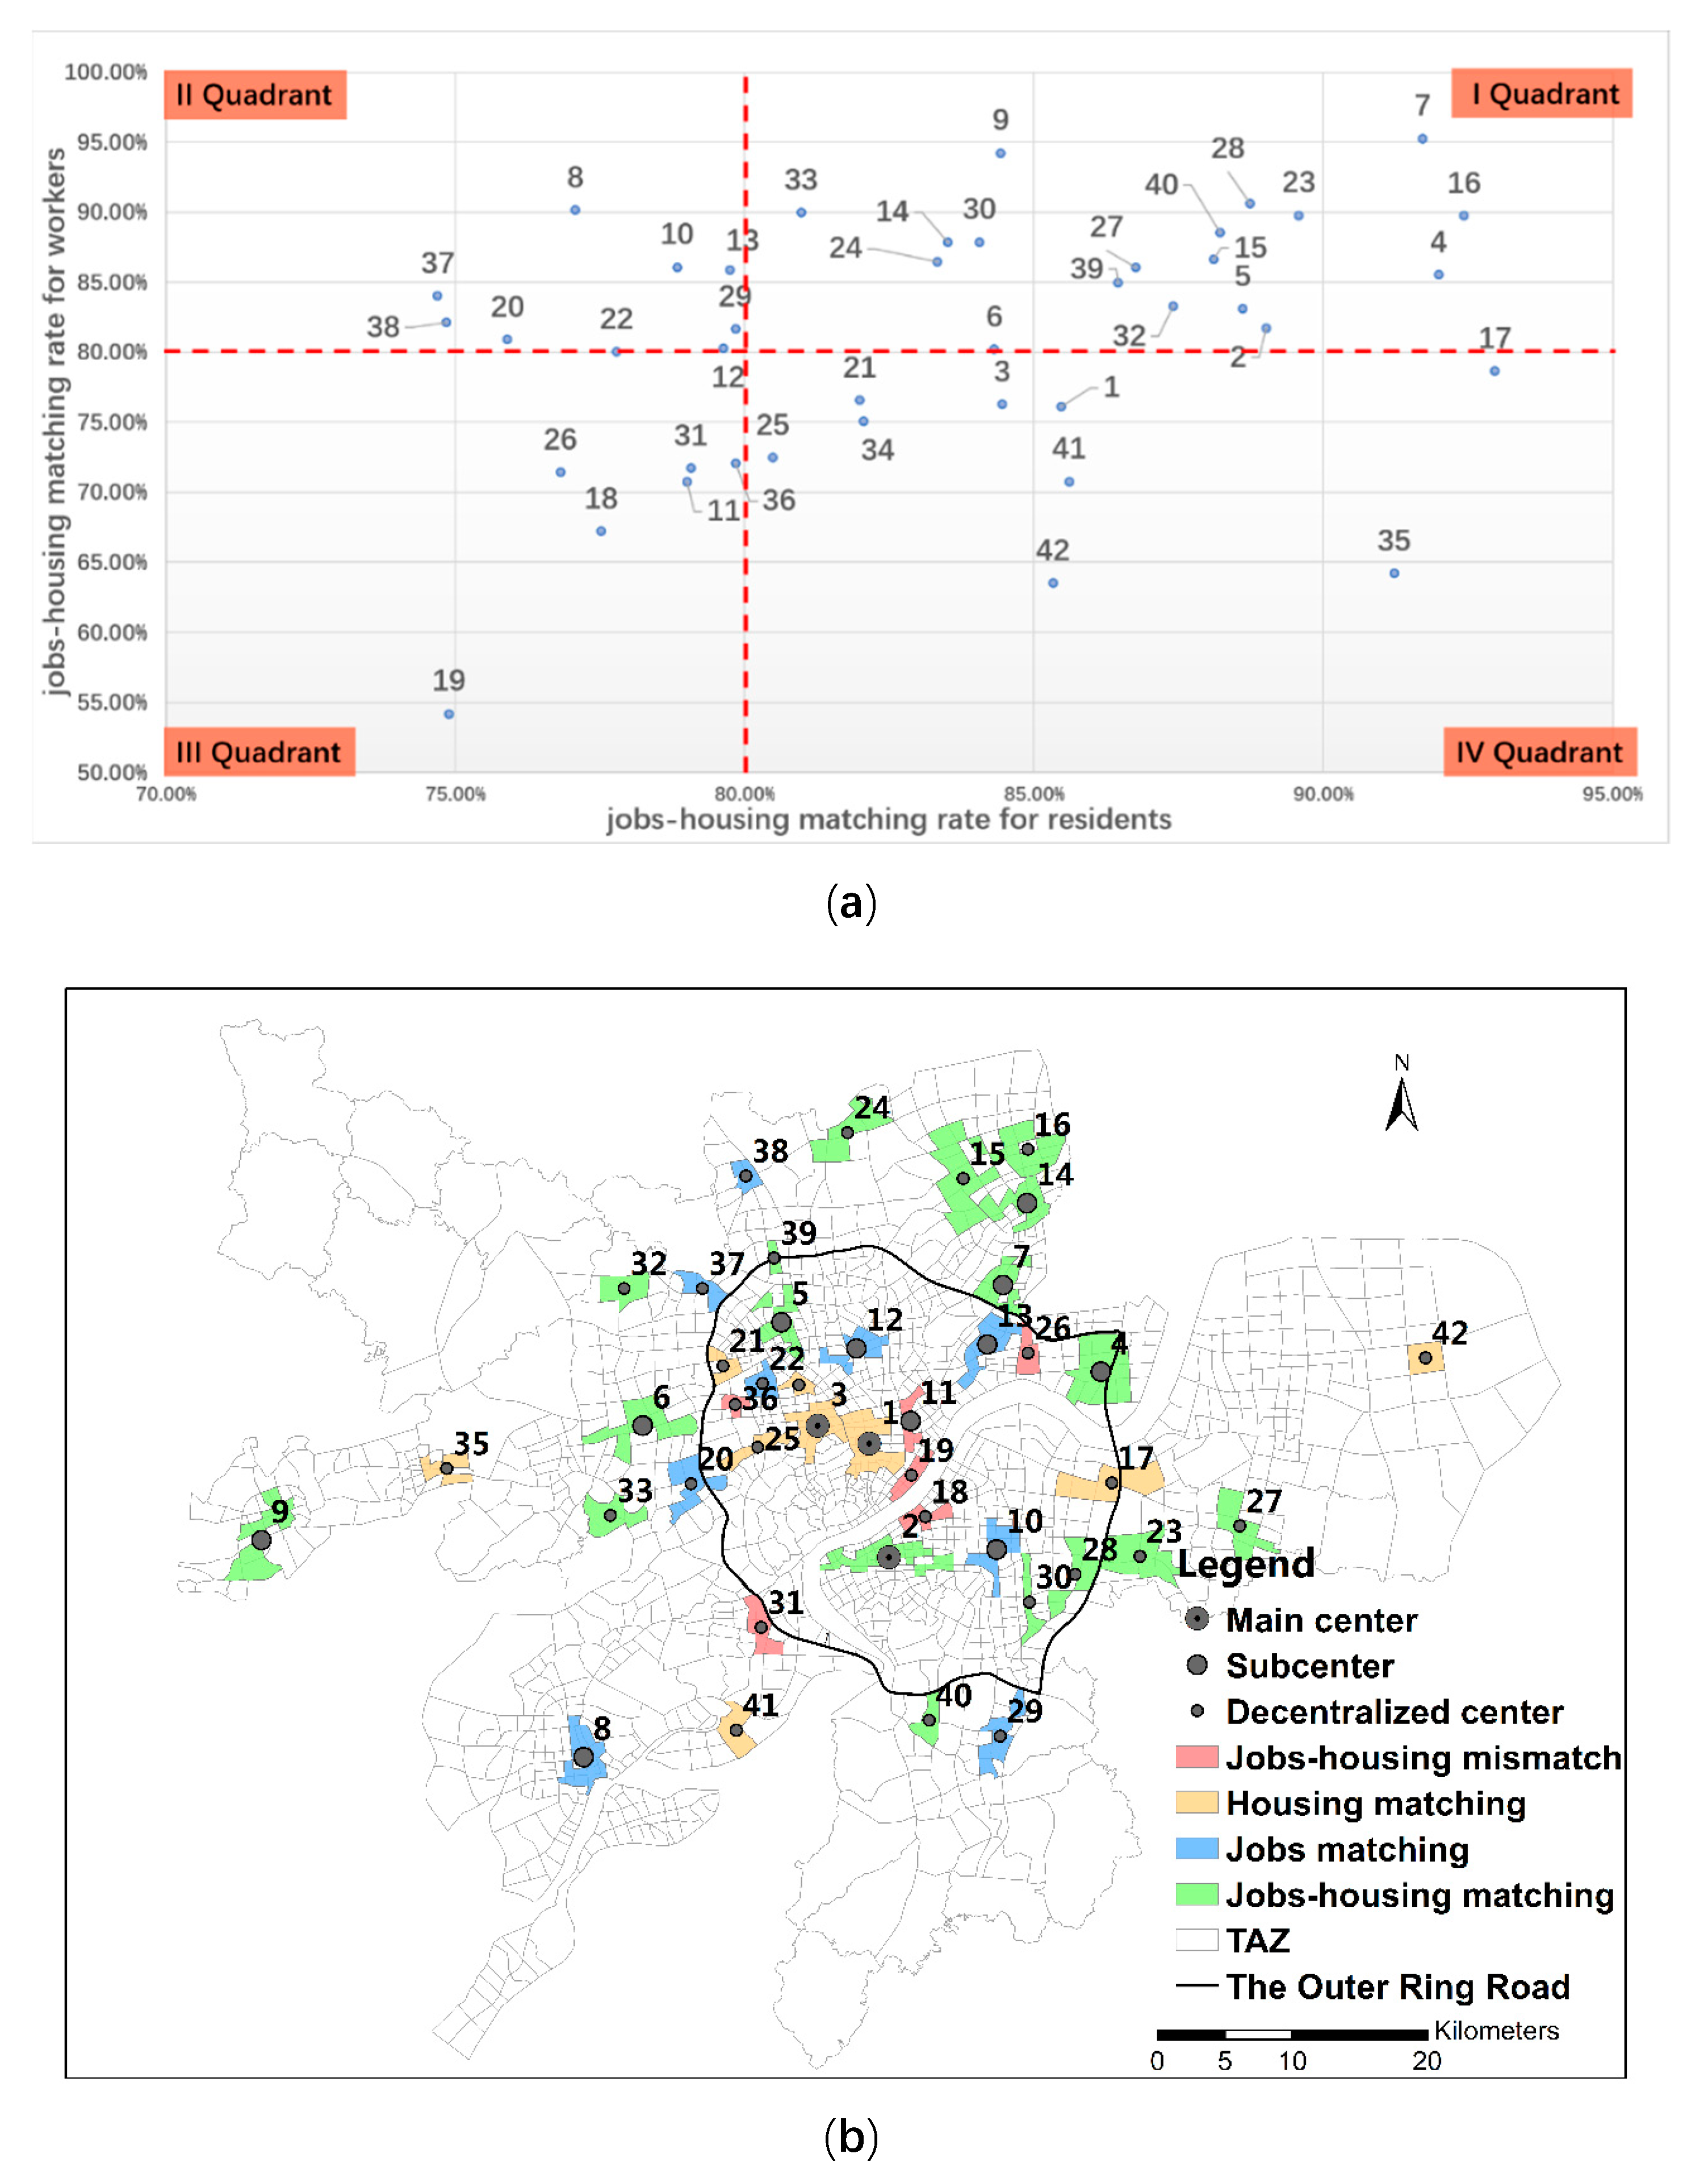
3.1.2. Jobs-Housing Matching Features of Employment Centers
3.2. The Spatial and Industrial Influencing Factors on Employment Centers’ Jobs-Housing Matching
3.2.1. Correlation Analysis: The Relationship between Jobs-Housing Matching Rate and Spatial and Industrial Factors
3.2.2. Regression Analysis: Determinant Factors on Jobs-Housing Matching Rate in Employment Centers
4. Conclusions
Author Contributions
Funding
Acknowledgments
Conflicts of Interest
Appendix A

| Employment Centers | Industrial LQ(Greater than 1) |
|---|---|
| Main center | |
| 1 CBD | advanced producer services (LQ:2.22), public services (LQ:1.6), commercial logistics (LQ:1.53), high-tech services (LQ:1.01) |
| 2 Binjiang high-tech | high-tech services (LQ:3.75), manufacturing (LQ:1.15) |
| 3 Huanglong | high-tech services (LQ:2.61), advanced producer services (LQ:1.81), public services (LQ:1.47), commercial logistics (LQ:1.24) |
| Sub-center | |
| 4 Xiasha | manufacturing (LQ:1.52), public services (LQ:1.37) |
| 5 Liangzhu high-tech | high-tech services (LQ:1.5), commercial logistics (LQ:1.4), manufacturing (LQ:1.06) |
| 6 Future Tech-City(FTC) | high-tech services (LQ:5.90) |
| 7 Qiaosi | manufacturing (LQ:1.73), public services (LQ:1.39) |
| 8 Fuyang | life services (LQ:2.08), public services (LQ:1.8), advanced producer services (LQ:1.04) |
| 9 Linan | public services (LQ:2.08), life services (LQ:1.6) |
| 10 Jiangnan | commercial logistics (LQ:1.54), public services (LQ:1.18) |
| 11 East Railway Station(ERS) | life services (LQ:2.45), commercial logistics (LQ:2.25), public services (LQ:1.23) |
| 12 Xintiandi | commercial logistics (LQ:1.98), public services (LQ:1.38), life services (LQ:1.12), high-tech services (LQ:1.11) |
| 13 Jiubao | commercial logistics (LQ:1.48), manufacturing (LQ:1.21), high-tech services (LQ:1.14) |
| 14 Linping | public services (LQ:2.52), advanced producer services (LQ:1.86) |
| Decentralized center | |
| 15 Qianjiang economic development zone(EDZ) | Manufacturing (LQ:1.92) |
| 16 Yuhang EDZ | Manufacturing (LQ:2.06) |
| 17 Xiaoshan EDZ | Manufacturing (LQ:2.35) |
| 18 Binjiang | advanced producer services (LQ:2.49), high-tech services (LQ:1.50), commercial logistics (LQ:1.66) |
| 19 Qianjiang new town(NT) | advanced producer services (LQ:2.63), commercial logistics (LQ:1.75), public services (LQ:1.12) |
| 20 Zhejiang technology university(ZTU) | manufacturing (LQ:1.19), high-tech services (LQ:1.08), public services (LQ:1.06), advanced producer services (LQ:1.01) |
| 21 Western soft park(WSP) | high-tech services (LQ:2.48), manufacturing (LQ:1.30) |
| 22 Zhejiang university(ZU) | high-tech services (LQ:2.54), advanced producer services (LQ:2.05), commercial logistics (1.75) |
| 23 Yaqian | manufacturing (LQ:2.11) |
| 24 Tangqi | manufacturing (LQ:1.82) |
| 25 Xixi science and technology park(STP) | high-tech services (LQ:4.66), life services (LQ:2.45), advanced producer services (LQ:1.58) |
| 26 Jiuqiao | commercial logistics (LQ:2.75), advanced producer services (LQ:1.33) |
| 27 Guali | manufacturing (LQ:1.99) |
| 28 Xinjie technology and industry park(TIP) | manufacturing (LQ:1.86), life services (LQ:1.12) |
| 29 Linpu | manufacturing (LQ:1.74), life services (LQ:1.62) |
| 30 South railway station(SRS) | life services (LQ:3.97), commercial logistics (LQ:1.54) |
| 31 Zhuantang | public services (LQ:1.87), life services (LQ:1.68), high-tech services (LQ:1.44) |
| 32 Pinyao | manufacturing (LQ:2.12) |
| 33 Xianlin | manufacturing (LQ:1.99) |
| 34 Dayuecheng | commercial logistics (LQ:2.20), high-tech services (LQ:1.58), life services (LQ:1.21), advanced producer services (LQ:1.05) |
| 35 Qinshanhu STP | manufacturing (LQ:2.48) |
| 36 Jiangcun | advanced producer services (LQ:2.23), high-tech services (LQ:1.41), public services(LQ:1.21) |
| 37 Liangzhu | manufacturing (LQ:1.64), life services (LQ:1.20) |
| 38 Renhe | public services (LQ:1.79), manufacturing (LQ:1.40), life services (LQ:.03), advanced producer services (LQ:1.03) |
| 39 Liangzhu market | commercial logistics (LQ:2.82), advanced producer services (LQ:1.56) |
| 40 Yiqiao | manufacturing (LQ:2.14) |
| 41 Dongzhou | manufacturing (LQ:2.45) |
| 42 Linjiang | manufacturing (LQ:1.75) |
References
- Giuliano, G.; Redfearn, C.; Agarwal, A.; Li, C.; Zhuang, D. Employment concentrations in Los Angeles, 1980–2000. Environ. Plan. A 2007, 39, 2935–2957. [Google Scholar] [CrossRef]
- Forstall, R.L.; Greene, R.P. Defining job concentrations: The Los Angeles case. Urban Geogr. 1997, 18, 705–739. [Google Scholar] [CrossRef]
- Giuliano, G.; Small, K.A. Subcenters in the Los Angeles region. Reg. Sci. Urban Econ. 1991, 21, 163–182. [Google Scholar] [CrossRef]
- Gordon, P.; Richardson, H.W. Employment decentralization in US metropolitan areas: Is Los Angeles an outlier or the norm? Environ. Plan. A 1996, 28, 1727–1743. [Google Scholar] [CrossRef]
- Cervero, R.; Wu, K.L. Polycentrism, commuting, and residential location in the San Francisco bay area. Environ. Plan. A 1997, 29, 865–886. [Google Scholar] [CrossRef]
- McDonald, J.F.; Pather, P.J. Suburban employment centres: The case of Chicago. Urban Stud. 1994, 31, 201–218. [Google Scholar] [CrossRef]
- Sultana, S. Some effects of employment centers on commuting times in the Atlanta metropolitan area. Southeast. Geogr. 2000, 40, 225–233. [Google Scholar] [CrossRef]
- Shearmur, R.; Coffey, W.; Dube, C.; Barbonne, R. Intrametropolitan employment structure: Polycentricity, scatteration, dispersal and chaos in Toronto, Montreal and Vancouver, 1996–2001. Urban Stud. 2007, 44, 1713–1738. [Google Scholar] [CrossRef]
- Schwanen, T.; Dieleman, F.M.; Dijst, M. Car use in Netherlands daily urban systems: Does polycentrism result in lower commute times? Urban Geogr. 2003, 24, 410–430. [Google Scholar] [CrossRef]
- Veneri, P. Urban polycentricity and the costs of commuting: Evidence from Italian metropolitan areas. Growth Chang. 2010, 41, 403–429. [Google Scholar] [CrossRef]
- Aguilera, A. Growth in commuting distances in French Polycentric Metropolitan Areas: Paris, Lyon and Marseille. Urban Stud. 2005, 42, 1537–1547. [Google Scholar] [CrossRef]
- Alpkokin, P.; Cheung, C.; Black, J.; Hayashi, Y. Dynamics of clustered employment growth and its impacts on commuting patterns in rapidly developing cities. Transp. Res. Part A Policy Pr. 2008, 42, 427–444. [Google Scholar] [CrossRef]
- Parolin, B. Employment centres and the journey to work in Sydney: 1981–2001. In Proceedings of the 2nd State of Australian Cities Conference, Brisbane, Australia, 30 November–2 December 2005; pp. 1–15. [Google Scholar]
- Zhao, P.; Lu, B.; Roo, G.D. The impact of urban growth on commuting patterns in a restructuring city: Evidence from Beijing. Pap. Reg. Sci. 2011, 90, 735–754. [Google Scholar] [CrossRef]
- McMillen, D.P. Employment densities, dpatial autocorrelation, and subcenters in large metropolitan areas. J. Reg. Sci. 2004, 44, 225–244. [Google Scholar] [CrossRef]
- Rauhut, D. Polycentricity—one concept or many? Eur. Plan. Stud. 2017, 25, 332–348. [Google Scholar] [CrossRef]
- Cervero, R. Jobs-housing balancing and regional mobility. J. Am. Plan. Assoc. 1989, 55, 136–150. [Google Scholar] [CrossRef]
- Gordon, P.; Richardson, H.W.; Jun, M.J. The commuting paradox evidence from the top twenty. J. Am. Plan. Assoc. 1991, 57, 416–420. [Google Scholar] [CrossRef]
- Sultana, S.; Weber, J. Journey-to-work patterns in the age of sprawl: Evidence from two midsize southern metropolitan areas. Prof. Geogr. 2007, 59, 193–208. [Google Scholar] [CrossRef]
- Wang, F.H. Modeling commuting patterns in Chicago, in a GIS environment: A job accessibility perspective. Prof. Geogr. 2000, 52, 120–133. [Google Scholar] [CrossRef]
- Ewing, R.; Cervero, R. Travel and the built environment: A meta-analysis. J. Am. Plan. Assoc. 2010, 76, 265–294. [Google Scholar] [CrossRef]
- Yang, J.; French, S.; Holt, J.; Zhang, X. Measuring the structure of U.S. metropolitan areas, 1970–2000 spatial statistical metrics and an application to commuting behavior. J. Am. Plan. Assoc. 2012, 78, 197–209. [Google Scholar] [CrossRef]
- Travisi, C.M.; Camagni, R. Sustainability of urban sprawl: Environmental-economic indicators for the analysis of mobility impact in Italy. SSRN Electron. J. 2015. [Google Scholar] [CrossRef]
- Crane, R.; Chatman, D.G. Traffic and sprawl: Evidence from U.S. commuting, 1985 to 1997. Plan. Mark. 2003, 6, 14–22. [Google Scholar]
- Lee, S.; Seo, J.G.; Webster, C. The decentralising metropolis: Economic diversity and commuting in the US suburbs. Urban Stud. 2006, 43, 2525–2549. [Google Scholar] [CrossRef]
- Hu, L.; Giuliano, G. Beyond the inner city new form of spatial mismatch. Transp. Res. Rec. 2011, 2242, 98–105. [Google Scholar] [CrossRef]
- Schwanen, T.; Dieleman, F.M.; Dijst, M. Travel behavior in Dutch monocentric and polycentric urban systems. J. Transp. Geogr. 2001, 9, 173–186. [Google Scholar] [CrossRef]
- Zhao, P.; Lu, B.; Roo, G.D. Impact of the jobs–housing balance on urban commuting in Beijing in the transformation era. J. Transp. Geogr. 2011, 19, 59–69. [Google Scholar] [CrossRef]
- Hu, L.; Sun, T.; Wang, L. Evolving urban spatial structure and commuting patterns: A case study of Beijing, China. Transp. Res. Part D Transp. Environ. 2018, 59, 11–22. [Google Scholar] [CrossRef]
- Wang, D.; Chai, Y. The jobs–housing relationship and commuting in Beijing, China: The legacy of Danwei. J. Transp. Geogr. 2009, 17, 30–38. [Google Scholar] [CrossRef]
- Lin, D.; Allan, A.; Cui, J. Sub-centres, socio-economic characteristics and commuting: A case study and its implications. Int. J. Urban Sci. 2017, 21, 147–171. [Google Scholar] [CrossRef]
- Zhou, J.X.; Yeh, A.G.; Li, W.; Yue, Y. A commuting spectrum analysis of the jobs–housing balance and self-containment of employment with mobile phone location big data. Environ. Plan. B Urban Anal. City Sci. 2018, 45, 434–451. [Google Scholar] [CrossRef]
- Muñiz, I.; Garcia-López, M.A.; Galindo, A. The effect of employment subcenters on population density in Barcelona. Urban Stud. 2008, 45, 627–649. [Google Scholar] [CrossRef]
- Ewing, R. Best Development Practices: Doing the Right Thing and Making Money at the Same Time; American Planning Association: Chicago, IL, USA, 1996. [Google Scholar]
- Peng, Z.R. The jobs-housing balance and urban commuting. Urban Stud. 1997, 34, 1215–1235. [Google Scholar] [CrossRef]
- Anas, A.; Arnott, R.; Small, K.A. Urban spatial structure. J. Econ. Lit. 1998, 36, 1426–1464. [Google Scholar]
- Coffey, W.J.; Shearmur, R.G. Agglomeration and dispersion of high-order service employment in the Montreal metropolitan region, 1981–96. Urban Stud. 2002, 39, 359–378. [Google Scholar] [CrossRef]


| Employment Center Classification | Residents’ Average Jobs-Housing Matching Rate | Workers’ Average Jobs-Housing Matching Rate | |
|---|---|---|---|
| Level | Main center Sub-center Decentralized center | 86.31% 83.45% 83.15% | 78.04% 84.50% 79.48% |
| Function | Comprehensive services Advanced producer services Commercial logistics services High-tech services Manufacturing | 81.39% 77.42% 81.01% 83.70% 87.66% | 82.42% 64.51% 80.75% 79.02% 81.47% |
| Location | Inside the Outer Ring Road Outside the Outer Ring Road | 82.70% 84.13% | 77.60% 83.27% |
| Variable Name | Variable Expression | Variable Description |
|---|---|---|
| The size of employment centers | Area of employment center(km2) | |
| Resident population density | Residential population identified by cellphone/employment center area (person/km2) | |
| Employment population density | Employment population identified by cellphone/employment center area (person/km2) | |
| Employment to resident ratio | E/R | Employment population/residential population |
| Land use mix | ENT= , represents 4 types of land-use in the employment center buffer zone, including resident, public administration and public service, commercial service and industry. represents the area proportion of land-use type . | |
| Distance from CBD | The logarithm of the distance between the employment center and the CBD | |
| Subway accessibility | Area within 1km of subway station/employment center buffer zone area | |
| Freeway intersection accessibility | Distance from the employment center to the nearest freeway intersection (m) | |
| Large natural barriers | Distance between employment center and large natural barriers (m) | |
| Industry agglomeration index | LQ of advanced producer services | |
| LQ of high-tech services | ||
| LQ of public services | ||
| LQ of life services | ||
| LQ of commercial logistics | ||
| LQ of manufacturing | ||
| Industrial diversification index | EI =, represents the employment proportion of 6 types of industry in employment center | |
| HHI = , represents the employment population of industry j in center I, represents the total employment population of 6 types of industry in center i. | ||
| Industrial specialization index | Spei | Spei ==, is the j industrial location entropy of I center, j includes 15 industries divided from 6 main industry categories |
| Variables | Pearson Correlation Coefficients | |
|---|---|---|
| Workers’ Jobs-Housing Matching Rate (p Value) | Residents’ Jobs-Housing Matching Rate (p Value) | |
| (0.004) | (0.000) | |
| 0.189 (0.229) | −204 (0.194) | |
| (0.045) | −178 (0.261) | |
| E/R | (0.000) | 0.095 (0.549) |
| 0.105 (0.508) | −213 (0.175) | |
| (0.004) | (0.020) | |
| (0.044) | −0.223 (0.157) | |
| −117 (0.460) | −105 (0.506) | |
| (0.046) | (0.007) | |
| (0.003) | (0.000) | |
| −218 (0.166) | −127 (0.423) | |
| −149 (0.345) | (0.028) | |
| −058 (0.716) | (0.020) | |
| (0.062) | (0.008) | |
| (0.028) | (0.000) | |
| −026 (0.871) | (0.000) | |
| −048 (0.763) | (0.000) | |
| Spei | (0.000) | (0.019) |
| N | 42 | 42 |
| Variables | Model 1 | Model 2 | Model 3 | |||
|---|---|---|---|---|---|---|
| B (p Value) | Beta | B (p Value) | Beta | B (p Value) | Beta | |
| Constant | (0.000) | (0.000) | (0.000) | |||
(0.009) | 0.327 | (0.015) | 0.286 | |||
| E/R | (0.000) | −0.498 | (0.001) | −0.421 | ||
(0.022) | −0.277 | |||||
| Spei | (0.000) | −0.537 | (0.002) | −0.379 | ||
| Ajusted R2 | 0.472 | 0.271 | 0.533 | |||
| Sample size | 42 | 42 | 42 | |||
| Variables | Model 4 | Model 5 | Model 6 | |||
|---|---|---|---|---|---|---|
| B (p Value) | Beta | B (p Value) | Beta | B (p Value) | Beta | |
| Constant | (0.000) | (0.000) | (0.000) | |||
(0.000) | 0.536 | (0.000) | 0.455 | |||
(0.000) | 0.452 | (0.012) | 0.302 | |||
(0.000) | -0.575 | (0.002) | -0.390 | |||
| Spei | ||||||
| Ajusted R2 | 0.440 | 0.314 | 0.558 | |||
| Sample size | 42 | 42 | 42 | |||
© 2019 by the authors. Licensee MDPI, Basel, Switzerland. This article is an open access article distributed under the terms and conditions of the Creative Commons Attribution (CC BY) license (http://creativecommons.org/licenses/by/4.0/).
Share and Cite
Zhu, J.; Niu, X.; Shi, C. The Influencing Factors of a Polycentric Employment System on Jobs-Housing Matching—A Case Study of Hangzhou, China. Sustainability 2019, 11, 5752. https://doi.org/10.3390/su11205752
Zhu J, Niu X, Shi C. The Influencing Factors of a Polycentric Employment System on Jobs-Housing Matching—A Case Study of Hangzhou, China. Sustainability. 2019; 11(20):5752. https://doi.org/10.3390/su11205752
Chicago/Turabian StyleZhu, Juan, Xinyi Niu, and Cheng Shi. 2019. "The Influencing Factors of a Polycentric Employment System on Jobs-Housing Matching—A Case Study of Hangzhou, China" Sustainability 11, no. 20: 5752. https://doi.org/10.3390/su11205752
APA StyleZhu, J., Niu, X., & Shi, C. (2019). The Influencing Factors of a Polycentric Employment System on Jobs-Housing Matching—A Case Study of Hangzhou, China. Sustainability, 11(20), 5752. https://doi.org/10.3390/su11205752