Article

The Effect of Lean Manufacturing on a Supply Chain Relationship and Performance

by
Assadej Vanichchinchai
Faculty of Engineering, Mahidol University, Nakhon Pathom 73170, Thailand
Sustainability 2019, 11(20), 5751; https://doi.org/10.3390/su11205751
Submission received: 10 July 2019 / Revised: 19 August 2019 / Accepted: 25 September 2019 / Published: 17 October 2019
(This article belongs to the Section Economic and Business Aspects of Sustainability)

Abstract

:
This study aims to explore the impact of lean manufacturing (LM) or transaction-based supply chain management (SCM) on a supply chain relationship (SCR) and supply performance (SP) in manufacturing industries in Thailand. The measurement instruments for LM, SCR, and SP were developed from comprehensive literature reviews, verified by experts, and statistical techniques to assure reliability and validity. The hypothesized model was tested with path analysis of structural equation modeling. It was found that the set of LM, SCR, and SP frameworks were reliable and valid for Thai manufacturing industries. LM had not only a direct effect on the SCR and SP but also an indirect effect on the SP through the SCR. The SCR also had a direct impact on the SP. This paper presents insights into the debate concerning the impact of transaction-based SCM on relationship-based SCM and SP.

1. Introduction

Just-in-time (JIT) production was created by Toyota Motor Corporation [1,2]. Generally, the term JIT can be used interchangeably with the Toyota production system (TPS) and lean manufacturing (LM) [2,3,4]. Similar to the supply chain management (SCM), LM emphasizes on time delivery to the right location at a minimum cost by eliminating waste, especially unnecessary inventories [5,6]. Thus, LM can be determined as the SCM at an operational level [7,8,9,10,11] or transaction-based SCM, focusing on information and material flows especially in the automotive industry [12,13]. A wider scope of the SCM at the strategic level is more relationship-based which emphasizes partnership development with all stakeholders to gain synergy from stronger collaboration [14]. Efficient uses of resources through LM along the whole supply chain can lead to long-term sustainability (i.e., economic, environmental, and social dimensions) [15,16,17,18,19].
Conceptually, LM needs sincere relationships or trust between major stakeholders, namely main suppliers and customers. However, in practice, there are always conflicts of interest among partners in a supply chain. The real relationship is often adversarial rather than collaborative. Slone [20] recommended that real collaboration with trade partners is rare in practice. Accordingly, Hu [21] and Wilson [22] reported that research in LM implementation in smaller companies is scarce because of lower bargaining power. Daugherty [23] extensively reviewed logistics and the SCM relationship in the literature and found that although several studies report a successful relationship, many close relationships have failed. Jayaram [24], Mentzer [25], and Tan [7] also suggested that the SCM, which focuses on transactions at the operational level to reduce cost, can negatively affect relationships among partners. More studies have been interested in practical implications between transaction and relationship in the supply chain, such as [23,26,27,28]. Moreover, Vanichchinchai [29] found that SCM in Thailand as a developing country still focuses on transaction cost reduction more than partnership development. This is different from the SCM in more developed countries such as the US, which gives more importance to partnership development [30].
There may be synergy or conflict between transactional focus at the operational level and relationships at the strategic level. Shub and Stonebraker [31] simply proposed a theoretical framework to contrast traditional transaction-based SCM with emerging relationship-based SCM in human resource and organizational contexts. Many studies emphasize merely individual aspects of operational LM. Research in the linkage between LM and the supply relationship, and their effect on supply performance is still scarce [32,33,34]. There is also little literature about lean supply chain management (LSCM) and merely suggests a positive relationship between LSCM and supply chain performance without empirical results [35,36,37,38]. Therefore, the purpose of this research is to study the effect of LM on the supply chain relationship (SCR) and supply performance (SP) of manufacturing industries in Thailand as an example of a developing country.

2. Literature Review

2.1. LM, SCM, and LSCM

The SCM originated in the area of logistics or physical transactions at the operational level [39,40]. Since then it has evolved to emphasize partnerships with external business partners at the strategic level [12]. Consequently, flows of information and material as well as relationship among business partners are included in most SCM definitions and frameworks. For instance, Talib [41] extensively reviewed SCM literature and identified six major SCM practices from 40 practices. They are: Re-engineering material flows/lean practices, employing information and communication technologies, customer relationship, strategic supplier partnership, close partnership with suppliers, and changing corporate culture. The first two practices are related to information and material transactions while the next three are concerned with relationships with all elements driven by the sixth corporate cultures. Thus, the SCM includes transaction-based or relationship-based elements. Intangible relationship-based SCM focuses on partnerships among business stakeholders at the strategic level to gain synergy from collaboration, while transaction-based ones emphasizes tangible material flows to achieve lower cost and delivery performance at the operational level [12,13]. Although practices at both levels are still relevant, Flynn [14] reported that most SCM research focuses simply on supplier or customer integration, but neglects the role of internal operations integration.
The lean production system was introduced by Krafcik [42] and then popularized by Womack [43] in “The Machine that Changed the World” book. The five principles of lean thinking for implementation in enterprises are (1) specify value, (2) identify the value stream, (3) avoid interruptions in value flow, (4) let customers pull value, and (5) start pursuing perfection again [44]. LM aims to totally eliminate wastes leading to cleaner production. Hines [45] commented that LM evolved from the application of operational practices on the shop floor and further extended to supply chains across many organizations. Due to increasing business competition for shorter lead times and lower costs, LM should be extended to include external partners to identify and reduce wastes in not only internal but also external processes [46,47]. Accordingly, Shah [48] recommended that LM is an integrated socio-technical system aiming to eliminate waste by reducing internal and external variability along the supply network. Consequently, LM should shift from a business-oriented mentality that focuses on short-term profit, strong negotiation with trade partners, and high dependence on market prices to long-term partnerships with supply chain members that continuously eliminate waste along the supply chain [49,50]. To minimize waste in the supply chain, Hajmohammad [51,52] explored the effect of a lean and supply management on environmental practices and environmental performance. Martinez-Jurado [53] also reviewed the research into the links between lean management, SCM, and sustainability. Some studies applied LM into SCM and reported improved organizational performance [54]. LSCM application can improve profit from collaboration rather than bargaining power over business partners [55].

2.2. Transaction and Relationship

Lamming [56] proposed specific characteristics for the LSCM theory: Relationship assessment and cost transparency. However, LSCM tends to be less adopted than LM because of difficulties in implementation. An executive’s awareness of its contribution to LM into SCM is still limited [32,57]. Similarly, Perez [37] reported the main barriers of LSCM implementation: Current trading strategies based on senior management commitment and support, difficulty for value stream team formation, fluctuating auction prices, and existing adversarial, power-based relationships with customers and suppliers.
Relationships can be vary by context, such as the type of business, nationality of firms, nationality of customers, nationality of suppliers, position in supply chain, or firm’s size [27,58,59]. Some researchers also distinguish between transactional and collaborative relationships [26,60,61,62]. Basically, they advise that relationships should be continuously developed from transactional to collaborative exchanges because all kinds of relationships need a set of practices in order to develop from discrete transactions to collaborative exchange behavior. The magnitude of those practices defines the effect and type of relationship [26,63]. Bowersox [64] suggested that a partnership requires certain practices at the operational level, such as ground rules, role specification, information sharing, selective matching, and exit provisions. Golicic [65] commented that the development of dependence, commitment, and trust are needed to a strengthen relationship too. However, each type of relationship needs a different amount of investment and also gives different returns [23].
According to transaction cost theory, Jayaram [24] found a trade-off between the transaction cost and relationship in the automotive supply chain. They commented that too much emphasis on cost and opportunistic behavior at the operational level can impede development from arms’ length to the strategic relationship. Mentzer [25] also found that the barriers to relationships are inadequate information and communication, cost, time, and partner betrayals. Similarly, Tan [7] commented that in some cases, hostility between suppliers can help the firms become more profitable in the long run. Accordingly, Daugherty [23] reviewed the literature extensively and found that many business relationship management programs fail. Rinehart [66] advised that an investment in relationship development for cost reduction, quality, and delivery improvement at the operational level may not give worthy benefits. Masson [28] had studied partnerships in the garment industry and found that the relationship among garment retailers and intermediate merchandisers are collaborative, while those among intermediate merchandisers and small garment manufacturers are adversarial. As a result, Chen [26] suggested further research on the effects of relationship practices on customer or supplier preferences for transactional or relational exchanges. Therefore, the following hypotheses were established to investigate these linkages.
Hypothesis 1 (H1).
LM has a significant positive direct effect on SCR.
Hypothesis 2 (H2).
LM has a significant positive direct effect on SP.
Hypothesis 3 (H3).
SCR has a significant positive direct effect on SP.
Hypothesis 4 (H4).
LM has a significant positive indirect effect on SP through SCR.

3. Methodology

3.1. Survey Instrument

LM can be determined from many perspectives, e.g., a philosophy, a way of thinking, a concept, a set of tools and techniques, a set of principles, a process, an approach, a practice, a system, a program, a manufacturing paradigm, or a model [67]. Researchers proposed many LM models that overlap. Shah [48] categorized LM into four dimensions: Just in time, total productive maintenance, total quality management, and human resource management. Herzog [68] proposed LM elements that include value concepts and customers, value stream mapping, waste elimination, pull/kanban and flow, just in time, productive maintenance, employee involvement, and development of excellent suppliers. Zahraee [69] found that processes and equipment, planning and control, human resources, supplier relationships, and customer relations are significant practices for LM. Shrafat [70] recommended a LM framework for developing countries comprised of housekeeping 5s, single minute exchange of dies, total preventive maintenance, supplier just-in-time, pull production, continuous flow, and statistical process control. In this research, LM measures proposed by [5,11,71,72] were applied to frame the LM, construct consisting of purchasing and distribution, production, facility, and quality.
The literature suggested that the supply chain should comprise at least three key stakeholders: An organization, its customers, and suppliers [73]. Both customers and suppliers must perceive that they gain benefits from the relationship. Thus, the organization should have the same perception and give importance on both sides of the relationship to receive mutual benefits [74]. Many studies distinguish relationships by degree of integration into transactional and collaborative relationships [26,62]. Therefore, this research grouped relationships by position in the supply chain into supplier relationships and customer relationships. Both consist of different degrees of integration: Coordination or operational relationships (e.g., information sharing) and stronger collaboration or partnering relationships (e.g., resource sharing). The work of [11,26,75] was utilized to frame the SCR construct, comprising customer coordination, customer collaboration, supplier coordination, and supplier collaboration.
To avoid linguistic differences between English and Thai translations as well as technical vocabulary, back translation was conducted by translating the English questionnaire into Thai and back into English. All developed measurement instruments were reviewed by three Thai academic experts and three Thai industrial experts in these areas to improve content validity and ensure their applicability for Thai manufacturing industries. Consequently, the LM construct comprises four sub-constructs, namely production (4 items), purchasing and distribution (4 items), facility (5 items), and quality (4 items). The SCR measure consists of supplier collaboration (5 items), supplier coordination (5 items), customer collaboration (5 items), and customer coordination (5 items). The SP construct is composed of cost (4 items), flexibility (4 items), relationship (5 items), and responsiveness (5 items) and are shown in Appendix A. The questionnaire was also approved by the institutional review board for compliance with international guidelines for human research protection.
A pilot survey with 15 operations management executives in various industries were randomly selected from the database of the Federation of Thai Industries to ensure that there was clarity without difficulty in completing the questionnaire. Overall, there were no significant comments about content, clarity, or length of the survey instrument. A six-point Likert scale was used to validate the existence of LM, SCR, and SP in the firms.

3.2. Sample and Data Collection

The samples included goods manufacturers in Thailand regardless of type of product, business size, nationality of business owner, tier in supply chain, etc. Target respondents were executives in production and related departments, such as logistics, supply chain, purchasing, customer service, and marketing, who understand their businesses well. One respondent per company was requested in this survey. The questionnaire was prepared in a paper and an electronic form for distribution via mail, e-mail, or social networks. To enhance the response rate, methods such as personal requests by telephone and distribution support from professional organizations (such as the Federation of Thai Industries, Thailand Productivity Institute, Industrial Estate Authority of Thailand, Institute for small and Medium Enterprises Development, and Ministry of Industry) to their members and incentives for respondents were employed. All returned questionnaires were examined to identify missing data and questionnaires from non-eligible respondents (e.g., unrelated departments and businesses, below manager level). Some missing data was obtained by contacting respondents via e-mail or telephone. Other improper questionnaires were excluded from analysis. As a result, the total number of valid questionnaires was 516. Sample profiles are displayed in Table 1.
Profiles of 38 non-respondent firms were checked through company websites and by telephone. Then Chi-square test was employed to compare firm contexts between non-respondent and respondent firms as displayed in Table 2. No significant difference in every firm characteristic between non-respondent and respondent firms was found. Chi-square values of company ownership and company size were 4.965 and 1.792 for two degrees of freedom, respectively. All p-values were above 0.05 showing similarity between the respondent and the non-respondent samples.

3.3. Reliability and Validity Analysis

Primarily, skewness and kurtosis of variables were analyzed to ensure normality of the collected data. The variance influence factors (VIF) suggested no serious problem with multicollinearity. Item-total correlations and Cronbach’s alpha were used to explore the reliability or internal consistency of the measurement indicators in this study. Generally, the item-total correlation should exceed 0.3. A Cronbach’s alpha score above 0.7 is considered a good value. However, a score of 0.6 is still acceptable in empirical research [76,77]. To ensure reliability in structural equation modeling (SEM) utilizing AMOS 20, composite reliability and average variance extracted were employed to confirm reliability of all measurement models [78]. It was found that Cronbach’s alpha of every indicator and sub-construct exceeded 0.7 as shown in Table 3. Overall the item-total correlation of indicators was very high. Composite reliability of every sub-construct was well above 0.5. A total of 10 of 12 sub-constructs had an average variance extracted exceeded 0.5. Considering Cronbach’s alpha, item-total correlation, average variance extracted, and composite reliability together, the measurement models were sufficiently reliable.
The confirmatory factor analysis (CFA) with maximum likelihood estimation was utilized to examine the validity of the measurement frameworks. Each sub-construct was tested with first-order CFA so as to delete the items with weak loading coefficients, below 0.5. For LM sub-construct, item PUD4 under purchasing and distribution sub-construct was eliminated. For SCR and SP, all loading coefficients were well above 0.5 with a high t-value. To assess the overall goodness of fit of the individual sub-construct, the multiple goodness of fit indexes were applied. They were Chi-square divided by degree of freedom ( χ 2 / d f ), goodness-of-fit index (GFI), comparative fit index (CFI), non-normed fit index (NNFI), and standardized root mean squared residual (SRMR). Generally, χ 2 / d f should be less than 3 or even more than the liberal limit of 5.0. GFI, CFI, and NNFI should be at least 0.9 and SRMR should be less than 0.1 [76]. Every sub-construct of LM, SCR, and SP met the requirements of these multiple fit indexes. All p-values were well above 0.05.
To assure validity in SEM, all measurement frameworks were further assessed for discriminant, convergent, and nomological validity. A total of 10 of 12 models had average variance extracted value exceeding 0.50, confirming good convergent validity as shown in Table 3 [79]. Discriminant validity was tested by examining correlations between pairs of latent variables [80]. All correlation coefficients were much less than 1.0 meaning the sub-constructs were distinct. Consequently, discriminant validity could be assumed. In addition to the GFI, CFI, and NNFI which had been measured and confirmed, adjusted goodness of fit index (AGFI), incremental fit index (IFI), and root mean square error of approximation (RMSEA) were added to ensure nomological validity as shown in Table 3 [81]. They also confirmed that the measurement frameworks were acceptable for nomological validity. Based on the overall results, these measurement frameworks were fit and valid.
The second-order CFA or higher-order CFA was also examined so as to confirm that these sub-constructs are sub-constructs of broader and more encompassing constructs i.e., LM, SCR, and SP. From the examination, there was the existence of the second-order constructs of LM, SCR, and SP. The LM, SCR, and SP constructs were composed of the proposed sub-constructs and indicators according to their supportive theories. No indicator of any sub-constructs was dropped due to a weak loading coefficient. In every second-order construct, the loading coefficient between the second factors and their sub-constructs were well above 0.5, except production. All t-values were higher than the critical value at 1.960 for significant level of 0.05 as shown in Table 4. The overall fit of every second-order construct was good as shown in Table 5. The χ 2 / d f were well below 3 with all p-values above 0.05. All GFI, CFI, and NNFI were higher than 0.9, while all SRMR were lower than 0.1. This showed that the second-order factors, which have no manifest indictor, caused the first-order factors. They are perfectly unobservable and latent [76].

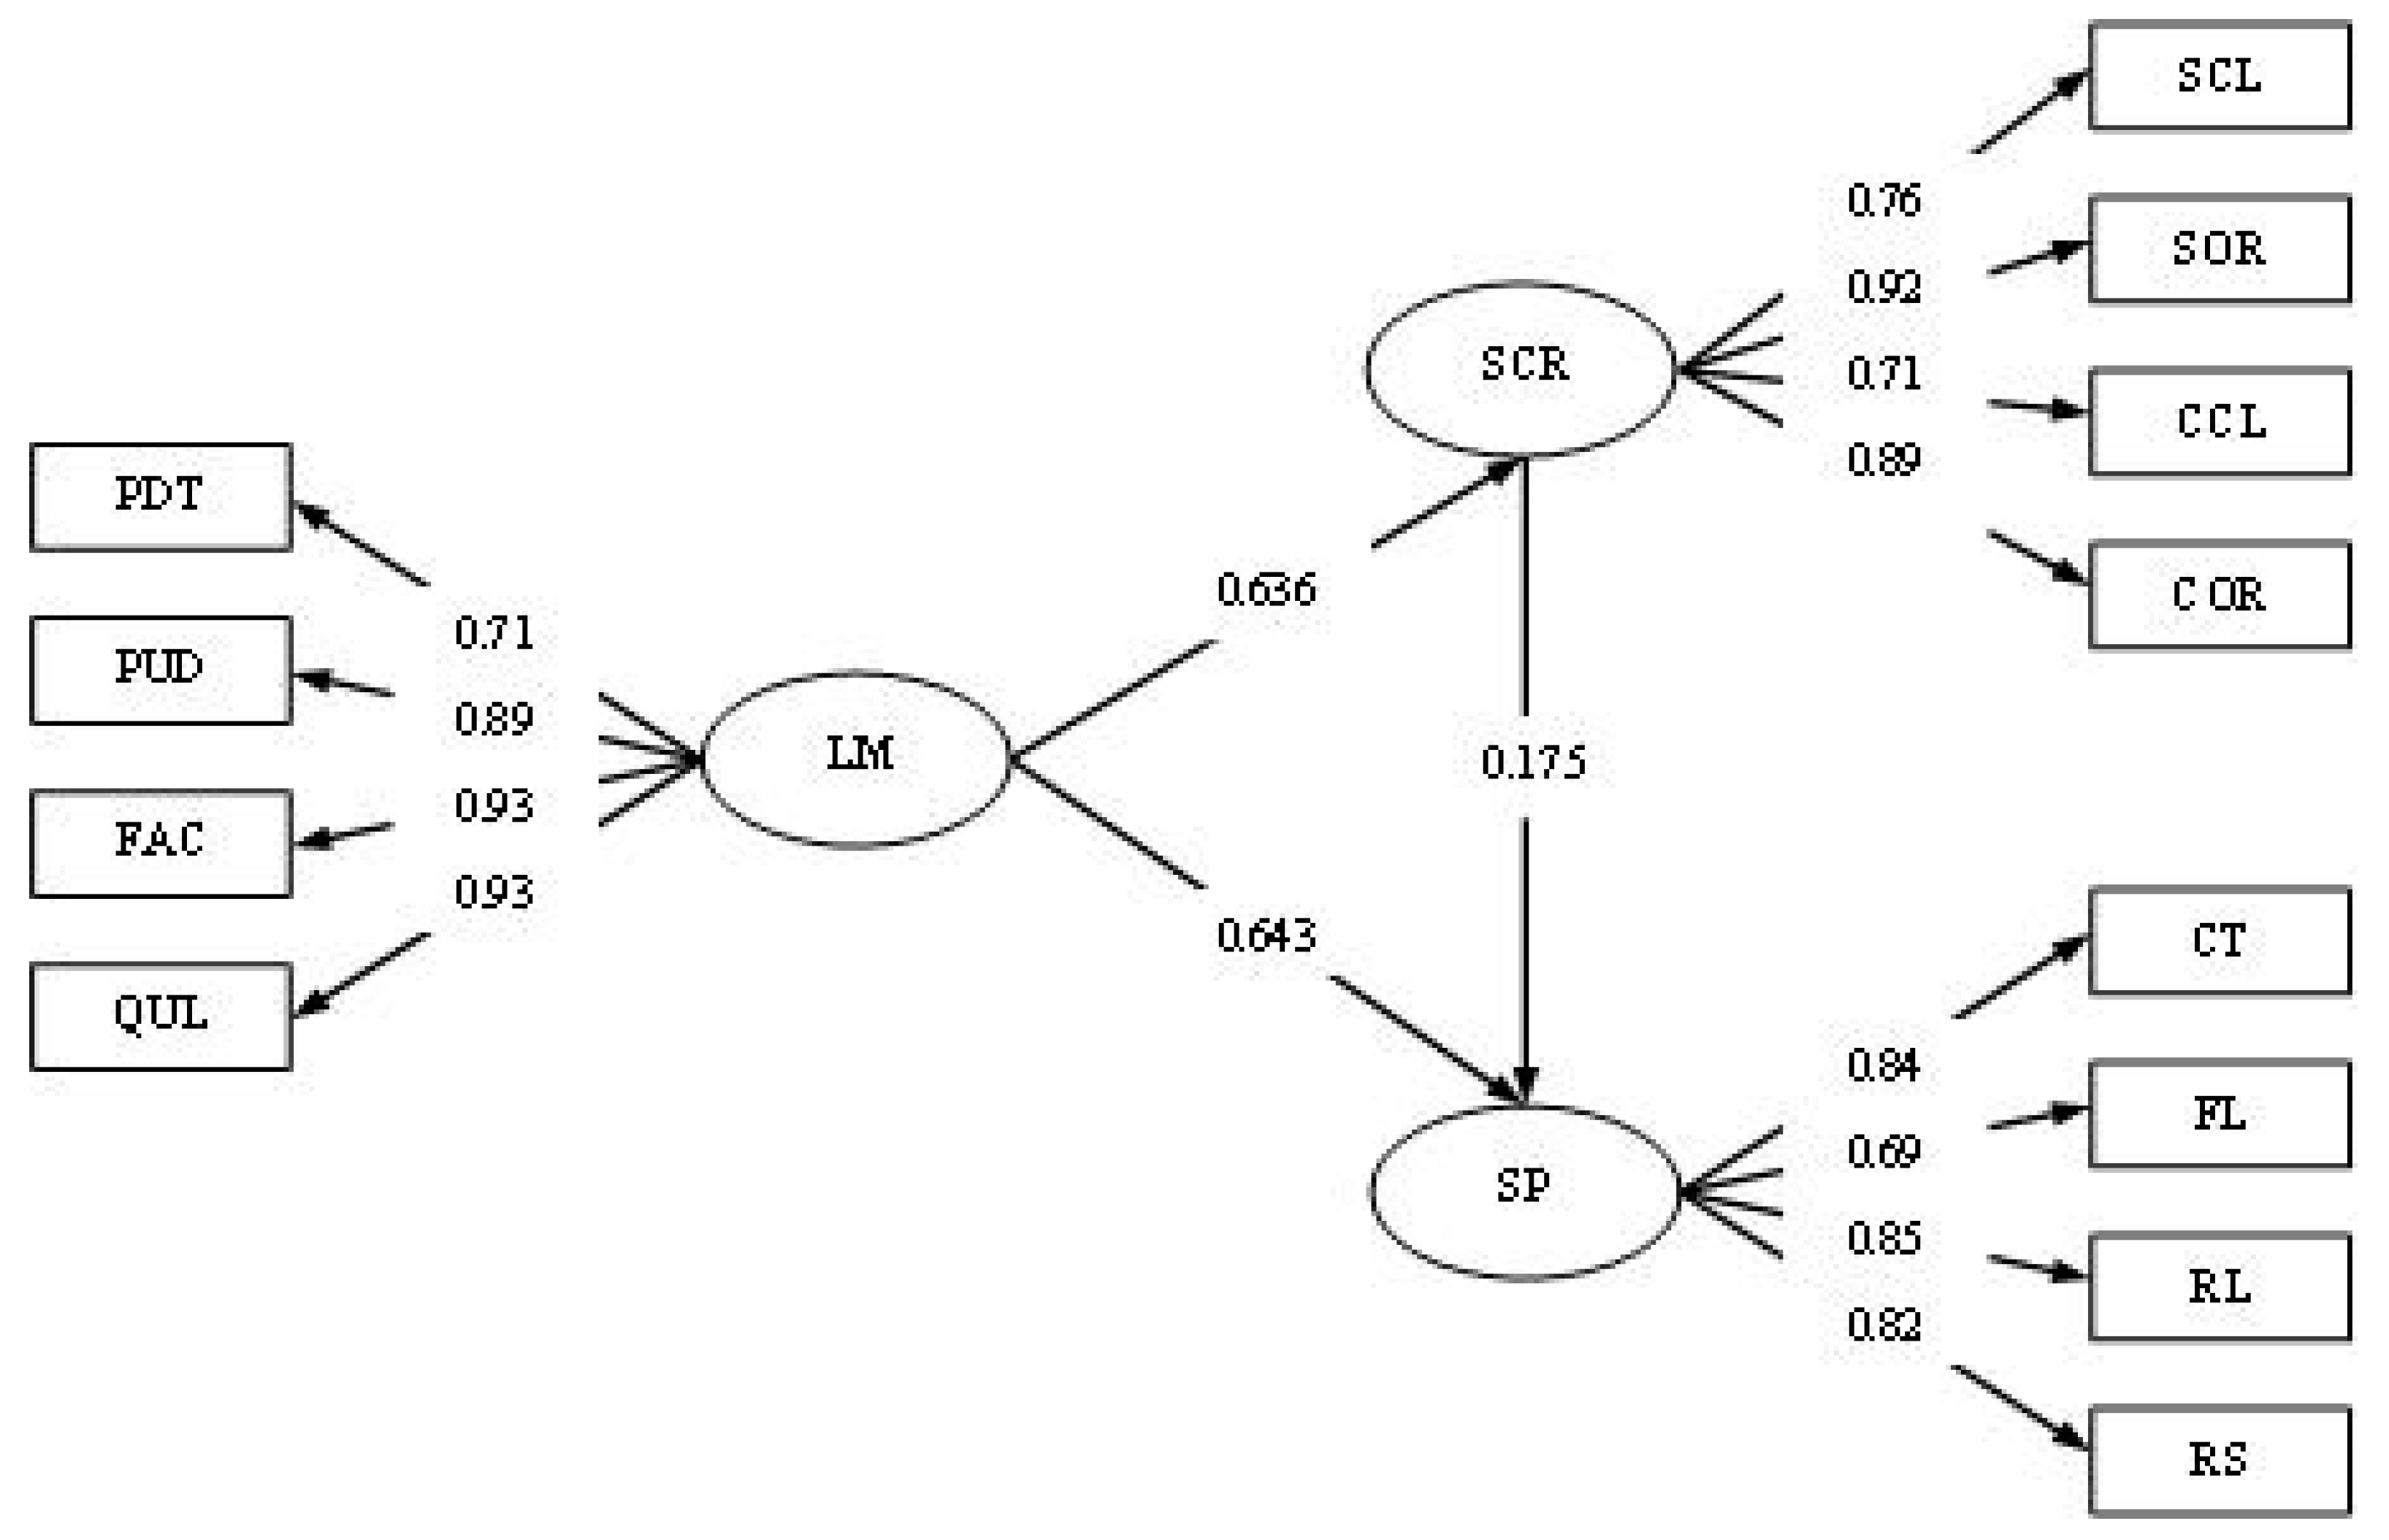
4. Path Analysis and Discussion

The hypothesized structural framework of this research was shown in Figure 1. The analytical results showed that χ 2 / d f = 1.285 was well below 3 with p-value 0.130. CFI = 0.998, GFI = 0.987, NNFI = 0.995, and NFI = 0.990 were above the suggested value at 0.900 and SRMR = 0.0288 was much lower than the cut-off value at 0.1. These multiple fit indexes confirmed a good fit of the conceptual framework with the collected data.
For all paths, all t-values were well above the critical value at 1.96 and significant at a 0.05 level. Therefore, all four hypotheses were supported. The direct effect, indirect effect, and total effect of each path are displayed in Table 6.
LM had a strong relationship with the SCR as shown by the high standardized estimate 0.636 and t-value 4.517. Thus, H1 which is “LM has a significant positive direct effect on SCR” was supported. This is because more cooperative transaction exchanges helped develop collaborative relationship. Accordingly, many researchers distinguished between transactional and collaborative relationships [26,60,61,62]. Fundamentally, they suggested that relationships should be developed continuously from transactional to collaborative exchanges, since relationships require a set of practices to develop from discrete transactions to collaborative exchange behavior. The magnitude of those practices defines the effect and type of a relationship [26,63]. Bowersox [64] recommended that a partnership requires transactional practices. Mentzer [25] found that the barriers of a relationship are inadequate transactions, such as information and communication. Kannan and Tan [5] also reported that total quality management, SCM, and JIT reinforce one another. Therefore, LM emphasizing on transaction exchanges at the operational level helps develop relationships in the supply chain. Three executives from large automotive, electronics, and food companies were interviewed for more information. They revealed that the direct objectives of introducing LM into their companies were to improve operational performance such as cost, flexibility, and responsiveness. LM leads to efficient transactions and communications with suppliers and customers through more efficient deliveries of raw materials from suppliers and finished goods to customers for lower inventories and wastes. In addition, they have worked together with suppliers and customers on improvement projects to continuously eliminate wastes in accordance with LM principles. Therefore, they feel that relationships with suppliers and customers have been better through more transactions, communications, and cooperation in LM activities.
H2 which is “LM has a significant positive direct effect on SP” was supported. The standardized estimate of their relationship was 0.643 with t-value 4.559. This is not surprising because LM emphasizes on time delivery to the right location at a minimum cost by eliminating waste, especially unnecessary inventories [5,6] and can be determined as the SCM at the operational level [7,8,9,10]. Scannell [10] also reported that JIT purchasing affected flexibility, production cost, and conformity to specifications. Thus, it confirmed that LM can improve SP. As mentioned earlier, all informants from case companies indicated that the main purpose of their LM implementations are to reduce cost and enhance customer satisfaction through faster and more flexible responsiveness. All of them agree that such performance was improved after LM application.
H3: “SCR has a significant positive direct effect on SP” was supported. The standardized estimate of their relationship was 0.175 with t-value 4.091. Similarly, Groves [82] revealed that firms emphasizing partnering relationships performed better than those that maintained adversarial or semi-adversarial relationships. Droge [83] confirmed that collaboration has a positive impact on financial performance. Corsten [84] also reported that collaboration can improve innovative capability and financial performance. Although H3 was supported, the standardized estimate was not as strong as that of the other paths. This is because in practice there are still some conflicts of interest among partners in the supply chain. Accordingly, Gueimonde-Canto [27] found that cooperation with suppliers does not support a firm’s productivity. As a result, they suggested that collaboration is not advantageous in some situations. Slone [20] recommended that real collaboration with trade partners is rare in practice. Masson [28] had also studied partnerships in the garment industry and found that relationships among garment retailers and intermediate merchandisers are collaborative, while those among intermediate merchandisers and small garment manufacturers are adversarial. Daugherty [23] extensively reviewed SCM relationship literature and advised that although many studies report successful relationships, many close relationships have failed. In addition, Tan [7] advised that in some cases, hostility with suppliers can help the organizations have more profit in the long run. Vanichchinchai [29] investigated relationships in the Thai automotive supply chain and then commented that relationship management in low SCM maturity environments in developing countries was mainly based on conventional adversarial buyer-supplier relationships, focusing on price more than long-term partnerships. Consequently, the link between relationships and a firm’s supply performance in different contexts should be further researched and confirmed.
Besides the direct relationships, H4 which is “LM has a significant positive indirect effect on SP through SCR” was supported. The standardized estimate of indirect effect between LM and SP through SCR was 0.111. The total effect between LM and SP was 0.755. This illustrated that there was a causal link among LM and the SP through the SCR. LM led to a better SCR which caused a higher SP, respectively. The mediating effect of the SCR on the relationship between LM and the SP was confirmed in accordance with suggestions of [35,36,37,38,54]. LSCM can enhance profit from the collaboration rather than bargaining power over trade stakeholders [55]. However, such a mediating effect was not strong. This is because LM or transaction-based SCM that focuses too much on cost affect relationships and performance, respectively. In addition to the literature supporting H1 and H3, Jayaram [24] found a trade-off between transaction cost and relationship in the automotive supply chain. They advised that too much emphasis on opportunistic behavior and cost impedes development from arms’ length to strategic relationship. Mentzer [25], Jayaram [24], and Tan [7] suggested that the SCM that emphasizes transactions at the operational level to reduce costs can negatively affect relationships among partners. Rinehart [66] also advised that investment in partnership development for cost reduction, quality, and delivery improvement at the operational level may not give a worthy benefit. LM in the supply chain tends to be less adopted than internal LM within an organization due to the complicated implementation and executives’ awareness of its contribution being limited [32,57]. Hu [21] and Wilson [22] also found that LM implementation in smaller companies is rare because of the lower bargaining power. Therefore, the impact of the integrative LM and SCR implementation into LSCM on performance especially in developing countries should be further explored.

5. Conclusions

The findings of this study empirically presented insights into the debate related to the effect of transaction-based SCM as represented by LM on relationship-based SCM practices and on the SP in manufacturing industries in Thailand. It was found that LM facilitated the SCR and directly improved the SP. LM indirectly improved the SP through the SCR. Information from executive interviews confirmed this. Therefore, transaction-based and relationship-based SCM should not be separately introduced. They should be implemented together to accomplish excellent SP leading to sustainable competitiveness along supply chains. Collaboration between the supply chain members is fundamental for LSCM to achieve its full benefits [85]. Therefore, supply chain members should invest time, financial, human, and other necessary resources and accept potential risks and opportunities emerging from their collaboration [86].
The distribution of the survey instrument was a convenience sampling. Random sampling should be encouraged in future research for more generalization of the results. Multiple responses from each company may also be applied by requesting more than one respondent per firm to answer the questionnaire so as to improve the reliability of the obtained data. A perceptual survey instrument which has limitations especially for operational performance measurement was used to collect data. Therefore, actual operational data may be collected in future research for more reliability. Though the hypotheses and measurement frameworks were comprehensively tested with various statistical techniques, future research based on the adaptation of these instruments in other developing countries, in specific industries and even in the service sector, should be carried out to confirm their general validity. Linkages among LM, SCR, and performance in various organizational contexts (e.g., company size, position in supply chain) should be further investigated and confirmed. The impact of individual LM practice on either customer relationship management or supplier relationship management, and on individual SP element should be studied too.

Funding

This research was funded by Faculty of Engineering, Mahidol University.

Acknowledgments

The author would like to thank the editor and anonymous referees for their constructive reviews and thank Graham K. Rogers and Parinya Siriattakul for their language editing and valuable comments.

Conflicts of Interest

The authors declare no conflict of interest.

Appendix A

Table A1. Measurement instrument.
Lean Manufacturing (LM)
Production (PDT)
PDT1Your company produces goods in quantities equal to customer orders.
PDT2Your company plans production to finish on delivery date.
PDT3Your company reduces production lot size although there are more machine setups.
PDT4Your company levels production quantity.
Purchasing and Distribution (PUD)
PUD1Your company orders raw material in required quantity.
PUD2Your company strictly evaluates supplier performance.
PUD3Your company reduces production and delivery lead time.
PUD4 *Your company ships goods to customers in small lot sizes but often.
Facility (FAC)
FAC1Your company reduces machine setup time.
FAC2Your company has effective machine maintenance with employees’ participation.
FAC3Your machine has warnings or automatic stopping systems for error prevention.
FAC4Your company has effective 5S activity using signboards, symbols for communication.
FAC5Your company has appropriate shop floor layout.
Quality (QUL)
QUL1Your company has clear standard operational procedure.
QUL2Your company has quality assurance in every process.
QUL3Your company has activities for waste reduction and continuous improvement.
QUL4Your company trains and develops employees to have multi-skills.
Supply Chain Relationship (SCR)
Supplier Collaboration (SCL)
SCL1Your company and suppliers have working team that works together in improvement projects.
SCL2Your company and suppliers share resources (e.g., database, IT network, equipment).
SCL3Your company and suppliers share costs and mutual benefits from joint improvement.
SCL4Your company and suppliers give importance to relationship development and trust.
SCL5Your company and suppliers work together in product design and marketing activities.
Supplier Coordination (SOR)
SOR1Your company and suppliers exchange important business information at strategic level.
SOR2Your company and suppliers coordinate and exchange information at operational level.
SOR3Your company and suppliers urgently inform each other when contingencies occur.
SOR4Your company and suppliers jointly resolve upfront problems or contingencies, effectively.
SOR5Your company and suppliers jointly forecast customer demand as well as plan production and sales.
Customer Collaboration (CCL)
CCL1Your company and customers have working team that works together in improvement projects.
CCL2Your company and customers share resources (e.g., database, IT network, equipment).
CCL 3Your company and customers share costs and mutual benefits from joint improvement.
CCL4Your company and customers give importance to relationship development and trust.
CCL5Your company and customers work together in product design and marketing activities.
Customer Coordination (COR)
COR1Your company and customers exchange important business information at strategic level.
COR2Your company and customers coordinate and exchange information at operational level.
COR3Your company and customers urgently inform each other when contingencies occur.
COR4Your company and customers jointly resolve upfront problems or contingencies, effectively.
COR5Your company and customers jointly forecast customer demand as well as plan production and sales.
Supply Performance (SP)
Cost (CT)
CT1Your company has good overall financial performance.
CT2Your company has good inventory management performance.
CT3Your company has production and working system with minimized wastes.
CT4Your company has good cost reduction and control.
Flexibility (FL)
FL1Your company can produce goods with various specifications.
FL2Your company can adjust production plan or volume quickly according to customer demand.
FL3Your company can launch new products to market quickly.
FL4Production schedule adjustment is not complicated for your company.
Relationship (RL)
RL1Your suppliers have good overall performance.
RL2Your suppliers give good cooperation when there are contingencies or special requests.
RL3Your company has good relationships with suppliers.
RL4Your company has good relationships with customers.
RL5Your customers give good cooperation when there are contingencies or special requests.
Responsiveness (RS)
RS1Your company has good overall delivery performance.
RS2Your company has good overall product and service quality.
RS3Your company can give order information and order status to customers quickly.
RS4Your company can solve problems for customers quickly and effectively.
RS5Your customers are satisfied with your company overall.
* Removed item from the final questionnaire.

References

  1. Cox, A. Power, value and supply chain management. Supply Chain Manag. Int. J. 1999, 4, 167–175. [Google Scholar] [CrossRef]
  2. Nicholas, J.M. Competitive Manufacturing Management: Continuous Improvement Lean Production Customer-Focused Quality, International ed.; McGraw-Hill: Singapore, 1998. [Google Scholar]
  3. Emiliani, M.L. Origins of lean management in America: The role of Connecticut businesses. J. Manag. Hist. 2006, 12, 167–184. [Google Scholar] [CrossRef]
  4. Bhuiyan, N.; Baghel, A. An overview of continuous improvement: From the past to the present. Manag. Decis. 2005, 45, 761–771. [Google Scholar] [CrossRef]
  5. Kannan, V.R.; Tan, K.C. Just in time, total quality management, and supply chain management: Understanding their linkages and impact on business performance. Omega 2005, 33, 153–162. [Google Scholar] [CrossRef]
  6. Tan, K.C.; Kannan, V.R.; Jayaram, J.; Narasimhan, R. Acquisition of operations capability: A model and test across US and European firms. Int. J. Prod. Res. 2004, 42, 833–851. [Google Scholar] [CrossRef] [Green Version]
  7. Tan, K.C. A framework of supply chain management literature. Eur. J. Purch. Supply Manag. 2001, 7, 39–48. [Google Scholar] [CrossRef]
  8. Gimenez, C. Supply chain management implementation in the Spanish grocery sector: An exploratory study. Int. J. Integr. Supply Manag. 2004, 1, 98–114. [Google Scholar] [CrossRef]
  9. Narasimhan, R.; Kim, S.W.; Tan, K.C. An empirical investigation of supply chain strategy typologies and relationships to performance. Int. J. Prod. Res. 2008, 46, 5231–5259. [Google Scholar] [CrossRef]
  10. Scannell, T.V.; Vickery, S.K.; Droge, C.L. Upstream supply chain management and competitive performance in the automotive supply industry. J. Bus. Logist. 2000, 21, 23–48. [Google Scholar]
  11. Vanichchinchai, A.; Igel, B. The impact of total quality management on supply chain management and firm’s supply performance. Int. J. Prod. Res. 2011, 49, 3405–3424. [Google Scholar] [CrossRef]
  12. Vanichchinchai, A.; Igel, B. Total quality management and supply chain management: Similarities and differences. TQM J. 2009, 21, 249–260. [Google Scholar] [CrossRef]
  13. Vanichchinchai, A. A categorization of quality management and supply chain management frameworks. Cogent Bus. Manag. 2019, 6, 1647594. [Google Scholar]
  14. Flynn, B.B.; Huo, B.; Zhao, X. The impact of supply chain integration on performance: A contingency and configuration approach. J. Oper. Manag. 2010, 28, 58–71. [Google Scholar] [CrossRef]
  15. Tasdemir, C.; Gazo, R. A systematic literature review for better understanding of lean driven sustainability. Sustainability. 2018, 10, 2544. [Google Scholar] [CrossRef]
  16. Madsen, D.; Berg, T.; Stenheim, T.; Moum, J.V.; Bordewich, I.O.; Maria Storsveen, M. The long-term sustainability of lean as a management practice: Survey evidence on diffusion and use of the concept in Norway in the period 2015–2017. Sustainability 2019, 11, 3120. [Google Scholar] [CrossRef]
  17. Masoumi, S.M.; Kazemi, N.; Abdul-Rashid, S.H. Sustainable supply chain management in the automotive industry: A process-oriented review. Sustainability. 2019, 11, 3945. [Google Scholar] [CrossRef]
  18. Lee, D. Implementation of collaborative activities for sustainable supply chain innovation: An analysis of the firm size effect. Sustainability. 2019, 11, 3026. [Google Scholar] [CrossRef]
  19. Wu, L.; Subramanian, N.; Abdulrahman, M.D.; Liu, C.; Lai, K.; Pawar, K.S. The impact of integrated practices of lean, green, and social management systems on firm sustainability performance—Evidence from Chinese fashion auto-parts suppliers. Sustainability. 2015, 7, 3838–3858. [Google Scholar] [CrossRef]
  20. Slone, R.E.; Dittman, J.P.; Mentzer, J.T. The New Supply Chain Agenda: The Five Steps that Drive Real Value; Harvard Business Press: Boston, MA, USA, 2010. [Google Scholar]
  21. Hu, Q.; Mason, R.; Williams, S.J.; Found, P. Lean implementation within SMEs: A literature review. J. Manuf. Technol. Manag. 2015, 26, 980–1012. [Google Scholar] [CrossRef]
  22. Wilson, M.M.J.; Roy, R.N. Enabling lean procurement: A consolidation model for small-and medium-sized enterprises. J. Manuf. Technol. Manag. 2009, 20, 817–833. [Google Scholar] [CrossRef]
  23. Daugherty, P.J. Review of logistics and supply chain relationship literature and suggested research agenda. Int. J. Phys. Distrib. Logist. Manag. 2011, 41, 16–31. [Google Scholar] [CrossRef]
  24. Jayaram, J.; Kannan, V.R.; Tan, K.C. Influence of initiator on supply chain value creation. Int. J. Prod. Res. 2004, 42, 4377–4399. [Google Scholar] [CrossRef]
  25. Mentzer, J.T.; Foggin, J.H.; Golicic, S.L. Collaboration: The enablers, impediments, benefits. Supply Chain Manag. Rev. 2000, 4, 52–58. [Google Scholar]
  26. Chen, I.S.N.; Fung, P.K.O. Relationship configurations in the apparel supply chain. J. Bus. Ind. Mark. 2013, 28, 303–316. [Google Scholar] [CrossRef]
  27. Gueimonde-Canto, A.; Gonzalez-Benito, J.; Garcia-Vazquez, J.M. Competitive effects of co-operation with suppliers and buyers in the sawmill industry. J. Bus. Ind. Mark. 2011, 26, 58–69. [Google Scholar] [CrossRef]
  28. Masson, R.; Iosif, L.; MacKerron, G.; Fernie, J. Managing complexity in global fashion industry supply chains. Int. J. Logist. Manag. 2007, 18, 238–254. [Google Scholar] [CrossRef]
  29. Vanichchinchai, A. Supply chain management, supply performance and total quality management: An Organizational Characteristics Analysis. Int. J. Organ. Anal. 2014, 22, 126–148. [Google Scholar] [CrossRef]
  30. Li, S.; Ragu-Nathan, B.; Ragu-Nathan, T.S.; Rao, S.S. The impact of supply chain management practices on competitive advantage and organizational performance. Omega 2006, 34, 107–124. [Google Scholar] [CrossRef]
  31. Shub, A.N.; Stonebraker, P.W. The human impact on supply chains: Evaluating the importance of soft areas on integration and performance. Supply Chain Manag. Int. J. 2009, 14, 31–40. [Google Scholar] [CrossRef]
  32. Tortorella, G.L.; Miorando, R.; Marodin, G. Lean supply chain management: Empirical research on practices, contexts and performance. Int. J. Prod. Econ. 2017, 193, 98–112. [Google Scholar] [CrossRef]
  33. Jasti, N.; Kodali, R. A critical review of lean supply chain management frameworks: Proposed framework. Prod. Plan. Control 2015, 26, 1051–1068. [Google Scholar] [CrossRef]
  34. Anand, G.; Kodali, R. A conceptual framework for lean supply chain and its implementation. Int. J. Value Chain Manag. 2008, 3, 313–357. [Google Scholar] [CrossRef]
  35. Kisperska-Moron, D.; De Haan, J. Improving supply chain performance to satisfy final customers: “Leagile” experiences of a Polish distributor. Int. J. Prod. Econ. 2011, 133, 127–134. [Google Scholar] [CrossRef]
  36. McIvor, R. Lean supply: The design and cost reduction dimensions. Eur. J. Purch. Supply Manag. 2001, 7, 227–242. [Google Scholar] [CrossRef]
  37. Perez, C.; Castro, R.; Simons, D.; Gimenez, G. Development of lean supply chains: A case study of the Catalan pork sector. Supply Chain Manag. Int. J. 2010, 15, 55–68. [Google Scholar] [CrossRef]
  38. Wee, H.; Wu, S. Lean supply chain and its effect on product cost and quality: A case study on Ford Motor company. Supply Chain Manag. Int. J. 2009, 14, 335–341. [Google Scholar] [CrossRef]
  39. Croom, S.; Romano, P.; Giannakis, M. Supply chain management: An analytical framework for critical literature review. Eur. J. Purch. Supply Manag. 2000, 6, 67–83. [Google Scholar] [CrossRef]
  40. Tan, K.C.; Lyman, S.B.; Wisner, J.D. Supply chain management: A strategic perspective. Int. J. Oper. Product. Manag. 2002, 22, 614–631. [Google Scholar]
  41. Talib, F.; Rahman, Z.; Qureshi, M.N. A study of total quality management and supply chain management practices. Int. J. Product. Perform. Manag. 2011, 60, 268–288. [Google Scholar] [CrossRef]
  42. Krafcik, J.F. Triumph of the lean production system. Sloan Manag. Rev. 1988, 30, 41–52. [Google Scholar]
  43. Womack, J.P.; Jones, D.T.; Ross, D. The Machine that Changed the World; Macmillan: New York, NY, USA, 1990. [Google Scholar]
  44. Womack, J.P.; Jones, D.T. Lean Thinking; Simon & Schuster: New York, NY, USA, 1996. [Google Scholar]
  45. Hines, P.; Holweg, M.N.; Rich, N. Learning to evolve: A literature review of contemporary lean thinking. Int. J. Oper. Product. Manag. 2004, 24, 994–1011. [Google Scholar] [CrossRef]
  46. Taylor, D. Strategic considerations in the development of lean agri-food supply chains: A case study of the UK pork sector. Supply Chain Manag. Int. J. 2006, 11, 271–280. [Google Scholar] [CrossRef]
  47. Cudney, E.; Elrod, C. Incorporating lean concepts into supply chain management. Int. J. Six Sigma Compet. Advant. 2010, 6, 12–30. [Google Scholar] [CrossRef]
  48. Shah, R.; Ward, P.T. Defining and developing measures of lean production. J. Oper. Manag. 2007, 25, 785–805. [Google Scholar] [CrossRef]
  49. Yusuf, Y.; Gunasekaran, A.; Adeleye, E.; Sivayoganathan, K. Agile supply chain capabilities: Determinants of competitive objectives. Eur. J. Oper. Res. 2004, 159, 379–392. [Google Scholar] [CrossRef]
  50. Agarwal, A.; Shankar, R.; Tiwari, M. Modeling the metrics of lean, agile and leagile supply chain: An ANP based approach. Eur. J. Oper. Res. 2006, 173, 211–225. [Google Scholar] [CrossRef]
  51. Hajmohammad, S.; Vachon, S.; Klassen, R.D.; Gavronski, I. Lean management and supply management: Their role in green practices and performance. J. Clean. Prod. 2013, 39, 312–320. [Google Scholar] [CrossRef]
  52. Hajmohammad, S.; Vachon, S.; Klassen, R.D.; Gavronski, I. Reprint of lean management and supply management: Their role in green practices and performance. J. Clean. Prod. 2013, 56, 86–93. [Google Scholar] [CrossRef]
  53. Martinez-Jurado, P.J.; Moyano-Fuentes, J. Lean management, supply chain management and sustainability: A literature review. J. Clean. Prod. 2014, 85, 134–150. [Google Scholar] [CrossRef]
  54. Cagliano, R.; Caniato, F.; Spina, G. The linkage between supply chain integration and manufacturing improvement programmes. Int. J. Oper. Product. Manag. 2006, 26, 282–299. [Google Scholar] [CrossRef]
  55. Naim, M.M.; Gosling, J. On leanness, agility and leagile supply chains. Int. J. Prod. Econ. 2011, 131, 342–354. [Google Scholar] [CrossRef]
  56. Lamming, R. Squaring lean supply with supply chain management. Int. J. Oper. Product. Manag. 1996, 16, 183–196. [Google Scholar] [CrossRef]
  57. Mollenkopf, D.; Wendy, H.S.; Tate, L.; Ueltschy, M. Green, lean, and global supply chain. Int. J. Phys. Distrib. Logist. Manag. 2010, 40, 14–41. [Google Scholar] [CrossRef]
  58. Vanichchinchai, A. Exploring organizational contexts on lean manufacturing and supply chain relationship. J. Manuf. Technol. Manag. 2019, (in press). [Google Scholar] [CrossRef]
  59. Rajamma, R.K.; Zolfagharian, M.A.; Pelton, L.E. Dimensions and outcomes of B2B exchange: A meta analysis. J. Bus. Ind. Mark. 2011, 26, 104–114. [Google Scholar] [CrossRef]
  60. Heide, J.B.; John, G. Do norms matter in marketing relationships? J. Mark. 1992, 56, 32–44. [Google Scholar] [CrossRef]
  61. Gronroos, C. The marketing strategy continuum: Toward a marketing concept for the 1990s. Manag. Decis. 1991, 29, 7–13. [Google Scholar] [CrossRef]
  62. Day, G.S. Managing market relationships. J. Acad. Mark. Sci. 2000, 28, 24–30. [Google Scholar] [CrossRef]
  63. Dwyer, F.R.; Schurr, P.H.; Oh, S. Developing buyer-seller relationships. J. Mark. 1987, 51, 11–27. [Google Scholar] [CrossRef]
  64. Bowersox, D.J.; Daugherty, P.J.; Droge, C.L.; Germain, R.N.; Rogers, D.S. Logistical Excellence: It’s Not Business as Usual; Digital Press: Burlington, MA, USA, 1992. [Google Scholar]
  65. Golicic, S.L.; Mentzer, J.T. An empirical examination of relationship magnitude. J. Bus. Logist. 2006, 27, 81–108. [Google Scholar] [CrossRef]
  66. Rinehart, L.M.; Eckert, J.A.; Handfield, R.B.; Page, T.J., Jr.; Atkin, T. An assessment of supplier-customer relationships. J. Bus. Logist. 2004, 25, 25–61. [Google Scholar] [CrossRef]
  67. Bhamu, J.; Sangwan, K.S. Lean manufacturing: Literature review and research issues. Int. J. Oper. Product. Manag. 2014, 34, 876–940. [Google Scholar] [CrossRef]
  68. Herzog, N.V.; Tonchia, S. An instrument for measuring the degree of lean implementation in manufacturing. J. Mech. Eng. 2014, 60, 797–803. [Google Scholar] [CrossRef]
  69. Zahraee, S.M. A survey on lean manufacturing implementation in a selected manufacturing industry in Iran. Int. J. Lean Six Sigma 2016, 7, 136–148. [Google Scholar] [CrossRef]
  70. Shrafat, F.D.; Ismail, M. Structural equation modeling of lean manufacturing practices in a developing country context. J. Manuf. Technol. Manag. 2019, 30, 122–145. [Google Scholar] [CrossRef]
  71. Chavez, R.; Gimenez, C.; Fynes, B.; Wiengarten, F.; Yu, W. Internal lean practices and operational performance: The contingency perspective of industry clockspeed. Int. J. Oper. Product. Manag. 2013, 33, 562–588. [Google Scholar] [CrossRef]
  72. Nawanir, G.; Teong, L.K.; Othman, S.N. Impact of lean practices on operations performance and business performance: Some evidence from Indonesian manufacturing companies. J. Manuf. Technol. Manag. 2013, 24, 1019–1050. [Google Scholar] [CrossRef]
  73. Mills, J.; Schmitz, J.; Frizelle, G. A strategic review of supply networks. Int. J. Oper. Product. Manag. 2004, 24, 1012–1036. [Google Scholar] [CrossRef]
  74. Narayandas, D.; Rangan, V.K. Building and sustaining buyer-seller relationships in mature industrial markets. J. Mark. 2004, 68, 63–77. [Google Scholar] [CrossRef]
  75. Lee, C.W.; Kwon, G.I.; Severance, D. Relationship between supply chain performance and degree of linkage among supplier, internal integration, and customer. Supply Chain Manag. Int. J. 2007, 12, 444–452. [Google Scholar]
  76. Hair, J.F.; Anderson, R.E.; Tatham, R.L.; Black, W.C. Multivariate Data Analysis, 4th ed.; Prentice-Hall International Inc: Upper Saddle River, NJ, USA, 1998. [Google Scholar]
  77. Nunnally, J.; Burnstein, I.H. Pschychometric Theory, 3rd ed.; McGraw-Hill: New York, NY, USA, 1994. [Google Scholar]
  78. Netemeyer, R.G.; Johnston, M.W.; Burton, S. Analysis of role conflict and role ambiguity in a structural equations framework. J. Applied Psychol. 1990, 75, 148–157. [Google Scholar] [CrossRef]
  79. Shook, C.L.; Ketchen, D.J.; Hult, G.T.; Kacmar, K.M. An assessment of the use of structural equation modeling in strategic management research. Strateg. Manag. J. 2004, 25, 397–404. [Google Scholar] [CrossRef]
  80. Anderson, J.C.; Gerbing, D.W. Structural equation modeling in practice: A review and recommended two-step approach. Psychol. Bull. 1988, 103, 411–423. [Google Scholar] [CrossRef]
  81. Steiger, J.H. Structural model evaluation and modification: An interval estimation approach. Multivar. Behav. Res. 1990, 25, 173–180. [Google Scholar] [CrossRef] [PubMed]
  82. Groves, G.; Valsamakis, V. Supplier-customer relationships and company performance. Int. J. Logist. Manag. 1998, 9, 51–64. [Google Scholar] [CrossRef]
  83. Droge, C.; Germain, R. The relationship of electronic data interchange with inventory and financial performance. J. Bus. Logist. 2000, 21, 209–230. [Google Scholar]
  84. Corsten, D.; Felde, J. Exploring the performance effects of key-supplier collaboration: An empirical investigation into Swiss buyer-seller relationships. Int. J. Phys. Distrib. Logist. Manag. 2005, 35, 445–461. [Google Scholar] [CrossRef]
  85. Cox, A.; Chicksand, D.; Palmer, M. Stairways to heaven or treadmills to oblivion? Creating sustainable strategies in red meat supply chains. Br. Food J. 2007, 109, 689–720. [Google Scholar] [CrossRef]
  86. Tapping, D.; Shuker, T. Value Stream Management: Eight Steps to Planning, Mapping, and Sustaining Lean Improvements; Productivity Press: New York, NY, USA, 2002. [Google Scholar]
Figure 1. Hypothesized model.
Sustainability 11 05751 g001
Table 1. Respondents’ profiles.
CharacteristicNumber of CompaniesPercentage (%) *
Position
Managing director5312.21%
Director (or equivalent)10423.96%
Manager (or equivalent)27763.82%
Missing82
Major shareholder
Thai42182.23%
Japanese468.98%
Other nationality458.79%
Missing4
Company size
Small (<50 employees)29557.17%
Medium (50–200 employees)11422.09%
Large (>200 employees)10720.74%
* Excluding missing data.
Table 2. Non-respondent bias test.
CharacteristicNon-ResponseResponsedfChi-SquareP Value
Thai26(68.4%)421(82.2%)24.9650.084
Japan5(13.2%)46(9.0%)
Other7(18.4%)45(8.8%)
Large11(28.9%)107(20.7%)21.7920.408
Medium6(15.8%)114(22.1%)
Small21(55.3%)295(57.2%)
Table 3. Reliability and multiple fit indexes of sub-constructs.
Sub-ConstructNo. of ItemsCronbach’s AlphaComposite ReliabilityAverage Variance Extracted χ 2 / d f p-ValueGFICFINNFISRMRRMSEAIFIAGFI
Lean manufacturing
Production40.7200.7230.4080.2400.6241.0001.0001.0000.00530.0001.0000.998
Purchasing and distribution30.7130.7150.4062.8360.0920.9960.9920.9760.01980.0600.9920.978
Facility50.8470.8390.5171.8000.1650.9970.9990.9930.01190.0390.9990.979
Quality40.8840.7760.6541.8490.1740.9980.9990.9960.00680.0410.9990.982
Supply chain relationship
Supplier collaboration50.8860.8730.5861.6430.1930.9970.9990.9960.00590.0350.9990.981
Supplier coordination50.8630.8640.5601.5590.1970.9960.9990.9950.01020.0330.9990.982
Customer collaboration50.8580.8870.6131.7830.1820.9990.9990.9940.00810.0390.9990.979
Customer coordination50.9100.9080.6662.5610.0530.9970.9970.9910.00960.0550.9970.971
Supply performance
Cost40.8620.8550.6010.4870.4851.0001.0001.0000.00320.0001.0000.995
Flexibility40.8130.8140.5280.2000.6541.0001.0001.0000.00300.0001.0001.000
Relationship50.8910.8750.5862.0350.1310.9970.9990.9930.00930.0450.9990.976
Responsiveness50.9230.9200.6982.1060.0970.9950.9980.9940.00880.0460.9980.977
GFI = Goodness of fit index
CFI = Comparative fit index
NNFI = Non-normed fit index
SRMR = Standardized root mean squared residual
RMSEA = Root mean square error of approximation
IFI = Incremental fit index
AGFI = Adjusted goodness of fit index
Table 4. Secondary-order confirmatory factor analysis.
Second-Order ConstructSub-ConstructStandardized Estimatet-Value
Lean manufacturingProduction0.1773.441
Purchasing and distribution0.7908.600
Facility0.90111.073
Quality *0.930
Supply chain relationshipSupplier collaboration 0.74314.441
Supplier coordination0.70513.453
Customer collaboration *0.959
Customer coordination0.76215.801
Supply performanceCost0.79212.056
Flexibility *0.676
Relationship0.92012.167
Responsiveness0.89213.348
* The parameter is set to 1 (unstandardized) to fix the scale of measurement.
Table 5. Multiple fit indexes of the second-order construct.
Second-Order Construct χ 2 / d f P-ValueGFICFINNFISRMR
Lean manufacturing0.9880.5050.9841.0001.0000.0276
Supply chain relationship1.1740.1220.9850.9990.9980.0267
Supply performance1.2390.0630.9780.9970.9940.0235
Table 6. The effect of lean manufacturing (LM) on supply chain relationship (SCR) and supply performance (SP).
PathTotal EffectDirect EffectIndirect Effect
LM → SCR0.636 (4.517)0.636 (4.517)
LM → SP0.755 *0.643 (4.559)0.111 *
SCR → SP0.175 (4.091)0.175 (4.091)
* The parameter is set to 1 (unstandardized) to fix the scale of model.

